Embed Size (px)
Citation preview
Complementary break-even point with economic value added.
López Avila, César Omar1 Universidad Autónoma de Occidente
Pontet Ubal, Norma2 Universidad ORT
Agosto 2020
Abstract This study was aimed at proposing a complementarity accounting–financial model from the potentialities of the Break-Even Point formulation of the variable or marginal direct cost system with the economic value added model. A financial planning tool is coordinated, which, in so doing, is proposed as an instrument to validate the financial information that will allow the observation of maintenance of the financial total equity from the conceptual framework of International Financial Reporting Standards. Through a qualitative, exploratory and descriptive investigation using the inductive method, this study conducts a critical review of the model formulations for contrast and subsequent conformation of the model that complements the break-even point with the Economic Value Added based on the Net Operating Profit After Taxes, Capital asset pricing model, Weighted Average Cost of Capital and Return On Invested Capital. The result corroborates the starting hypothesis so that it can be concluded that the proposed complementarity structure is met and that complementing the Break-Even point with the economic value added in short- and medium-term budgets contributes to sustainable competitive strategic planning, demonstrating that the true break-even point is reached at the inflection point where the business is capable of producing a return that is higher than the weighted average cost of capital.
Key words: EVA; WACC; Break-Even point; ROIC; Variable Direct Cost, IFRS JEL: G12, G17, G31, G32; M20, M21, M40, M41.
Documento de Investigación, Nro.121, Agosto 2020. Universidad ORT Uruguay. Facultad de Administración y Ciencias Sociales. ISSN 1688-6275.
1Corresponding Author at: Department of Administration and Finance, Universidad Autónoma de Occidente; César Omar López Avila; Tel (57).3154962153; Calle 12 No. 125-17 house 1; Cali, Colombia; email [email protected] 2 Dra. Norma Pontet Ubal, Coordinadora Académica Postgrados en Finanzas, Facultad de Administración y Ciencias Sociales, Universidad ORT Uruguay, email: [email protected]
Universidad ORT Uruguay 2
1 INTRODUCTION
In this study, we present the result of an investigation that wanted to test the hypothesis of making viable the complementarity between the break-even point model of the variable or marginal direct cost system—Cost Volume Utility (CVU)—and the Economic Value Added (EVA), the result of which creates a mathematical–accounting and financial model (CVUEVA) that is organised as a financial planning tool to help managers achieve competitive advantages as a result from the planned increase in the financial capital of organisations (Stewart 2000; Horngren et al 2007; Perevozchikov; Lesik 2015; IASB 2019).
Having a financial tool that helps to plan strategic value creation, effectively complemented by using the break-even point of the variable or marginal direct cost system, is essential as a timely response to the need for organisation profitability, and it contributes to the theories that affirm that companies that use financial planning are more profitable and are more likely to maintain and increase total equity. (ISB 2019; Boyd 1991; Bracker and Pearson 1986; Grozdanovska, Bojkovska, and Jankulovski 2017).
Complementing the CVU model with the EVA allows for a more efficient allocation of resources, which shows the cost incurred, the number of units to be sold, the taxes to be paid on them, the creation of value to be planned while achieving financial stability and capital growth. Therefore, this document proposes a mathematical–accounting–financial model that integrates accounting management tools with financial tools. The EVA, which is just the operating profit minus the financial cost of all the capital used IC (current and non-current assets) to produce profit (Stewart 2000; Labatut 2015; Kyriazis and Anastassis 2007), to achieve which, it is necessary to consider the following: a) the taxes that would be paid for any profit obtained and taxes that are expressed in an imposed tax (tax rate); b) the Weighted Average Cost of Capital (WACC) to be used as an instrument to measure the financial cost of CI; and c) the Return On Invested Capital (ROIC).
The research presented here is based on the need to create a model that complements the strategic management of value creation with the strategic management of direct cost because in this study, it is demonstrated that these models develop themes that are complementary and that integrally, they have not been studied sufficiently. Thus, as the variable cost break-even point model does not consider the financial cost of the resources used in its structure when approaching the break-even point, while the EVA value creation model uses the WACC to find out the financial cost of the resources used, but it suffers from price analysis—the cost and the contribution margin of the products (or mix of products) that the organisation must sell in the market for it to be right to be its operational activity.
On the other hand, the Conceptual Framework of the International Financial Reporting Standards (IFRS), in its chapter—Concept of Capital and Capital Maintenance—in force since 1989 (IASB, 2019), warns that it is necessary for organisations to adopt the concept of financial capital or operating capital to inform users of financial information about their increase or decrease in order for users to make appropriate financial decisions. Therefore, this work of research proposes the developed model.
Universidad ORT Uruguay 3
The “CVUEVA” model is useful because when used in strategic financial planning, the integrated model can identify and define the variables that affect the creation of value more clearly and identify the true balance of the organisations’ operational activity more precisely while at the same time establishing more reliable utility and value creation goals.
Thus, the proposed model helps organisation managers make better administrative and financial decisions; preparers of financial information to meet the requirements of the capital maintenance concept of the IFRS TF in their financial statements and the users of financial information to make decisions.
Using the integrative model in financial planning, organisations will benefit at the first instance because enough information will be obtained on the integrated value creation variables and options that are to be implemented in their operational activity (through the simulation of possible scenarios). Of course, the users of the financial information also will be able to judge the management carried out with the assigned resources. Furthermore, the academic and empirical acceptance of the model developed benefits organisations, especially medium- and small-sized enterprises (SMEs), which, in many cases, are at the detriment of the tools that help them to perform their management optimally. Once the model has been developed, sustainable competitive benefits and advantages are achieved because its formulation is planned and generated at the heart of operational activities and also because the costs of the economic resources used are considered through the WACC. It is remembered that for administrators, the question is not about the reason for which we have to generate value but the manner in which we can create value (Copeland et al, p 123 2004); the proposed model provides a tool that helps solve the manner in which it is done. In the research work, the mathematical formulation of the break-even point is developed by coordinating its result with taxes with the objective of achieving the Net operating profit less adjusted taxes (NOPLAT), or the necessary operational utility, to produce a return on invested resources that covers the WACC as well as providing the percentage of (EVA) that is expected. All this must be performed without losing sight of the fact that the income drivers of these are always the products (or mix of products) that are needed to produce and sell at a feasible sale price.
The model proposed when integrating accounting information and financial CVUEVA information is a simple and efficient mathematical model. It is an innovation that will help bring about a better conception of the break-even point by including the cost of the resources used in operational activity to improve financial planning through the EVA and by proposing a methodology to provide information on the maintenance of financial capital to users of financial information.
The results of the application of the CVUEVA model can be generalised to the different types of organisations (with or without profit; small and large organisations) in a way such that its use supports the theory of financial planning and results are improved.
The first part of this work is an analytical study of the developed model’s components, that is, the break-even point model, the EVA, the WACC and the ROIC. Later, the mathematical model that is developed by coordinating mathematical expressions is described. Then, an
Documento de Investigación - ISSN 1688-6275 - Nº 121 - 2020 - López Avila, C. O.; Pontet Ubal, N.
Universidad ORT Uruguay 4
example of the simulation demonstrating the formulation is shown. Last, we refer to the main advantages that the model brings. The rest of the study proceeds as follows. Section 2 presents the research design considered in this study and the joint analysis. Section 3 discusses the study results through the development of algebraic expressions. Section 4 concludes the document. 2. RESEARCH DESIGN The following section presents the formulations and the most relevant aspects of the expressions that should be used to structure the complementarity of the proposed topics to be clear about the variables that can be simulated in the planning through the proposed formulation. First, the formulation of the breaking-point, its benefits, and its limitations will be presented, and subsequently, the same procedure will be carried out with the expressions associated with the EVA; then, the proposed complementarity is finished with. The methodology used for the proposed integrating model’s construction falls within descriptive and exploratory research. Activities are performed throughout its development, involving one, two or all of the mentioned components (formulations) because a critical analysis was carried out with respect to the subject of the investigation. By assuming the breaking-point methodology and connecting it with the EVA methodology, we endeavour to discover in detail the function of the variables with the highest prevalence and incidence, both from the breaking-point perspective and from the EVA perspective, and they will start interacting with each other to find the best viable mathematical formulation. The hypotheses are validated so that the proposed methodologies can integrate with one another and generate a new CVUEVA model that obtains satisfactory results both from a theoretical perspective as well as a practical one. To make its structure clearer, we will analyse and describe its elements. 2. 1. THE BREAK-EVEN POINT The theory of cost systems in terms of the break-even point shows that it provides guidelines for management of decision making and helps select better production processes. Therefore, managers need to know in advance whether a product, a new product or a new company will generate return and at the level of activity at which return begins. (Ramírez 2019; Horngren et al 2007; Garrison et al 2007; Hansen et al 2003). Hence, possessing this integrated tool to solve it constitutes a competitive advantage.
In economic–financial analysis, the break-even point has been a constant concern when determining its role in analysing the profitability of organisations. The classic approach to the break-even point is that spending and income are developed linearly and that the break-even point is determined by the lines of expenditure. Any positive deviation, such as an increase in the volume of activity, is a profit; on the other hand, any loss at this point is a
Universidad ORT Uruguay 5
loss. This approach is addressed in almost all specialised works because it is simple and understandable (Buşe 2005; Vâlceanu, Robu, and Georgescu 2005; Burja 2008; Petcu 2009). A hypothesis on the lack of linearity between income and cost is another approach to the break-even point. The basis of this approach arises in Jaedicke and Robichek (1964), cited by Horngren et al. (2007). The result is more accurate, and its forecasting capacity is greater.
The relevance of the break-even point is unanimously recognised as the starting point of a company's profitability. Stancu (2006) suggested a financial equilibrium model on the basis of the net present value indicator (NPV) as a minimum return, which must be achieved to preserve the wealth of shareholders.
For Ofileanu and Bumbescu (2014), the use of the break-even point was extended to reflect the economic risk of organisations upon evaluating the operational risk and considering an index that the volume of activity should achieve in order to reach break-even point as a contribution margin (in absolute value) or as a coefficient (relatively speaking). The break-even point can be calculated at the product level or at the organisation level (Păvăloaie et al., 2010). The break-even point at product level is calculated on the basis of the combination of products in question. Similarly, at organisation level, it is calculated on the level of turnover. The break-even point means analysing a map of activities with different combinations and / or perspectives, each one with its own advantages. Using a simple analysis, the easiest and most understandable approach is the product’s break-even point.
The variable costing philosophy is that only the cost of the product should be charged, i.e. the cost of those that were consumed because of a decision being made to produce and sell and would not have been consumed otherwise. To the extent that fixed costs are costs that are necessarily incurred, regardless of the volume of production and sales, they, in theory, do not constitute a cost derived from the decision to produce. (Ramírez 2019; Horngren et al 2007; Garrison et al 2007; Hansen et al 2003). The incremental expenditure derived from producing, selling and distributing a new article is constituted exclusively by the amount of variable costs that that article includes. Fixed costs are a constant cost that the company must bear regardless of how much it produces and sells, and they constitute, according to the supporters of variable costing, a loss that must be charged to the fiscal year in which they were accrued regardless of what is produced or sold in that fiscal year. According to the interpretation made of the economic reality in variable costing, the only costs of the product are the variable costs; through variable costing, it is sought to determine the economic efforts that are really involved in a decision. When a production manager decides to produce one more unit, they will obviously have to face only the variable cost of that unit. However, if that company is operating to its absolute maximum capacity, the production of an additional unit will impose the need to increase its structure. This being the case, the entire increase in fixed costs derived from this increased structure will be part of the cost of that decision. Therefore, that additional unit must bear, in addition to its variable cost, all the fixed cost (which, in this case, would be directly from that unit) involved in implementing the new structure. Furthermore, in full costing, all factors associated with the production process are considered, regardless of their fixed or variable nature, despite the fact that there are factors
Documento de Investigación - ISSN 1688-6275 - Nº 121 - 2020 - López Avila, C. O.; Pontet Ubal, N.
Universidad ORT Uruguay 6
that depend directly on production and vary accordingly. Also, on the other hand, there are others that despite serving the process well are independent from the production volume and are associated rather with the existing capacity. It should be noted that the allocation of the aforementioned fixed costs to different product lines cannot be done objectively and that the allocation base used may be more or less appropriate but will always be subjective and arbitrary The use of computer tools allow for multiple award bases to be used, to try to objectify the layout of fixed costs to items of cost but never transforming fixed costs into variables.
If the essence of the cost in this subjective component introduced by the analyst is not correctly captured, it brings a lower approximation of the costs than reality, which results in difficulties in performing analysis or making decisions correctly. This is the case because the multiple bases being defined will have a subjective component, and therefore, if two different analysts are determining the bases, they could arrive at different bases and consequently at different unit costs (Ramírez 2019; Horngren et al 2007; Garrison et al 2007; Hansen et al 2003).
The principle on which variable costing is sustained is based not on considering fixed costs as product costs but as costs of the company as a whole. This undoubtedly eliminates these problems, and it is on this that the proposed model is structured (Sáez, Fernández, and Gutiérrez 1994; Polimeni and Fabozzi; Adelberg 1994; Hansen and Mowen 2003; Horngren et al. 2007; Garrison, Noreen, and Brewer 2007; Ramírez P 2019): first, because there is no need to proceed with one or multiple bases for the allocation of fixed costs, and second, because excluding the fixed costs eliminates the dependence of the cost, the production volume and sales.
This way, the analyst can immediately determine the contribution of each product, product line or market. In turn, the decision maker who is faced with the particular case of expanding its level of production, accepting a new order, replacing one product with another, or one market with another, or any other alternative, has the option of cost analysis as a tool suitable for determining its acceptance or rejection; that is to say, that decision can be made.
As well as being useful, it is relevant to consider that the tool is valid as long as the assumption that the increase in activity does not imply an increase in the level of fixed costs is met. In turn, it should be noted that determining exactly what the result of the increase in production will be, is not exclusive to variable costing. In full costing, after reformulating the income statement, the same conclusion is reached. The great advantage of variable costing is that the cost is structured in a way such that it provides information in an agile manner, and so, the decision can be made without the need to reformulate the unit costs due to variations in the volumes of production or sale.
COST-VOLUME-PROFIT
The cost-volume-profit CVU (Polimeni et al 1994; Hansen, et al 2003; Horngren et al., 2007; Garrison, et al 2007; Ramírez P 2019) examines the behaviour of total revenues, total
Universidad ORT Uruguay 7
costs and operating profit as changes occur in the level of production, while examining the unit sales price, the unit variable cost and the fixed cost of a product to identify the point at which the contribution margin is sufficient to cover fixed costs. At this point, one could say that this is the break-even point; however, so far, this model has only responded to accounting formulation, and therefore, it does not consider the WACC and certainly not the EVA. We can say, then, that the CVU model is a cost accounting model and that it connects to the EVA financial model to achieve better planning and a competitive advantage that is sustainable. Thus, the basic formulation of the break-even point (CVU) has helped us better understand the manufacturing costs of the line of a particular product. For Pontet-Ubal and Oliari (2014), the question that the break-even point answers is how are total revenues and total costs affected if the level of production changes (increases or decreases)? When the response is identified from the break-even analysis, business planning is simplified. The break-even point accounting formulation is as follows:
Income – DirectCost - FixedCost = 0
If returns are desired, then the formula would be as follows:
Income – DirectCost - FixedCost = Operational Result Where: Total income = sale price by quantity of units (Q) sold; Total variable cost = variable cost per quantity of units (Q) sold and Total fixed cost = fixed cost in the relevant range. Before continuing, the following caveat must be made. The CVU analysis is based on several hypotheses (Hansen 2003; Horngren et al 2007; Garrison, et al 2007; Ramírez P 2019) that introduce noise into the analysis: 1. Changes in income and cost levels are only due to changes in the number of product
(service) units produced and sold. The number of units produced is the only cause of income or the only cause of cost.
2. Total cost can be separated into two components: fixed costs that do not vary with the level of production (in the relevant range)3and variable components that change with respect to the level of production.
3. The sale price, the unit variable cost and the total costs are known and constant. 4. You can add, subtract and compare all income and costs (in a period) without
considering the cost of money over time. 3Relevant range is the band of activity or volume in which exists a specific relationship between the degree of activity or volume and the cost in question is validated. For example, a fixed cost is only fixed in relation to a certain range of activity or total volume and during a certain period (Horngren et al. 2007).
Documento de Investigación - ISSN 1688-6275 - Nº 121 - 2020 - López Avila, C. O.; Pontet Ubal, N.
Universidad ORT Uruguay 8
5. The analysis can cover a single product (or service) or assume that the sales mix will remain constant when multiple products are sold as the amount of total units sold varies.
6. The CVU analysis distinguishes between fixed costs and variable costs. However, it should be borne in mind that deciding on whether a cost is fixed or variable depends on the period. The smaller the time horizon the greater the percentage of total costs considered as fixed. Also, in this model, the following equation must be considered to know the profit:
After the proposed model construction, we have the following:
NOPAT = Operational Result * (1 - t)
with t being the country's tax rate If we integrate the shown formulas, we get the following:
(Income – DirectCost - FixedCost ) * (1 – t) = NOPAT On the other hand, to create value in organisations, you have to ask yourself questions such as those regarding the point at which to begin, the steps that need to be taken and the cost of resources. The answers to these questions lead us to profitability models and the cost of resources model. As the popular saying goes, "there is no such thing as a free lunch in capitalist economies"; that is to say, all resources have their cost. If you want to be profitable, the first thing you do is cover the cost of invested capital, and then, if possible, you create value. (Suarez 2014; Van Horne and Wachowicz 2010; Berk and Demarzo 2008). 2. 2. ECONOMIC ADDED VALUE Below the most notable elements of the EVA formulation are shown its components in the mathematical expression that will be used to structure the complementarity with the CVU, to be clear about all the variables that interact and allow simulations of possible scenarios in the planning processes. The concept of EVA is a variation or modification of what was traditionally known as “Income or residual profit”; that is to say, it is the result obtained by subtracting capital costs from operational profit. The idea of residual profit first appeared in accounting literature at the beginning of the 20th century. Church introduced it in 1917, and then, in 1924, Scovell cited residual profit (cited by Horngren et al. 2007); for 1960, he cited such a concept, and it is contemplated in management accounting literature. Ten years later, in the 1970s, Finnish academics discussed this issue, and in 1975, Virtanen defined it as the return on investment for management decision making (cited by Horngren 2007). In 1989, the consulting firm Stern Stewart & Co. based in New York, USA, reintroduced and registered EVA as its trademark. To create and quantify business value, there are several
Universidad ORT Uruguay 9
metrics; however, as previously mentioned, the most used are, among others, the EVA, the Market Value Added (MVA) and the discounted cash flow, among others. How is business value created? This question could be answered by saying that value is created when managers (of the company or business) do things right; that is to say, when actions are taken that give an economic return that is higher than the cost of the economic resources or capital used in the business activity. This point is addressed below.
1. Economic profitability is not equal to accounting profitability. Economic profitability is creating cash flow, which cannot be doctored by creative accounting; as long as accounting profitability relates to the accounting data (accounting profit/accounting resource ratio), it is seen as true economic performance (creating value in the business: money), while accounting profit is historical and is usually recorded in books.
2. The resources used to gain these flows come at an economic cost (WACC). 3. Value creation in business refers to future expectations, not to past or historical
references. 4. In relation to expectations, they must be well planned and grounded so that they are
realistic and attainable, which entails serious and deep commitment to be able to achieve the goals set, and they must establish follow-up mechanisms to quantify achievement and correct deviations.
5. When creating value, future reference is made This is always uncertain, so expected economic profitability is associated with a level of risk that must be controlled, known and assumed as much as possible.
6. Creating value is a fundamental part of the vision and the aim of the entire business organisation and not only those of a few employees.
When creating business value, the top managers need to be willing, the middle managers need to follow suit and other partners of the company need to be willing. In addition, its implementation must be convincing, deep-rooted, tight and carried out over time, to obtain future (long-term) economic returns. Trust is something intrinsic to business value, and in order to achieve this, strong long-term bonds with, among others, suppliers, customers, employees, social environment, ecological environment, shareholders and creditors are needed, not to forget continuous improvement and overall quality, the avoidance of unnecessary expenses in tangible assets and counting increasingly more on knowledge and new information and communication technologies (ICTs). Based on the above, it can be concluded that to efficiently manage an organisation, it is necessary to know the break-even point and the weighted average cost of capital but that fundamentally, it is imperative to know the desired and possible economic return. This involves determining how many units (or MIX units) of the product are necessary to get to the accounted breaking-point and how much is needed to balance all the resources, that is, the amount that is required to be able to pay the WACC, and from there, the number of units we need to sell to receive the profit that is planned to be achieved.
Documento de Investigación - ISSN 1688-6275 - Nº 121 - 2020 - López Avila, C. O.; Pontet Ubal, N.
Universidad ORT Uruguay 10
Among the overall objectives of EVA, the primary financial objective of any business is to maximise the wealth of its shareholders. As for EVA's specific aims, it tries to solve limitations and fill the gaps left by traditional indicators (Bukvič 2016; Amat 2008; Stern, Shiely, and Ross 2002; Vera 2000; Weissenrieder 1997):
1. To be implemented in any type of company (small or transnational) listed or not, on the stock market. 2. May be applied to a corporation as well as to one part of it (responsibility centre, business units, or subsidiaries). 3. Set goals in the organisation. 4. Measure the performance of the company and its partners. "Innovation and products and services tailored to the client and developed by employees with high professional training are a critical source of value creation that is becoming increasingly important" (Rappaport, 2006). 5. Improve communication between investors and shareholders. The model for relevant parties, originally, stakeholders, that is, those interested in operational activities and company results.
The calculation and concept of EVA is based on the concept that a successful company must earn at least its capital cost. Companies that earn a higher return than their financing costs benefit from shareholders and notice greater value for shareholders. (Khan S, Chouhan V, Chandra B., and Goswami S 2007; Rappaport 2006; Garcia 2003). To measure the creation of value, that is, to know whether value has really been created, this economic creation must be measured in the business or company. To this end, it is necessary to know the cash flows (cash) and quantify the use of the resources used to obtain these monetary flows. In addition, the risk associated with these future decisions must be measured to quantify the economic profitability created. A company that creates value must achieve an attractive rate of return; however, the return alone is not enough. The performance indicator that explains how to add value to a company is the value added. This is a residual profit indicator that subtracts the cost of capital from operating profits (Chandra 2009; Stern, et al. 2002; Ross 2002; Vera 2000; Stewart 2000). To this end, the creation of value can also be identified as the difference between the return on investment minus the weighted average cost of that invested. If the result is positive, it may be said that there is profit, i.e. value was created, otherwise it may be taken that the organisation is destroying value. For the proposed model, it must be understood that the EVA is computed after deducting the WACC, a percentage that must be multiplied by the capital invested, to know the value added in monetary units. The EVA is calculated by taking the difference between the rate of return on all the capital invested IC (operating assets, current and non-current) to produce the ROIC profits and the WACC and then multiplying it by the economic book value of the capital that is dedicated to the business as expressed below:
Universidad ORT Uruguay 11
Business administration can do many things to create value, but in the end, all of them must fall into one of the three categories measured by the EVA. The EVA increases when (Stewart 2000) the following occurs: a) the rate of return obtained on the basis of existing capital improves, that is, when more operating profit is generated without dedicating more funds to the business, b) additional capital is invested in projects that yield more than the cost of obtaining new capital and c) capital is withdrawn or future investment is reduced from operations below the standard at which inadequate returns are obtained.
We can also say that EVA increases if the following transpires: 1. improve the efficiency of current assets; 2. the more the yield from investments the more the wealth generated; 3. if asset investments that yield above the WACC are increased and 4. lowering the cost of financing and reducing assets while maintaining the NOPLAT. The cost of capital is the minimum acceptable return on investment. It is a dividing line between good and bad company performance. It must be clear to directors that for their actions to be justified, the company must create value or generate at least an investment interest rate that equals the return on investment, along with the cost of investment. This would be a true business break-even point, and the objective of value creation must be raised above this limit to be projected. The proposed model contributes to this end.
On the other hand, if it is possible to gain more operating income after taxes with the same operating assets, more EVA will be created; furthermore, if the same operating income can be made after taxes with less operating assets, efficiency will also be optimised and EVA will be created, and finally, if the cost of the capital invested is reduced, a higher EVA will also be created. From the aforementioned, it can be concluded that it does not matter whether an accounting profit is recognised from X or Y, that the economic analysis is identical and that the ROIC being greater than the WACC is what matters. (Bukvič 2016; Amat 2008; Stern, Shiely, and Ross 2002).
The net trading operating profit discounting adjusted taxes (NOPAT) represents the company’s operating profit after taxes, after having adjusted the taxes to a liquidity base. (Copeland et al. 2004). The calculation of the NOPAT starts at profit before interest and taxes (BAIIA), that is, the operating profit before taxes that the company would have obtained if there were neither debt nor amortisation of goodwill.
ROIC after tax. This result is obtained by dividing the profit after interest and taxes between the average book value of the company’s permanent capital or measured as assets linked to the company’s operational activity, in our case the SMEs under observation (Copeland et al. 2004; Mascareñas, 2008)
The ROIC constitutes the expected rate of return on capital investment on assets directly linked to the company’s operation. Hence, as seen from the perspective of investors (partners or lenders), it constitutes the rate of return, and it is one of the most important indicators for measuring value generation. Therefore, we can say that a company creates value for its shareholders only when it obtains a rate of return on invested capital that is higher than its WACC. In practice, overall, it is defined in the following way (Copeland et
Documento de Investigación - ISSN 1688-6275 - Nº 121 - 2020 - López Avila, C. O.; Pontet Ubal, N.
Universidad ORT Uruguay 12
al. 2004, p 205): The return on capital or invested capital that a company uses to try to measure the returns earned by the capital invested in it.
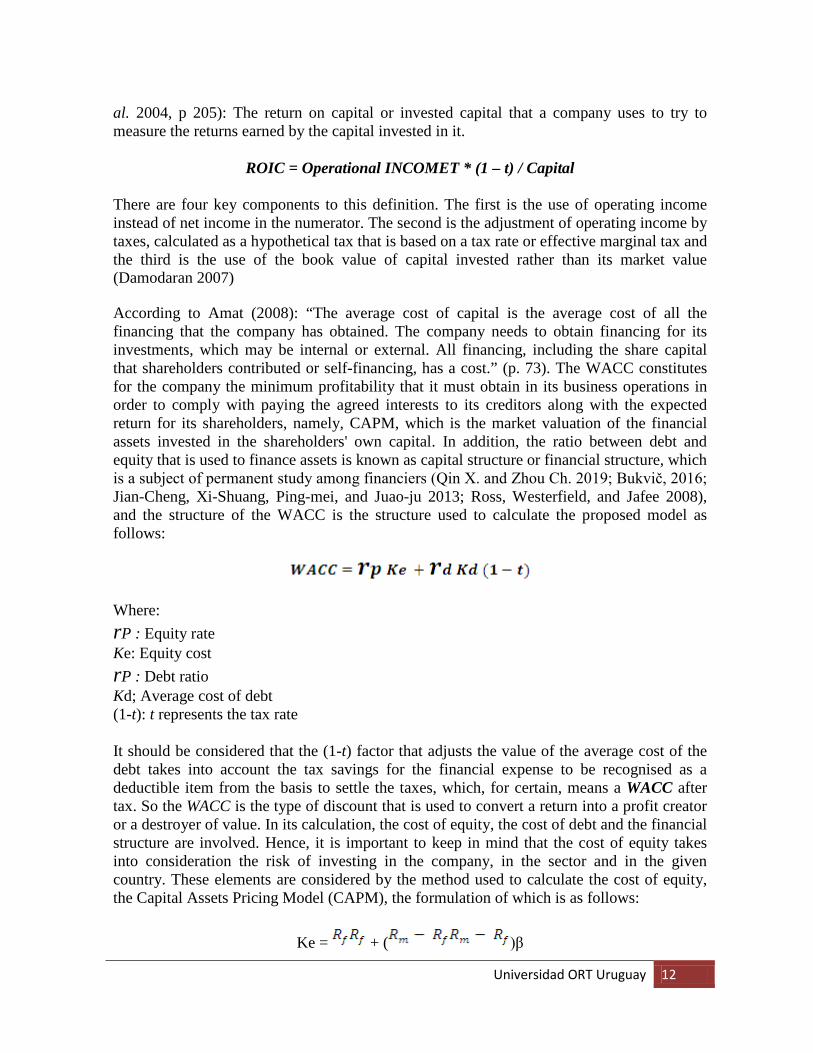
ROIC = Operational INCOMET * (1 – t) / Capital There are four key components to this definition. The first is the use of operating income instead of net income in the numerator. The second is the adjustment of operating income by taxes, calculated as a hypothetical tax that is based on a tax rate or effective marginal tax and the third is the use of the book value of capital invested rather than its market value (Damodaran 2007) According to Amat (2008): “The average cost of capital is the average cost of all the financing that the company has obtained. The company needs to obtain financing for its investments, which may be internal or external. All financing, including the share capital that shareholders contributed or self-financing, has a cost.” (p. 73). The WACC constitutes for the company the minimum profitability that it must obtain in its business operations in order to comply with paying the agreed interests to its creditors along with the expected return for its shareholders, namely, CAPM, which is the market valuation of the financial assets invested in the shareholders' own capital. In addition, the ratio between debt and equity that is used to finance assets is known as capital structure or financial structure, which is a subject of permanent study among financiers (Qin X. and Zhou Ch. 2019; Bukvič, 2016; Jian-Cheng, Xi-Shuang, Ping-mei, and Juao-ju 2013; Ross, Westerfield, and Jafee 2008), and the structure of the WACC is the structure used to calculate the proposed model as follows:
Where: rP : Equity rate Ke: Equity cost rP : Debt ratio Kd; Average cost of debt (1-t): t represents the tax rate It should be considered that the (1-t) factor that adjusts the value of the average cost of the debt takes into account the tax savings for the financial expense to be recognised as a deductible item from the basis to settle the taxes, which, for certain, means a WACC after tax. So the WACC is the type of discount that is used to convert a return into a profit creator or a destroyer of value. In its calculation, the cost of equity, the cost of debt and the financial structure are involved. Hence, it is important to keep in mind that the cost of equity takes into consideration the risk of investing in the company, in the sector and in the given country. These elements are considered by the method used to calculate the cost of equity, the Capital Assets Pricing Model (CAPM), the formulation of which is as follows:
Ke = + ( )β
Universidad ORT Uruguay 13
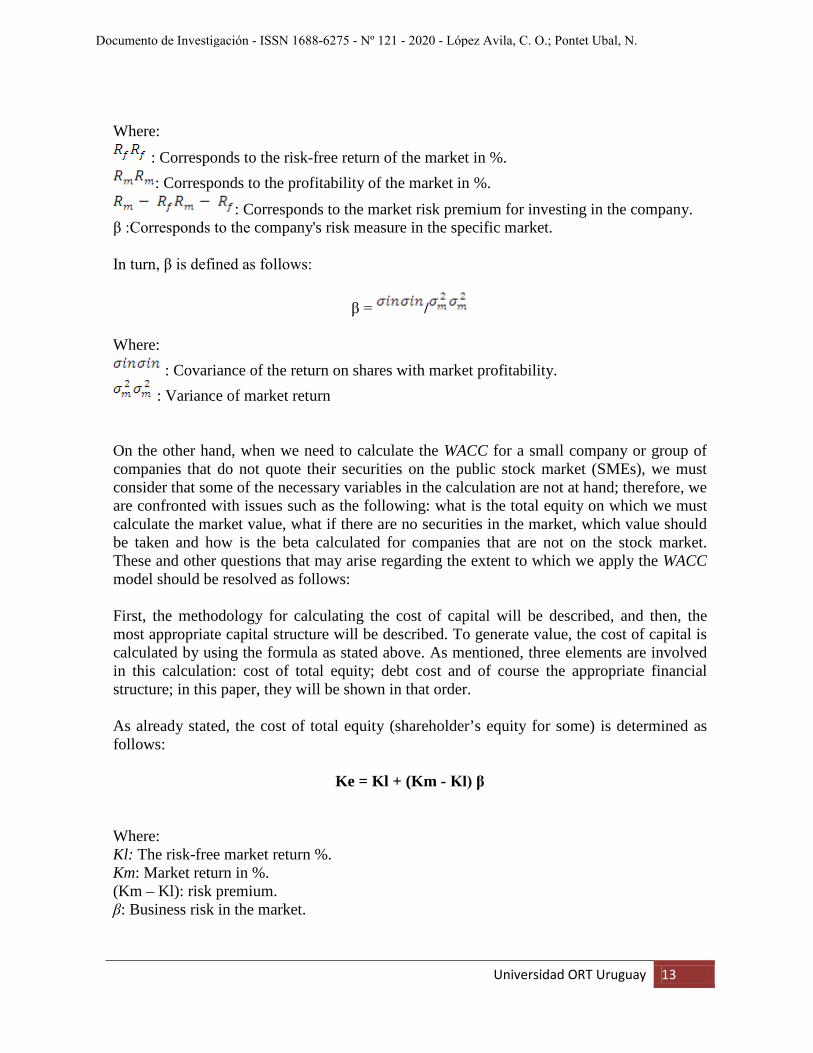
Where:
: Corresponds to the risk-free return of the market in %. : Corresponds to the profitability of the market in %.
: Corresponds to the market risk premium for investing in the company. β :Corresponds to the company's risk measure in the specific market. In turn, β is defined as follows:
β = /
Where:
: Covariance of the return on shares with market profitability. : Variance of market return
On the other hand, when we need to calculate the WACC for a small company or group of companies that do not quote their securities on the public stock market (SMEs), we must consider that some of the necessary variables in the calculation are not at hand; therefore, we are confronted with issues such as the following: what is the total equity on which we must calculate the market value, what if there are no securities in the market, which value should be taken and how is the beta calculated for companies that are not on the stock market. These and other questions that may arise regarding the extent to which we apply the WACC model should be resolved as follows: First, the methodology for calculating the cost of capital will be described, and then, the most appropriate capital structure will be described. To generate value, the cost of capital is calculated by using the formula as stated above. As mentioned, three elements are involved in this calculation: cost of total equity; debt cost and of course the appropriate financial structure; in this paper, they will be shown in that order. As already stated, the cost of total equity (shareholder’s equity for some) is determined as follows:
Ke = Kl + (Km - Kl) β
Where: Kl: The risk-free market return %. Km: Market return in %. (Km – Kl): risk premium. β: Business risk in the market.
Documento de Investigación - ISSN 1688-6275 - Nº 121 - 2020 - López Avila, C. O.; Pontet Ubal, N.
Universidad ORT Uruguay 14
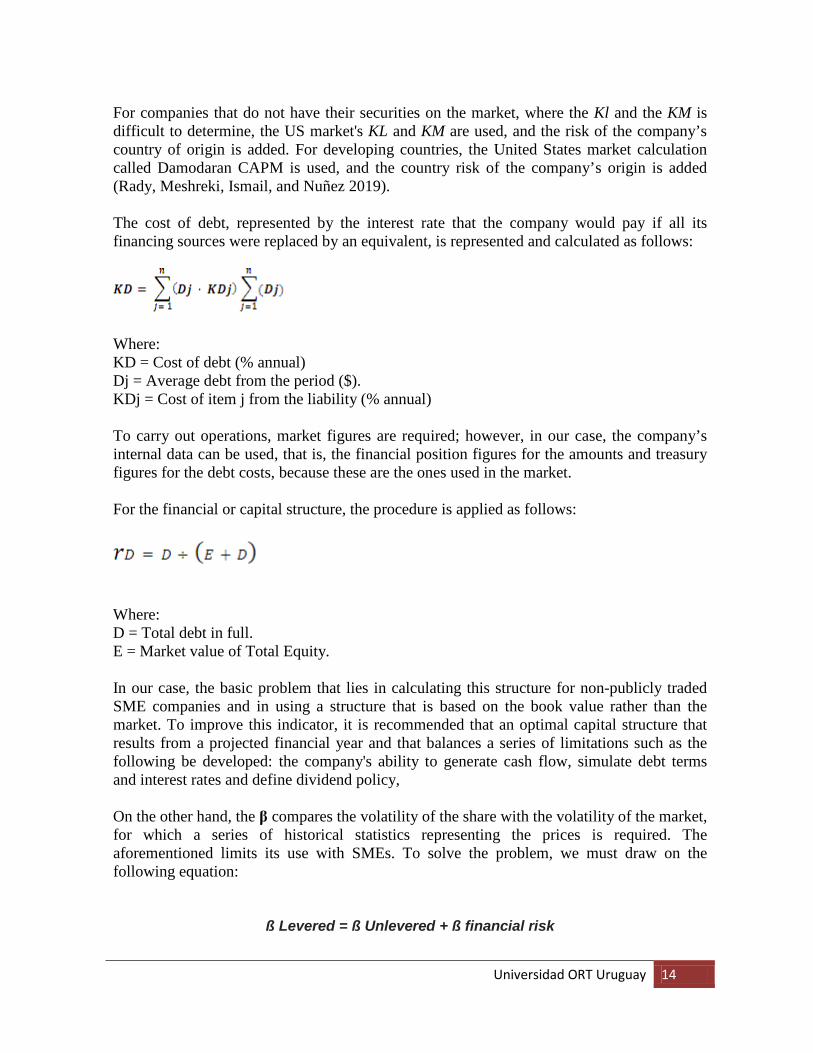
For companies that do not have their securities on the market, where the Kl and the KM is difficult to determine, the US market's KL and KM are used, and the risk of the company’s country of origin is added. For developing countries, the United States market calculation called Damodaran CAPM is used, and the country risk of the company’s origin is added (Rady, Meshreki, Ismail, and Nuñez 2019). The cost of debt, represented by the interest rate that the company would pay if all its financing sources were replaced by an equivalent, is represented and calculated as follows:
Where: KD = Cost of debt (% annual) Dj = Average debt from the period ($). KDj = Cost of item j from the liability (% annual) To carry out operations, market figures are required; however, in our case, the company’s internal data can be used, that is, the financial position figures for the amounts and treasury figures for the debt costs, because these are the ones used in the market. For the financial or capital structure, the procedure is applied as follows:
Where: D = Total debt in full. E = Market value of Total Equity. In our case, the basic problem that lies in calculating this structure for non-publicly traded SME companies and in using a structure that is based on the book value rather than the market. To improve this indicator, it is recommended that an optimal capital structure that results from a projected financial year and that balances a series of limitations such as the following be developed: the company's ability to generate cash flow, simulate debt terms and interest rates and define dividend policy, On the other hand, the β compares the volatility of the share with the volatility of the market, for which a series of historical statistics representing the prices is required. The aforementioned limits its use with SMEs. To solve the problem, we must draw on the following equation:
ß Levered = ß Unlevered + ß financial risk
Universidad ORT Uruguay 15
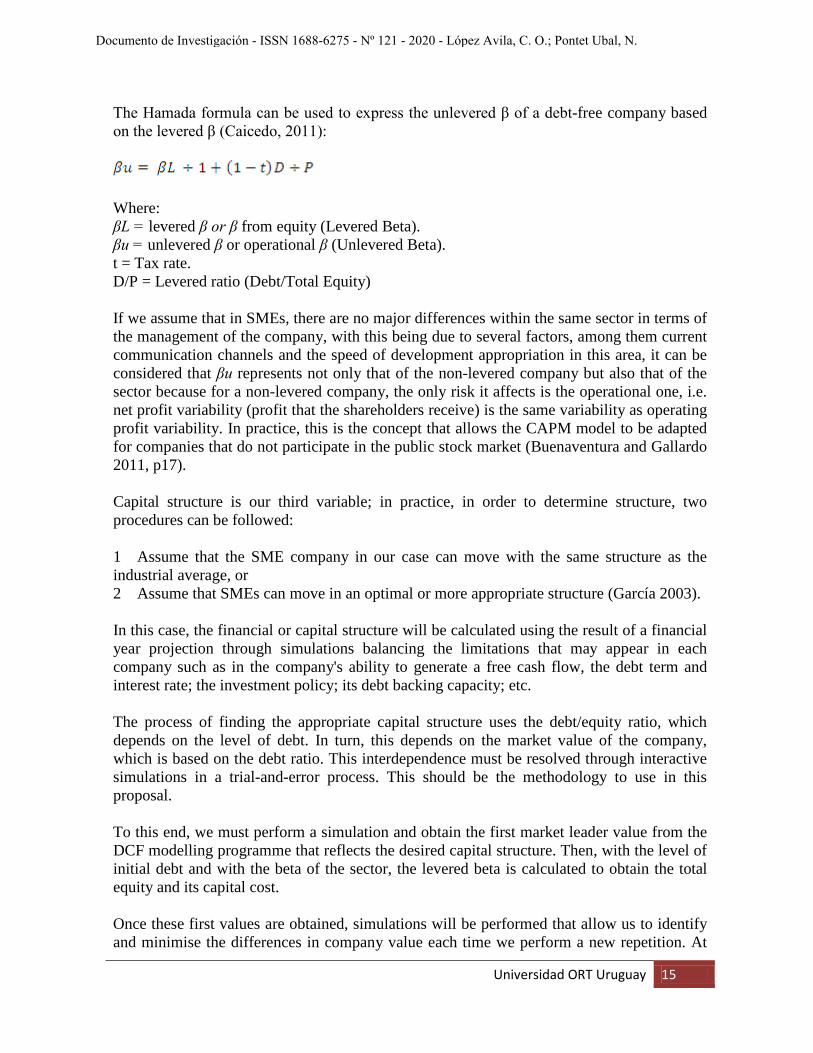
The Hamada formula can be used to express the unlevered β of a debt-free company based on the levered β (Caicedo, 2011):
Where: βL = levered β or β from equity (Levered Beta). βu = unlevered β or operational β (Unlevered Beta). t = Tax rate. D/P = Levered ratio (Debt/Total Equity) If we assume that in SMEs, there are no major differences within the same sector in terms of the management of the company, with this being due to several factors, among them current communication channels and the speed of development appropriation in this area, it can be considered that βu represents not only that of the non-levered company but also that of the sector because for a non-levered company, the only risk it affects is the operational one, i.e. net profit variability (profit that the shareholders receive) is the same variability as operating profit variability. In practice, this is the concept that allows the CAPM model to be adapted for companies that do not participate in the public stock market (Buenaventura and Gallardo 2011, p17). Capital structure is our third variable; in practice, in order to determine structure, two procedures can be followed: 1 Assume that the SME company in our case can move with the same structure as the industrial average, or 2 Assume that SMEs can move in an optimal or more appropriate structure (García 2003). In this case, the financial or capital structure will be calculated using the result of a financial year projection through simulations balancing the limitations that may appear in each company such as in the company's ability to generate a free cash flow, the debt term and interest rate; the investment policy; its debt backing capacity; etc. The process of finding the appropriate capital structure uses the debt/equity ratio, which depends on the level of debt. In turn, this depends on the market value of the company, which is based on the debt ratio. This interdependence must be resolved through interactive simulations in a trial-and-error process. This should be the methodology to use in this proposal. To this end, we must perform a simulation and obtain the first market leader value from the DCF modelling programme that reflects the desired capital structure. Then, with the level of initial debt and with the beta of the sector, the levered beta is calculated to obtain the total equity and its capital cost. Once these first values are obtained, simulations will be performed that allow us to identify and minimise the differences in company value each time we perform a new repetition. At
Documento de Investigación - ISSN 1688-6275 - Nº 121 - 2020 - López Avila, C. O.; Pontet Ubal, N.
Universidad ORT Uruguay 16
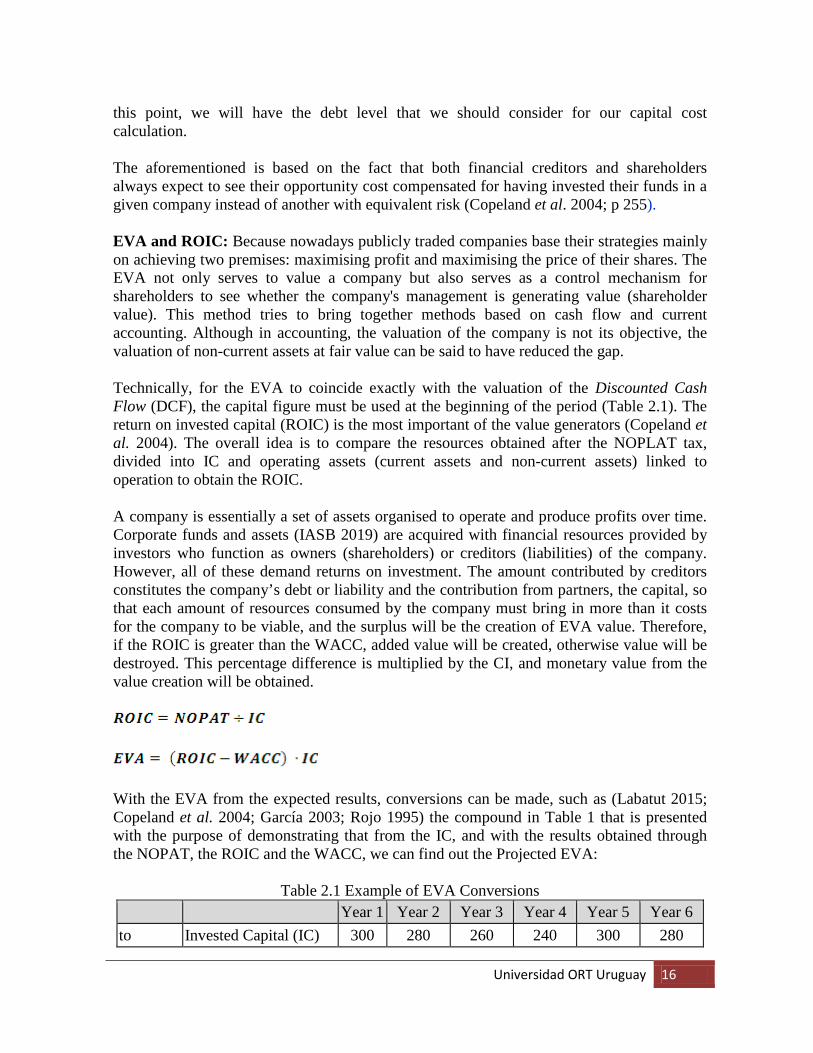
this point, we will have the debt level that we should consider for our capital cost calculation. The aforementioned is based on the fact that both financial creditors and shareholders always expect to see their opportunity cost compensated for having invested their funds in a given company instead of another with equivalent risk (Copeland et al. 2004; p 255). EVA and ROIC: Because nowadays publicly traded companies base their strategies mainly on achieving two premises: maximising profit and maximising the price of their shares. The EVA not only serves to value a company but also serves as a control mechanism for shareholders to see whether the company's management is generating value (shareholder value). This method tries to bring together methods based on cash flow and current accounting. Although in accounting, the valuation of the company is not its objective, the valuation of non-current assets at fair value can be said to have reduced the gap. Technically, for the EVA to coincide exactly with the valuation of the Discounted Cash Flow (DCF), the capital figure must be used at the beginning of the period (Table 2.1). The return on invested capital (ROIC) is the most important of the value generators (Copeland et al. 2004). The overall idea is to compare the resources obtained after the NOPLAT tax, divided into IC and operating assets (current assets and non-current assets) linked to operation to obtain the ROIC. A company is essentially a set of assets organised to operate and produce profits over time. Corporate funds and assets (IASB 2019) are acquired with financial resources provided by investors who function as owners (shareholders) or creditors (liabilities) of the company. However, all of these demand returns on investment. The amount contributed by creditors constitutes the company’s debt or liability and the contribution from partners, the capital, so that each amount of resources consumed by the company must bring in more than it costs for the company to be viable, and the surplus will be the creation of EVA value. Therefore, if the ROIC is greater than the WACC, added value will be created, otherwise value will be destroyed. This percentage difference is multiplied by the CI, and monetary value from the value creation will be obtained.
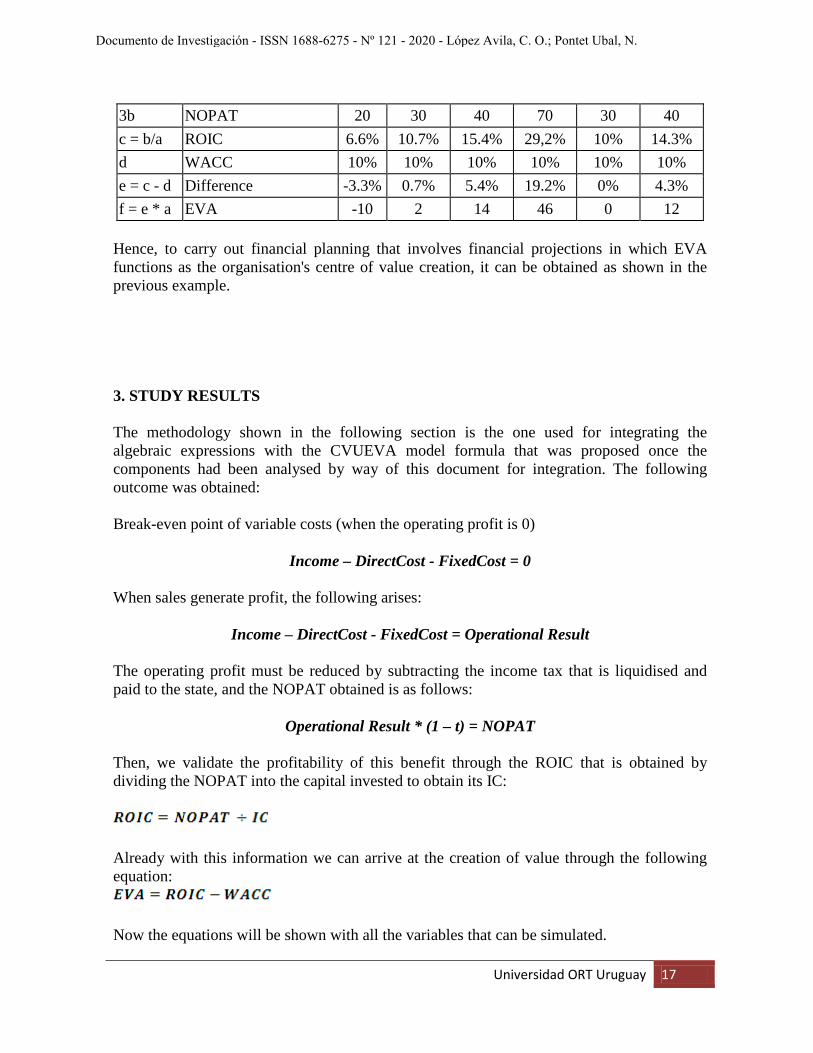
With the EVA from the expected results, conversions can be made, such as (Labatut 2015; Copeland et al. 2004; García 2003; Rojo 1995) the compound in Table 1 that is presented with the purpose of demonstrating that from the IC, and with the results obtained through the NOPAT, the ROIC and the WACC, we can find out the Projected EVA:
Table 2.1 Example of EVA Conversions Year 1 Year 2 Year 3 Year 4 Year 5 Year 6 to Invested Capital (IC) 300 280 260 240 300 280
Universidad ORT Uruguay 17
3b NOPAT 20 30 40 70 30 40 c = b/a ROIC 6.6% 10.7% 15.4% 29,2% 10% 14.3% d WACC 10% 10% 10% 10% 10% 10% e = c - d Difference -3.3% 0.7% 5.4% 19.2% 0% 4.3% f = e * a EVA -10 2 14 46 0 12
Hence, to carry out financial planning that involves financial projections in which EVA functions as the organisation's centre of value creation, it can be obtained as shown in the previous example. 3. STUDY RESULTS The methodology shown in the following section is the one used for integrating the algebraic expressions with the CVUEVA model formula that was proposed once the components had been analysed by way of this document for integration. The following outcome was obtained: Break-even point of variable costs (when the operating profit is 0)
Income – DirectCost - FixedCost = 0 When sales generate profit, the following arises:
Income – DirectCost - FixedCost = Operational Result The operating profit must be reduced by subtracting the income tax that is liquidised and paid to the state, and the NOPAT obtained is as follows:
Operational Result * (1 – t) = NOPAT Then, we validate the profitability of this benefit through the ROIC that is obtained by dividing the NOPAT into the capital invested to obtain its IC:
Already with this information we can arrive at the creation of value through the following equation:
Now the equations will be shown with all the variables that can be simulated.
Documento de Investigación - ISSN 1688-6275 - Nº 121 - 2020 - López Avila, C. O.; Pontet Ubal, N.
Universidad ORT Uruguay 18
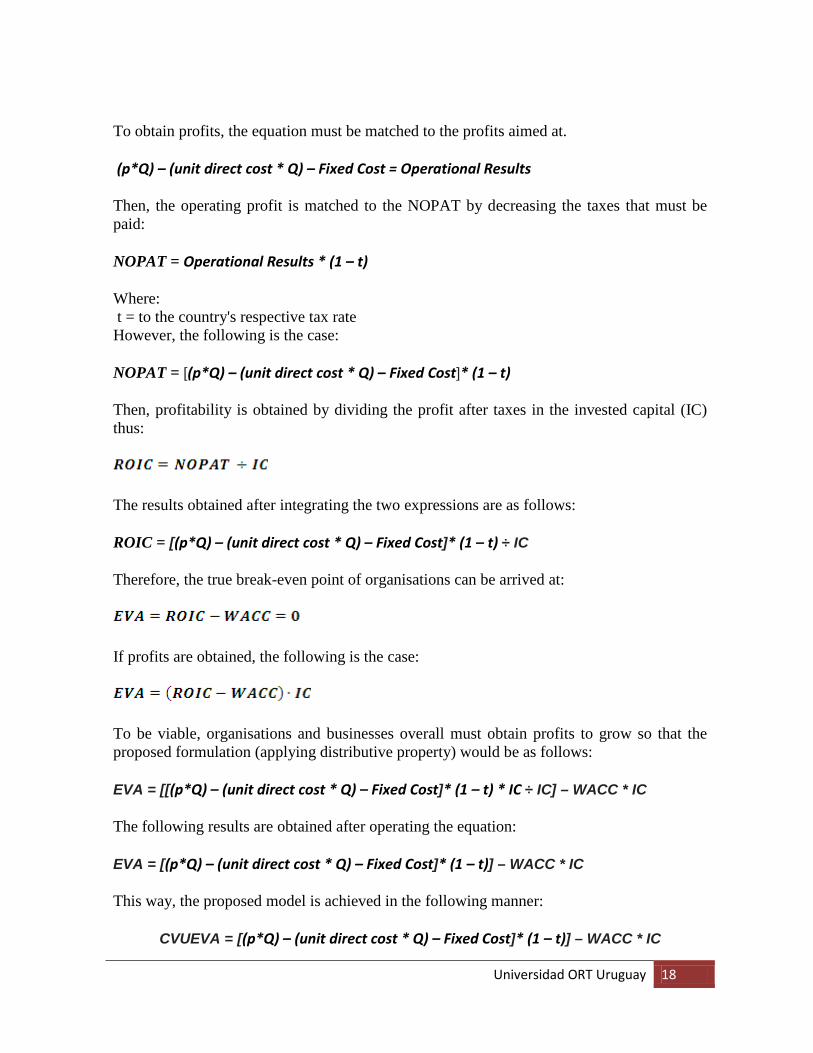
To obtain profits, the equation must be matched to the profits aimed at. (p*Q) – (unit direct cost * Q) – Fixed Cost = Operational Results Then, the operating profit is matched to the NOPAT by decreasing the taxes that must be paid: NOPAT = Operational Results * (1 – t) Where: t = to the country's respective tax rate However, the following is the case: NOPAT = [(p*Q) – (unit direct cost * Q) – Fixed Cost]* (1 – t) Then, profitability is obtained by dividing the profit after taxes in the invested capital (IC) thus:
The results obtained after integrating the two expressions are as follows: ROIC = [(p*Q) – (unit direct cost * Q) – Fixed Cost]* (1 – t) ÷ IC Therefore, the true break-even point of organisations can be arrived at:
If profits are obtained, the following is the case:
To be viable, organisations and businesses overall must obtain profits to grow so that the proposed formulation (applying distributive property) would be as follows: EVA = [[(p*Q) – (unit direct cost * Q) – Fixed Cost]* (1 – t) * IC ÷ IC] – WACC * IC The following results are obtained after operating the equation: EVA = [(p*Q) – (unit direct cost * Q) – Fixed Cost]* (1 – t)] – WACC * IC This way, the proposed model is achieved in the following manner:
CVUEVA = [(p*Q) – (unit direct cost * Q) – Fixed Cost]* (1 – t)] – WACC * IC
Universidad ORT Uruguay 19
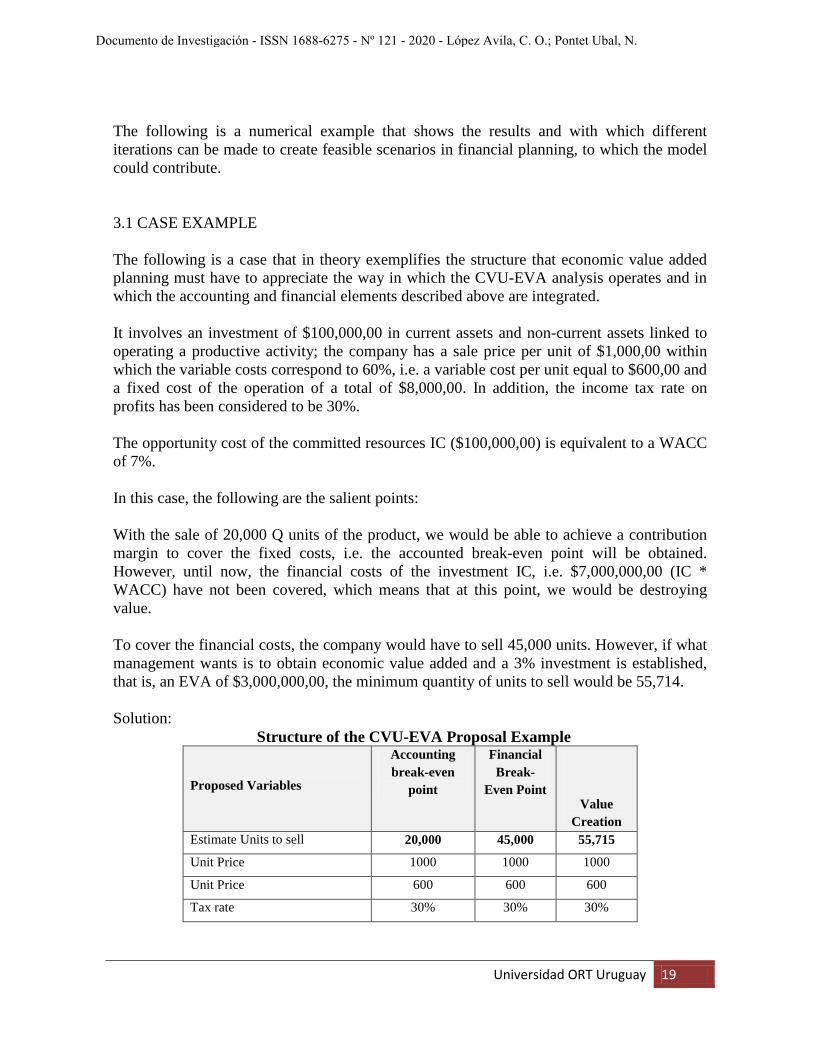
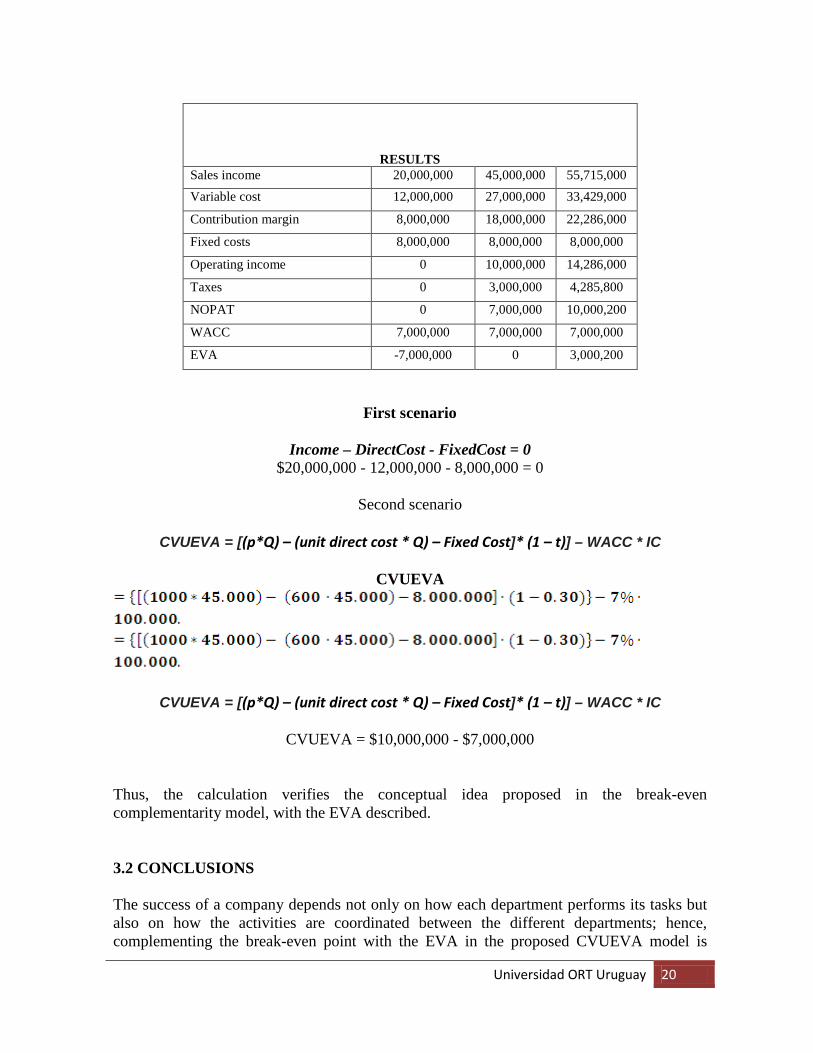
The following is a numerical example that shows the results and with which different iterations can be made to create feasible scenarios in financial planning, to which the model could contribute. 3.1 CASE EXAMPLE The following is a case that in theory exemplifies the structure that economic value added planning must have to appreciate the way in which the CVU-EVA analysis operates and in which the accounting and financial elements described above are integrated. It involves an investment of $100,000,00 in current assets and non-current assets linked to operating a productive activity; the company has a sale price per unit of $1,000,00 within which the variable costs correspond to 60%, i.e. a variable cost per unit equal to $600,00 and a fixed cost of the operation of a total of $8,000,00. In addition, the income tax rate on profits has been considered to be 30%. The opportunity cost of the committed resources IC ($100,000,00) is equivalent to a WACC of 7%. In this case, the following are the salient points: With the sale of 20,000 Q units of the product, we would be able to achieve a contribution margin to cover the fixed costs, i.e. the accounted break-even point will be obtained. However, until now, the financial costs of the investment IC, i.e. $7,000,000,00 (IC * WACC) have not been covered, which means that at this point, we would be destroying value. To cover the financial costs, the company would have to sell 45,000 units. However, if what management wants is to obtain economic value added and a 3% investment is established, that is, an EVA of $3,000,000,00, the minimum quantity of units to sell would be 55,714. Solution: Structure of the CVU-EVA Proposal Example
Proposed Variables
Accounting break-even
point
Financial Break-
Even Point Value
Creation Estimate Units to sell 20,000 45,000 55,715
Unit Price 1000 1000 1000
Unit Price 600 600 600
Tax rate 30% 30% 30%
Documento de Investigación - ISSN 1688-6275 - Nº 121 - 2020 - López Avila, C. O.; Pontet Ubal, N.
Universidad ORT Uruguay 20
RESULTS
Sales income 20,000,000 45,000,000 55,715,000 Variable cost 12,000,000 27,000,000 33,429,000
Contribution margin 8,000,000 18,000,000 22,286,000
Fixed costs 8,000,000 8,000,000 8,000,000
Operating income 0 10,000,000 14,286,000
Taxes 0 3,000,000 4,285,800
NOPAT 0 7,000,000 10,000,200
WACC 7,000,000 7,000,000 7,000,000
EVA -7,000,000 0 3,000,200
First scenario
Income – DirectCost - FixedCost = 0 $20,000,000 - 12,000,000 - 8,000,000 = 0
Second scenario
CVUEVA = [(p*Q) – (unit direct cost * Q) – Fixed Cost]* (1 – t)] – WACC * IC
CVUEVA
CVUEVA = [(p*Q) – (unit direct cost * Q) – Fixed Cost]* (1 – t)] – WACC * IC
CVUEVA = $10,000,000 - $7,000,000 Thus, the calculation verifies the conceptual idea proposed in the break-even complementarity model, with the EVA described. 3.2 CONCLUSIONS The success of a company depends not only on how each department performs its tasks but also on how the activities are coordinated between the different departments; hence, complementing the break-even point with the EVA in the proposed CVUEVA model is
Universidad ORT Uruguay 21
essential toward achieving a sustainable competitive strategy. To this end, it is necessary to have strategic planning with short- and medium-term estimates that may be achieved.
The break-even point as presented by cost theorists who have not accounted for the WACC destroying value or at the very least making it difficult to be genuinely certain that value is being created. The WACC weighs the costs of each of the sources of capital regardless of whether they are their own or owned by third parties. It should be kept in mind that if the WACC is lower than the ROIC, an added EVA will have been produced for the shareholders. Otherwise, value is destroyed.
The true break-even point is reached when the business is capable of producing a similar return to the WACC. The cost of capital of the company depends on its financing structure, i.e. the debt / capital ratio, as well as the cost of the different sources of financing used or to be used to execute an investment.
The EVA economic profit can be achieved from the WACC coverage. Consequently, the EVA serves to evaluate the generation of company value, and it constitutes a key management tool for strategic planning, day-to-day decision-making and performance evaluation by area of responsibility. The EVA budget is essential to create growth in an organisation.
The model proposed in this study is a tool that helps in financial planning and helps to present information on the maintenance of financial capital required by the conceptual framework of IFRS.
Research is proposed in the future to carry out activities with companies where the model has been applied to obtain empirical evidence.
Documento de Investigación - ISSN 1688-6275 - Nº 121 - 2020 - López Avila, C. O.; Pontet Ubal, N.
Universidad ORT Uruguay 22
4. BIBLIOGRAPHY
AMAT SALAS, O. (2008). Comprender la contabilidad y las finanzas. Madrid: Ediciones Gestión 2000.
BERK, J. & DEMARZO, P. (2008). Finanzas corporativas. México: Pearson.
BOYD, B. K. (1991). Strategic planning and financial performance: a meta‐analytic review. Journal of management studies 28(4), 353-374.
BRACKER, J. Y. S & PEARSON, J. N. (1986). Planificación y desempeño financiero de empresas pequeñas y maduras, Strategic Management Journal, 503-522.
BUENAVENTURA, G. & GALLARDO, D. (2011). Metodología para el cálculo de WACC y su aplicabilidad en la valoración de inversiones de capital, en empresas no cotizadas en bolsa. Trabajo de Grado para obtención de título de Magíster en Finanzas, Facultad de Ciencias Administrativas y Económicas, Universidad ICESI, Cali, Colombia.
BUKVIČ, V. (2016). Value based management with some practical examples in slovenian industries. Advances in Business-Related Scientific Research Journal, 7(2), 41-79.
BURJA, C. (2008). Financial consequences of the sales variation, In: Proceedings International Conference on Applied Economics Kastoria Greece, 105-110.
BUŞE, L., (2005). Analizăeconomico-financiară, Ed. Economică, Bucureşti, 301-310.
CAICEDO, E. (2011). Betas apalancadas y no apalancadas en industrias colombianas. Documento presentado al III simposio Docentes de Finanzas. Universidad Pontificia Javeriana Bogotá y Politécnico Gran colombiano, Bogotá.
COPELAND T.; KOLLER, T.; GOEDHART, M. & WESSELS, D. (2010). Valuation: measuring and managing the value of companies. 4ª ed. New York: John Wiley & Sons.
DAMODARAN, A. (2007). Return on capital (ROC), return on invested capital (ROIC) and return on equity (ROE): measurement and implications. Social Science Research Network.
GARCÍA, O. L. (2003). Valoración de empresas, Gerencia del Valor y EVA. 3ª ed. Cali: Moderna Impresores S.A.
GARRISON, R. H.; NOREEN E. W. & BREWERPETER C. (2007). Contabilidad administrativa, 11ª ed. México: Mc Graw Hill.
Universidad ORT Uruguay 23
GROZDANOVSKA, V.; BOJKOVSKa, K. & JANKULOVSKI, N. (2017). Financial management and financial planning in the organizations. European Journal of Business and Management, 9(2), 120-125.
HANSEN, D. & MOWEN, M. (2003). Administración de costos: contabilidad y control. México: Thomson.
HORNGREN, C. T.; DATAR, S.; FOSTER, G. & DERAS, Q. A. (2007). Contabilidad de costos: un enfoque gerencial. México: Prentice Hall.
INTERNATIONAL ACCOUNTING STANDARDS BOARD (2019). International Financial Reporting Standards IFRS 2018. London: International Accounting Standards Board.
JAEDICKE, R. K. & ROBICHEK, A. A. (1964). Cost-volume-profit analysis under conditions of uncertainty. The Accounting Review, 39(4), 917.
JIAN-CHENG, D.; XI-SHUANG, H.; PING-MEI, S. & JIAO-JU, G. (2013). Determine optimal capital structure for metro PPP projects to reduce financial risks: theory and empirical analysis. In: International Conference on Management Science and Engineering 20th Annual Conference Proceedings, 2105-2111. IEEE.
KHAN, S.; CHOUHAN, V.; CHANDRA, B. & GOSWAMI, S. (2012). Measurement of value creation vis-á-vis EVA: analysis of select BSE companies. Pacific Business Review International, 5(3), 114-131.
KYRIAZIS, D. & ANASTASSIS, C. (2007). The validity of the economic value added approach: an empirical application, European Financial Management, 13(1), 71-100.
LABATUT, G. (2015). El valor de las empresas: métodos de valoración tradicionales y comparativos (múltiplos). En: http://marioabambari.info/wpcontent/.
MASCAREÑA, J. (2008). Riesgos económicos y financieros. Recuperado de http://www.gacetafinanciera.com/REF.pdf
MORRISON, T. A. & KACZKA, E. (1969). A new application of calculus and risk analysis to cost-volume-profit changes, The Accounting Review, 44(2), 330–343.
OFILEANU, D. & BUMBESCU, S. (2014). The analysis of the factors which influence the change of the breakeven point. Procedia Econ. Financ, 16, 356-367.
STANCU, I. (2006). Măsurareaperformanţeiîntreprinderii. Economieteoreticăşiaplicată, 496(1), 8-12.
Documento de Investigación - ISSN 1688-6275 - Nº 121 - 2020 - López Avila, C. O.; Pontet Ubal, N.
Universidad ORT Uruguay 24
OFILEANU, O. & BUMBESCU, S. (2014). The Analysis of the Factors Which Influence the Change of The Breakeven Point. In: 21st International Economic Conference IECS, Sibiu, Romania.
PĂVĂLOAIE, W. (2010). Analiza economico-financiară. Concepteşistudii de caz, Ed. Economică Bucureşti, 353-370.
PEREVOZCHIKOV, A. G. & LESIK, I. A. (2015). Time-Dependent Model of Corporate Investments in Fixed Assets. Computational Mathematics and Modeling 26, no. 3 (2015): 358-369.
PETCU, M. (2009). Analiza economico-financiară a întreprinderii, Ed. Economică Bucureşti, 225-234.
POLIMENI, R.; FABOZZI F. & ADELBERG, A. H. (1994). Manual de contabilidad de Costos. Mc Graw Hill Interamericana S.A. Colombia.
PONTET UBAL, N. & OLIARI, L. (2014). Crecimiento y toma de decisiones en las PYMES: ¿existe un modelo simple? VII Congreso de Costos del MERCOSUR, Montevideo.
QIN, XIAO & CHUNYANG ZHOU. (2019) Financial structure and determinants of systemic risk contribution. Pacific-Basin Finance Journal, 57.
RADY, A.; MESHREKI, H; ISMAIL, A. & NÚÑEZ, L. (2019). Variations in valuation methodologies and the cost of capital: evidence from MENA Countries. Emerging Markets Finance and Trade, 55(9), 2106-2123.
RAMÍREZ PADILLA, D. N. (2019). Contabilidad administrativa: un enfoque estratégico para la competitividad. 10ª ed. México: McGraw-Hill
RAPPAPORT, A. (1981). Selecting strategies that create shareholder value. Harvard Business Review, 59(3), p. 139.
ROJO RAMÍREZ, A. A. (1995). Valoración de empresas y gestión basada en valor. Madrid: Paraninfo.
ROSS, S. A.; JAFFE, J. & KAKANI, R. K. (1987). Corporate Finance, 10e. New York: McGraw-Hill Education.
SÁEZ TORRECILLA, A.; BROMWICH, M.; FERNANDEZ FERNANDEZ, A. & GUTIERREZ DIAZ, G. (1994). Contabilidad de costes y contabilidad de gestión. Madrid: McGraw-Hill Interamericana.
SHIL, N. C. (2009). Performance measures: an application of economic value added. International Journal of Business and Management, 4(3), 169-177.
Universidad ORT Uruguay 25
STERN, J. M.; SHIELY, J. S. & ROSS, I. (2002). The EVA challenge: implementing value-added change in an organization. New Jersey: John Wiley & Sons.
STEWART, G. B. (2000). En busca del valor. Barcelona: Ediciones Gestión 2000.
SUÁREZ SUÁREZ, A. S. (2014). Decisiones óptimas de inversión y financiación en la empresa. 21ª ed. Madrid: Pirámide.
VÂLCEANU, G.; ROBU, V. & GEORGESCU, N. (2005). Analiză economico-financiară. Economica, Bucharest.
VAN HORNE, J. C. & WACHOWICZ, J. M. (2010): Fundamentals of financial management, 13ª ed. New York: Pearson.
VERA COLINA, M. A. (2000). EVA y CVA como medidas de la creación de valor en un negocio: una introducción. Tendencias, 1(1), 65-86.
WEISSENRIEDER, F. (1997). Value based management: economic value added or cash value added?. FWC AB Study, 3.
Documento de Investigación - ISSN 1688-6275 - Nº 121 - 2020 - López Avila, C. O.; Pontet Ubal, N.