Embed Size (px)
Citation preview
COMPILING THE SPACE SHUTTLEWINO TUNNELDATA BASE:
AN EXERCISE IN TECHNICAL AND MANAGERIALINNOVATIONS*
N. Dale KempMichoud Engineering Office
Military and Public Electronic SystemsChrysler CorporationNew Orleans, Lousiana
ABSTRACT........
I0166 --YZ
I
,I
Englneers evaluating Space Shuttle flight data and performance results areusing a massive data base of w_nd-tunnel test data. This data base is the resultof years of extensive highly coordinated effort by NASA massagers,NASA centersand contractors.
A wind tunnel test data base of the magnitude attained is a major accomplish-ment. It exists because of lessons learned from the Apollo program.
The Apollo program spawned an automated wind tunnel data analysis systemcalled SADSAC developed by the Chrysler Space Division. An improved version of
this system renamed DATAMAN was used by Chrysler to document analyzed wind tunneldata and data bank the test data in st6ndWrdi_6d _ormats.
These analysis documents, associated computer grapMcs and standard formatteddata were disseminated nationwide to the Shuttle technical community. These
outputs bec_m_ the basis for substantiating and certifying the flight worthinessof the Space Shuttle and for improving future designs.
#s an aid to future programs this paper documents the lessons learned in
compiling the massive wind tunnel test data base for developing the Space Shuttle.In particular, innovative managerial and technical concepts evolved in the courseof conceiving and developing this successful DATAMAN system and the methods andorganization for applying the system are presented.
INTRODUCTION
...... Background
As early as 1970, farsighted NASA engineers of the Space Shuttle Aerothermo-
dyna_ic Test Data panel resolved that regarding wind tunnel test data, circumstancesof the Apollo program would not be repeated.
•The work reported here was performed for NASA johnson Space Center, Houston,
Texas, under contracts NASg-13247 and NASg-16283.
1213
!
¢.,}I
l,i
t
..J
,,t t
11
1,.1,
,i
! .i
https://ntrs.nasa.gov/search.jsp?R=19840002099 2018-06-27T23:30:16+00:00Z

1214
As the Apollo program progressed to flight status, engineers substantiating_iqht dat_ were hindered because of lack of corroborating wind tunnel data.
This _ack was not because data had not been acquired.
Extensive wind tunnel data had been acquired over the life of the programat a great expenditure of effort and money. The documentation and preservationof the test data, however, were not as extensive as the test program.
Changing Perceptions
Perceptions or attitudes regarding the value of documenting test data
analyses evolved because of increased complexities, technical and managerial.Launch, reentK1, cruise, and landing Gesign conditions dictated a wind tunnel
test program unparalleled in complexity and in data quantities. Engineers
perceived the need fer re,am.ping the traditional approach of applying test resultstoday and documenting tomorrow - or the day after that - or never.
Changing Circumstances
Performing the Space Shuttle engineering analyses were NASA and contractorpe_onnel from coast te coast. Clearly, it was mandatory that a means be
provided for accurately communicating and sharing the extensive wind tunnel data
base that was to be the basis of a nationwide engineering development effort.
Purpose
For the Space Shuttle program, the engineers comprising the Aerothermodyna-mic Test Data panel proposed that all te_t data acquired would be collected at
a central point, that these data would be put in standard forms for preservingand communicating these data t6-t_etechnical elements of the Shuttle community,and that basic analyses of all tests would be performed, the results documented
and disseminated as referenceable reports, and the data be put on file for readyaccessing.
For the Space Shuttle they determined te L_ ah?e to substantiate and
certify the aerodynamic design data on tl_e basis oZ documented and available
wind tunnel data. For the Space Shuttle a comprehensive data base of both ground-based facility test results and flight measurements would be preserved as a basis
for improving future designs. The objective was to obtain optimum benefits fromthe wind tunnel test program. ....
Current Applications
That these goals were attained is evidenced by ongoing flight data analysiswork. Currently flight evaluation work is extensively referencing the wind
tunnel test data base. The aerodynamic design data base (ADDB) is a synthesisof hundreds of wind tunnel test results, all of which are documented andreferenceable.
)
t
!)
i

Data for over 527 Phase C/D wind tunnel tests are in a data bank availableto Shuttle design team members; These data are documented and the reports dis-seminated to the technical community. These wind tunnel test data have beenpreserved, documented and made widely available at a modest cost.
How did NASA manage to achieve those goals - and achieve them at a modestcost? That is the answer - they "managed" it.
_°.
COMPILING AND DOCUMENTING THE WIND TUNNEL TES3 pATA.BASE
The wind tunnel test data base is the product of highly coordinated effortsof NASA engineers, NASA and contractor test :enters, and contractor engineers
all working in the context of a syst_.. A key factor in the success of thesystem is the innovative management approach implemented by NASA in directingthese coniainedefforts. These NASA management concepts are discussed.
A particular innovation was the concept of a focal point for doc_nent-ing and disseminating test data analyses. Chrysler Corporation's Data Manage-ment Services unit, selected as the focal point, also contributed advancedtechnical and managerial techniques to the effort.
A particularly innovative and advanced concept is the DATAMAN system, thecomputer system developed and used By Chrysler forautomated data handling andco_uter graphics. Dis system is discussed, as are the organization andmethods developed to perform the data doc_nentation process. A briefdescription of some of the contributions of the data management operation tothe Shuttle design effort and an evaluation of cost effectiveness ar_ presented.
The "managerialcontributions of both NASA and Chrysler provided theessential environment which encouraged techrricaTinnovation. These managementapproaches are described as a prelude to the technical descriptions.
MANAGEMENT CONCEPTS
It_SAData Base Concepts
Major factors in the successful development of the wind tunnel test database were the management concepts adopted by NASA. A principal concept wasthat of mutual interchange of all data acquired. Another was the commitmentof documenting data analyses and disseminating data analysis reports to thetechnical community. Formatting all data to standards and preserving the data
in a central data base were also key developments. These concepts were theoutgrow_chof deliberations of a central body of managers and engineers, theAerothemodynamic Test Panel.
1215
i
t

Aerothermodynamic Te__tPanel
The Aerothermodynamic Test Panel was established as a coordination andliaison body. Its role was to pull together and provide central direction tothe diverse and multi-faceted efforts of NASA centers, the many wind tunnelcomplexes, the major contractors, and the engineers and managers of theseentities in the pursuit of test data for supporting the aerothermodynamic designof the Space Shuttle.
The Aerothermodynamic Test Panel adopted the concept of developing a windtunnel test data base, and assumed responsibility for achieving it. A commit-ment was mad_ by all parties involved to cooperate _o achieve a data base.A pivotal innovation was the decision to fully _terc6a6geall wind tunnel testdata acquired.
.Data Interchange
Each NASA center agreed to make all Shuttle data acquired in its facilitiesimmediately available to a data center. Accordingly, these data would be con-verted to standard formats and displays and distributed to all parties involvedin the Shuttle design and development.
For Phase B, all contractors participating in the Space Shuttle developmentwere to make all wind tunnel data acquired at government expense available toNASA. These data were then made available to all NASA centers and participatingcontractors. Thus, the Shuttle development benefitted from a rich cross-fertilization of data uniformly available to all.
Similarly, for Phase C/D, all data were communal property of the Shuttledesign and development team. The principals, Rockwell, the prime contractor,and NASA Centers (Ames, Johnson, Langley and Marshall) were provided uniformlyall wind tunnel test data available. These participantswere enabled to simul-taneously and uniformly view windtUn-nel-da_- transformed to standardized analysisformats...........
CENTRAL DATA BASE MANAGER
The Aerothermodynamic Test Panel selected Chrysler _s the wind tunnel testdata base documentation manager. Chrysler was selected on the basis of its
development of an advanced computer-aided design system for analyzing wind tunneltest data.
The mission of the documentation manager was to be the wind tunnel test dataacquisition/documenLation/dissemination focal point. Ch-ysler was to estab-lish standard d_ta formats and presentation formats were established to accomplisha systematic and orderly dissemination of wind tunnel test d&ta. Chrysler wasassigned responsibilities for converting Shuttle data into the standard formats,ca_pillng a data bank,,analyzing ano documenting the results, and making thedata and documents available to the Shuttle design team.
f
(
1216
For Phase B the panel assumed responsibility for ensuring cooperation ofNASA centers and of participating contractors with the data base document_ionmanager. NASA/MSFCwas the contracting agency, with Mr. C. Dale AndrewsCOR. For the Phase C/D program, the data documentation contractor contin_u_dunder NASA/JSC cognizance with Mr. W. C. Moseley, Jr., the COR. Figure l showsthe relationship of the wind tunnel test p_gram participants and the database documentation manager.
In performing these responsib_!it-Y_, the Chrysler unit continued the c_e-veloment of a unique system for data base management. The system is comprisedof a committed engineering design team, highly advanced soft.are systems aMexcellent hardware facilities, all operating in_@ccocdanc_ _iIJn_nnovativemanagement philosophies in applying advanced technical concepts.
Benefits of.t)e NASA 14anagementApproach
These concepts reaped many benefits for NASA. Principally, these wereresults of high volume data handling capability at low unit cost, benefitsusually associated with mass production. It is rare that terms associated -rith
economies of scale are applied to engineering projects. There are definitereasons, however.
The combination of the data pool, standard formatting and a central managerresulted in a synergistic high-volume data operation employing large-scale datasystems operated by teams of specialists, rThe_result.wasan-extremely efficientdata handling process with the attendant high productivity and cost effectivenessof high automated systems.
To acquire the Benefits of a highly specialized organization and _o developefficient automation, the data documentation manager, Chrysler Data ManagementServices unit, had to be equally adept in innovating and applying advanced I:_ch-n_cal and management concepts. . ...................
Chrysler Management Precepts
The management concepts of the contractor can be put in a word: service.
By Chrysler's definition, service has four aspects. These are: integrity,timeliness, usefulness, and cost efficiency.
The precepts are more than words. Their observance is mandatory because toviolate any one would be to jeopardi.zethe entire undertaking.
Foremost is concern for data integrity. Each NASA center is rightfullyprotective of its data to prevent misuse. Likewise, the user contractor is
properly concerned about being provided compromised data. Accordingly, prot_-----tingdata integrity is uppermost.
Timeliness is essential in terms of both schedule and usefulness. Hence,the data base service must speed up the user's work, not slow it down.
Usefulness is just that. The service must be an aid, not a hindrance, tothe one being served. The man using the data base must perceive the data baseas an improvement or an assist to his work.
1217
!
I
i1
Cost effici_=_z.,is reducing data analysis documentation costs and in-creaslng produc_.ity of the individual engineer....
Automation was perceived by Chrysler as central to attaining all aspectsof the service philosophy. Accordingly, Chrysler concentrated its effort in two
areas: developin_ a highly automated computer system for converting massivequantities of wing tunnel test data into a usable data base, and developing anorganization to a_-_lythe system.
Translating _ese precepts into a working system and a functioning organi-zation required exzensive conceptual innovations in both computer software andengineering operaziDns. ............
TECHNICAL CONCEPTS
Automated System
The Chrysler service philosophy is designed into an automated system calledDATAMAN. A highly integrated computer aided design/computeraided graphicssystem, DATAMAN embodies unique technical concepts which continue to be stateof the art.
The DATAMAN system is a pioneer in the qompgte__ai_ed.processof convertingwind tunnel data i_o report ready graphics. The system was initiated in 1966 asthe System for Autz_r,_ticDesign for Static Aerodynamic Characteristics (SADSAC)under the auspices of the Saturn IB Apollo program. After the system was selectedfor the data base _enagement role, the name was changed to DATAMAN to reflect theexpanded role.
The DATAMAN system is fully integrated whereby-all-data manlpulation programsand all computer graphics programs operate under a single unified system. Other
design features cheracterize the DATAMAN s)Ys-tem.These features and their parti-cular contribution to the capabilities of the DATAMAN system are discussed inthe following sections.
The Dataset - Key to the Unified System
The individual computationa_ and graphics programs are unified by means ofstandardized data fc4-mat. Communication between the generalized programs of thesystem is achieved _hrough the "dataset."
The dataset is a packet of test data and associated descriptive information.It includes dimensional data required tO initialize and index the systemcontrols. The dataset contains all information and data required for programexecution when accompanied by"specific user instructions.
1218

Communication between programs is accomplished when a program produces adataset as output. That same dataset is then read as input by another program.Hence, information is communicated via the d__taset.
Interface problems of data transfer between programs are eliminated. Oncedata are entered into the system, they can be automatically accessed for any
application - computational or plotting.
Aerodynamic Data Orientation
The dataset concept is generalized in that the system is indifferent as towhat dataare incorporated into the dataset. Descriptions of the _ata and namesof the variables are assigned by the user. However, the dataset s:ructure is
designed to accommodate aerodynamic related data.
Three dataset for_s exist to accommodate._e basic forms of aerod)namicdata; force and moment data, distributed loads data, and pressure (or heattransfer) field data. This organization of the dataset is depicted in figure 2.
The dataset forms vary essentially in arraying of the variables. Force andmoment datasets are bivariately arrayed, corresponding to the basic aerodynamic
forcing functions, aircraft attitude and velocity. The same forcing functionsapply to the loads and pressure datasets except these assume additional dimensions.Airloads datasets are trivariate - section loads distributed along a fuselage,
wing, or panel axis. Pressure datasets are arrayed along an axis, as are dis-tributed loads, and also around the body or panel. -.............
Relationships between the aerodynamic datasets are such that integrating
a pressure dataset pro4uces a distributed loads dataset. Integratinga loadsdataset results in a force and moment aero,data set.
Recall that though the datasets do take the form of velocity-attitudedriven vectors with up to 10 coefficients included_f6rEhe-force and momentdatasets), the dataset is generalized. The variables can be any-systematically
varying set of parameters or parameter matrix whose identities are assigned bythe user.
Also, means are provided for manipulating these large sets or data matricesto conform one set to another, transpose or do aTithmetic operations, or plotthe data. These means provide for flexibility and versatility in doing a
variety of tasks on large data blocks. Also, it is a very efficient means ofhandling significant data quantities becau?e these means are in the context of
an integrated system.
¢
Integrated Subsyst_s
Major elements of the automated system consist of four interrelated sub-
systems. These subsystems are a program executive, a data hdndling system, aplotting system, and a file management system. These _onstitute an integratedsystem. A schematic arrangement of the integrated system is shown in figure 3.
1219

These subsystems provide the framework for all functions required for a
system. The executive system provides the user command and control over opera-tions of the other systems. Within the other subsystems reside an array ofcallable modular programs for performing certain tasks.
Modularity
These modular programs provide the considerable flexibility of the systemand oreatly facilitate the addition of capability. This is because each modu!arprogram does only a specific task - _ specific module for a specific requicement.
What this means is a given task can be programmed into-a s-pe-ci_ic-n_odule.
Only the specialized code would be required as the existing file management pro-grams can be used to call and store the data. Existing listing and plotting
routines can be used to display results J_d,_laritymakes the system easilyadaptable to many CiFferent appl_ ations that arise.
Similarly, the user applies modules selectively to process data as req.uired.The modular programs of the force and moment data system are listed in figure 4.Note the array of categories of programs. Arithmetic, matrixhandling, inter-polation, and statistical are some of the generalized programs. Programs forspecific tasks include those for flow field and air data systems applications.This list illustrates the versatility of the system.
With modularity,the task of data analysis becomes a =dec_sition problem" -breaking the job down into a series of discrete basic arithmetic tasks. Anddoing the job in stepwise fashion enables the user to list or plot intermediateresults for checking accuracy.
Also, because these modular functions are highly automated, they are easilyset up or modified. Thus the modularity and automation of the system providefor low cost but flexible and versatile capabilit_ .........
Automated Systems
Operation of the integrated sUbsyste_ is automated to a high degree. Thedesign concept is to relieve the user of all repetitive burdens possible in favorof automated operation. Also, the system is'designed to be transparent to theuser.
The modularity enables the high degree ofautemation. As each module isrestricted to specific tasks, automating these functions is signified. Accord-
ingly, applying the automated modules is simplified.
For computations (for example, say, interpolation) the user calls the inter-polation program at the executive level. The only information required of theuser is to name the identifier of the dataset to be interpolated and supply anidentifier for bhe resultant output dataset and the values of the Rew variable
arrays.
1220
i,!
I,i
J
!
)
m

Similarly, for plottinc, -electing a particular plot module calls for aparticular preprogrammed p]cz --_at. The only usor information required isthe identifier of the input dataset. Plots will be generated automatically forall the variables in the dataset on ;elf-scal_ grids, a single frame on the page,with.the axes labelled by the variable names imbedded in the dataset.
Options can be introduced by the user to custom tailor his plot to hisparticular needs. These include designated grid increments and ranges, framelayout, custom axes labels and plot titling.
The preprogrammed highly automated features of the system contribute signi-fi-cantly to the labor saving attributes of the system.
Data File Subsystem .*
File management functions _re automated so that all output data of a pro-gram module are filed automatically for retrieval. Similarly, automated fetchoperations are integral to each modular program for data input.
A key feature of the system is that data once on file are not altered.. Fora computationoparation, data from the file are read into core but the data onthe file re_in. Operations on the data in core result in a differen_ yalued
output dataset which is written out onto the file adjacentto-theo-r{ginal inputdataset.
Thus the input dataset and the output dataset coexist on Lhe file and areavailable for comparison or checking. This feature provides an audit trail andis invaluable for verifyirg the accuracy of the analysis.
The file management system relies extensively on ranckxn-accessingtechniques.A file directory of data identifiers and the correslx,ndin@ absolute addressenables the efficient storage of large variable length data files.
Additionally, two other design features characterize the operation of the
DATAMAN system. One is a heavy reliance on default mode of operations the other,a no-fatal-erroroperation feature.
Default I_odeOperation
Wind tunnel test data are very individual by nature. No means of preprogram-ming a data analysis algorithm is known that is universally applicable to anyand all wind tunnel test data.
However, a generalized program with a nu_r of options can do very well in
satisfying the various analysis requirements. The DATAM_ANsystem is extensivelyoptioned, and the options are exercised generally h) default.
1221

This means that the pr_;,_m is desi=ned to perform as many tasks as p_ssib_eand the user must exercise an option to stop an operation. Fhe bias is deliberate
and is to encourage the user to get the aost out of the system, trading off computerresources for man effort to increase the productivity of the engineer.
No-Fatal-:_'rror
The system is designed to oparate wi:h min_jm fatal errors.....I___he_ev.en-t-of a not_inaldata error, missing data, da:_ out :f range, _r an impreper in-struction, the system generally _ill make note of the discrepancy and continu_.
The objective is to acquire for the user a c.on_leterun-through of his taskand acquire a co_lete set of diagnostics and er_F_ssa_e;. To stop a run ateach incident, for large data volume runs, is not conducive to obtaining timelyresults.
With no-fatal-errors, a job runs to c_npletion and the user with the aid ofdiagnostic messages debugs his _etup and resumes processi.lg. This feature con-tributes to the productivity, the throughput,of the systegain a large data volumeenvironment.
System Benefits
These subsystems and system features are designed with the service concepts -data integrity, timeliness, usefulness, cost efficiency - uppermost. How thesesubsystems and some other design features serve these precepts is described below.
Data Integrity ...................
All program operations are under engineer c_n,trol _ro_Jgh the program execu-tive. Data manipulations and graphics are done cfllyon engineer command.
No potential runaway "black box" functions are-_rmi_. All data mani-pulations are discrete one step operations.
Verification is attained by automatically preserving results of all datamanip_lations on the file. These results are accessible for reading or plotting
for v_sual verification. Thus, there is an audit trail which enables the engineeror manager to review or check data manipulations step by step.
Data Timeliness
The system is designed with throughpu_ as a _r_jorcriterion to ac_Jmalishtimeliness. Throughput is the result of a highly interrelated system.
Inte_elatedness means that, for all functior_ (input, operations, storageand retrieval, output), the output of one f_nction is, through automation, theihput of another. This automation feature eflableslarge jobs comprised of suc-cessive tasks to be set up and run with minimum eT_psed time.
1222
l
_T ,. o
Data Usefulness
Data to be meaningful must be completely identified. All elements of iden-tification must be associated with the data - proper nomenclature,source andreference characteristics tlength., areas, Eoment references)
The dataset provides for associating identifyinginformationwith a collection
of test data for a given configuration. The associationis accomplished at thetime of data entry. From initial input, all identifyingdata descriptions andnames automatically appear on all outputs (plotsor tabulations). Thvs_a)3__)_ _ ......put is completely identified for proper application.
Productive and Cost Efficient Process.,
The dataset also provides for the syst_ interrelatedness. This enables theproductive throughput capability. The detas_t contains all matrix dimensionalinformation required to initialize a program for operating.
Each data manipulation program generates initializingdata and imbeds itinto the output where it initializes the next successive program. Thus, oneprogram is enabled to communicate to another without user intervention, therebyachieving the highly productive labor-saving automated system operation.
......................
Heavy reliance on default operating modes is another system feature. Thedefault mode enables fast job setup and executionwith a minimum of input, andattendant labor saving. Another key system design concept in achieving maximumthroughput and high productivity is the no-fatal-errorconcept.
The system is designed to continue operating to completion when errors aredetected. This is to overcome time consuming consequences of jobs terminatingbecause of sequential failures. Thus an engineer is enabled_Q_eYalu_te..theentire job in a single pass, saving considerable time and effort.
The labor saving automated systems not only increase engineering productivity,but contribute significantly to compressing engineeringscbedu!es....Thus theproductivity increases extend far beyond the cost savings of reduced manhoursalone.
Need for Right Methods
The DATAMAN computer system has demonstratedwell its considerable powerInd versatilityand the capability to handle high volumes of data efficiently_nd quickly. However, aswith any tool,it needs to be used properly.
It has been stated that the DATAMAN operation is a mix of men, machines,_nd methods. The _ATAMAN system is the machine. To be effective the machine,ust be used by the right men using the right methods.
1223
4
"5
JJ
F
OPERATIONAL CONCEPTS
Best Use of the System
To realize the benefits of the DATAMAN system it must be used in a way to
exploit its capabilities. Hence, the means of using the system have been de-
signed with the same care and attention to detail as with developing the system.The operational concepts and the resulting functional organization are describedbelow.
Operating Strategies
The Chrysler service philosophy is embod4ed into the operational c_le interms of operating strategies and practices. The same philosophy is carried
over into the organization which conducts operations.
To apply the precepts of integrity, timeliness, usefulness, and cost effi-ciency to the operations, a disciplined and organized function is required.
That means simply that the work must be done in a methodical, systematic manner.
The DATAMAN strategy is to consider the wind tunnel d:ta analysis and documenta-
tion task as a process, as in manufacturing operations.
As a process, systematic organized methods can be applied to execution.The types of controls associated with process operations can be used to monitor
the performance, quality and costs aspects of an engineering operation.
The application of the process concept to the task of wind tunnel dataanalysis documentation is the basis for the method of operations. Also, it
provides the rationdle for deveioping the functional organization and the manage-
ment systems for controlling the process.
Process Concept - -
Process is a term usually applied to procedural man:Jfacturing or chemical. :: ;_ ; _
operations. Engineering analysis, on the other hand, is a series of heuristiC! _ :: ;free association activities of analysis and synthesis. .....
These free association activities remain in the DATAI_N process. But these .......
creative activities are implemented by using the computer system as a mu_ti:pur-:-;-
pose tool to automatically perform the drudge work of data handling and data
graphics.
In doi_g the work, there are certain procedures performed that are commonto all tests, regardless of the diversity of the test. This collection or
sequence of common procedures becomes the process and is defined as series ofdistinct steps, or stages. In this context the analysis is equivalent to a
manufacturing process; the work is done in well defined stages. At each sta_e,
as the analysis becomes more complete, it takes on "value." As the wOFk pro-
gresses through the system you have "value added:' until you acquire the completed
product.
1224

Accordingly, the test data analysis process has distinct steps, each ofwhich has an output. And the output is input to the next procedura in the
sequence• Work Is done on the input to increase its va|ue. Thes,_ _rocedures,
or production activities, of the DAT#_AN process and the cerrespondinq work-
in-process outputs are shown in figure 5.
The process is essentially a systematic procedure for bringing together the
necessary inputs and activities required to convert wind tunne_ test data tcadocume_ted analysis. This is the DATAMAN system which, though flexible, re-
quires a high degree of discipline and methodology, which are brought about
th,_ugh organiz,._;un.
• 4
ORGANI ZAT I ON
To systematically process wind tunnel test data into documented engineeFinganalyses requires an organized and disciplined effort, The organization cor-
responds to the process functions in that the specific organizational elementsare responsible for specific production phases.
Thus, the operating elements have well defined task assignments and arestaffed with the corresponding specific skills. The organization is comprisedof three operating elements: field engineering liaison, engineering data opera-
tions and computer systems.
Liaison is responsible fer the preparatory and preprocessing phases. Thisincludes all customer interface. This involves data coming into the organization
and output going-to the customer.
Engineering operations is responsible for the production phase. Operations
performs the hands-on task of running data through the system to generat_ computeranalyses and gra?hics. Operations also does the documentation and data banking, . •
Computer systems is a support function Computer sysi_ems is responsible for :: ;;_:;:-:-.
all interface with the computer faciiity. It provides the systems for the line - .....
units: the preprocessing system for liaison to convert test data Jr.to standard .................formats, and the analysis system for operations to generate the applications _::: _:: :::
data. Computer systems also supports the data base systems and the project ,__n-_._LLiLZiLL._L___
agement systems. ..
Details of the functions of the three operating units are presented in the
Following sections. The organiz_Lional elements and the corresponding production
responsibilities are illustrated in figure 6.
1225

OPERATIONS
The operation will be described in terms of the activities and the contrib-
uting functional 6rganization. The outputs of each of these activities will bedefi ned.
Quality assurance i_ an important element of any producing operation.And so it is in the DATAMAN operation. These quality control procedures willbe detailed.
Also, tracking and monitoring systems and procedures are _nployed extensivelyto maintain schedules and control costs. These will be presented.
The relationships of the tasks, the outputs, and the quality assurance mea-
sures are shown in the network chart of figure 7. From this chart it is seen that
the liaison unit begins the process by the planning and preparation a_tiyity.
Preparations
Liaison begins preparatinns at the time a test is scheduled. Test data
and analysis requirements come through liaison which is also responsible for
compiling test data infcrmation and developing analysis and graphics requir_ents.With these inputs liaison also develops the test data reformat specifications.
Preprocessing
Liaison, using the preprocessor computer system, converts the test data
from the facility format into a.standard DAT#_AN format. Liaison forwards the
standard formatted data and the analysis execution instructions to engineeringoperations for cor)tinued processing."
Computer Sy_i_ms Support
Two data handling systems comprise the production systems. These are the
preprocessor, the system which converts test facility data tapes into standard _ __ .:_ -i_-DATAMAN formatted tapes, and the DATAMAN system, which is the integrated data ..... ._
analysis system. Computer systems works hand in hand with liaison and operations " " jto keep these systems in a high state of readiness in anticipating and prepar-ing the ongoing test data handling requirements. "
_ _ -_ -;-_ -:-_
Computer systems maintains the systems to keep them current with the Ongoinghast facility upgrades and improvements. Additionally, with a commitment to
automation there is always room for improvement - ways to save engineer time,save machine time, or improve the turnaround. So systBT,S programmers have a
continual challenge to improve the system in terms of capability, cost reduc-tion or productivity.
Preliminary Analysis
Taking the reformatted test data tape and the analysis instructions, engineer-ing operations conducts operations for producing the required data analysis and
1226
I
v_
i

computer graphics. Operations engineers do the hands-on job of turning the test
data through the DATAMAN system.
Much of the work is checking. Analyzing the computer system diagnostic
messages to make certain that good runs have been made and carefully evalu-
ating the graphics and tabular data to make certain that the data results arevalid and conform to customer specifications are part of this function.
When data results vary from plan, operations revises the analysis instruc-
tion set to correct the variance. For significant discrepancies, operationsconsults with liaison and the customer for direction before modifying the
pregram instructions.
The operations engineer iterates the job to refine it to achieve the analy-
sis and plot specifications. When satisfied that the analysis results and
graphics are as specified, operations sends the output to liaison for review .
and forwarding to the cusLomer.
,@
Final Analysis
Frequently the data will not behave as the customer planned, or the
customer discovers something about the data that requires different treatment
or additional analysis.
This is'standard operating procedure and is anticipated. The changes thecustomer desires are incorporated into the analysis instruction set and the job
is recycled. The instruction setup is very flexible. Changes can be handled
as rework or as add-on.
Operations will iterate the analysis/review cycle to satisfy the analysis
and presentation requirements. Final confirmation is supplied by the customer.
Documentation Phase
Liaison is respensible for collecting the customer documentation input.Much o= that comes from pretest documents - test plans, objectives, model
information. The test engineer supplies commenta_ on test particulars.
Standard facility descriptions are utilized.
Operations compiles the report, produces final computer graphics, complete ! _................ ; -. .
with plot indexes, and integrates these and the liaison input into report for-. :_ ..... :mat. Editing, final typing and proofreading are all performed by operations.
Documentation Control
1227
Report numbers a_e assigned by operations. Two report n_ers are assigned.One is the internal document number. The other nunl)er is the contractor repo_
nun_er supplied by NASA. The reports are logged by STIF and listed in the STAR
system by the contractor report n_mber.

:Document Distribution
Report copies are sent to designated members of the Shuttle design team.Participating NASA centers and the prime contractor are provided all documentsfor master files.
Reports are also sent to assigned NASA and ccatractor personnel according tothe particular _pplication of the data. For example, reports on orbiter heatingdata and ascent vehicle stability and control data will have different distributions.
Distribution lists are provided by the contracting officer's representative (COR) whoprovides overall control of the distribution.
STIF.is provided a master for further distribution on microfiche. Also,limited quantitites of reports are maintained locally for emergency distrib_io_again at the direction of the COR.
Data Bank
All the data are archived. Test data go into the data bank. Report materialmasters, and notes go into archives.
Once the data are in the system they are always available for ongoing applica-tions. All the test data and analysis data are maintained on magnetic tape. Thedata are easily accessed long after the analysis is completed. These are accessi-
b]e for new applications, to compare to other tests, or to review the analysis.
Operations maintains thC data bank. The data bank is always in a state offlux. It requires updating for new test data. It also requires periodic main-
tenance to validate current files and insure backup files. Tape library recordsare continually updated to reflect current data bank contents.
Test-in-Process Status Reports
Operations issues monthly processing status reports so that all involved _always know the status of any tests - whether they are still in process or whether ; :they are completed and in the data bank. Once the data enters the system,everyone is continuously made aware of its status.
.. _." z. _ _
Data File Contents Reports
After a test is documented, it is recorded in the Data File Contents Report.This report lists all tests and corresponding documents for completed tests.
These two documents, the Te_t-in-Process Status Report and the Data File Con-tents Report, are distributed throughout the Shuttle community. These reportsprovide current information on all Space Shuttle wind tunnel tests that have beenconducted, the test particulars and the status and availability of the data.
These report contents are illustrated in figure 8.
1228

Quality Assurance
As a test-in-process moves through liaison to operations, then back to liaison,
Gua]ity reviews are _de at each interface. Every time a work-in-process packageis handed over to the next production phase, a quality review is made.
In-process quality checks result in minimized rework. Also, it is moreefficient to inspect the work while it's evolving with reduced risk of over-Ic_king a discrepancy.
iInitial Quality Review
The first quality review occurs at the first interface between liaison andoperations. Before liaison releases reformatted data, the liaison en-gineer carefully compares the refonT_tted data to insure an accurate translation
and to insure compliance with the run collation specification. Also, he confirmsthat the analysis instruction set is consistent with data as collated. On com-pletion, the output is released to operations as certified input.
In case of a discrepancy, a data discrepancy report is issued. This is aquality control document that becomes a permanent record of that test file.
Second Quality Review
As operations produce analysis data and presentation plots, they thoroughlyreview them for engineering accuracy and compliance with customer requirements.When satisfied, they release them to liaison for a final review and relay to thecustomer.
Documentation Quality Check
The final quality review is conducted at the documentation interface. As
final analysis and graphics are produced, they are incorporated into a datare.mort.
Before publication a double review is performed. The document is reviewedby both engineering operations and liaison, once before the report is sent tobe printed and once after the report is printed. The review before printing isto insure compliance with customer specifications and compliance with sound .......... ....
engineering practice. The after-printing review is to insure that the report _: .was printed "as prepared" and to insure legibility. _
Tracking and Monitoring Work-in-Process
Tracking and monitoring a test in the documentation process is done usinga test status log system. The summary status conditions are reported monthlyby milestones. Costs are tracked and collected according to function and task.
1229
.... _". :- -_i
!
T
|
J!+

Test Status Log
For each test a history is maintained detailing significant events in the
processing life, good or bad. Dates of milestone events are recorded.
An automated status system develops a comprehensive status hi:tory reportfor all tests in the system. Also, it provides a milestone summary for all tests.
This information is provided to the Shuttle conTnunity for data availability aware-ness.
Milestone Summary Report
The tests are categorized by milestone status in the processing cycle. Atypical status summary report is shown in figure 9. Progress of a test is ""tracked by monitoring its movement from one milestone status to another.
Test status fluctuates between active and inactive as holds develop for inputsor for response to outputs. Status condition is evaluated by comparing the move-ment of a test status to planned norms which allow for holds.
It is difficult to establish norms as all tests are different. But ex-
pectations can be established for tests of similar complexity. Therefore, foreach test an expected complexity level is established. The complexity levelestablishes the planning cycle norms and the budget plan for that test.
Cost Collection
Cost trackino comes f._m a companic._ system to the status monitoring system.Liaison is responsible for initiating all management controls. Tracking begins
at the time a test is scheduled. At that time the test is assigned a test ID,
a unique two-character identifier, which is imbedded in the label of everydataset.
The identifier preserves uniqueness for dataset names in the data file and
prevent_ wrong oata from being accessed. Liaison maintains a master log ofID's assigned and those to be assigned. The master log is prepared in advance,w_?n ID preassigned to facilities and assigned as tests are scheduled at theFa,.ility.
Work Breakdown Structure
The work activities, the tasks that are performed by liaison and operationsand the support provided by computer systems, have been described. Theseactivities define the work breakdown structure.
The WBS task is related to a particular test through the test ID. The
combination of WBS number and the test ID is a charge number is the basis for
a cost collection system. The charge number associates the test being worked
on with the kind of work being done. Daily time charges are compiled, collectedand reported to provide ccst analysis data for the work-in-process.
1230
,%

Task and Support Work
The WBS is two-tiered. One tier is for measuring effort expended on a specifictest. The other tier is fcr n!easuringwork expended in support.
Task effort is defined as work on a specifically identifiabletest or task.Support effort is the myriad of activities from coordination meetings to loggingdata tapes to archiving accumulated test files.
Data base management tasks (maintaining the data base and servicingaccess
requests) are also classified as support tasks, as are the test status reportingand project reporting tasks, the standard station-keeping chores that attend an
organized activity.
Additionally, the automated DATAMAN systems require support personnel andsupport effort _o maintain the syste.'5. Support effort is also utilized to add
new capability to meet user needs or improve efficiency.
The process operation also requires a highly coordinated stream of inpdts.These coordination tasks with the various data sources are support activities.
The WBS is further divided into subtasks. Manhour expenditures are collected
by function (liaison, operations, or programming) and by level (task or support,including the specific subtask). The WBS subtask matrices for task and supportlevels are shown in figure lO.
Cost Control
Cost control is aided by awareness of the distribution of manhour ex-
penditures. Also, this knowledge provides guidance in determining need forimproved or additional automation. A third contribution Of the cost collectionsystem to management-is that cost data provide essential forecastingandplanning information.
Similarly, computer resource costs are compiled according to task activityand test ID. Knowing the manhours and computer resources expended provides abasis for controlling current expenditures and forecasting future costs•
Knowing what test or what task is consuming manhours or computer timeenables the manager to spot opportunities for improvement, either in personnel
or procedures or in systems.
These management tools, in conjunction with the automated DATAMAN systemsand systematic operations, have enabled Chrysler to provide a highly productive,low-cost data analysis service in behalf of the Space Shuttle.
These contributions to the Space Shuttle design effort will be examined in
detail in a following section. But one more vital element in the productionprocess will be detailed and that element is the computer facility.
_231
• 4

COMPUTER FACILITIES
CapabIt co_uter facilities and facility operations are essential to success-
ful data management services. The NASA Slidell Computer Complex is the capablefacility utilized by DATAMAN services.
Management Phi losophy
A fundamentml reasoa why the Slidell Computer Ccmpiex is termed capable isthe resident NASA management and their management philosophy. The managementphilosophy, in a word, is service.
Because of t-heir particular circumstances as a satellite center servicingthe remote sites of Michoud and the Mississippi Test Facility, the NASA manage-ment clearly perceives its primary duty as providing service. The service
philosophy is manifested equally in the two major operating elements, excellentfacilities and effective operators.
Computer Equipment
UNIVAC II00 series mainfra._es are the CPU systems used for data base
operations. These systems have been continuously upgraded beginning with the
advanced ll08 (Exec 8) system in lgTO to the current top line system 1100/82.
Graphics
The computer graphics device in use at the Slidell center is the Infor-
mation International "_ 27 _j_tem. Coupled _ith the FR-80, which produces fiche,is the Xerox 970 copier, which produces hard copy fro_ fiche.
The combined capacity of the FR-80/Xerox is measured in tens of thousandsof frames daily. This is adequate for data base operations.
Peripherals
Careful management attention to seemingly mundane incidentals contributes
significantly to facility efficiency. Two of these lesser items which contributeare peripheral systems.
One periphera] provides for automated job instructions. The other providesautomated plot tape labels and instructions, including those for multi-reel files.
These peripherals, long in use at SC,C, effectively automate the job control
operation and overcome a production bottleneck that continues to plague manycomputer sites.
1232

Facility Operations
The NASA management influences facility operations in quality day-to-dayservice and fast response priority s_-rvice in _ergency situations.
Management enforced high performance standards imposed on contractoroperations provide _he right climate for service oriented data base operations.Rapid NASA management attention is directed to the rare operations breakdown-Similarly, priorities are readily granted on proper justification for unusual or
schedule-critical situations.
The efficiency of the SCC computer facility is attested to by the factthat no si'gn,;ficantdelays in providing data base services have ever been attri-buted to lack of computer support. This record has been established while thefacility simultaneously supported data reduction for Skylab operations, ExternalTank development, Shuttle engine test programs, and Shuttle flights.
In addition to an efficient facility, another key factor is the support ofthe resident NASA management. These gentlemen collectively and umstintinglyhave seen to it that the DATAMAN operation received proper suppor_cand that this
was done in a highly responsible, uncompromising manner.
EVALUATING DATAMAN OPERATIONS PERFORMANCE
Automated data systems, a skilled, integrated organization using systematic
procedures, constitute the DATAMA)Ioperation. How effectively did these elementsfunction? What was accomplished and how well was it accomplished?-
Recalling the Mission
The primary mission of the DATAMAH operation was to document and disse_natewind tunnel test data analyses. To act as a central clearing house for all windtunnel test data, to co_form the data to standard formats and to make it available
to the Shuttle team were other aspects of the mission.
As the high volume DATAMAN system capabilities became known, secondary
responsibilities developed. These were special considerations, usually sche4ulecritical tasks where the special system capabilities were sorely needed. Theseactivities were reduced, however_ in 1977 because of budget constraints-
Performance can be measured in terms of shear output volume. Another per-formance indicator would be productivity; that is, what was acco_plished withresources available. Also to be answered is how well the system responded to
the varied demands of the design effort.
These performance parameters are provided below.
1233
..... -.i-
:-!
JE-
{
F

Data Documentation Results
Since January 1973, DATAMAN has handled over 527 NASA series number tests.
These correspond to a total of 57,800 wind tunnel occupancy hours (through 1979),conducted by the prime contractor and by NASA in independent tests.
For these tests over 800 data analysis reports will be published: consideringthe work-in-process. These reports will involve approximately 500,000 pages.Additionally, 348 special ,'equeststudies were conducted and these results docu-mented. The total documents then will exceed I]48.
In addition to documented analyses another output was provided the Shuttlecommunity. This was the advance data releases, principally preliminary dataplots. The purpose of these preliminary plots was twofold, one, for timeiiness,
to make the data readily available to the user for advance applications, andthe second to involve the user in evaluating the data, for data integrity.Over three million preliminary evaluation plots were delivered.
These significant output volumes, taken at face value, affirm the overalleffectiveness of the Chrysler data management operation. An indicator of thesystem productivity is a comparison of the task load and the correspondingmanning. This comparison is presented in the following section.
Task Loading
Task frequency, the number of new tasks submitted per month for handling,was highly irregular hut increasing throuah 1976. The average task inputfrequency during this period exceeded 12 per _nth, and for three quarters of1976 it averag2d 15 per month.
The corresponding manning level for this period averaged 23. Task fre-quency and man levels are shown in figure II. The task load per _n thenaverages out to be a new task every _o months per man. The implication is
that with the system, a man completes a task every two months. This is a roughbut reasonable indicator that the system is cost effective.
The inference is that a man analyzes a wind tunnel test, produces prelimi-nary data plots, then final data plots, and documents and publishes the resuits -in two months. That same man is also performing the liaison, system main-tenance and data bank station-keeping duties.
"v
Z
System Versatility
Volume and productivity are not the only factors, however, in evaluatingsystem performance. The Shuttle aerothermedynamic test program involved a varietyof aerodynamic and theriodynamic tests for a variety of configurations. Theability to handle the wide range of conditions encountered is a measure ofsystem effectiveness.
1234
. ¢,,j.
Aerodynamic tests were conducted fcr every Shutzle conf+guration (ascent,external tank, SRB, orbiter entry, landing and mated carrier_. These configura-tions were exposed to a host of pe_urbations - separation, rroximity, componentloads, pressure loads, probes, boundary _ayer rakes, air data system devices,blowing RCS jets, exhaust plumes, T_aps, and flexible and ri_i_ controls•
For aerothermoheating, similar tests were perfm,-medon zhe ascent vehicle,external tank, and SRB, both separa=ed _nd in proximity. The tests includedinterstage heating, orbiter entry, t:Je _eating, and hot _et Zests, pressuredistribution tests, and obtained pressu_ distributions gor ,ings, panels, flaps,control surfaces, nozzles, tail cones, external tank, an_ in=erstage.
All of these varied kinds of Cata were handled with zhe 3AT_MA_ system.The capability of the system to contend with the array of configura=ions, thevaried and extensive types of data and equally varied and ex:ensive applicationsdemonstratesthat the DATAMAN system is exceedingly versatile.
The demonstrated performance verifies that the concEp_ of the generalizeddataset, a means of organizing any systematically varying collection of data,and the generalized modular data handling subprograms are sound concepts thatwork exceedingly well, and they work in a most challenging n_mber of situations.
Special A_I ications
As the wind tunnel test program marred, the test configurations becamevery involved and complex. Extensive pressure measurements involved thermo-couple layouts, instrumented panels, mu1_iple-balance models, _nd separation/proximity tests.
Essentially, large quantities of data were being taken. £chedLles weretight, resources were scarce and available manpower resources of the prime con-tractor and supporting NASA centers were being taxed to analyze and apply thedata within the tight program schedules.
DATAMAN operations was authorized by NASA in mid-lg73 to assist the primeand support group_ by applying the automated data systems to perform specialdata applications tasks. The need was so great and the DATA_AN system capa-bility so useful that by 1977 the special task load was larger than the testload.
Examining the list of special applications re{eals the range of DATAMANinvolvement. Virtually all the design areas using wind tunnel test databenefitted. These areas were the aerodym_mic analyses, aerodynamic loads,aerothermodynamic analysis, air data systems, aero design da_ book development,RCS studies, and local flow. An extensiYe but not exhaustive list of variousapplications is compiled in figure ]2.
The list shows the applications of =he DATA_N syst_, _Jt it does notshow the time frame or schedule considerations. Several, if not most, of the
applications were in response to extremely time constrained situations insupport of critical program milestone s_edules.
123E

At the end of 1977, budget factors caused a reduction in the level of special
support. Funding constraints forced a choice between continuing a very effective3nd valuable contribution to the ongoing design effort at a high level but jeo-
pardizing the continuation of the mainline test data analysis documentation anddata base effort. The analyses documentation and data bank service were thepriority choice. As a result, the special request support was severely re.duced.
Special applications contributed significantly to the Shuttle design effort.These contributions were pervasive extending to virtually every design area whichutilized wind tunnel data. A few samples are given to illustrate the range of
applicatiJn.
Aerodynamic Analysis
A typical data ,bankapplication is illustrated by the comparison curves ofwing/elevon coefficients for various tunnel entries shown in figure 13(a).Datasets containing outboard hinge moment coefficients for four different testsof similar configurations have been retrieved from the data bank for operations.
These coefficients have been interpolated to c_mon Mach, pitch, sideslip,and control surface deflection conditions. The results have been comparison
plotted for evaluation.
These presentations enable the design engineer to quickly assess therelative data merits and expedite the analysis.
Thermodynamic Analysis
A data presentation method for quickly assessing interference heating effectsis illustrated in figure 13{b).
Heating distributions are presented for
l) ET alone
2) ET in the presence of the orbiter and SRB's
3) Theoretical heating for the ET alone at the given testconditions
4) Interference to undisturbed heatin_ ratios, hi/hu, for test to theory
and for test to test.
_iotethat these data are a mix of measured rates and theory base computedrates.
The heating rates for undisturbed ET are presented with the rates for theET in the presence of the orbiter. Also presented is the conq_utedratio of theinterference data and undisturbed (hi,hu).
1236
Localized areas of high heating can be quickly identified by scanning thehi/hu display. Thus, design engineers, after rapidly identifiyingpotentid3 problemareas with the aid of the displays, are enabled to concentrate effort on soivingthe problems.
Pressure Load Integrations
Computed delta pressure increments across a ruddeF panel presented infigure 13(c) show the chordwise aerodynamic loads on a rudder panel.
These load distributions provide first order esti_tes for designapplications.
Tntegrated panel pressures are integrated to produce loc._!loads. Thedistributed elevon panel load variation with angle of attack is presented infigure 13(d).
The Mach number crossplot of the same elevon distributedload is presentedin figure 13(e).
These two presentations of local loads enable the designer to rapidly deter-mine potentially critical load conditions.
Wing pressures are integrated to obtain wing panel forces and _x)ments.Figure 13(f) shows a wing root normal shear force carpet plotted for a pitch-sideslip matrix.
This matrix displaj visualizes component forces enabling the designer to rapid-ly assess the data for critical wlng loads.
Demonstrated Utility
These selected samples indicate the ability of the system to t_ndle appli-cations of a wide range. The versatility is extremely useful in fast response,schedule-critical situations.
The system is demonstrably versatile. It is capable of very high volumeoperations. It contributes significantly to increasing engineering productivity.
A complete assessment of +.heDATAMAN contributions must include consideration
of cost. What did it cost to provide these contributions,and was it worththe candle?
F
f
12]? ' -

m
• - .
i
COSTPERFORMANCE
What has it cost to analyze and document the wind tunnel test data and to
p_vide th,e data bank services? For perspective, an equally important questionis how much it has cost to acquire the data being analyzed and docLm_ented.Accordingly, data analysis and documentation costs are presented relative todata acquisition costs.
Assessments of input over output provide direct cost parameters. DATAM_Nmanhours and contract costs are the input. Data reports are the output. Thedistribution of manhours for the various production tasks provides insight onthe productivity of the system. Therefore, an analysis of the manpower utilizedis presented.
The cost data presented substantiate the claims made for the DATAMANcperation; it is an efficient system, and it does provide a low-cost means ofdata transfer.
Wind Tunnel Test Program Cost Estimates
Estimates for contractor model fabrication and estimated tunnel occupancy costs_re $73.3 million through 1979 (reference 2). The total occupancy hours are57,aoo for tests processed by the DATAMAN system. These hours reflect 21,600occupant:,hours logged by NASA in independent efforts. No cost estimates areavailable for the NASA independent effort.
Note that the cest estimates are partial costs only. No manpower costs areincluded for model design nor for test planning or test conducting. Neitherare any _ASA manpower costs included.
Baseline Reference Costs
Model costs and occupancy hours, though they do not reflect tota_ test
program costs, are reasonably well behaved parameters for planning and estimatingpurposes. Accordingly, cost ratios of data analysis documentation costs show that
every contractor dollar expended for model fabrication and tunnel occupancy re-quired an additional lO cents to be expended for data analysis documentation, orabout one dollar for data analysis documentation for every $10 the contraCtorexpended for model fabrication and wind tunnel occupancy (through lg7g).
The corresponding manbour factor for data analysis documentation (the nu,W_e:-of manhours required per tunnel occupancy hour) is five. For every wind tunneloccupancy hour, five manhours were required to place the test analysis docu_nta-tion in the hands of the technical community.
These _actors are for purposes of perspective. Perhaps a more reliableindicator would be in terms of the output; namely, the data analysis, corres-ponding documentation and the data bank services.
3e
!
l
°
t
4
i

Inpbt Over Output Factors
The total projected nurturerof NASA series nu_er tests to be handledexceeds 527. These, in turn, resulted or will result in approximately 800
data report volumes. Additionally, 348 special analysis tasks have also beenperfor_d and docuTnented.
Average contract costs for these I148 documents were $7,700 per documentfor the period 1973-1983. !n tens of manhours, approxin_tely 275 manhours, orabout I-3/4 n_n months, were required per report Jocument.
Note t.hatthes_ cost parameters include not only the production costs ofthe data analyses, production of graphics, documentation and distribution, butincluded also the field liaison support and the computer pregraming support.Also provided for the same cost were ancillary services which ;ncluded the ex-tensive cataloging, status reporting and data base _anagement function_. Filereleases of data reports, data base tapes and preliminary plot packages werealso continuing activities in moving analysis data from wind t_nnel to user.The costs reported include all these services.
Note that these ere contract costs. Facility costs _re not included.These include computer services and occupancy costs. Occupancy costs areoffice and utility costs. Occupancy also includes printing s_rvices of agovernment printing office field shop.
The distribution of costs between the data graphics production documenta-tion and data base management activities can be seen in the WBS breakdown pre-
sented in the following section.
W_S Manhour Distributions
Manhour allocations between the various WBS functions are shown in figure14. These allocations show where the 275 manhours were exGend_-dto analyzeand document the average wind tunnel test.
The spread of effGrt between the production activities shows that theprincipal effort is data operation). Note the relatively low effort requiredfor documentation. This is because th_ output of the automa+_d data operations_ffort, the computer graphics and computer-_enerated plot indexes and legends,is incorporated directly !_to the document.
Note also the division of effort between twu categories, task effort and
support effort. The data base management functions and the status reportingfunctions are support only. The production functions also involve support,however.
The highly automated, highly specialized p. requires expenditures ofeffort to maintain the automated systems and to c ,_:..natethe work flow toprevent bottlenecks in a high volume operation. These costs are co_iled andidentified as support costs. The hours identified as task are those expendeddirectly on moving data through the sy:tem ond ob_cth.-door.
1239

ORIGINAL PAGE 19
OF POOR QUALITY
Just cow effective, then, is the DATN_AN system if it requires such support?The answer is, very.
What _ight appear to be buzzwords or cliches are words that accurately
describe a throughput oriented process using a highly automated analysis system.
The result is a high quality product that is delivered in a timely manner,a very useful product which saves money. A conservative estimate places thesavings in a range of 2-4 over alternate techniques.
SUMMARY
The wind tunnel test data analysis documentation effort has contributed
si:nificantly to the development of the Space Shuttle. The technical design and
development of the Space Shuttle has been materially enhanced by the ready
availability of documented wind tunnel test analysis data. Additionally, theDATAMAN operation has aided the Space Shuttle design team through timely de-
liveries of special data analysis to support schedule-critical program milestones.
Summarized in the following sections are the major high]ights of the windtunnel test data base effort and advancements and contributions, management and
technical, realized as a result of the DAFAMAN systems a_J operations.
NASA Management Developments
NASA centers exhibited a high degree of c_operation in participative inter-
change of the data via the data base. The NASA centers also benefitted, by,theunprecedented ready uniform availability of useful data.
NASA _nagers also demonstrated uncommon leadership in keeping the data
base function an independent and thereby viable operation. Correspondingly,
the contractor operating on service based principles provided a beneficialhighly responsive service.
Technical Developments
Attaining the data base was the result of a significant number of conceptualtechnical imnovations.
Central to the data base service is the advanced computer-aided design/graphics
DATAMAN system. The ccnceptual design of the system and the high degree of sys-tem integration remain unduplicated.
The engineering productivity increases realized because of the system capa-bilities resulted in an unprecedented availability of analyzed test data to thedesign team (unprecedented in terms of both schedule and volume).
|
l
1240

Organizational Developments
The very productive automated DATAMAN system enabled the analysis of windtunnel test data at an unprecedented rate and volume. Adopting high volume.production methods to utilize the system capacity resulted in an engineeringanalysis organization resembling a production organization.
Similarly, production--typemanagement controls and systems and proceduresenhanced operating effectiveness and abilities to operate in fast turnaroundschedule-critical modes.
Data Awareness
Another result of the data base system,was continuouslyavailable awarenessof the existence and availability of the wind tunnel test data acquired. Thisinformation enhanced (optimized) the overall usefulness of the test data.
Data Availability
The most important result of the data base function is that the data werereadily awilable and accessible by the Shuttle design team. Adhering to theoriginal concepts, the test facilities consistently provided to DATAMAN operationstimely test data for interchanging.
The DATAMAN operation in turn rapidly converted these data from the varietyof facilities, for an array of different kinds of test and configurations, intostandardized formats and displays. These displayed data were uniformly available
simultaneously to all Shuttle design participants. Thus, the data base serviceprovided an unprecedented channel of communication for the interchange of data.
The DATAMAN capability was also utilized to provide special data operationsfor expediting design applications of the data. These special operations con-tributed significantly in attaining program milestones on a time critical schedule.
Lessons Learned
The lessons learned in compiling the Space Shuttle wind tunnel test database can be summarized as follows:
l) The centralized data base function, responsive to both prime con-tractor and NASA, has successfully provided the following benefitsto the success of the Space Shuttle design:
• full and free interchange of data between allparticipating in Space Shuttle development
• uniform availability of analyzed test data in areferenceable document for all Shuttle designteammembers
_241

2)
3)
standardized formats for enhanced ,sefulness oftest data from over 44 facilities
o guaranteed preservation of test data for flightcertificatien and future design applications.
enhanced Shuttle design team through special datastudies to support schedule-critical program milestones
benefits accruing from a unified data base (i.e.,extensive data retrieval, special data handling anddata visualization, test-to-test comparisons, andextended test data analyses)
complete awareness of total wind tunnel program throughi_anagementinformation regarding test status and data
Maintaining the data base function as an independent entity (reportingto NASA, not a subordinate prime contractor activity) resulted in the
following organizational benefits:
• single purpose mission which enhanced certainty ofachieving goals of a completc data base
• high de_ree of responsiveness to all data users
• high visibility of test data status for improvedmanagement and control
Centralizing the data base function with the resultant large datavol_es has provided the following technical benefits:
• impetus for developing the large-scale highlyefficient data handling system (DATAMAN)
significant cost savings because of efficient systemsand economies of scale
productivity improvements not only in the analysis ofwind tunnel test data but corresponding improvements
in application of test data
r
J
}
!
1242

CONCLUSION
In conclusion, the revolutionary productivity increases in data deliverybrought about by the automated DATAMAN system and the DATAMAN organization have
not only signific_nt|y contributed to the successful design of the Space Shuttle,but have provided a means of low-cost data transfer which is applicable andbeneficial to any wind tunnel test activity.
This has alsc resulted in an unprecedented accumulation of ground basedfacility d_ta by which to verify the vehicle flight characteristics. Also, allthe wind tunnel tes: data, acquired at considerable expense, are available tothe technical community as a basis for improved and future designs.
When embarkina on tne development of the next aerodynamic systems, one
question that must'_e asked is, "Which procedures used on the Shuttle programshould be done again?" One of the answers should be the wind tunnel test dataanalysis/documentation, the DATAMAN system. That should be done again.
1243
J
o
.
,
,
,
.
o
.
.
1244
REFERENCES
ORIGINAL PAGE ISOF POOR QUALITY
Kemp, N. Dale; Dave, Lynn M.; and Glynn, James L., Jr.: SADSAC Aerothermo-dynamic Data Management System Manual. DMS-TM-IOOI Chrysler Space Division,February 1973.
Whitnak, A. M.; and Hillje, E. R.: Space Shuttle Wind Tunnel Testing Program.AIAA Paper Number 82-0562, March 1982.
Phase C Aerothen_odynamics Data Base Quarterly Data File Contents Report.DMS-DFR-2094, Data Management Services, Chrysler Corporation, HuntsvilleElectronics Division, Michoud Engineering Office, January/March 1983.
Quarterly Task Status History Report. Data Management Services, ChryslerCorporation, Huntsville Electronics Division, Michoud EngineeringOfficeJanuary/March 1983.
Daileda, J. j.: Results of Tests Using a O.02-Scale Model (89-0TS) of the
Space Shuttle Integrated Vehicle in the AEDC 16-Foot Transonic PropulsionWind Tunnel. NASA CR-160489, April 1981.
Dye, W. H.; and Nutt, K. W.: Results of an Investigation of the Space ShuttleIntegrated Vehicle Aerodynamic Heating Characteristics Obtained Using theO.Ol75-Scale Model 60-OTS in AEDC Tunnel A During Tests IH41B. NASA CR-151069,September 1977.
Rudder/Speedbrake Hinge Moments for Pressure Data of Tests OAI45A, B, C andOAlOl. Report Number SPRT9F-3, Data Management Services, Chrysler Corporation,Huntsville Electronics Division, Michoud Engineeldng Office, April 1981.
Elevon and Flipper Door Hinge Moments From Pressure Data of Test OA270A.Report Number SPRT9K, Data Management Services, Chrysler Corporation,Huntsville Electronics Division, Michoud Engineering Office, June 1981.
IAl35 Pressure Integration 60R Wing and Vertical Tail Loads. Report NumberSPRTXH, Data Manqement Services, Chrysler Corporation, Huntsville ElectronicsDivision, Michoud Engineering Office, June 1977.
i
iI|

_IAGER ,5PEC]O,L DATASERV!CES
DATA _NI
f,Lr_
5"
JSCp_rr_RAM
!COOqOINATO_
L
JSC
E=OOV_w!CSR
I R% MSFC ARC LaRC I
ORIGINAL PAGE ig
OF POOR QUALITY
<>
TEST FACILITIr_
Figure I.- Chrysler as the data analysis Jocumentation
manager services the Space Shuttle design team underthe direction of JSC.
_ll_ _ IIm NO, II]1 0 . |.ii (,Ib, OtClf INTEII_W. * -5.tiJo 5.60I. _'J °i J)]O .1 ]'_1 . ISOlil -. _WE'/25 . L"alS_ -. _i_05 .1207"1 ._57
.tV5 .10_ • 12_110 " .i_Ggi -.127")& .2'_]llE& .-.?_111 .119'.5 .E2_
I i.l_ Z. tN(I . _'9_lFa& . INS]I -, 1_70 ._O| ". _e't I i_' . I I 2E_g . _9 ]ge, ITi:d_
q
F1
1.1411 -|.0_'/ -. I )'_4| . t"x31i . I Ji_ .0{_117 *. I _54i_ _ [ {K"51 *.llliT . 171)l
Ii I. I*,S .O_J . Z'II_ . I4,Z'IS -,12)'_3 .OS]O7 -. lllCa_| .llOO_ .Z,_I .l_l "1/I,,,, ,,,, ,_, ,'-_ -,-',' °_," -:';:_ '"_' "_" _"_
/ _,. ,,,, m,L- ]._ _,[NT lN,.IL - -.. S _ _
,SNQ *ll. 0_1 -. I 1_7i . ] |'*'J_ . I Ol'/ll_ ._l_ *. |_]]IS .1_*1_ *. |I_IN"/ . | ]0¢_1._0 -6. O_'J *. II_I_S * I I_'/'S . ¢1_101 .OSl IS ".|_ . I_,1_ *. O_7"r/ . i I_.11
/,_Oil" " _C UT TPT _llJ_-_l O2TI$,STIk4 ] li
H
,_r - _'S'SO.(iO00 _ FT. _ * STS.9900 IN. Xt' p_TIIIC _T,_
I[ll(¥ * I_w_O.IG_O INC:'CS _ - 400.0000 IN. ZT I('T& * -6.GO_ III_Q.¥ _ IO,
SC_J£ - ._100 . 0_-[_¥ * 4.004
Figure 2.- The dataset is a collection of wipd tunnel runs for the _a_econfiguration. Associated with the data are supplied identifyingdescriptive information and dimensional data to complete the packet.
Ir. 45
L
!
,%
I :
]
3
2
q

ORIGINAL pAGE |S
OF pOOR QUAL|TYJ PR[SSUgE AWD HEAT TR,UISrER BA'_l
_E_DYNAHIC LOADS DATA ! "
_ _._'_IC rORCE I_TA _
r_wu_lIES
(x[r LT"TVT
I
FIL[ _AJ_ACO4(NT i
i i
Figure 3°- The DATAMAN system is an integrated system consisting
of a s_tem executive, data systems, and a file management
syste_. It is also a unified system for processing aero-
dynamic pressure or heat transfer data, aerodynamic load_,and ae_r_dynamic force data.
1246
Arithmetic 0_rlt;ons Pai_r_7 Operations
FEONBN FADJON
F_OHPR F,I&OVjL4
FCI)WI'T FIX3WCH
_RIV FSTACK
r"_ IG_ Fsw'r CHF'I_AAN, I FTPJLNS
F_NQO FDSDAT
F(3E].IN _PEONFP[II_
I nf_OI at | mt StAt|st|cal
FANIRP F'POI.YN
F[NTRP F'14_TAT
F;wWTR.o F_GRS
F_ITRP FSI_QtF'STATS
_tc Appltcat_on_ Flow Fteld Aplpllcat_m_
FXJ(I At FltAYR
FSCALE FLOCAL
FOU(I$ FISCAL
F]XRCT FFR0_E
Air P_ S=vstems T/O O_eratlon$
F_SAA FC_T8
I_ FEI_TDF_
FCLIST
FCUPDT
Figure 4.- The modular programs of theFORCE DATA SYSTEM illustrate the
range of capability and versatility
of the system.
4
{
t
|
_L
m
ENGINEERIICG"AN_TSIS
DATA ENTRY
DATA ANALYSIS OI_TIONS
ANALYSIS [VALUAT] ON
Activit1
o Planning
o Data Initia]ization
o Analysis System Input
o Engineering Analysis
o Computer Graphics
o Inhouse Review
o Customer Review
GRIGINAL FAG;-. _
OF POOR QUALTY
Result
o Collatioe_ Plan
o Analy;is Specification_
o Formatte_ Data Tape
o Prelimi_zry Analysis _a_a
o Preliminary Data Plots
o Confirm_ Analysis Datz
o Confirm- Data Plots
DOCUMENTATION o C_iling/Editingo PublicationlDistributlon
o Enginee._."g RepOrt
DATA B._E_ o Data Baseo Document Archives
o Retrievable Data Files
o Data gan_ Cont_ts Repcart
o Status Re_orts
Figure 5.- The data analysis documentation operations is a systematicproduction process of well defined activities and outputs.
lDATA ._. /I I _'I_JUCCEPT_CE_I
I ir,, - OAT% _ DATA LI DATA ! | DATA ANJ_DYSIS tSYSTEmk_
,VI RIE_RED}'NTS _INITIJ_LIZATION_OPE.TIONSJ7 ,VALUATION ]L____]_ pROCr'_'c_
ORGAN! ZAT zS/_
Figure 6.- The DATAMAN organization parallels the analysisproduction process.
1247
c
1
!

J
?
i,
('_ "JaB moa3)
•s___odaJ s_uoluoa )lu_q e:lep /TqoLqELLeAe E:IRP_0 OJ_Me
opera RLLenu.L3uo_ S.L _.[unmmo_ Le_uq_a_ OL_nqs aqi -'8 _.ln6.L_
•" " ....... %'7
- -i_1 _. m m mid
s i_..
_- i / ,lime
:: -- __ .=114
el,", .e."
, , °
,liP"N .,> JI.
..._ _.M .s,...m, m.-.o
.. w,,,...-..,_,-,.,_, - ,.,, - ,:
_'t _i.i l..x4
•s:lua_aLa LeUO.L%e-a_doa4% 0% Sa.L:I.L^.t%ORUO.L:IRCIUaUlnooppueS.LS_LRUE_%ep aq:__o sdLqsuo._:leLa._aq:IsMoqs _,.IRLp)IJO_BU aql -'Z a.m6._
K.IIAIe _"_'WNV o,,_IL I"_ISi'_YI I}]R3VlVO_ ¥1_ I
,II,VNIH113_Id I _N | I'4Mb'O_ ]Rq
8_
_k,"3
¥I_
I I
IllIOd_
,_Nlt
SNOilIII]O0 I
s_sx_p_v /_.)dlIlqIWZ"[3_d L
i S)iX_lSISA_wv|
Ill_llWIllltd]
| _)$1¥I1
_C LL.,_IEL_: 9NIIII_FId
i 3_1 ]Vi_ IS_i I
31i_W_O_l _17'_/f'lb _oOd ..4St. _t_)Vd q,qbllgil:l
5".'
w_• _-e,-_ cwfv,.Jed _ _ SUaHHWy
• _ ,v-_ _, irLo,we t,d,tb.m._e84JTt
_iTIE• , 1 ,v
: ..': '.:; .':... _: '.:..'._.' ' ."._.............. _ .'.!
m.,
ORICI_";AL ?;_":'- :.3OF POOR C_;JAL_,i'f
m-m
F_nm _ I{%%Y$
Figure 9.- Work-in-process status is communicated regularlyto the Shuttle design team. (From Ref. 4.)
SUPPORT_'ORT ,_--_- ! '-.T.="-:':'--...-
......__+.._r_-: =--ot.i
t
,_ _lo i"lol _*,.lill-I ,_q
=_ l_ _-i...... -
TASKETFORT
7 II .... , ..... I
!......... tl '_'= I - I i
F;gure I0.- Manpower _pplications are tracked and collected byfunction aF,d task for cost control and forecasting.
1249
=
i!

1250
oRIC_'_- pAOI_ lSOF pOOR QUAL_
WINDTUS_ELTESTDATAANALYSISTASKLOADING
i
N mw L--_
,!
_4t.
_1-F-
'd-
I|i-
L
_WWNINGIFEL FORWINDTUNNE,TESTDATAA_LYSISDOCUM_TAT:_
Figure 11.- Comparing manning level to task loading providesindicator of DATAHAN productivity.
AERODYNAMIC A_ALYSIS
o Test to Test CA_t_parisons
o Control Surface Effectiveness
o Derivatives
o Control Surface Interactions
o Ground Height Incrementso Power lncr_lents
o Hysteresis Ois_layso Post-test Blockage and Tare Corrections
PRESSURE LON) INTECC,J_TIC_IS
o Control Surface Hinge Movementso Protuberance Loads
o Vehicle Component Loadso Nozzle Loadso TaiIcm|e Loads
o Input to NN_SI.AG Pror_ram
THERMODYNAMIC _YSI_
o Development of _Iysis Techniqueso Test-to-Test _rlsons
o C_)mparls_ to Theoretical
o Mir_r-lma_e CaIcuIatien_
o Special O_splays
AIR DATA SYSTEMS
o Algoritl_ Development
o FTP Data Analysis Techniqueso Parametric Analysis of Flush Mmzmted Poreso Composite ADS Test Databases
ESIGN DATA _PLI_TIONS
o Substantiation and Applicationso Total and Coq_n_t Coefficient Calculationso Update Comparisonso Pre-test Pred_ct_on_
SPECIAL
o S_tistfcal Error Analysts ofo RC5 In_eractiem Incrementingo Mini-Probe Calibration
o Protuberance Flow Field Survey
MISCELLNIEOUS
o Punched card inputs to NASA pro_r-. =ms •
o Data Tape Inputs to ADAP IIo Data Tape Inputs to JSC/'tructureso Data File/Data Base Releases"
o Inputs to NASA Technical Reportso Microf|che DOCUlentation
Figure 12.- The DATAMAN operation provided high priority special designapplicationssupport to almosL every activity using wind tunnel data.
.......... - ' "'"_ ,....+.. ' ORIG'IrqF_:_ .....
--' OF Peer QC'AUTyIr 4_ lllll 4f_1 _lL_i ii i g i
io . _
_ -°
+ ba.____+4___t I I n _ , , t
: + [ ! " ' F I _ 1 i ] I I I
Ork+v|lr lmgll e_ ll_Ich, o, 4egree5 _CIcr+cled flr [Jew Amlllmrlly)
C_'ImXRISON OF" alk_l¢_ ¢vO_l CO[F'IPICIOIT_ ¢_t VMiI_I._ _ _'lllES- I. 15. u.,_CTru_ CLATA
¢E )m""r aO • 2_
(a) Retrieved data of four tests adjusted to common
conditions for comparing data for tun,lel effects.(From Ref. 5.)
m ,iv, iol-.+ul t +,l.v,w-. i, i"_" _:._ ,_=_ ,-'_d.. _'_" '"'' llle
_ • n .llIIll m k + Kit 14_]_I+4 I Itlm $ Ill
,o.+_+.++_:-±-_-.-.,-..+.+_,_:__....=...... _ --+-----_--_
+: , om_._ - +
. _ _-_ i --' "_+ ,
• +,. _ [...... . , +
", ,+,++' , +:7-+o., il I 'ii, + [
: Ii ............,........t........,i: ' 'tt............... ti :l +.OOl! .X 2 .I .'+ .5 .6 ._ .8 i 1.0
._+_.I_'I.I]INA._ O[ST&N(_ _ T,LMK. XlLl, (l+'_c|le_ 8f b_Jdf le,,,l_k)
L+_. OISTI_IB,,rlrI04 OF I.(ATI_,,,; RAT( 04 _ LT - ,r¢.1o+,4_-_. _":.,g_--__-3 '{ X/LT < 1.0 - LIN[._ SC.W..J:
- -5.00C -1"T_ - -9,000 P_I - .000 :.,,'a.TIE: 16 I.,,._,q "19
(b) Heating ratios (test and theory) computed forrapid identification of interference heatingproblems. (From Ref, 5.)
_igur? 13.- Special applications of DATAMANwhich
contributed to Shuttle design effort.
r
I251
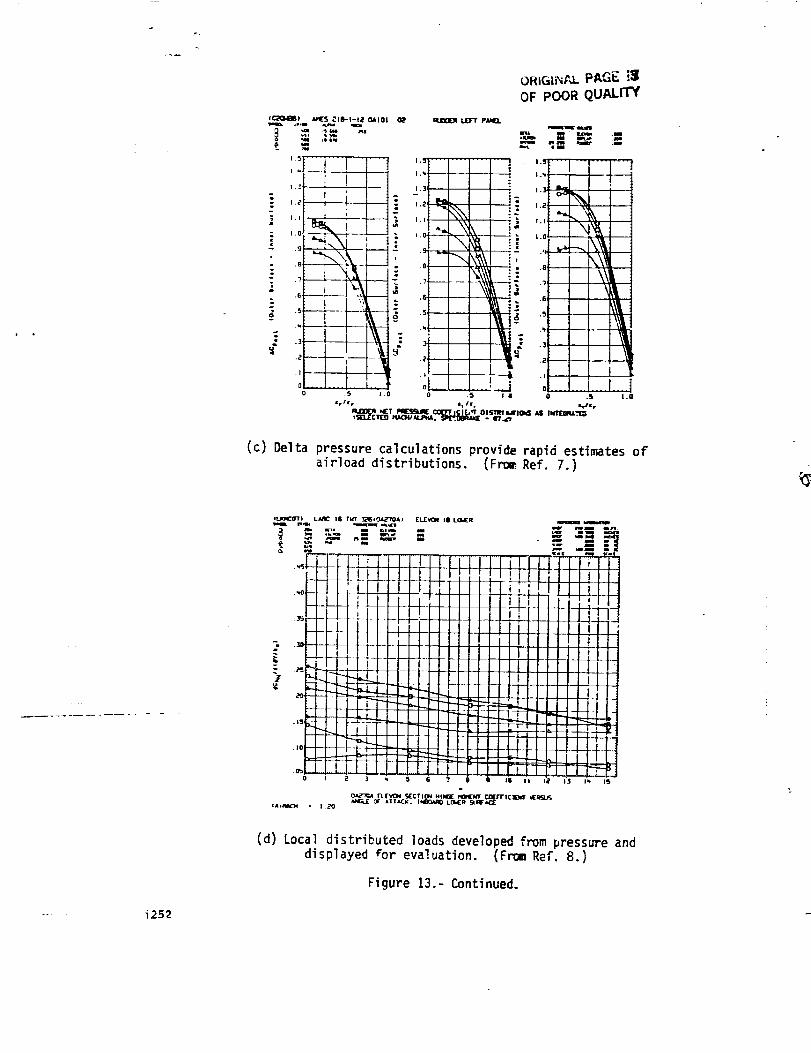
r.
I_) _5 _l_l-i2 CIA|Oi Ci2
-_ t._
; i Jm
_, t.o
.2
.I
._ I.O
ir,'l r
mJOO£_ uDr'T P,U,G.
I.q
!
I
!
i
o
--1
i:i
l
.--i.S I I
11 #c
ORIGI_/_,L PAGE i3
OF POOR QUALITY
eml
1.2 .... I ..... f
"__ _,1
.,_ ..._ _ __.,
.6 _ :
.6 -- :
.5 i ]
., |I
.I
........... I.... l-S I .O
(c) Delta pressure calculations provide rapid estimates of
airload distributions. (Fro_:Ref. 7.)
_ _ ....... .
+I CLLI_IIIIII! iliLLLI_ll I I I I i
J , [ .
,, 5 s - e _i [ ,_ i?
',_,_
t_L-!I
_-7
(d) Local distributed loads developed from pressure and
displayed for evaluation. (From Ref. 8.)
Figure 13.- Continued.
- i2B2

(e) Thesamedistributed loadscrossplotted with Machtoascertain potentially critical conditions. (FromRef. 8.)
d
!(F) W!ng forces developed from pressure integrations carpet
displayed t_ visualize the wing loads in the pitch-sidesllp :.&_trix. (F_m Ref. 9.)
Figure !3.- Concluded.
ORIGII'I/',L P :."-: "']
OF POOR Q'.,A_.;TY
1253

ORIGINAL PAGE !S
OF POOR QUALITY
FUNCTION
LIAISON
DATA OPER#TIONS
rJATA OOCUME}ITATION
DATA OPNS MGT.
PROJECT MGT.
HANHOURS
SUPFORT TASK
V//_IN_iR_C_ 0ZRE_ i
F////////////////fY////A- I
V//_///,,,',///A I
r////////////////,,j
r__
i
2
¢
-_.-_, 1254
Figure 14.- Typical manhour allocations between task functions areshown for the average test.
i
!