Embed Size (px)
Citation preview
Just Plain Data Analysis:
Compiling, evaluating, and presenting numerical evidence to support and illustrate arguments about politics and public affairs.
Numerical evidence: social, political and economic indicators
Arguments: “informal” arguments consisting of one or more premise and a conclusions.
Common Statistical Fallacies in the
Interpretation of Social Indicators in Data-
based Public Affairs Writing
A Statistical Fallacy:
A form of Inductive or Informal Argument Logical Fallacy: When premises do not provide enough support for
an argument’s conclusions. Premises consist of time series, cross sectional and
demographic numerical comparisons.
Note: Traditional hypothesis-testing research methods design defines a“deductive” argument structure, but only to establish a very limited conclusion.
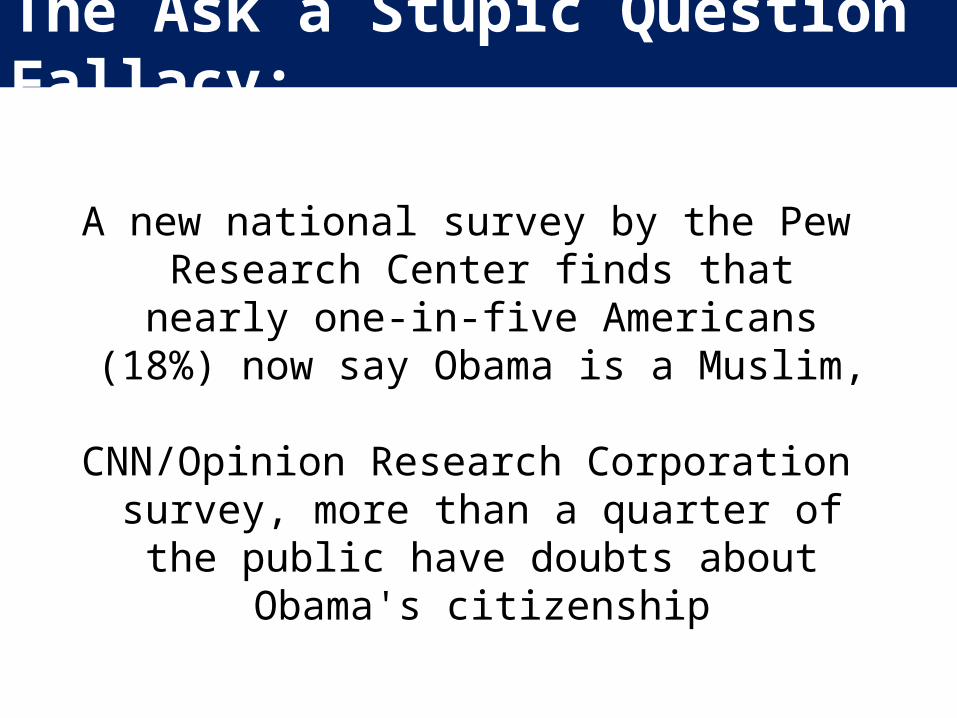
The Ask a Stupic Question Fallacy:
A new national survey by the Pew Research Center finds that nearly one-in-five
Americans (18%) now say Obama is a Muslim,
CNN/Opinion Research Corporation survey, more than a quarter of the public have
doubts about Obama's citizenship
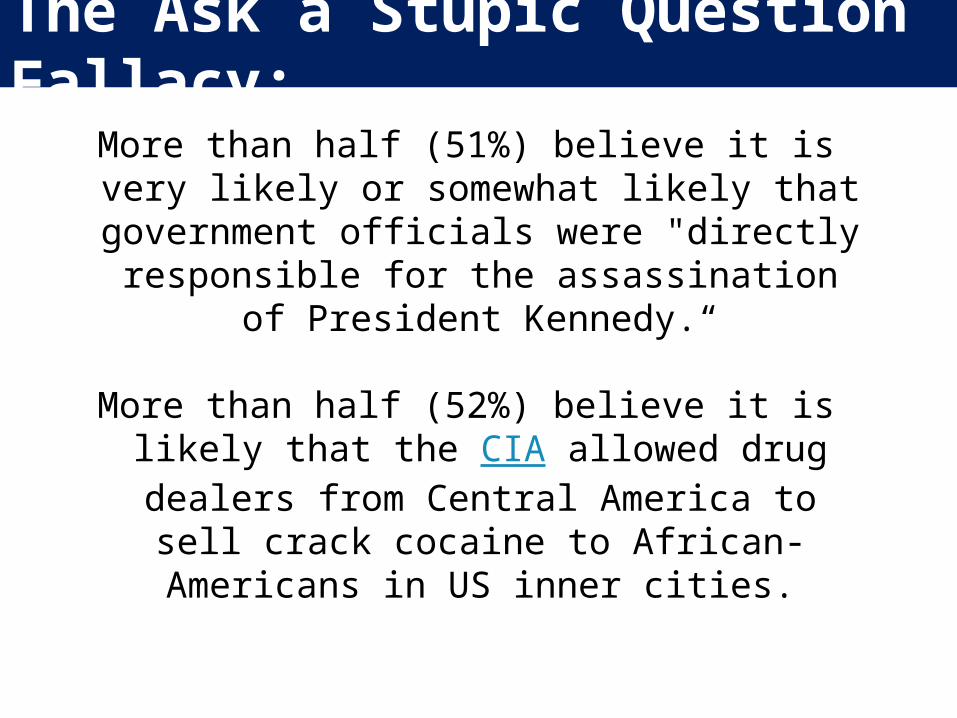
The Ask a Stupic Question Fallacy:
More than half (51%) believe it is very likely or somewhat likely that government officials
were "directly responsible for the assassination of President Kennedy.“
More than half (52%) believe it is likely that the CIA allowed drug dealers from Central America to sell crack cocaine to African-
Americans in US inner cities.

The Ask a Stupic Question Fallacy:
Nearly half (47%) believe it is very likely or somewhat likely that "The U.S. Air Force is
withholding proof of the existence of intelligent life from other planets.”
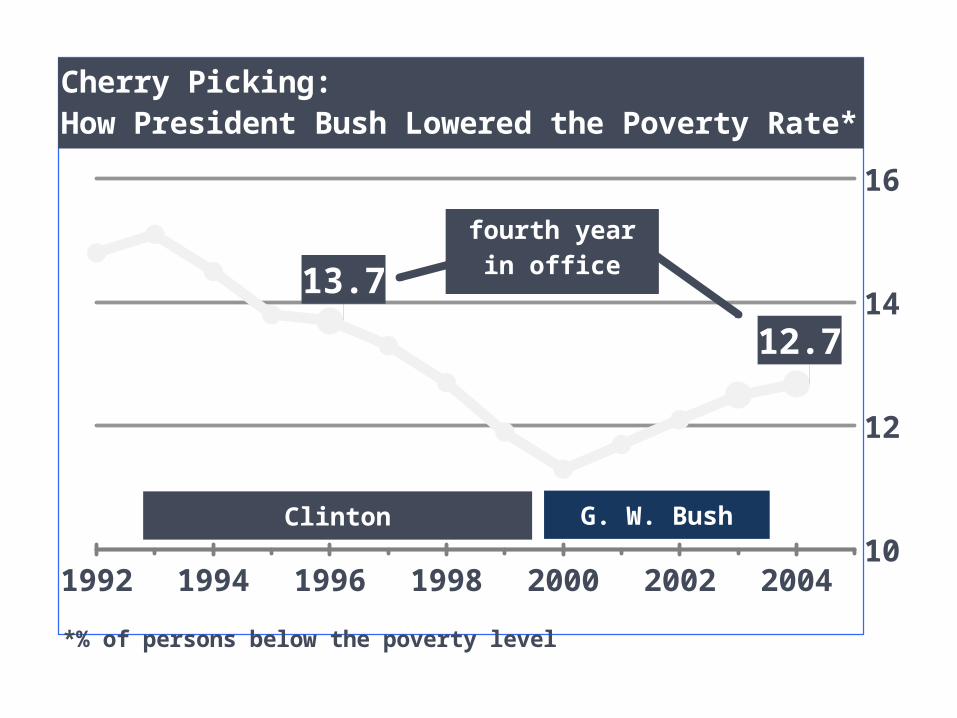
1992 1994 1996 1998 2000 2002 200410
12
14
16
13.7
12.7
*% of persons below the poverty level
Cherry Picking: How President Bush Lowered the Poverty Rate*
Clinton
fourth yearin office
G. W. Bush
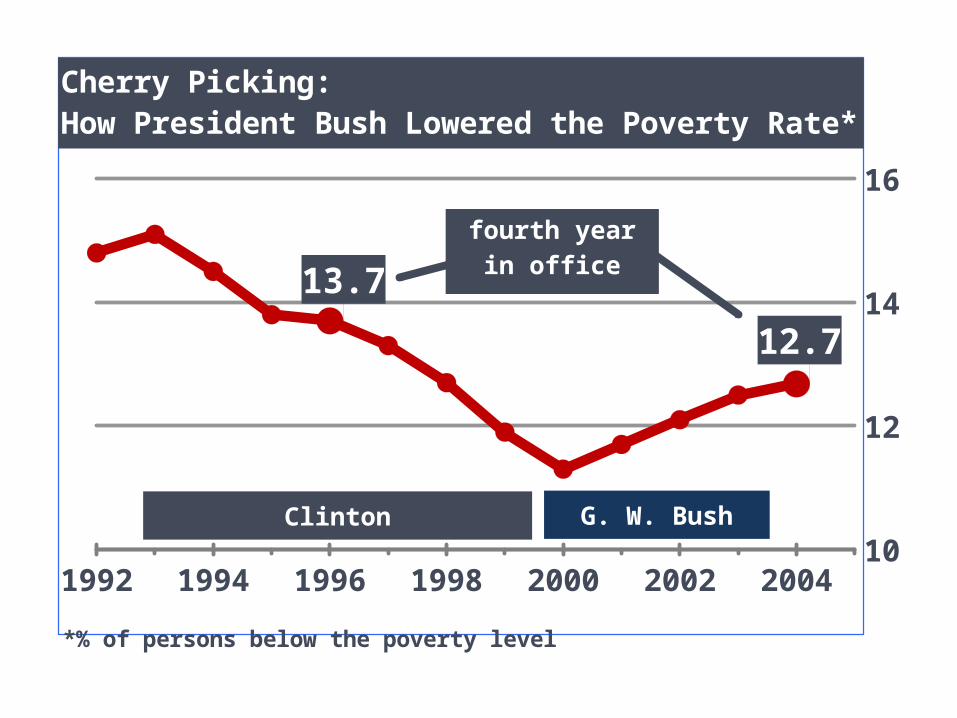
1992 1994 1996 1998 2000 2002 200410
12
14
16
13.7
12.7
*% of persons below the poverty level
Cherry Picking: How President Bush Lowered the Poverty Rate*
Clinton
fourth yearin office
G. W. Bush
Global Warming Data in text file Excel file: http://
lilt.ilstu.edu/gmklass/pos138/cherry2.xlsx
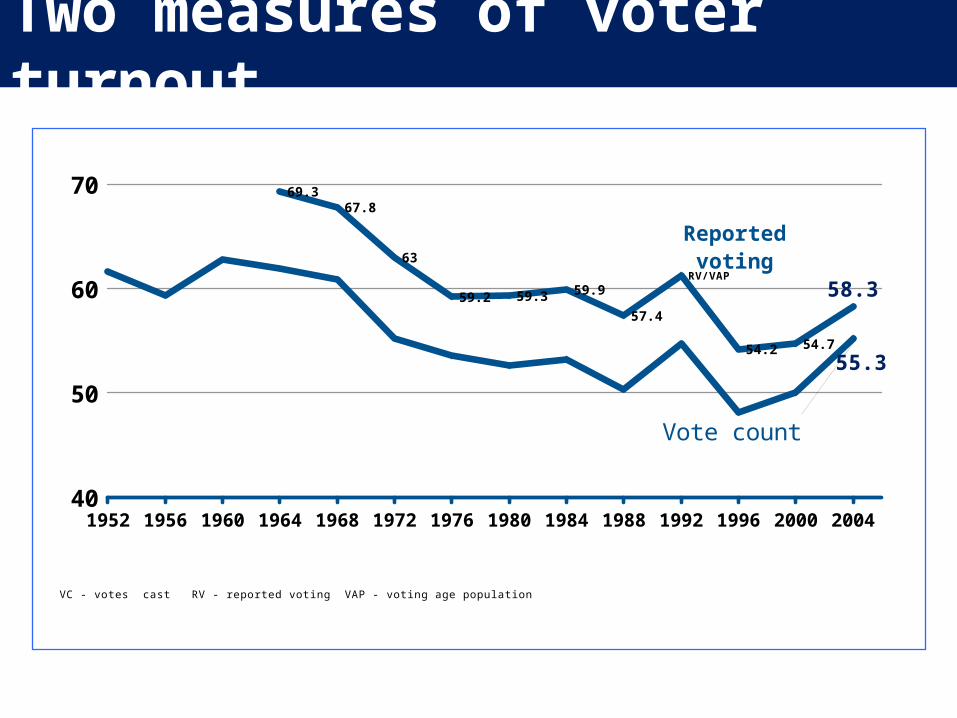
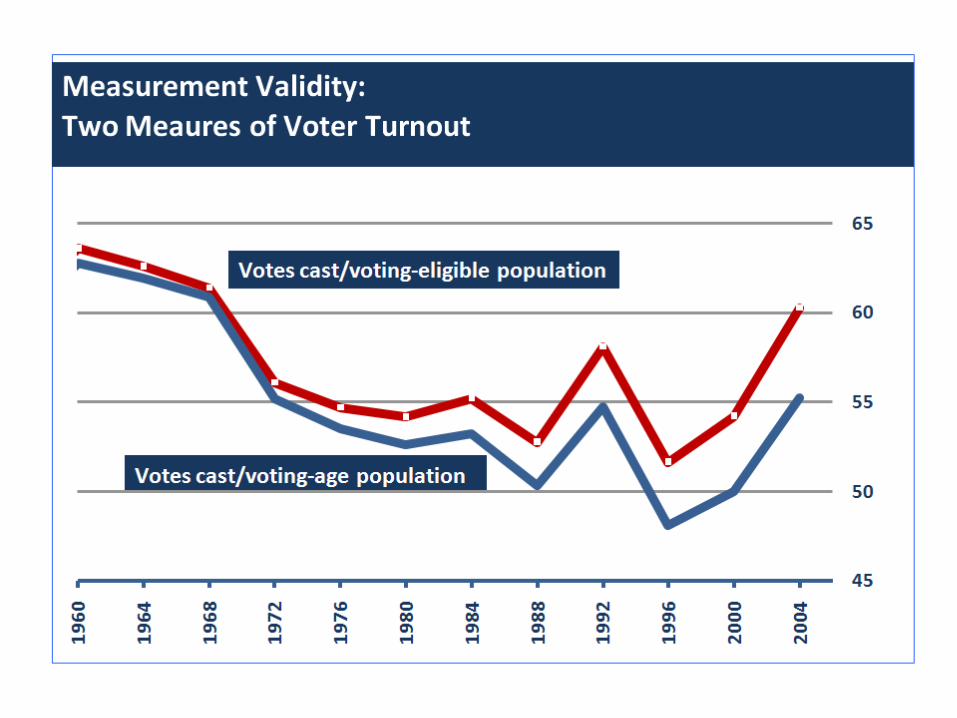
Two measures of voter turnout
1952 1956 1960 1964 1968 1972 1976 1980 1984 1988 1992 1996 2000 200440
50
60
70
55.3
58.3
69.367.8
63
59.2 59.3 59.9
57.4
RV/VAP
54.2 54.7
Reported vot-ing
Vote count
VC - votes cast RV - reported voting VAP - voting age population
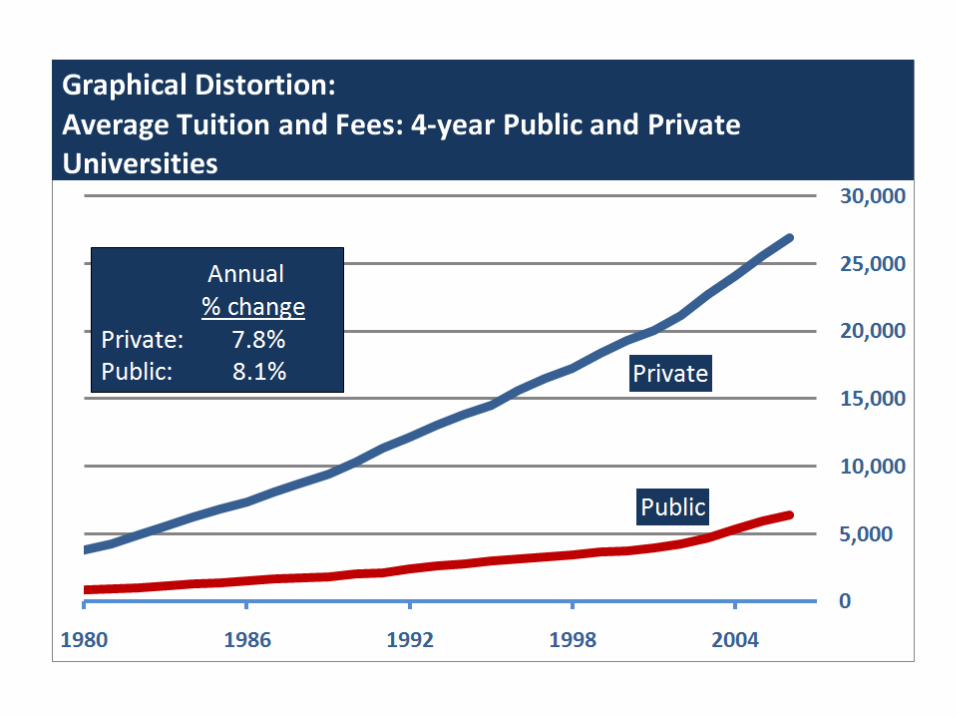
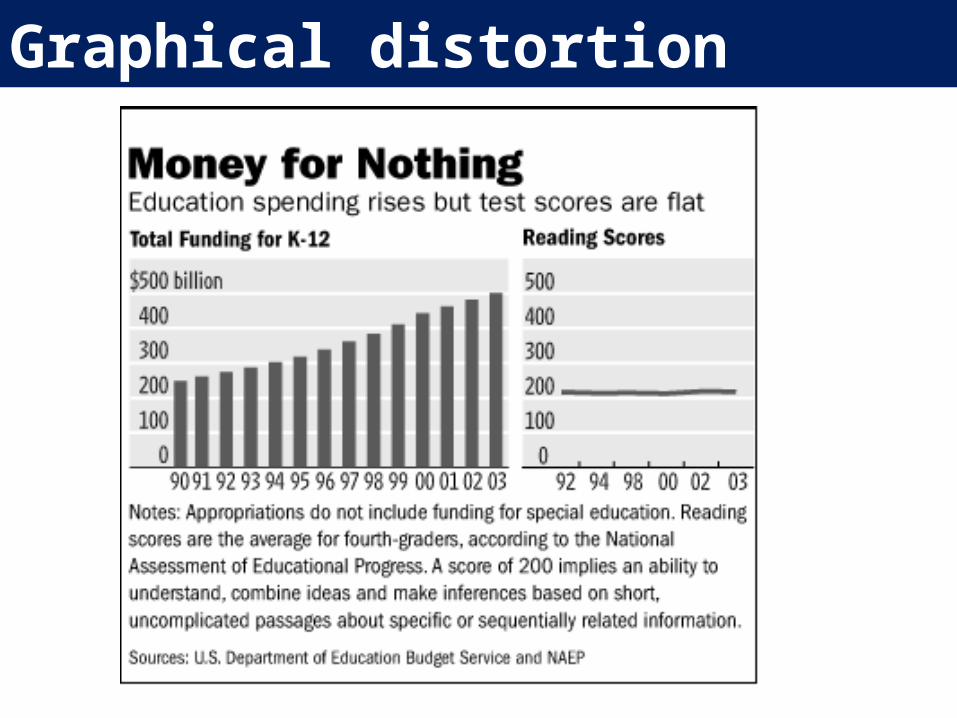
Graphical distortion
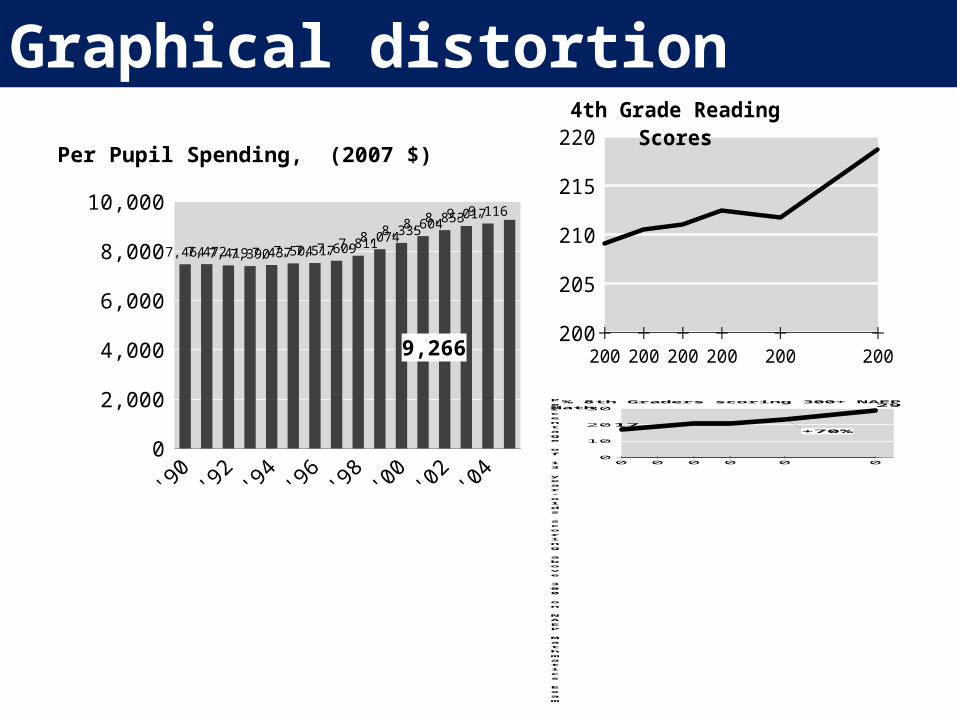
Graphical distortion
200
205
210
215
220
200 200 200 200 200 200
4th Grade Reading Scores
'90
'92
'94
'96
'98
'00
'02
'04
0
2,000
4,000
6,000
8,000
10,000
7,4647,4727,4197,3907,4377,5047,5177,6097,8118,074
8,3358,6048,8539,0179,116
9,266
Per Pupil Spending, (2007 $)
0
10
20
30
0 0 0 0 0 0
17+70%
29Percentage of 13 year-olds scoring above 300 on NAEP Mathmatics Exam
% 8th Graders scoring 300+ NAEP Math
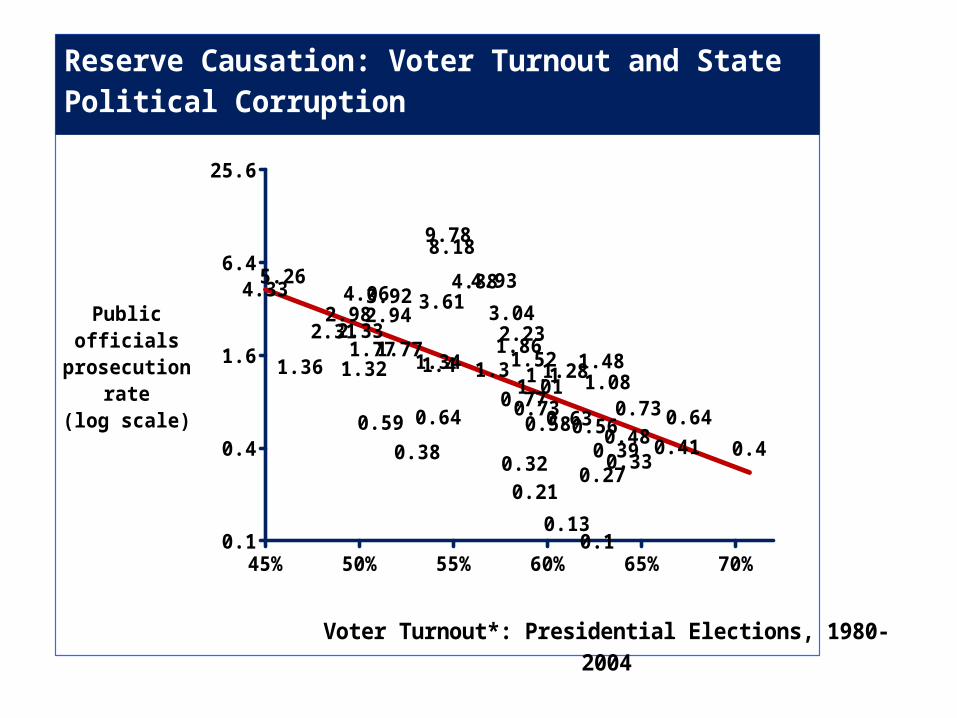
45% 50% 55% 60% 65% 70%0.1
0.4
1.6
6.4
25.6
2.94
1.48
2.98
0.59
4.88
0.731.08
1.3
9.78
5.26
0.56
1.861.34
0.390.32
1.77
4.93
0.64
8.18
1.281.1
0.4
3.92
1.010.73
0.21
1.36
0.13
1.521.77
3.61
2.31
0.27
2.23
0.64
0.33
1.4
3.044.33
0.48
4.06
1.32
0.58
0.1
0.38
0.63
2.33
0.41
0.77
Voter Turnout*: Presidential Elections, 1980-2004
Public offi-cials prose-cution rate(log scale)
Reserve Causation: Voter Turnout and State Political Corruption
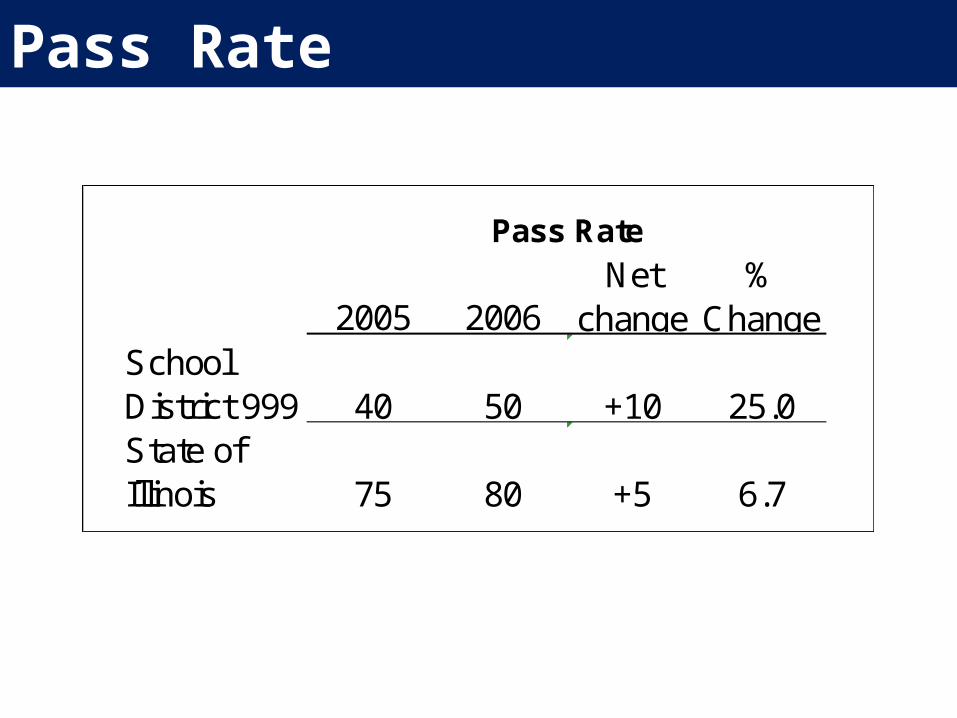
Pass Rate
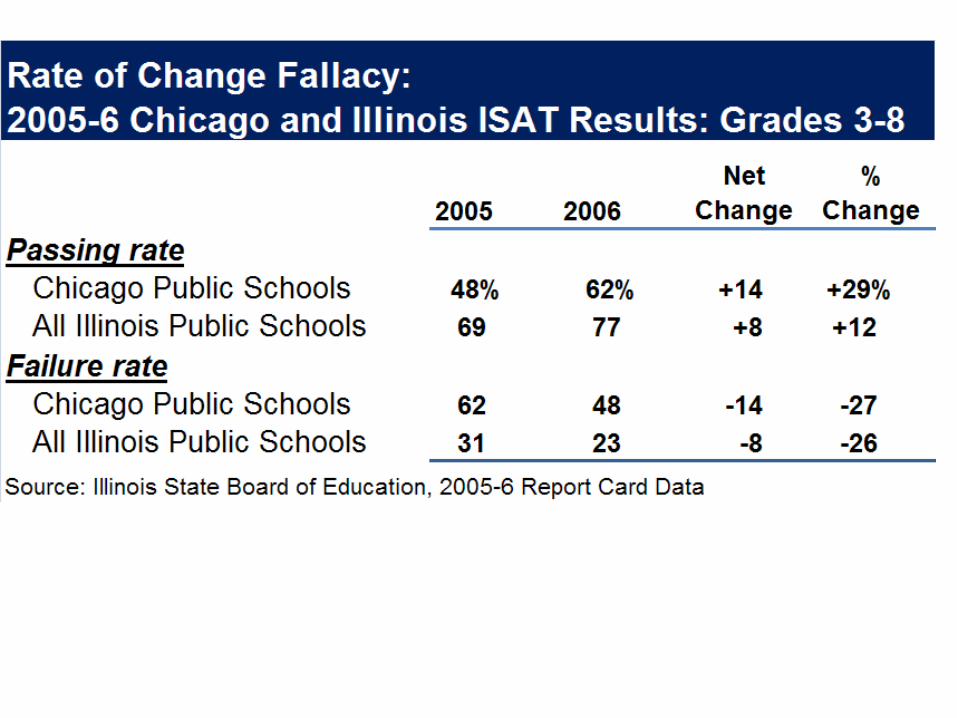
2005 2006School District 999 40 50 +10 25.0State of Illinois 75 80 +5 6.7
Pass Rate
Net change
% Change
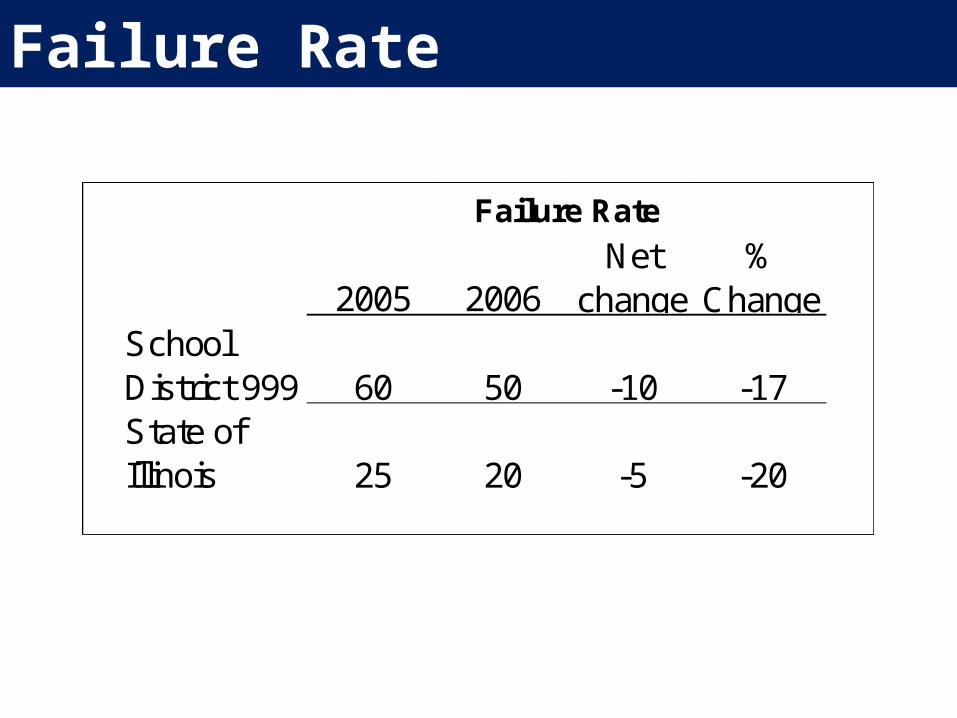
Failure Rate
2005 2006School District 999 60 50 -10 -17State of Illinois 25 20 -5 -20
Failure Rate
Net change
% Change
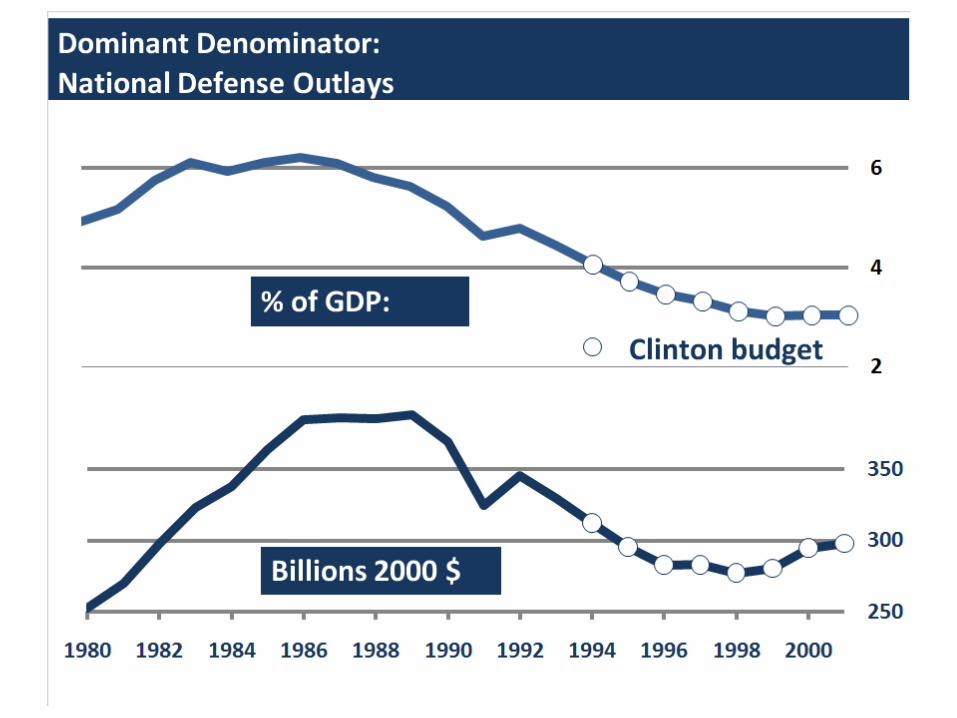
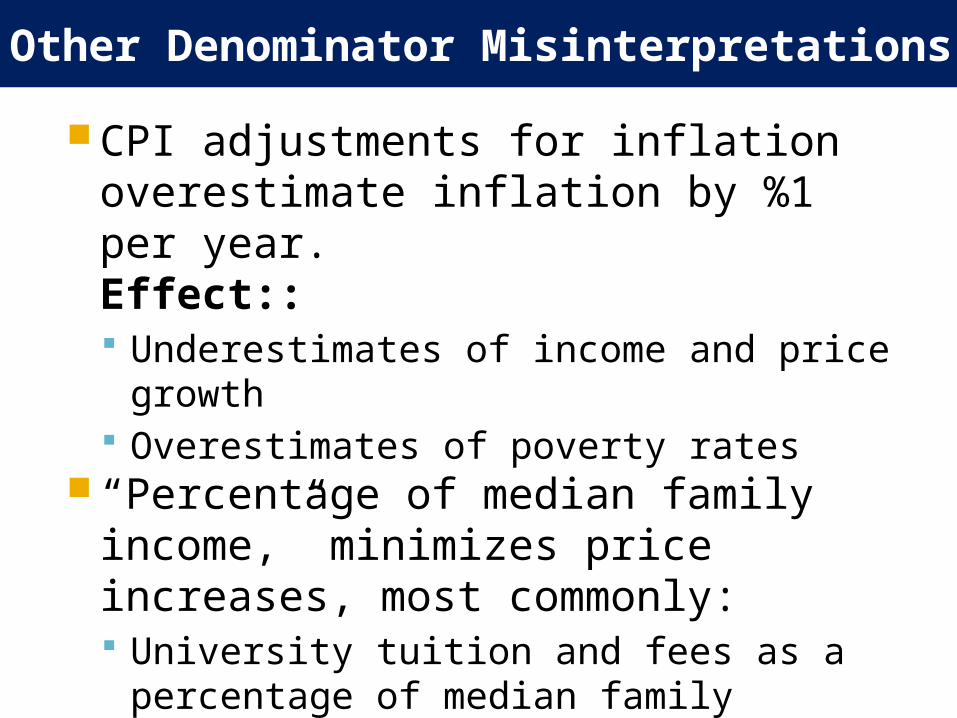
Other Denominator Misinterpretations
CPI adjustments for inflation overestimate inflation by %1 per year. Effect:: Underestimates of income and price growth Overestimates of poverty rates
“Percentage of median family income,” minimizes price increases, most commonly: University tuition and fees as a percentage of
median family income.
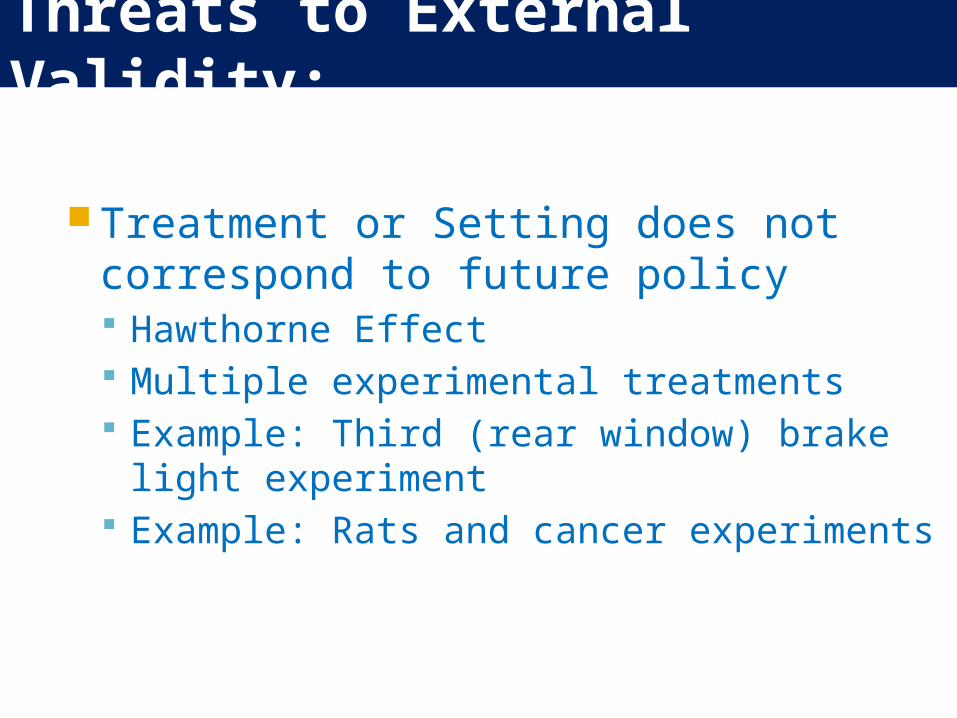
Threats to External Validity:
Treatment or Setting does not correspond to future policy Hawthorne Effect Multiple experimental treatments Example: Third (rear window) brake light
experiment Example: Rats and cancer experiments

Rear window brake light experiment (1974):
343 San Francisco taxicabs with CHMSL(Center High Mounted Stop Lamps)
160 taxis with no additional light (random assignment)
Findings: CHMSL taxis:: 61% fewer rear end crashes, 61% fewer driver injuries, 62% lower repair costs
On all cars since 1986 Later Finding: from 1989-95 CHMSLs
reduced rear-end crashes by only 4.3%
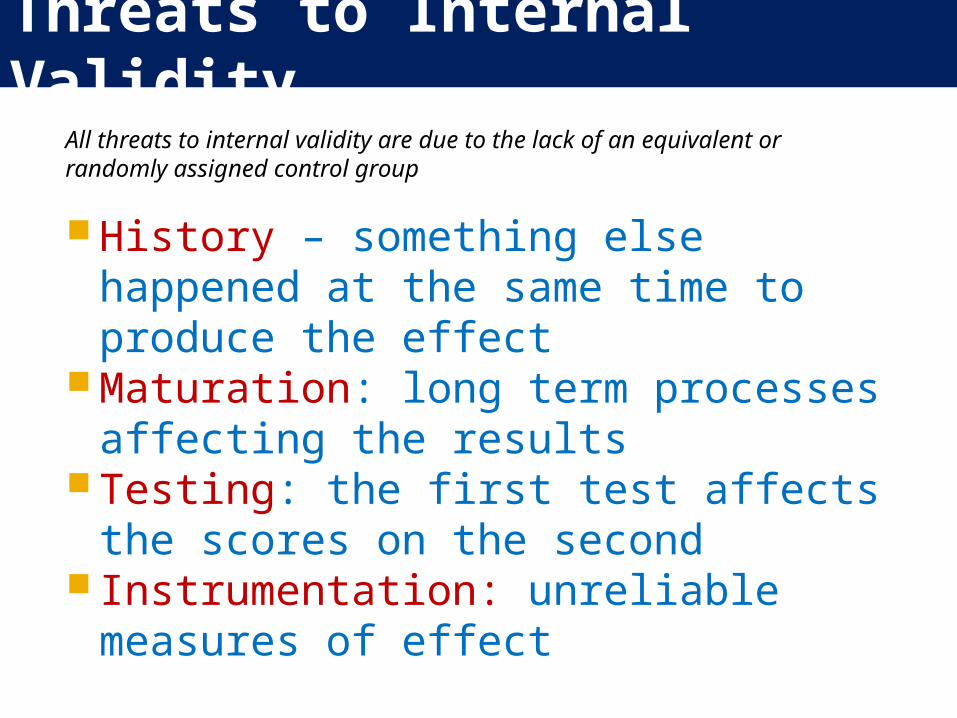
Threats to Internal Validity
History – something else happened at the same time to produce the effect
Maturation: long term processes affecting the results
Testing: the first test affects the scores on the second
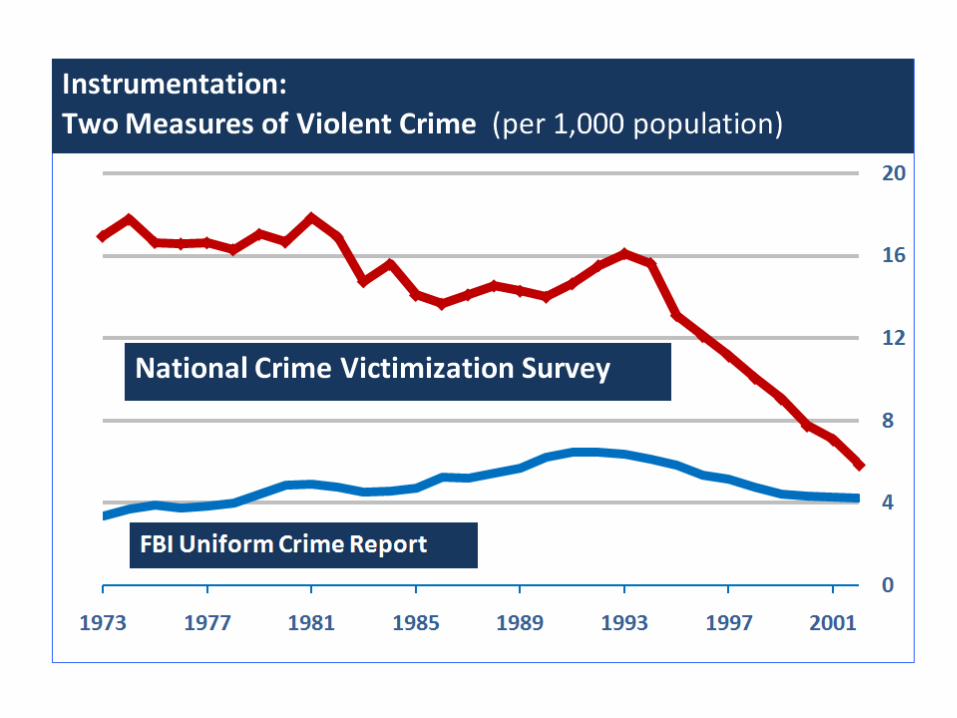
Instrumentation: unreliable measures of effect
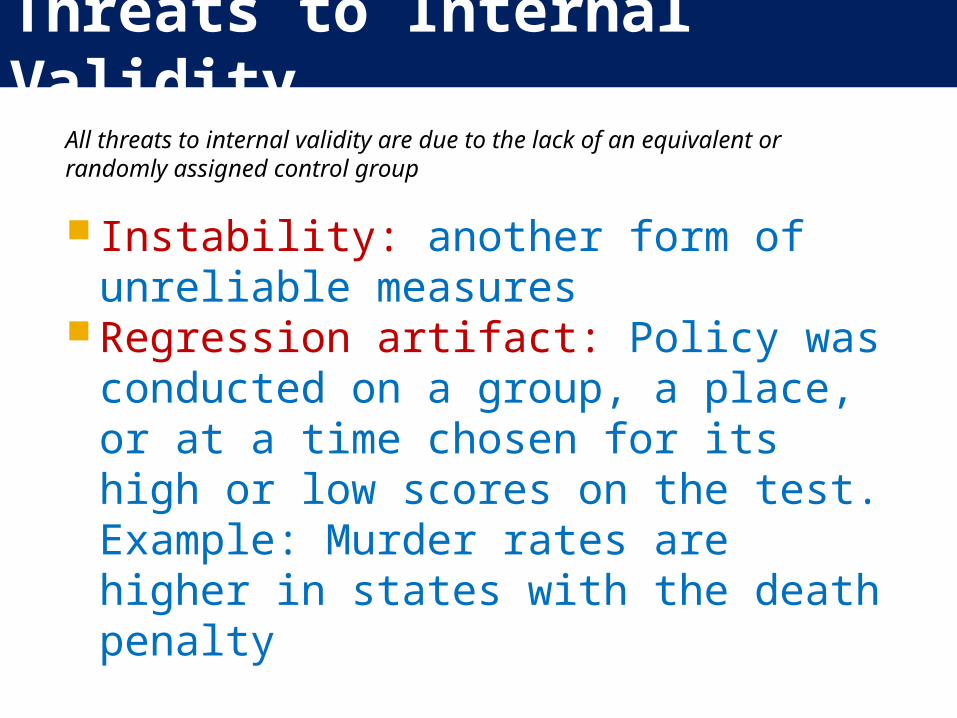
All threats to internal validity are due to the lack of an equivalent or randomly assigned control group
Threats to Internal Validity
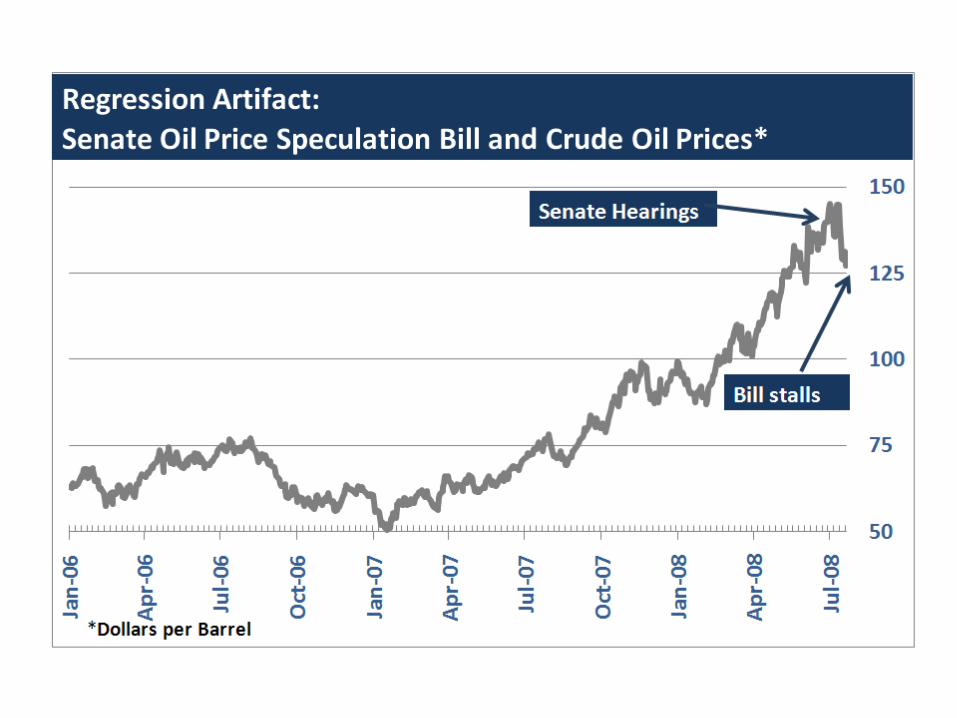
Instability: another form of unreliable measures
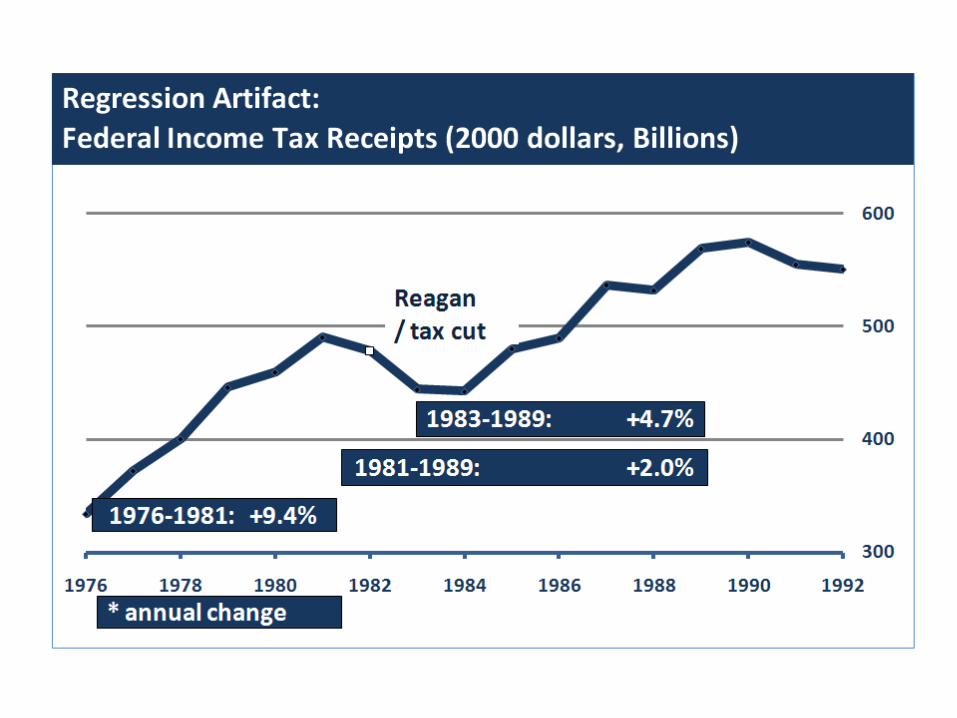
Regression artifact: Policy was conducted on a group, a place, or at a time chosen for its high or low scores on the test.Example: Murder rates are higher in states with the death penalty
All threats to internal validity are due to the lack of an equivalent or randomly assigned control group
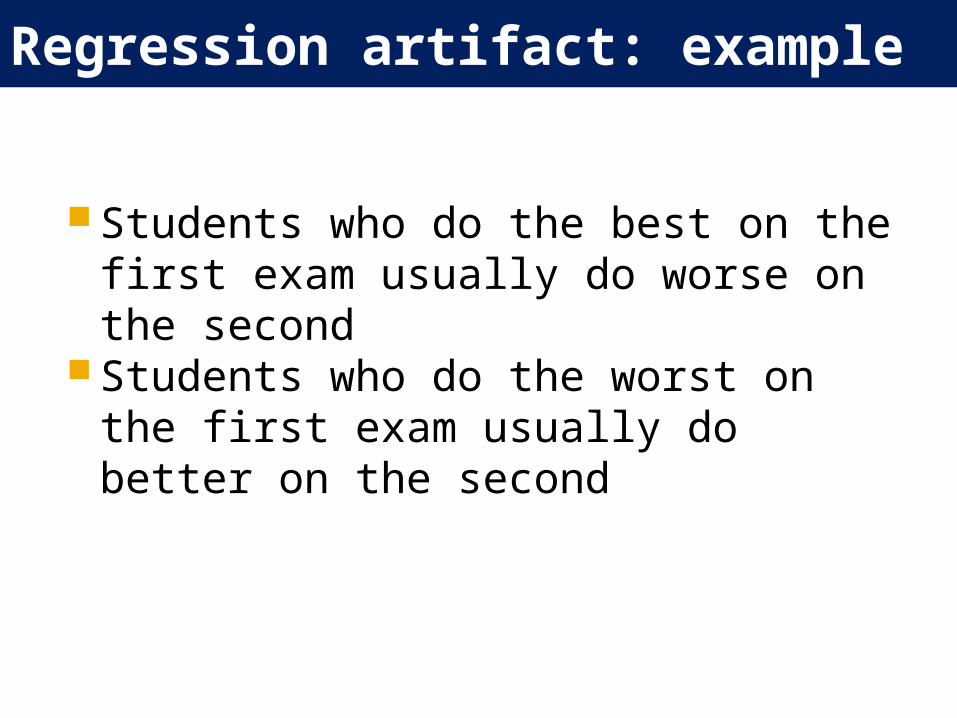
Regression artifact: example
Students who do the best on the first exam usually do worse on the second
Students who do the worst on the first exam usually do better on the second
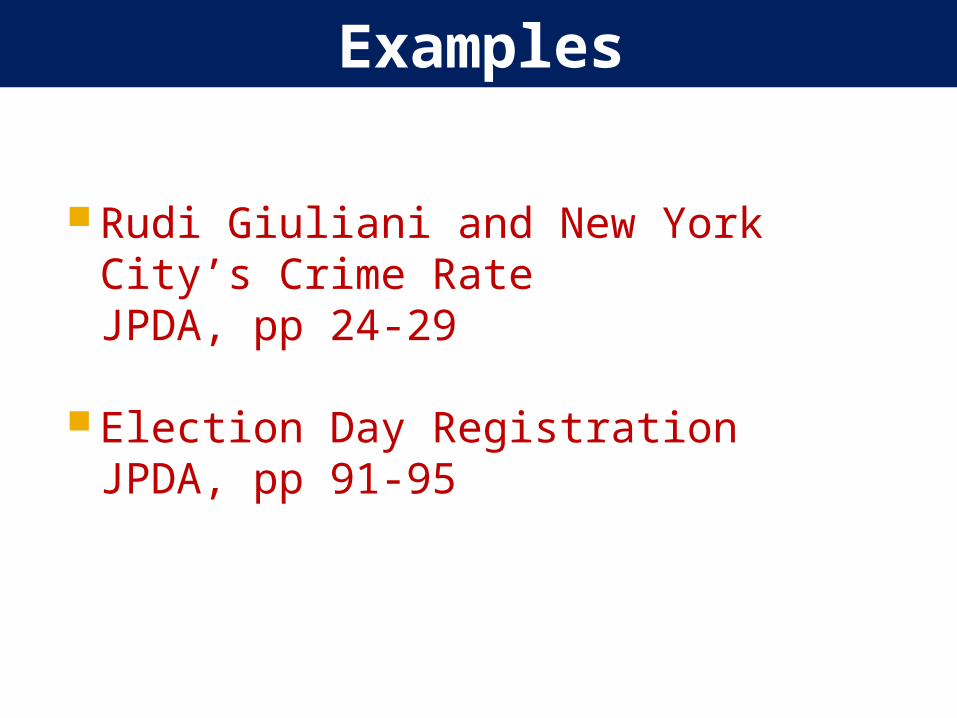
Examples
Rudi Giuliani and New York City’s Crime RateJPDA, pp 24-29
Election Day RegistrationJPDA, pp 91-95
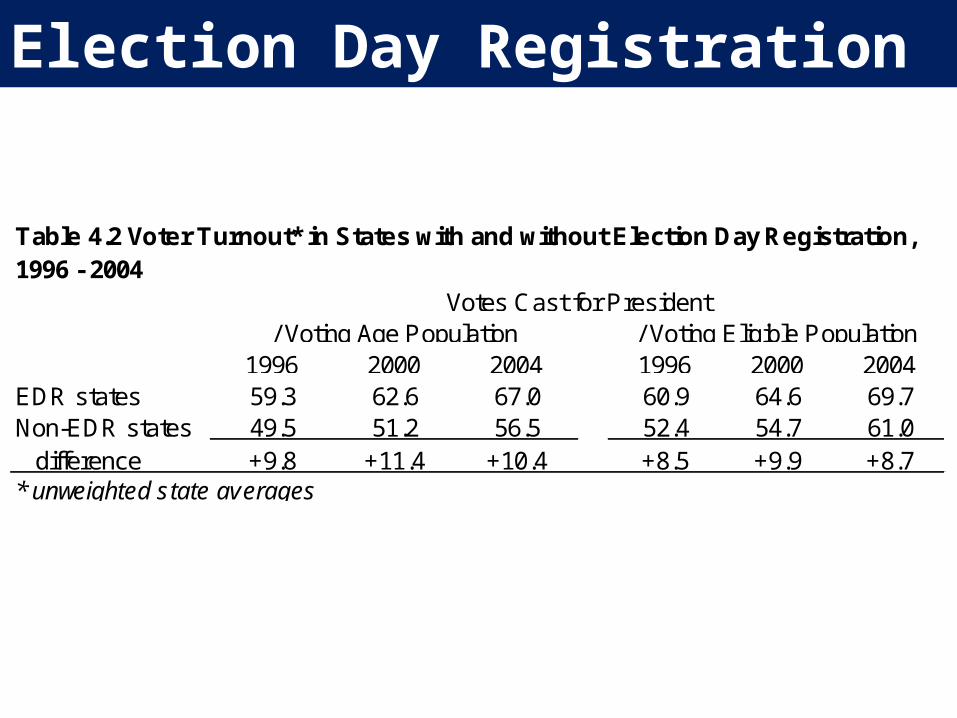
Election Day Registration
1996 2000 2004 1996 2000 2004EDR states 59.3 62.6 67.0 60.9 64.6 69.7Non-EDR states 49.5 51.2 56.5 52.4 54.7 61.0
difference +9.8 +11.4 +10.4 +8.5 +9.9 +8.7* unweighted state averages
/ Voting Age Population / Voting Eligible Population
Table 4.2 Voter Turnout* in States with and without Election Day Registration, 1996 - 2004
Votes Cast for President
Election Day Registration
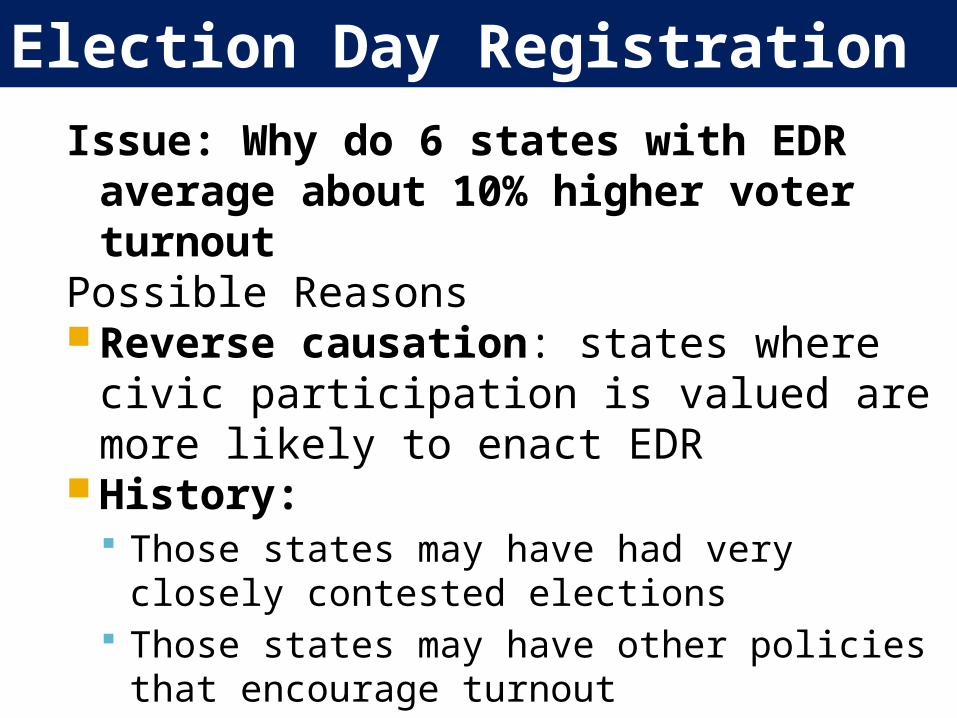
Issue: Why do 6 states with EDR average about 10% higher voter turnout
Possible Reasons Reverse causation: states where civic
participation is valued are more likely to enact EDR
History: Those states may have had very closely contested
elections Those states may have other policies that encourage
turnout
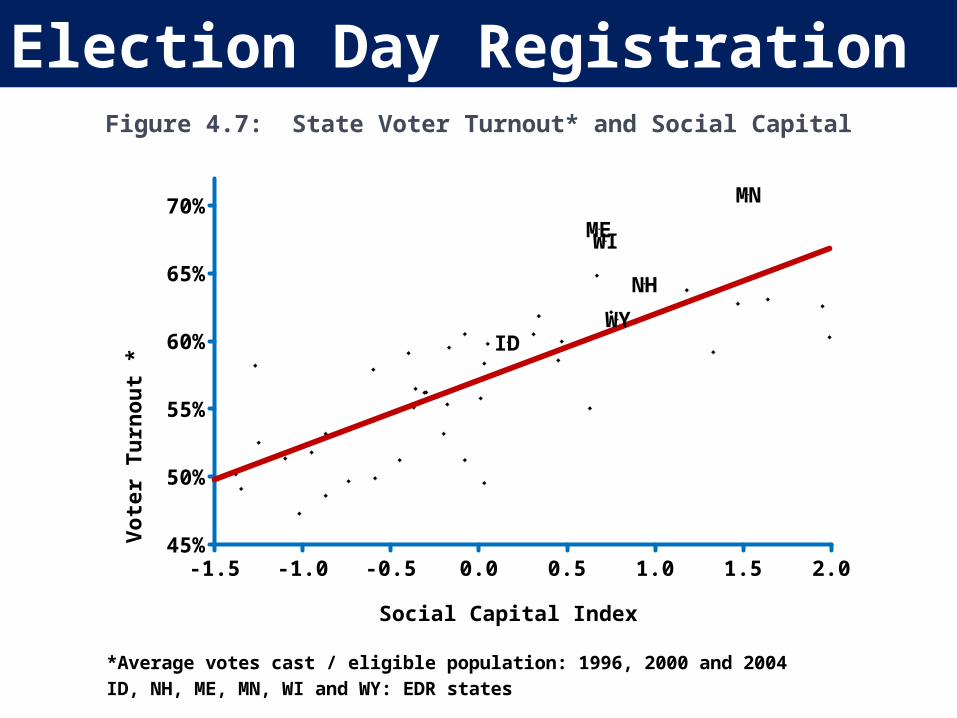
Election Day Registration
-1.5 -1.0 -0.5 0.0 0.5 1.0 1.5 2.045%
50%
55%
60%
65%
70%
ID
ME
MN
NH
WI
WY
Social Capital Index
Vo
ter
Tu
rno
ut
*
*Average votes cast / eligible population: 1996, 2000 and 2004ID, NH, ME, MN, WI and WY: EDR states
Figure 4.7: State Voter Turnout* and Social Capital