Embed Size (px)
Citation preview
COMPILATION OF STRONG MOTION COMPILATION OF STRONG MOTION DATA FROM EASTERN CANADA FOR DATA FROM EASTERN CANADA FOR
NGA-EAST PROJECTNGA-EAST PROJECT
Lan LinLan LinPostdoctoral Fellow, Geological Survey of CanadaPostdoctoral Fellow, Geological Survey of Canada

MotivationMotivation
• Ground motion data are very important for Ground motion data are very important for seismologists and earthquake engineers.seismologists and earthquake engineers.
• Processed data are useful for the development of Processed data are useful for the development of attenuation relations for eastern North America.attenuation relations for eastern North America.
• Strong motion data from eastern Canada have not Strong motion data from eastern Canada have not been complied and processed.been complied and processed.

Strong Motion Monitoring In Strong Motion Monitoring In Eastern CanadaEastern Canada
• Started in 1970s (AR-240 instruments).Started in 1970s (AR-240 instruments).
• First record: 1979 Charlevoix mFirst record: 1979 Charlevoix mNN 5.0 earthquake. 5.0 earthquake.
• Analog (Analog (SMA-1SMA-1) Network deployed in 1970s to record ) Network deployed in 1970s to record “next” Charlevoix earthquake on rock sites.“next” Charlevoix earthquake on rock sites.
-- recorded Saguenay mainshock, Quebec -- recorded Saguenay mainshock, Quebec -- 1988/11/25-- 1988/11/25
-- magnitude m-- magnitude mNN=6.5, distance from 43 to 200 km=6.5, distance from 43 to 200 km
Strong Motion Monitoring In Strong Motion Monitoring In Eastern CanadaEastern Canada
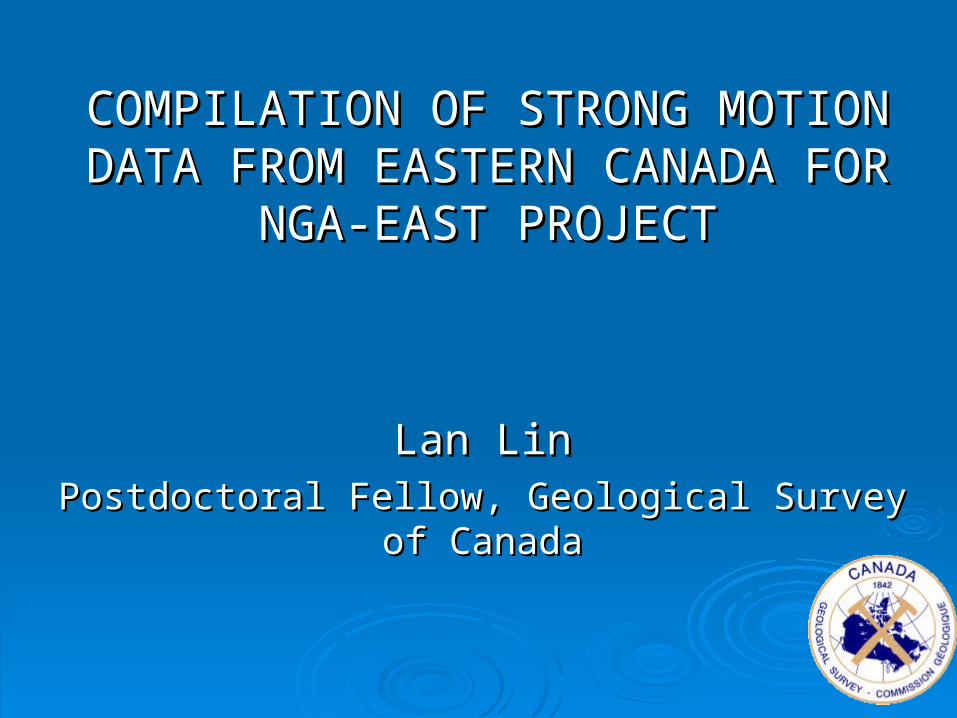
• Analog (SMA-1) instruments deployed during Analog (SMA-1) instruments deployed during aftershock sequences: aftershock sequences:
-- Miramichi, New Brunswick, 1982, magnitude m-- Miramichi, New Brunswick, 1982, magnitude mNN=5.8=5.8
-- Nahanni, Northwest Territories, 1985, magnitude m-- Nahanni, Northwest Territories, 1985, magnitude mNN=6.1 =6.1
• 33 SMA records from Saguenay Eq,33 SMA records from Saguenay Eq, 14 from Miramichi Eq, 16 from Nahanni Eq.14 from Miramichi Eq, 16 from Nahanni Eq.
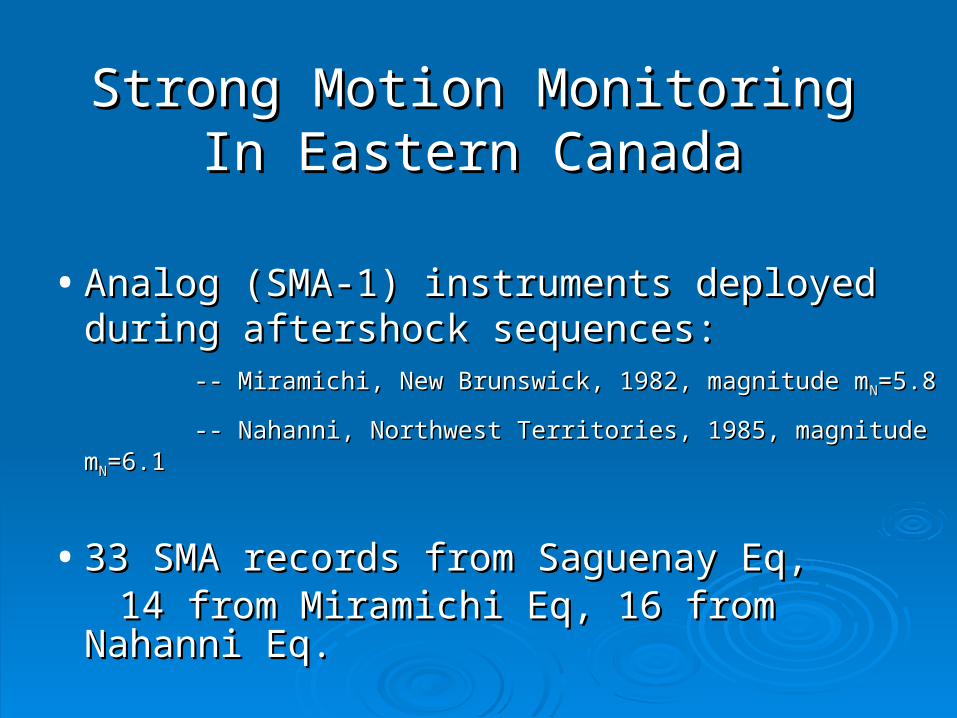
• SMA-1 instruments replaced by SMA-1 instruments replaced by ETNAETNA (on-site digital recording) (on-site digital recording) (1997-2004).(1997-2004).
• ETNAs supplemented by Internet Accelerometers (ETNAs supplemented by Internet Accelerometers (IAIA) 2004 ) 2004 onwards.onwards.
ETNA Instrument IA Instrument
Strong Motion Monitoring In Strong Motion Monitoring In Eastern CanadaEastern Canada
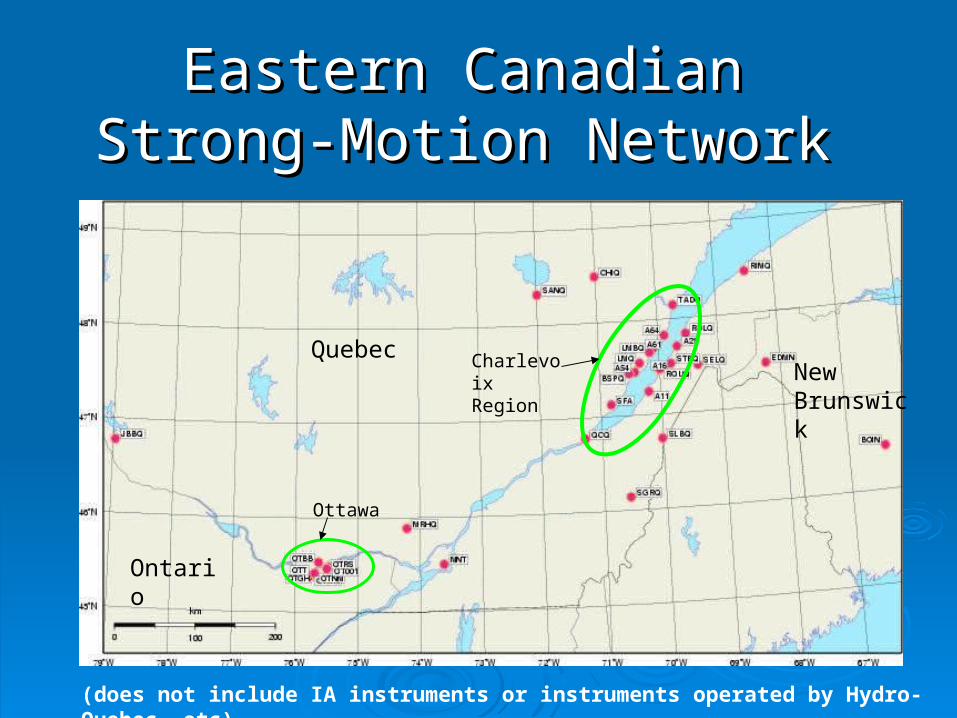
Eastern Canadian Eastern Canadian Strong-Motion Network Strong-Motion Network
(does not include IA instruments or instruments operated by Hydro-Quebec, etc)
GSC ETNA Stations
Quebec
Ontario
New Brunswick
Charlevoix Region
Ottawa
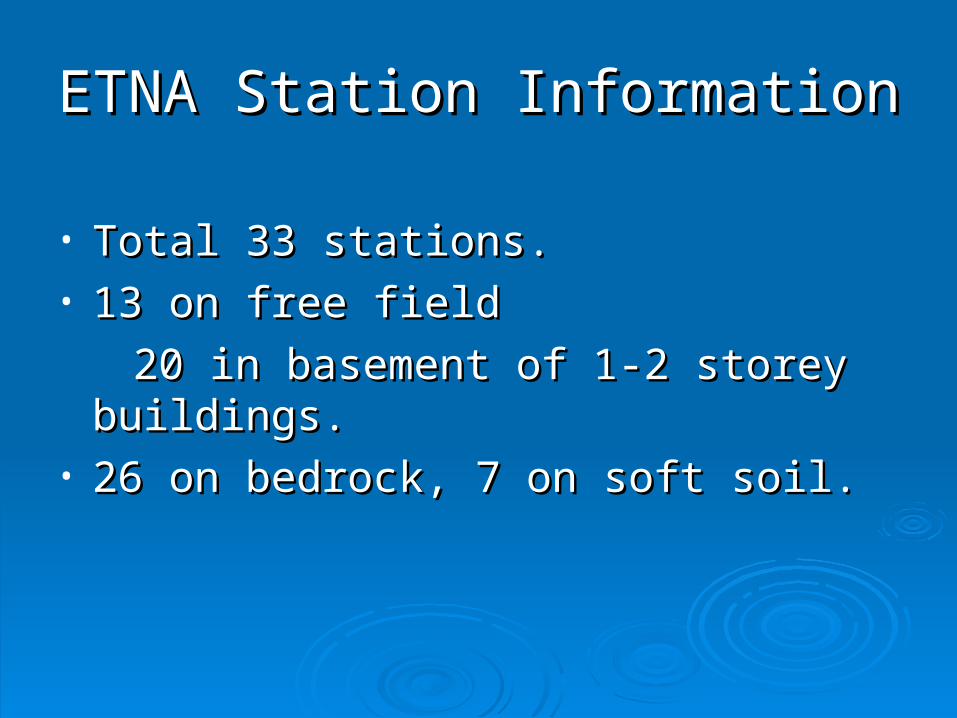
ETNA Station InformationETNA Station Information
• Total 33 stations.Total 33 stations.• 13 on free field 13 on free field
20 in basement of 1-2 storey buildings.20 in basement of 1-2 storey buildings.• 26 on bedrock, 7 on soft soil.26 on bedrock, 7 on soft soil.
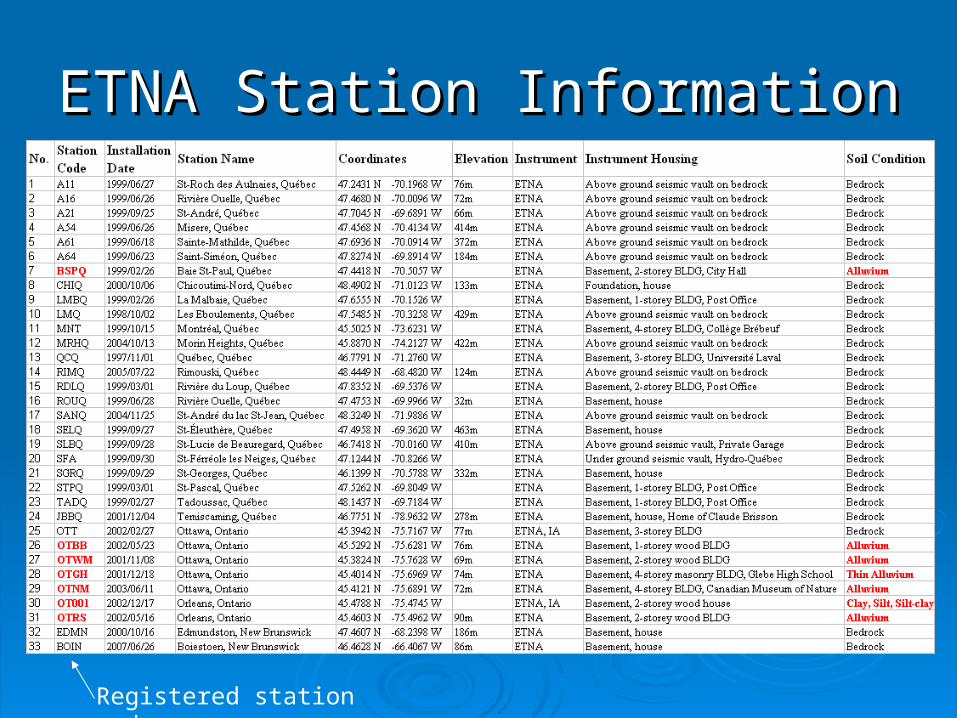
ETNA Station InformationETNA Station Information
Registered station code

Characteristics of Characteristics of ETNAETNA
• Data type: accelerationData type: acceleration• Number of components recorded: two Number of components recorded: two
orthogonal horizontal, one verticalorthogonal horizontal, one vertical• Sampling rate: 200s/s (i.e., Sampling rate: 200s/s (i.e., ΔΔT=0.005s)T=0.005s)• 10 seconds of pre-event duration10 seconds of pre-event duration• Unit: VoltUnit: Volt
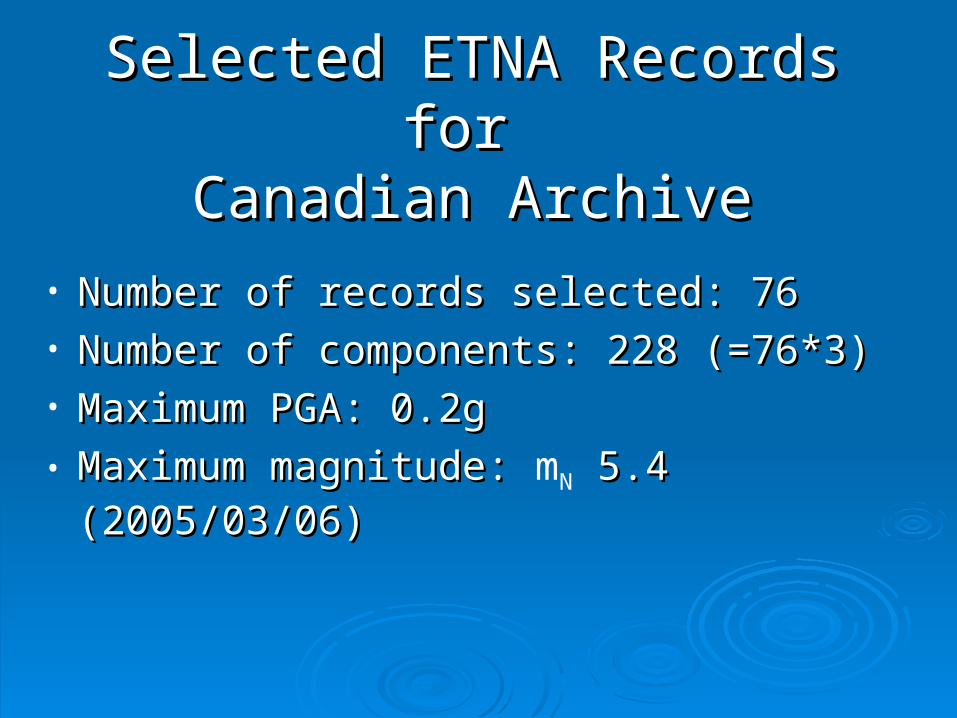
Selected ETNA Records for Selected ETNA Records for Canadian ArchiveCanadian Archive
• Number of records selected: 76Number of records selected: 76• Number of components: 228 (=76*3)Number of components: 228 (=76*3)• Maximum PGA: 0.2gMaximum PGA: 0.2g
• Maximum magnitude: Maximum magnitude: mN 5.4 (2005/03/06) 5.4 (2005/03/06)

Typical Record InformationTypical Record Information
Magnitude is currently mN - will be changed to moment magnitude

Storage of ETNA DataStorage of ETNA Data
• Canadian National Waveform ArchiveCanadian National Waveform Archivei.e., accessible to all through web-based toolsi.e., accessible to all through web-based tools
• Data type: raw data, without baseline Data type: raw data, without baseline correction and filteringcorrection and filtering• Data format: CAData format: CA• Data unit: nVolt (=10Data unit: nVolt (=1099*Volt)*Volt)• Channel code: HNN (N-S)Channel code: HNN (N-S) HNZ (Vertical) HNZ (Vertical) HNE (E-W)HNE (E-W)
“SEED” Convention
Orientation codeInstrument code
Band code

Storage ProcedureStorage Procedure
• Step 1: Extract original event file (.EVT) for every record.Step 1: Extract original event file (.EVT) for every record.
• Step 2: Convert .EVT file into ASCII file,Step 2: Convert .EVT file into ASCII file, generate 3 data files, for N-S, V, and E-W comp.generate 3 data files, for N-S, V, and E-W comp.
• Step 3: Modify ASCII file.Step 3: Modify ASCII file. (a) add header information, i.e., station code, channel code, (a) add header information, i.e., station code, channel code, event start time, sample rate, and number of data points. event start time, sample rate, and number of data points. (b) change units (Volt(b) change units (Volt nVolt, i.e., multiply by 10 nVolt, i.e., multiply by 1099).).
• Step 4: Generate CA file. Step 4: Generate CA file.
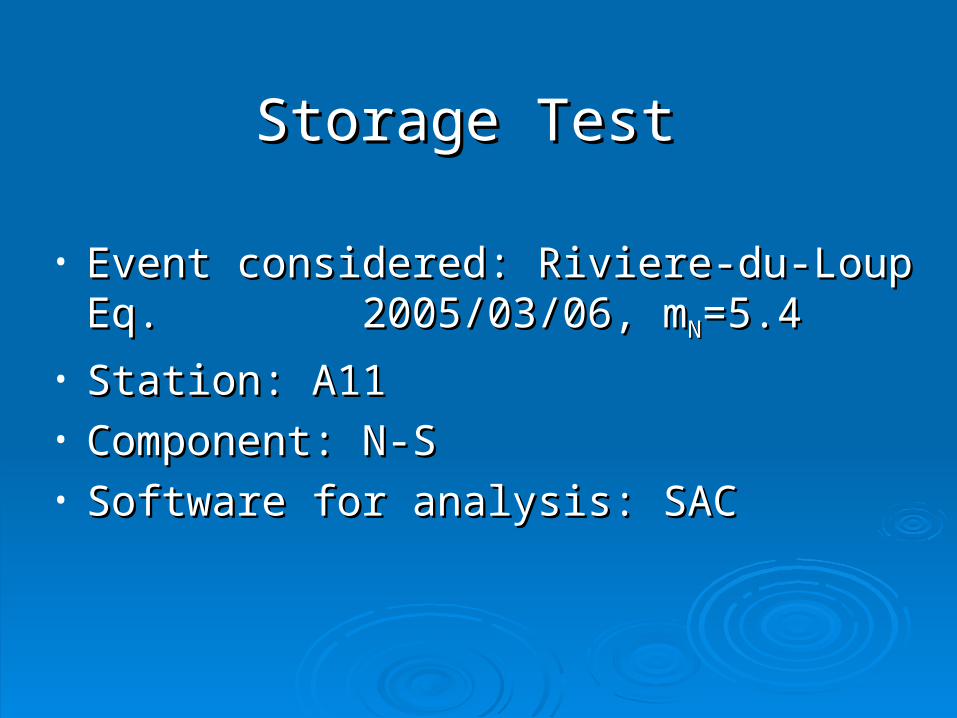
Storage TestStorage Test
• Event considered: Riviere-du-Loup Eq. Event considered: Riviere-du-Loup Eq. 2005/03/06, m2005/03/06, mNN=5.4=5.4
• Station: A11Station: A11• Component: N-SComponent: N-S• Software for analysis: SAC Software for analysis: SAC
Acceleration (nVolt)
Tim
e (s
)
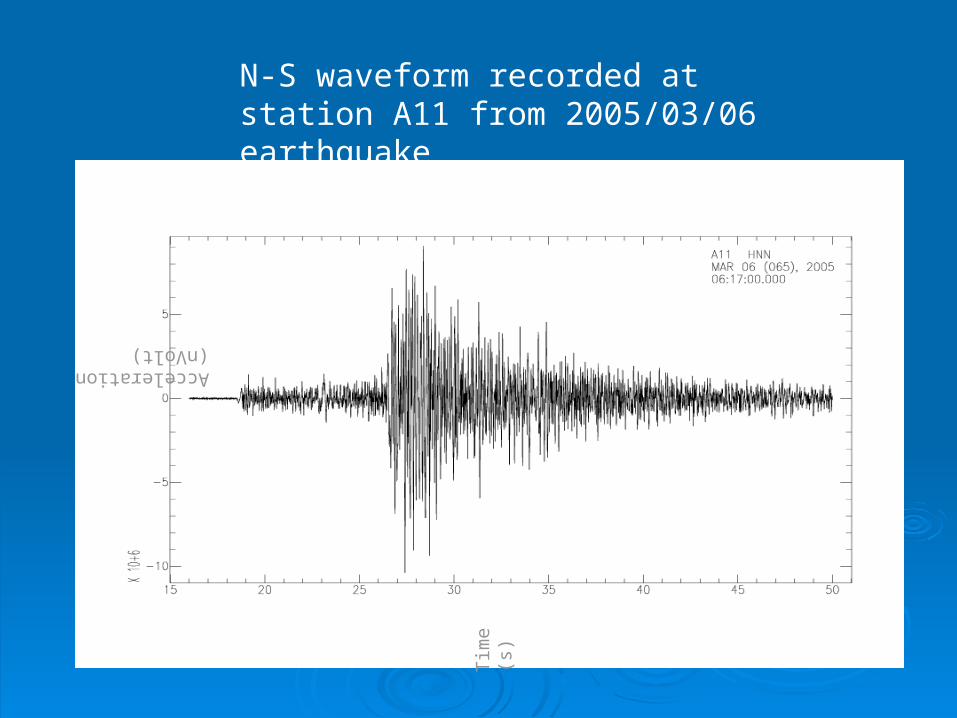
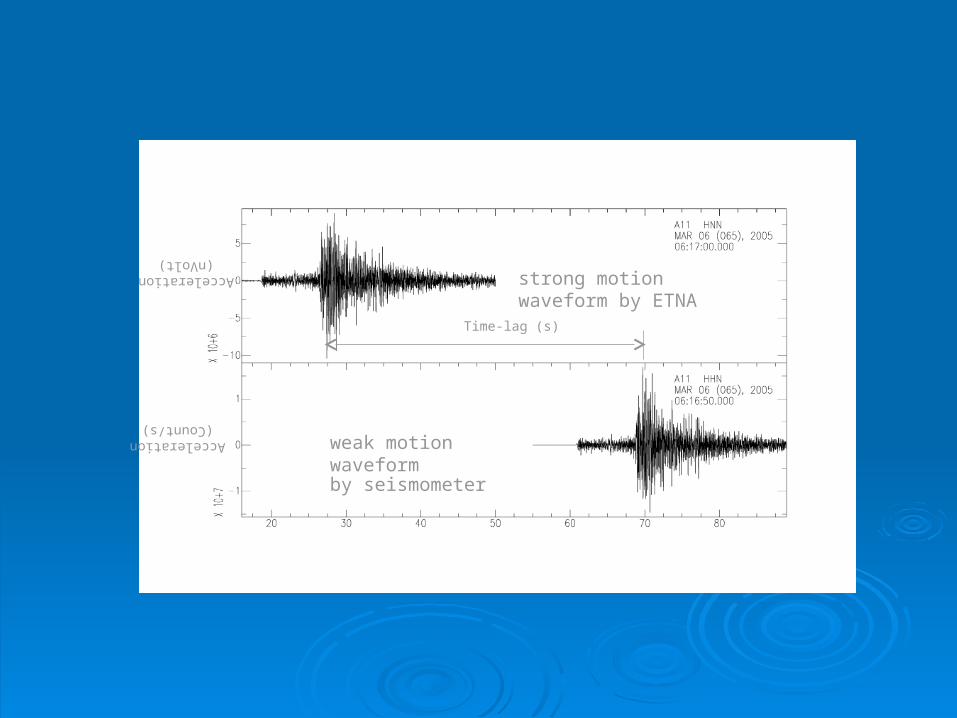
N-S waveform recorded at station A11 from 2005/03/06 earthquake

Weak-Motion Monitoring InstrumentsWeak-Motion Monitoring Instruments
• Seismometers Seismometers • Data type: Data type: VELOCITY VELOCITY • Number of components recorded: two horizontal Number of components recorded: two horizontal
components, one vertical componentcomponents, one vertical component• Sampling rate: 40s/s, 100s/sSampling rate: 40s/s, 100s/s• Unit: CountUnit: Count
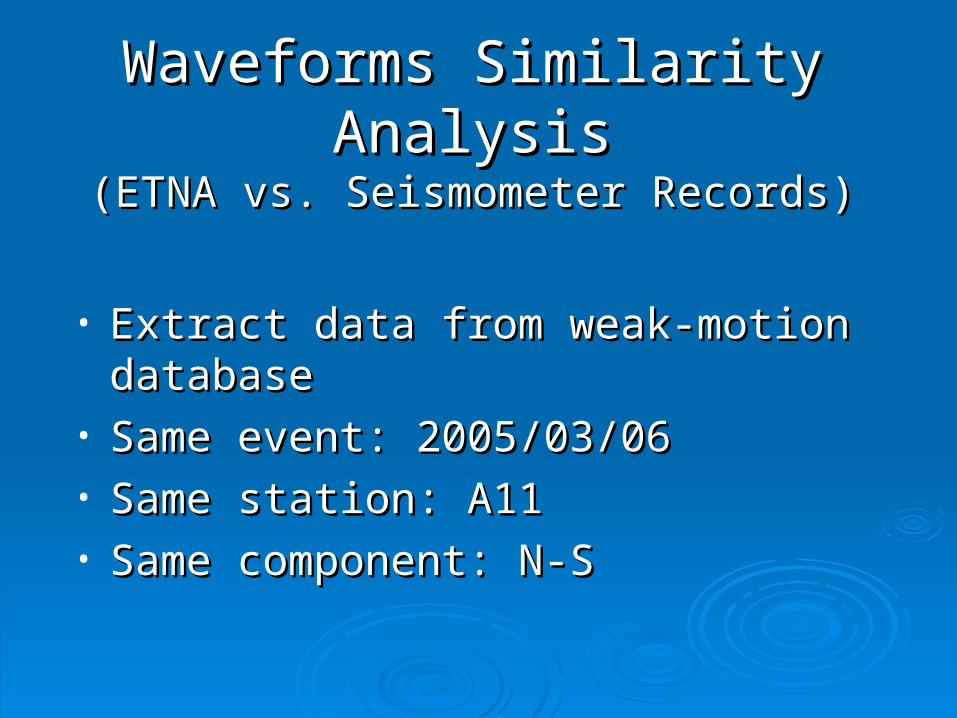
Waveforms Similarity AnalysisWaveforms Similarity Analysis(ETNA vs. Seismometer Records)(ETNA vs. Seismometer Records)
• Extract data from weak-motion databaseExtract data from weak-motion database• Same event: 2005/03/06Same event: 2005/03/06• Same station: A11Same station: A11• Same component: N-SSame component: N-S

N-S waveform recorded at station A11 for 2005/03/06 earthquake (weak-motion instrument)
Velocity (Count)
Tim
e (s
)
Velocity waveform
Tim
e (s
)
Acceleration (Count/s)
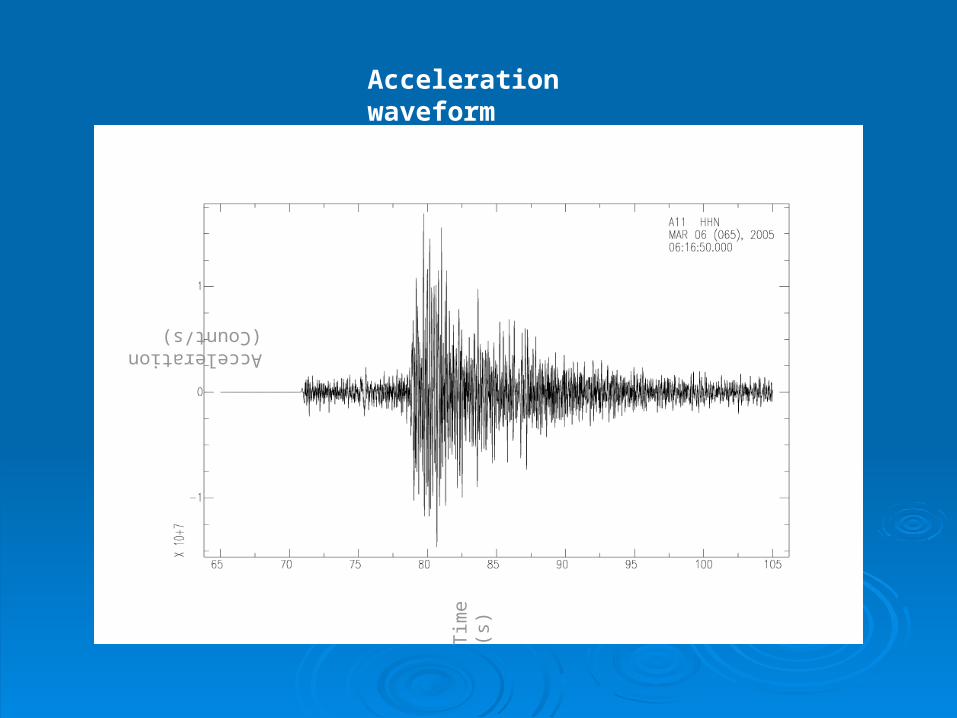
Acceleration waveform
Time (s)
Acceleration(Count/s)
Acceleration(nVolt)
Time-lag (s)
strong motion waveform by ETNA
weak motion waveformby seismometer
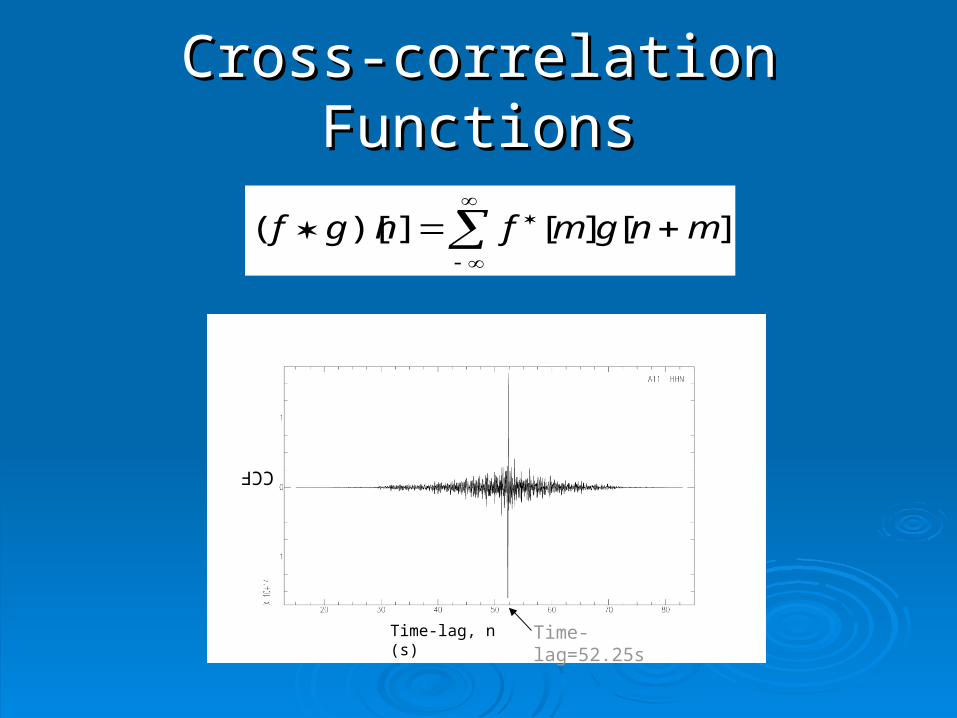
Cross-correlation FunctionsCross-correlation Functions
CCF][][])[( mngmfngf
Time-lag=52.25sTime-lag, n (s)

-0.01
-0.008
-0.006
-0.004
-0.002
0
0.002
0.004
0.006
0.008
0.01
0 5 10 15 20 25 30 35 40
Time (s)
Acc
ele
ratio
n (
g)
HNN
HHN
-0.01
-0.008
-0.006
-0.004
-0.002
0
0.002
0.004
0.006
0.008
0.01
10 10.5 11 11.5 12 12.5 13 13.5 14 14.5 15
Time (s)
Acc
ele
ratio
n (
g)
HNN
HHN
Correlation coefficient=0.993
Time-traces for segment 10s15s
GOOD AGREEMENT!!!
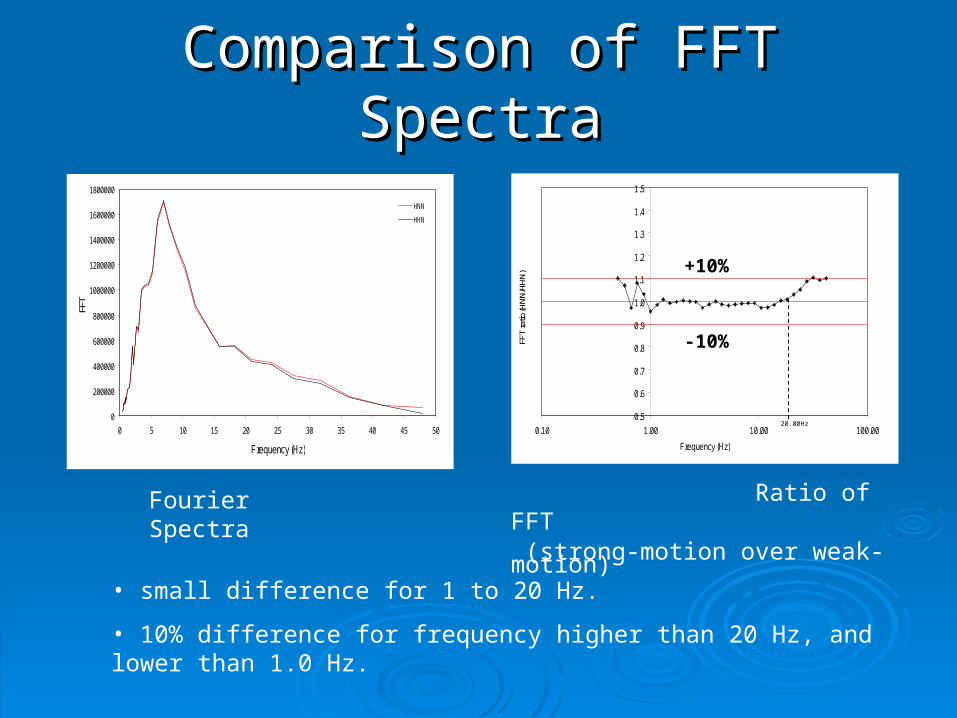
• small difference for 1 to 20 Hz.
• 10% difference for frequency higher than 20 Hz, and lower than 1.0 Hz.
0.5
0.6
0.7
0.8
0.9
1.0
1.1
1.2
1.3
1.4
1.5
0.10 1.00 10.00 100.00
Frequency (Hz)
FFT
ratio
(HN
N/H
HN
)
Comparison of FFT SpectraComparison of FFT Spectra
0
200000
400000
600000
800000
1000000
1200000
1400000
1600000
1800000
0 5 10 15 20 25 30 35 40 45 50
Frequency (Hz)
FFT
HNN
HHN
Fourier Spectra Ratio of FFT (strong-motion over weak-motion)
20.00Hz
+10%
-10%

ConclusionsConclusions
• Meta-data for records have been assembled. Meta-data for records have been assembled. About About 300300 records for storage. records for storage.
• Waveform storage procedure for ETNAWaveform storage procedure for ETNA data is established. Similar procedure can be data is established. Similar procedure can be
used for SMA data and IA data.used for SMA data and IA data.
• Data from eastern Canada are ready for Data from eastern Canada are ready for uploading to Canadian National Waveform uploading to Canadian National Waveform Archive.Archive.
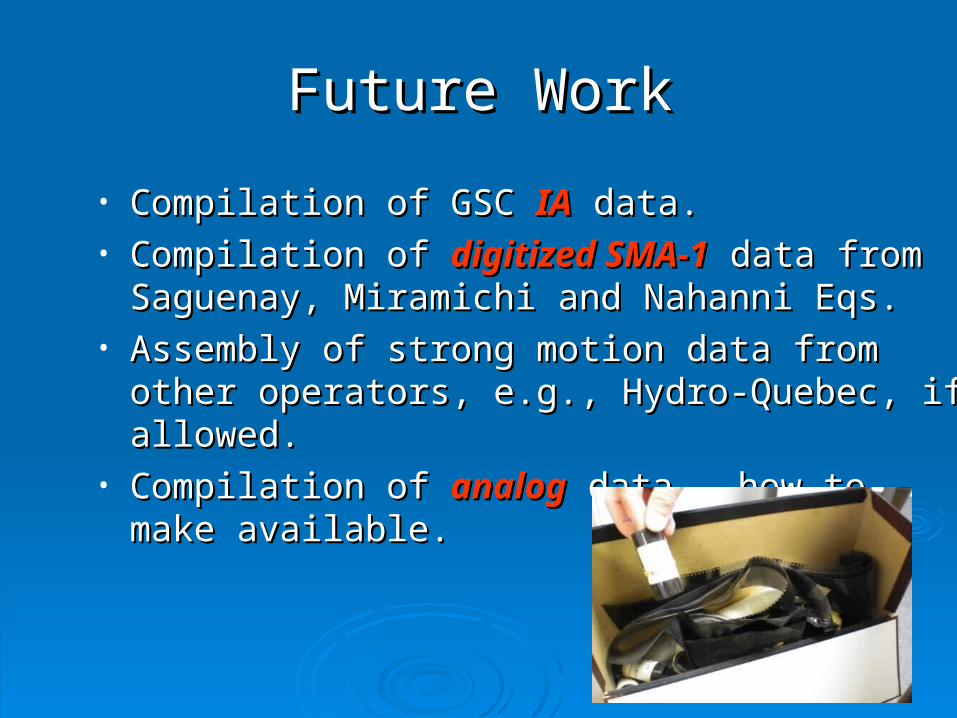
Future WorkFuture Work
• Compilation of GSC Compilation of GSC IAIA data. data.• Compilation of Compilation of digitized SMA-1digitized SMA-1 data from data from
Saguenay, Miramichi and Nahanni Eqs. Saguenay, Miramichi and Nahanni Eqs. • Assembly of strong motion data from other Assembly of strong motion data from other
operators, e.g., Hydro-Quebec, if allowed.operators, e.g., Hydro-Quebec, if allowed.• Compilation of Compilation of analoganalog data – how to make data – how to make
available.available.

Thank you!Thank you!
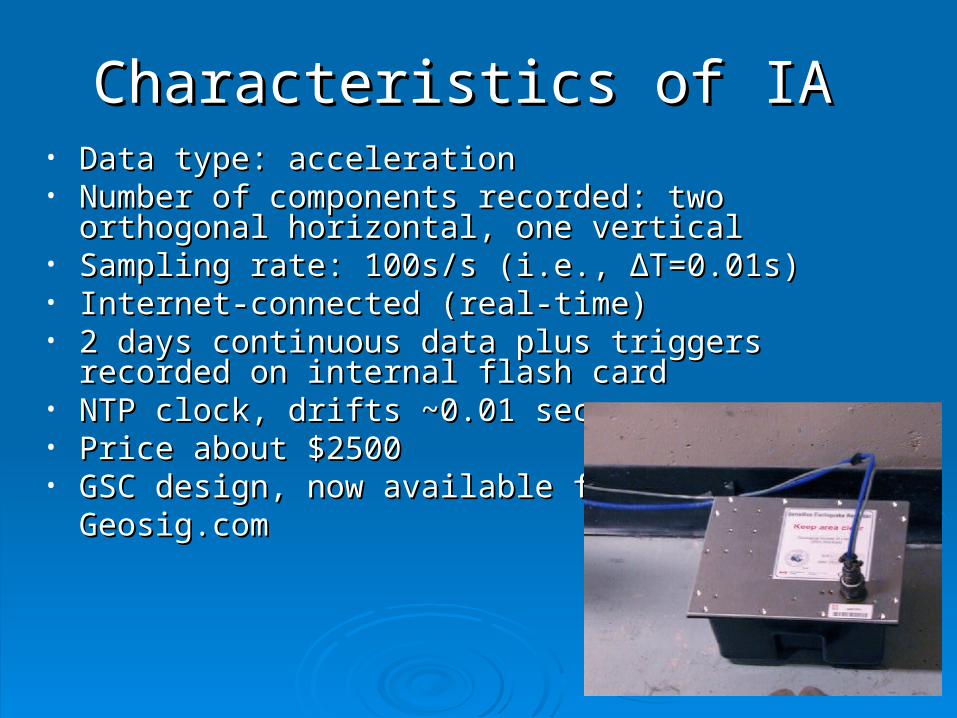
Characteristics of Characteristics of IAIA • Data type: accelerationData type: acceleration• Number of components recorded: two orthogonal Number of components recorded: two orthogonal
horizontal, one verticalhorizontal, one vertical• Sampling rate: 100s/s (i.e., Sampling rate: 100s/s (i.e., ΔΔT=0.01s)T=0.01s)• Internet-connected (real-time)Internet-connected (real-time)• 2 days continuous data plus triggers recorded on internal 2 days continuous data plus triggers recorded on internal
flash cardflash card• NTP clock, drifts ~0.01 secNTP clock, drifts ~0.01 sec• Price about $2500Price about $2500• GSC design, now available from GSC design, now available from
Geosig.comGeosig.com