Embed Size (px)
Citation preview

Competitive leverage in cell phone manufacturing: Lenovo Moto Company strategy on packaging design
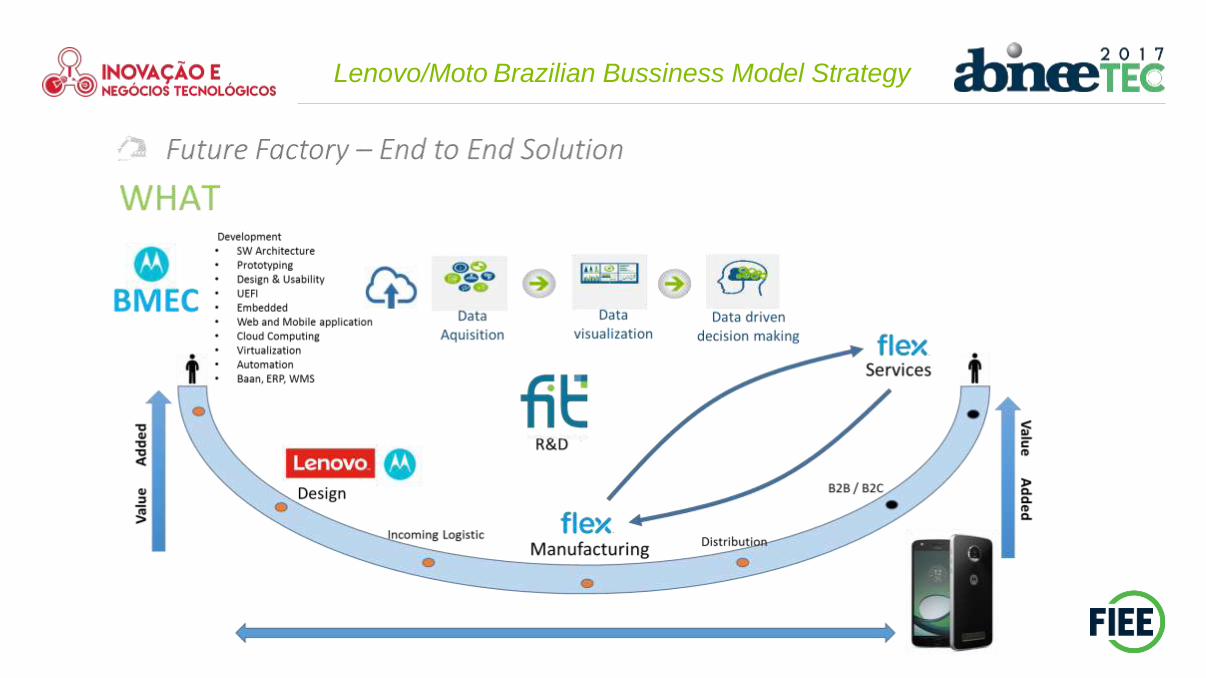
Lenovo/Moto Brazilian Bussiness Model Strategy
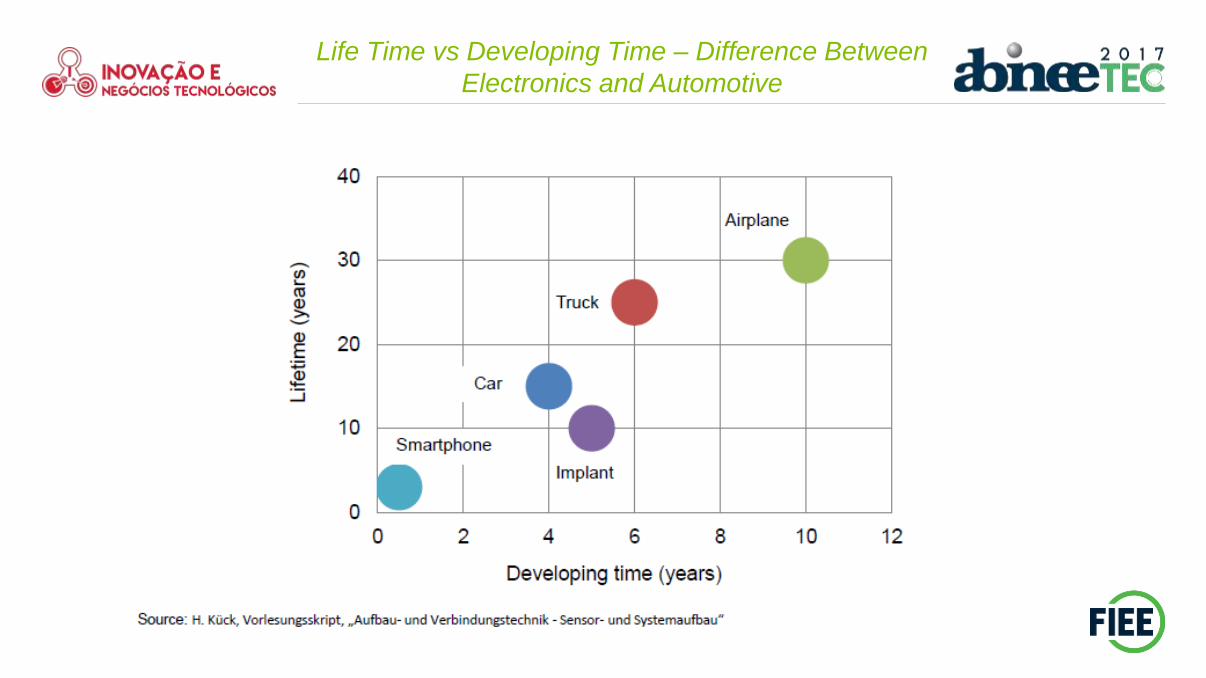
Life Time vs Developing Time – Difference Between
Electronics and Automotive
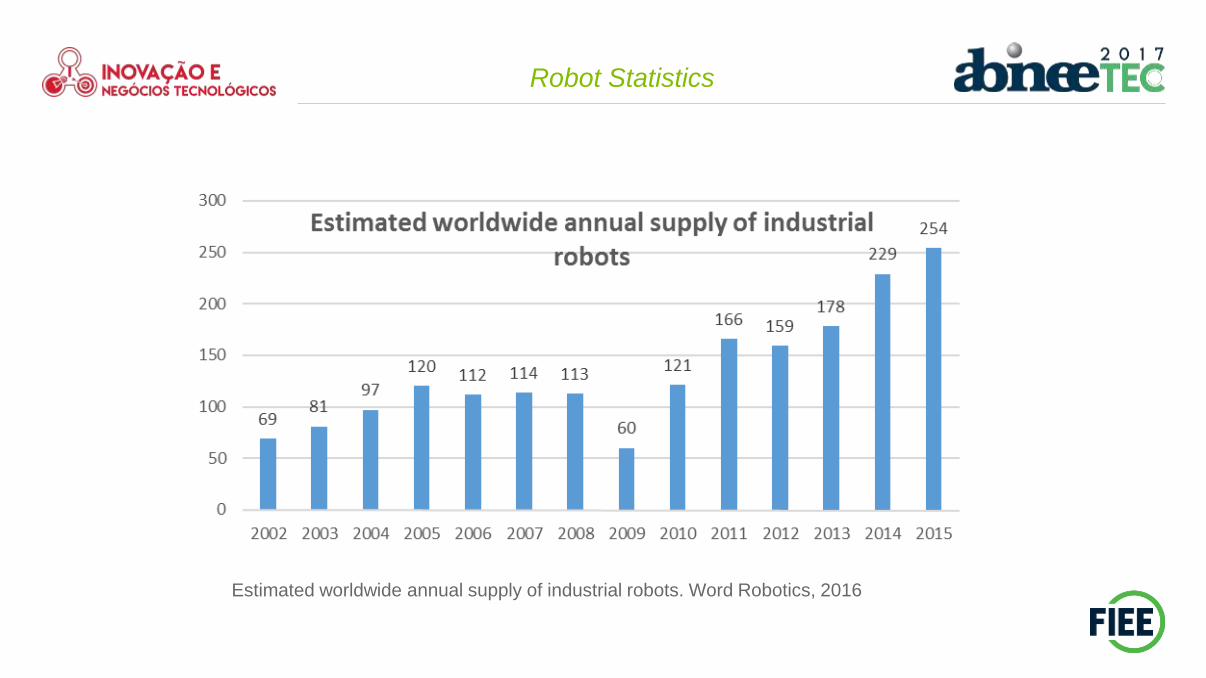
Robot Statistics
Estimated worldwide annual supply of industrial robots. Word Robotics, 2016
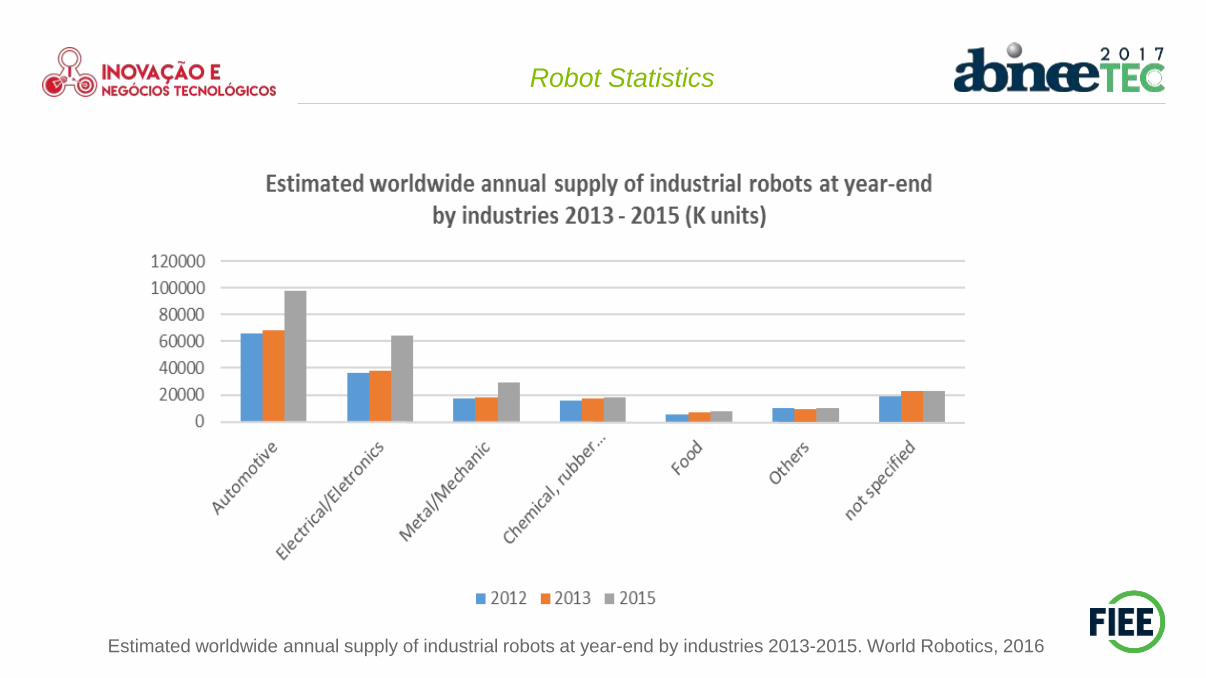
Estimated worldwide annual supply of industrial robots at year-end by industries 2013-2015. World Robotics, 2016
Robot Statistics
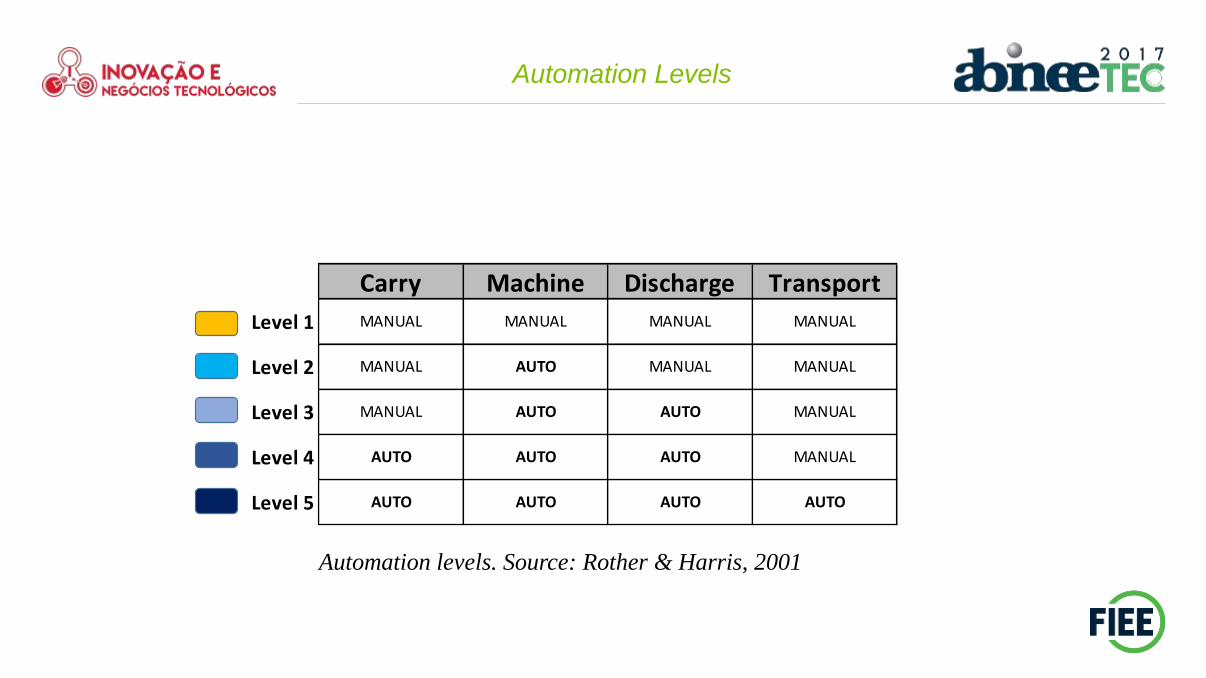
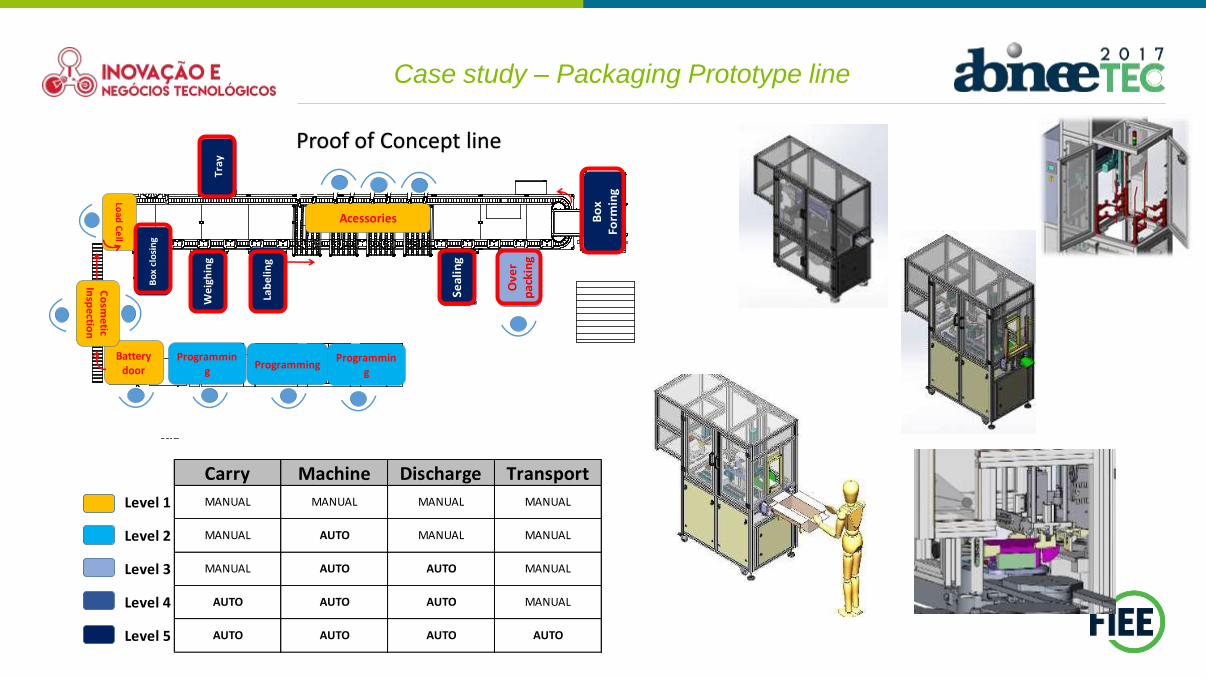
Automation Levels
Automation levels. Source: Rother & Harris, 2001
Level 5 AUTO AUTO AUTO AUTO
Level 3 MANUAL AUTO AUTO MANUAL
Level 4 AUTO AUTO AUTO MANUAL
Level 2 MANUAL AUTO MANUAL MANUAL
Level 1 MANUAL MANUAL MANUAL MANUAL
Carry Machine Discharge Transport
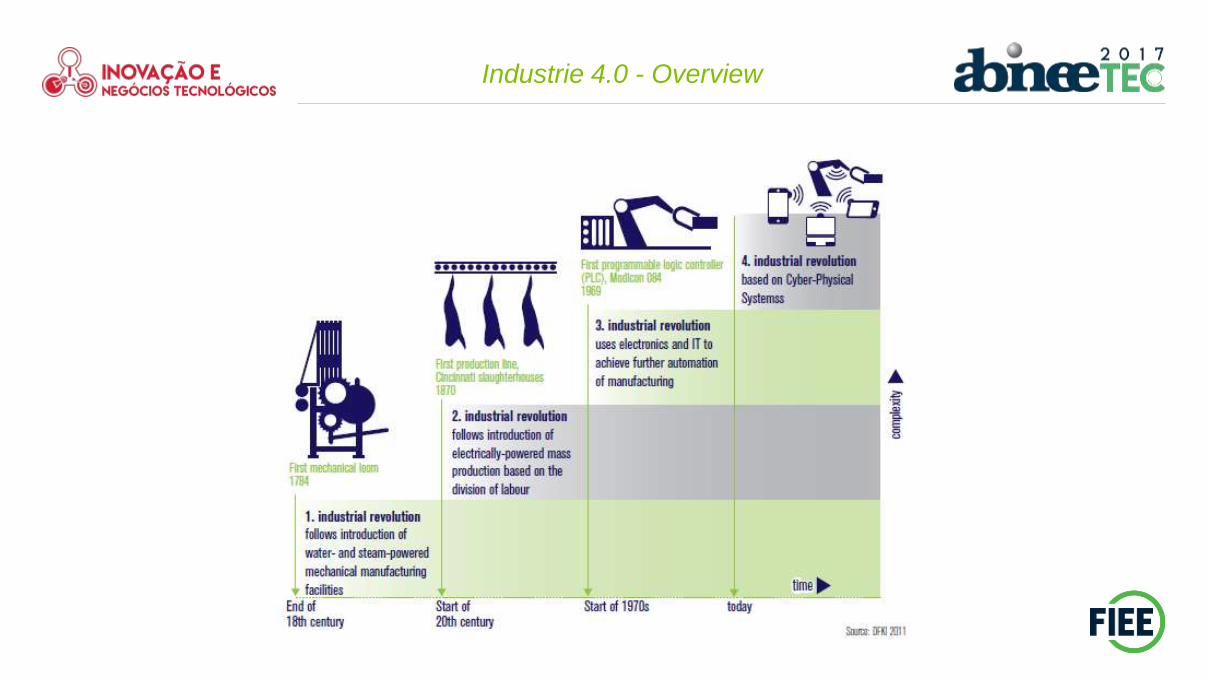
Industrie 4.0 - Overview
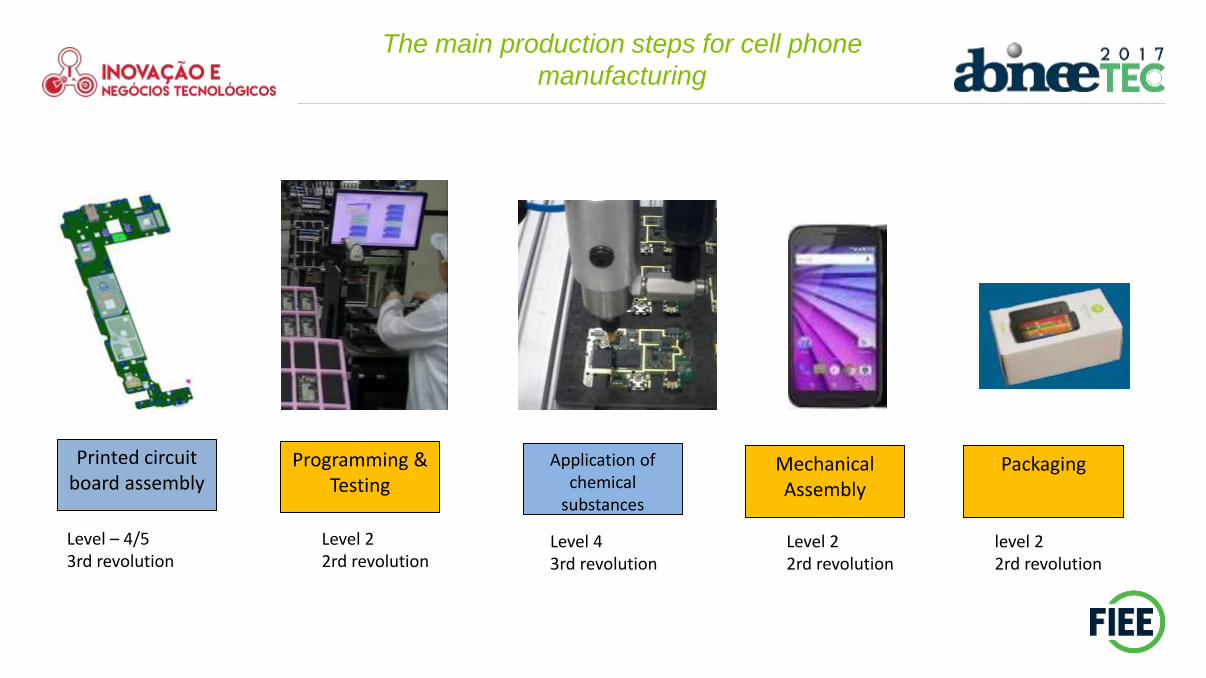
The main production steps for cell phone
manufacturing
Level – 4/53rd revolution
Level 22rd revolution
Level 43rd revolution
Level 22rd revolution
level 22rd revolution
Printed circuit board assembly
Programming & Testing
Application of chemical
substances
Mechanical Assembly
Packaging
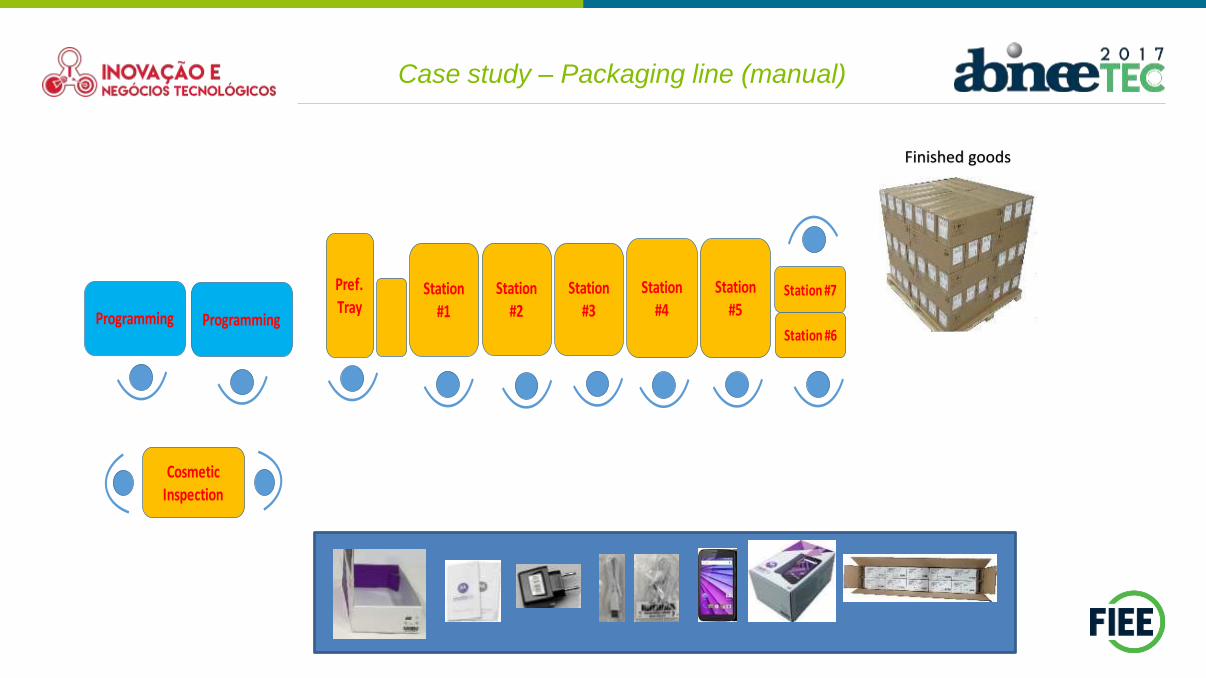
Programming Programming
Station #1
Station #2
Station #4
Station #6
Station #7Pref.Tray
Station #3
Station #5
CosmeticInspection
Finished goods
Case study – Packaging line (manual)
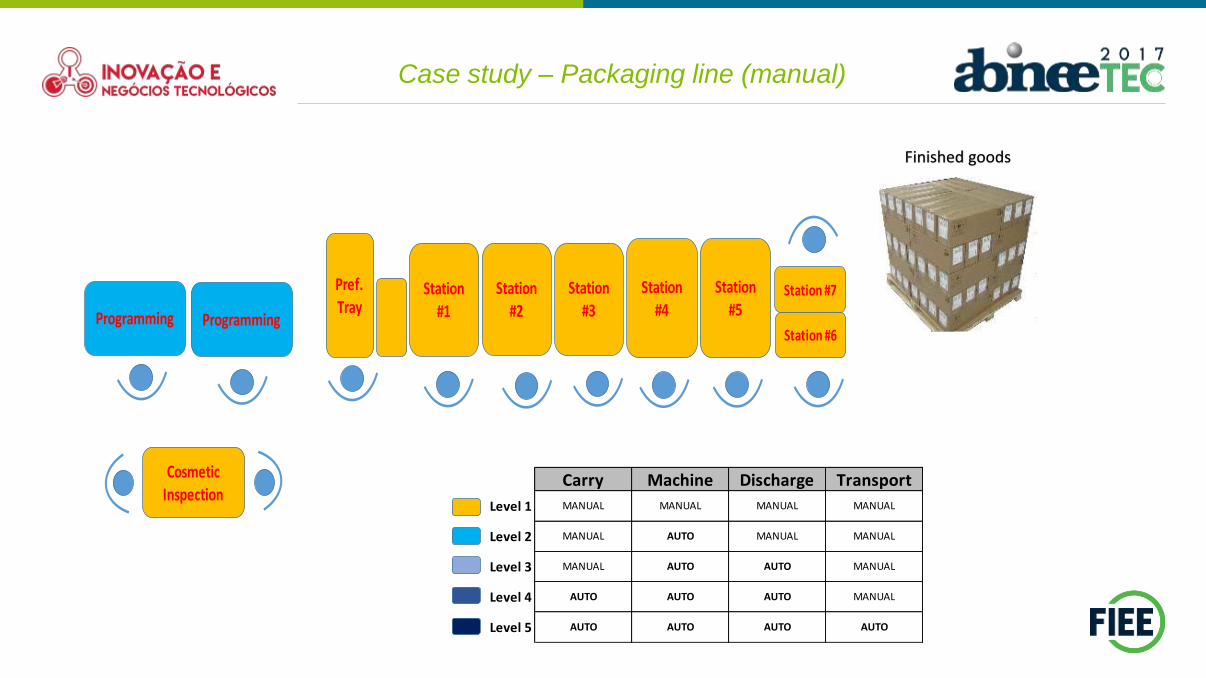
Level 5 AUTO AUTO AUTO AUTO
Level 3 MANUAL AUTO AUTO MANUAL
Level 4 AUTO AUTO AUTO MANUAL
Level 2 MANUAL AUTO MANUAL MANUAL
Level 1 MANUAL MANUAL MANUAL MANUAL
Carry Machine Discharge Transport
Case study – Packaging line (manual)
Programming Programming
Station #1
Station #2
Station #4
Station #6
Station #7Pref.Tray
Station #3
Station #5
CosmeticInspection
Finished goods
Programming
Batterydoor
Load
Ce
ll
Acessories Bo
x Fo
rmin
g
Bo
x cl
osi
ng
We
igh
ing
Lab
eli
ng
Tra
y
Seal
ing
Ove
r p
acki
ng
Co
sme
tic In
spe
ction
ProgrammingProgrammin
g
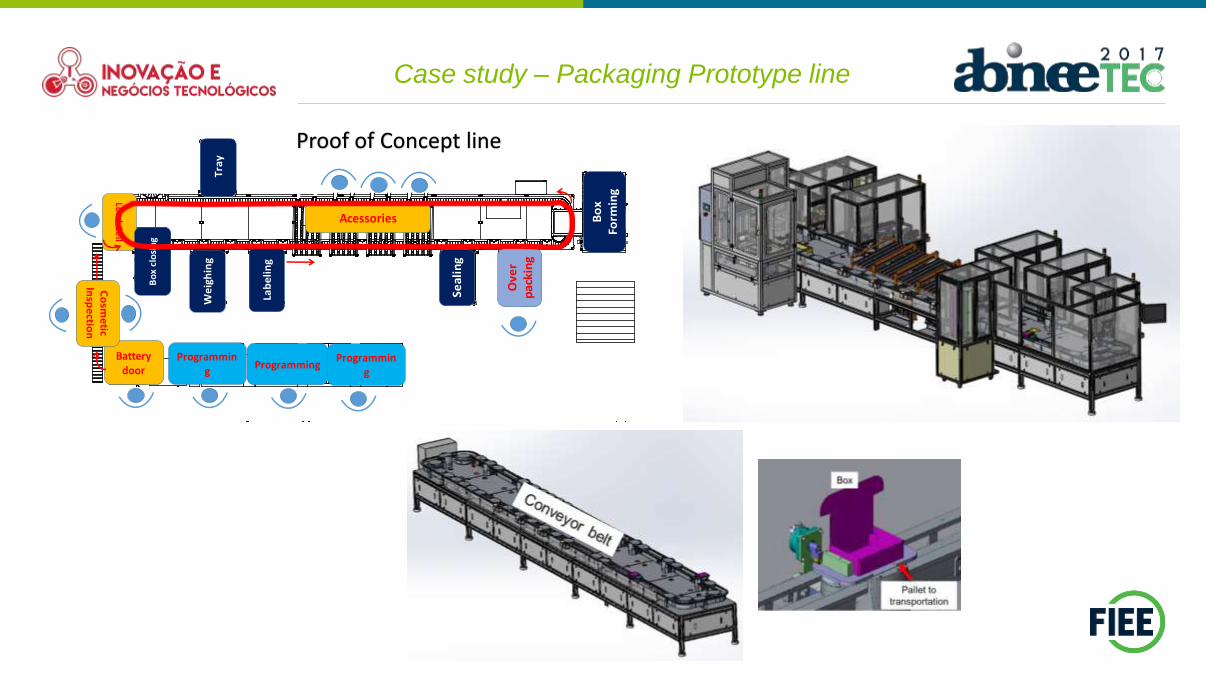
Case study – Packaging Prototype line
Proof of Concept line
Programming
Batterydoor
Load
Ce
ll
Acessories Bo
x Fo
rmin
g
Bo
x cl
osi
ng
We
igh
ing
Lab
eli
ng
Tra
y
Seal
ing
Ove
r p
acki
ng
Co
sme
tic In
spe
ction
ProgrammingProgrammin
g
Case study – Packaging Prototype line
Level 2 MANUAL AUTO MANUAL MANUAL
Level 1 MANUAL MANUAL MANUAL MANUAL
Carry Machine Discharge Transport
Level 4 AUTO AUTO AUTO MANUAL
Level 3 MANUAL AUTO AUTO MANUAL
Level 5 AUTO AUTO AUTO AUTO
Proof of Concept line
Case study – video
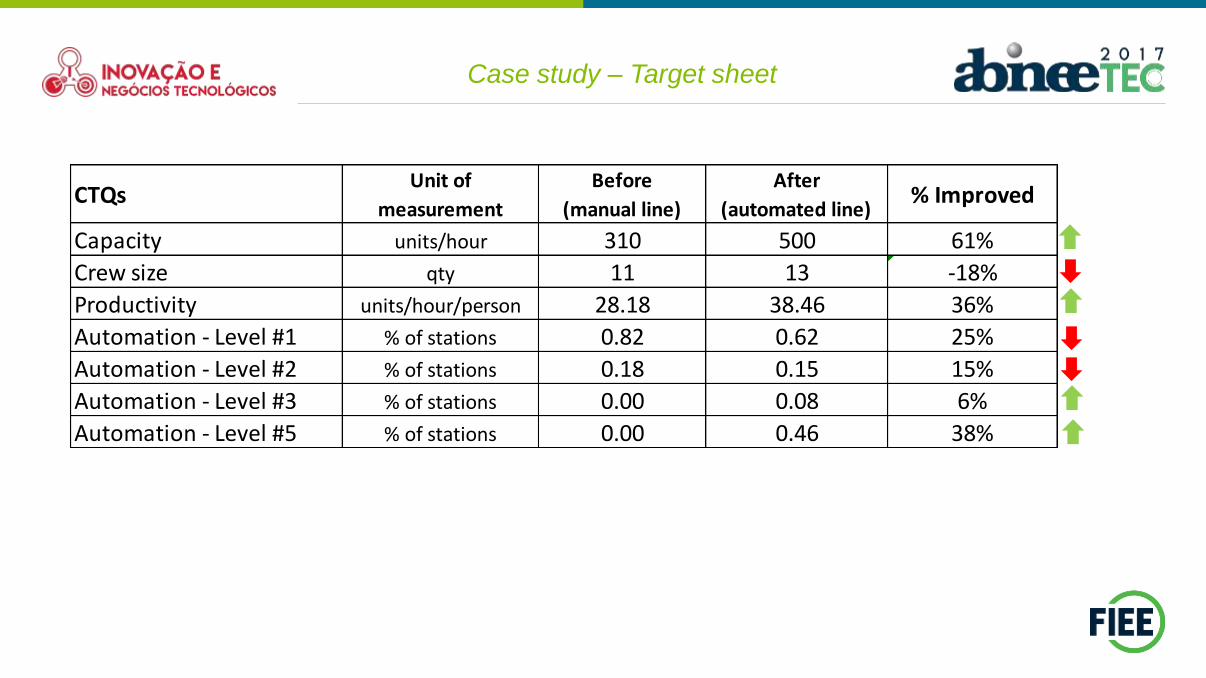
CTQsUnit of
measurement
Before
(manual line)
After
(automated line)% Improved
Capacity units/hour 310 500 61%
Crew size qty 11 13 -18%
Productivity units/hour/person 28.18 38.46 36%
Automation - Level #1 % of stations 0.82 0.62 25%
Automation - Level #2 % of stations 0.18 0.15 15%
Automation - Level #3 % of stations 0.00 0.08 6%
Automation - Level #5 % of stations 0.00 0.46 38%
Case study – Target sheet
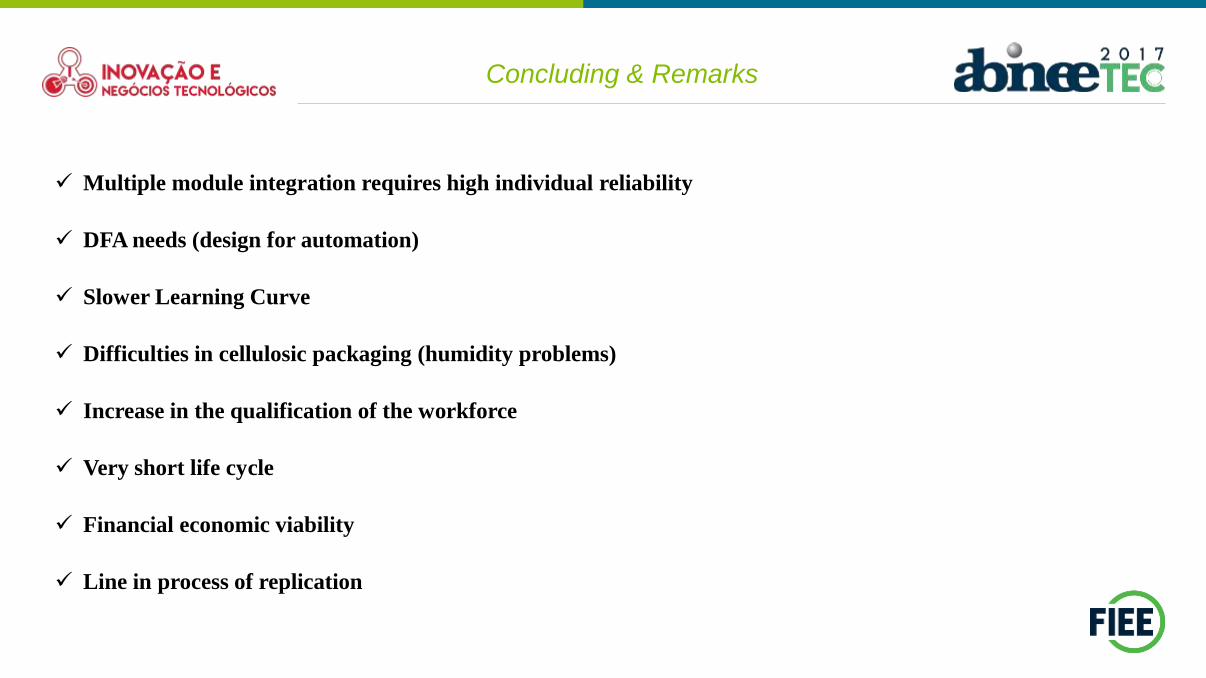
✓ Multiple module integration requires high individual reliability
✓ DFA needs (design for automation)
✓ Slower Learning Curve
✓ Difficulties in cellulosic packaging (humidity problems)
✓ Increase in the qualification of the workforce
✓ Very short life cycle
✓ Financial economic viability
✓ Line in process of replication
Concluding & Remarks