Embed Size (px)
Citation preview

Competition Links and Stock Returns
Assaf Eisdorfer1 Kenneth Froot2 Gideon Ozik3 Ronnie Sadka4
1University of Connecticut2Harvard Business School
3EDHEC4Boston College
Oct 2019
1

Motivation
The information content of corporate financial statements has been explored for many years
The common objective of these studies:• To assess what investors can learn about a certain company
from the information embedded in its financial statements
Our study:• What we can learn about a company from the point of view
of its competitors
A firm being aimed at earns high returns:• Indicates attractive business opportunities?• Presents risk of business disruption?
2

How to measure competition?
Competition section in 10-K filings
Check which firms are being pointed at – strong competitors
• Technological challenges
• But not all mentions are created equally!
• A mention by a major competitor should count more than a mention by a minor competitor
Competition status should be evaluated simultaneously across all firms
• Implement a Google PageRank-type algorithm
3

Measuring competition Measuring a given firm’s competition strength from the
competition-link system across all firms
Firm A 10-K
Competition:
Firm B
Firm B 10-K
Competition:
Firm C
Firm C 10-K
Competition:
Firm A
Firm B
4

Measuring a given firm’s competition strength from the competition-link system across all firms
Firm A 10-K
Competition:
Firm B
Firm B 10-K
Competition:
Firm C
Firm C 10-K
Competition:
Firm A
Firm B
Measuring competition
• 𝐶𝐶𝐶𝐶 𝐴𝐴 = 1−𝑑𝑑𝑁𝑁
+ 𝑑𝑑 × 𝐶𝐶𝐶𝐶(𝐶𝐶)2
• 𝐶𝐶𝐶𝐶 𝐵𝐵 = 1−𝑑𝑑𝑁𝑁
+ 𝑑𝑑 × 𝐶𝐶𝐶𝐶 𝐴𝐴 + 𝐶𝐶𝐶𝐶(𝐶𝐶)2
• 𝐶𝐶𝐶𝐶 𝐶𝐶 = 1−𝑑𝑑𝑁𝑁
+ 𝑑𝑑 × 𝐶𝐶𝐶𝐶(𝐵𝐵)
5

Measuring a given firm’s competition strength from the competition-link system across all firms
Firm A 10-K
Competition:
Firm B
Firm B 10-K
Competition:
Firm C
Firm C 10-K
Competition:
Firm A
Firm B
Measuring competition
• 𝐶𝐶𝐶𝐶 𝐴𝐴 = 1−𝑑𝑑𝑁𝑁
+ 𝑑𝑑 × 𝐶𝐶𝐶𝐶(𝐶𝐶)2
• 𝐶𝐶𝐶𝐶 𝐵𝐵 = 1−𝑑𝑑𝑁𝑁
+ 𝑑𝑑 × 𝐶𝐶𝐶𝐶 𝐴𝐴 + 𝐶𝐶𝐶𝐶(𝐶𝐶)2
• 𝐶𝐶𝐶𝐶 𝐶𝐶 = 1−𝑑𝑑𝑁𝑁
+ 𝑑𝑑 × 𝐶𝐶𝐶𝐶(𝐵𝐵)
Assuming 0.7 damping factor:
• 𝐶𝐶𝐶𝐶 𝐴𝐴 = 0.2314• 𝐶𝐶𝐶𝐶 𝐵𝐵 = 0.3933• 𝐶𝐶𝐶𝐶 𝐶𝐶 = 0.3753
6

The C-Rank measure of competition
The C-Rank is not an independent assessment based on observed firm characteristics, such as firm size or product market share
Rather, it reflects the collective view of all companies on who the strong competitors in the market are
This feature can identify an element of a firm’s profile• We find high C-rank firms significantly outperform
Hypotheses:• Mispricing: High C-Rank signifies business opportunities; investors
do not understand/inattentive to information• Risk: High C-Rank signifies risk of business disruption; the risk
might be undiversifiable
7

Data
119,785 10-Ks filed by 11,304 firms over 1995-2017
68,952 reports (58%) include a competition section
# of firms in a single competition section ranges between zero (61% of the reports) to 35
69% of firms are not mentioned at all in other reports
Most mentions in a given year:IBM: 136 mentions in 1997Microsoft: 113 mentions in 1999
8

C-Rank properties
C-Ranks calculated each month using the most recent annual report of every firm over the past twelve months
Information sets:• Full sample; Cross sector; Within sector
C-Rank statistics (x100)
C-Rank correlated with size (~50%)• Orthogonalize in the cross-section each month• Also use non-parametric approach
9
Mean StDev Min p25 P50 p75 MaxC-Rank full sample 0.0191 0.0075 0.0169 0.0169 0.0169 0.0183 0.2333C-Rank cross-sector 0.0215 0.0073 0.0201 0.0201 0.0201 0.0201 0.2448C-Rank within-sector 0.2315 0.2330 0.0941 0.1156 0.1357 0.2321 3.5178

Returns of portfolios sorted by C-Rank
Each month sort stocks into five equal-size portfolios byC-Rank (orthogonalized to size)
Hold the portfolios for one month
low high1 2 3 4 5 5-1
Mean excess return (monthly) 0.77 0.87 0.80 0.97 1.70 0.93
(2.60) (2.40) (2.25) (2.55) (4.03) (3.76)
Alpha (monthly) -0.10 0.03 0.12 0.61 1.24 1.35(-1.62) (0.47) (1.04) (3.18) (7.23) (7.00)
10

Cross- and within-sector analysis
Separately recalculate C-Rank cross- and within-sector Each month sort stocks into five equal-size portfolios
Cross-sector C-Rank
low high
1 2 3 4 5 5-1
Mean excess return 0.80 0.87 0.93 0.90 1.61 0.81
(2.71) (2.39) (2.39) (2.42) (3.87) (2.87)
Alpha 0.00 0.00 0.15 0.44 1.30 1.30
(-0.03) (-0.01) (1.50) (2.56) (5.58) (5.22)
Within-sector C-Rank
low high
1 2 3 4 5 5-1
Mean excess return 0.96 0.93 0.97 1.33 0.94 -0.01
(1.98) (2.87) (3.06) (3.36) (2.98) (-0.04)
Alpha 0.59 0.17 0.25 0.70 0.18 -0.41
(3.71) (1.75) (2.34) (4.15) (1.36) (-1.98)
11

Fama-MacBeth regressions C-Rank full market C-Rank cross-sector C-Rank within-sector All firms Competitive firms All firms Competitive firms All firms Competitive firms Intercept 2.87 3.46 2.72 2.63 2.72 3.30
(4.88) (4.67) (4.62) (2.58) (4.80) (4.82) C-Rank 5.45 5.55 2.55 5.72 -0.09 2.13
(3.05) (2.13) (1.89) (1.80) (-0.02) (0.52) Log(size) -0.11 -0.15 -0.10 -0.11 -0.10 -0.14
(-3.21) (-3.51) (-2.94) (-1.79) (-3.05) (-3.73) Log(market-to-book) -0.03 0.03 -0.04 0.00 -0.03 0.06
(-0.75) (0.54) (-0.81) (-0.01) (-0.80) (0.98) Past return 0.56 0.48 0.53 0.31 0.54 0.50
(2.47) (1.41) (2.40) (0.82) (2.43) (1.50) Profitability 0.78 0.37 0.77 0.53 0.77 0.44
(3.72) (1.42) (3.61) (1.48) (3.72) (1.75) Investment -1.74 -1.25 -1.76 -1.42 -1.76 -1.31
(-4.85) (-2.54) (-4.84) (-1.79) (-4.92) (-2.75) Beta 0.00 0.01 -0.01 0.08 -0.01 0.02
(-0.02) (0.08) (-0.04) (0.39) (-0.05) (0.11) Idiosyncratic volatility -31.15 -22.59 -30.63 -16.15 -30.67 -20.39
(-6.30) (-3.88) (-6.15) (-1.63) (-6.11) (-3.59)
C-Rank also significant among high C-Rank firms Cross-sector rather than within-sector effect
12

Portfolio returns over time
13
0.00
1.00
2.00
3.00
4.00
5.00
1995
1996
1996
1997
1998
1999
2000
2001
2002
2003
2004
2005
2006
2007
2007
2008
2009
2010
2011
2012
2013
2014
2015
2016
2017
Cumulative performance of C-Rank portfolio spreads
Portfolio excess return Portfolio 6-factor alpha
-0.04-0.02
00.020.040.060.08
0.10.120.140.16
1995
1996
1996
1997
1998
1999
2000
2001
2001
2002
2003
2004
2005
2006
2006
2007
2008
2009
2010
2011
2011
2012
2013
2014
2015
2016
2016
2017
Cumulative FMB regression coefficient of C-Rank
All firms Competitive firms

What have we shown so far?
High C-Rank firms outperform
Performance seems to stem from cross-sector competitors
The C-Rank effect appears monotonic, yet non-linear; exists also within high C-Rank firms
Robustness and persistence over time
14

Competing explanations Mispricing:
• Strong companies point to an undervalued business environment
Risk: • Being targeted by strong companies imposes risk—
underversifiable in periods of high cross-sector disruption
How can we identify explanation?• Test 1: Analyst coverage• Test 2: Changes in C-Rank• Test 3: C-Rank betas
15

Test 1, Analyst coverage
Analysts intensify information diffusion
16
Panel A. Analyst industry concentration
All firms
Firms with analyst
coverage Mean analyst industry concentration Low Mid High High-Low Full market 1.35 0.64 0.50 0.67 0.77 0.27 (7.00) (4.25) (2.99) (3.56) (3.05) (0.84) Cross sector 1.30 0.63 0.30 0.75 1.10 0.80 (5.22) (3.78) (1.69) (3.23) (3.48) (2.48) Within sector -0.41 -0.49 -0.31 -0.62 -0.49 -0.18 (-1.98) (-2.19) (-1.27) (-2.37) (-1.45) (-0.43)
Panel B. Joint analyst coverage
Competitive firms
Competitive with analyst
coverage
Competitive firms share analysts with their mentioning firms
No Yes Diff. Full market 0.55 0.50 0.61 -0.02 0.62 (3.36) (2.66) (2.23) (-0.05) (1.48) Cross sector 0.35 0.18 0.48 -0.14 0.61 (1.86) (0.85) (1.43) (-0.43) (1.64) Within sector 0.02 -0.26 -0.24 -0.13 -0.11 (0.10) (-1.09) (-0.78) (-0.46) (-0.38)

Test 2, Changes in C-Rank
17
-5.0%
-4.0%
-3.0%
-2.0%
-1.0%
0.0%
1.0%
2.0%
-12 -10 -8 -6 -4 -2 0 2 4 6 8 10 12 14 16 18 20 22 24
Months to change in C-Rank
C-Rank Portfolio Excess Return Spreads
Full market Cross-sector Within-sector
Increase in cross-sector C-Rank results in under-performance followed by long-run out-performance

Test 3, C-Rank beta
18
Compute firm C-Rank beta (36-month rolling)• Significant quintile return spread
(0.00)
(0.50)
(1.00)
(1.50)
(2.00)
(2.50)
(3.00)
(3.50)
(4.00)
0.00
0.10
0.20
0.30
0.40
0.50
0.60
0.70
0.80
1 2 3 4 5 5-1
T-st
atist
ic
Mon
thly
Ret
urn
C-Rank Beta Quintiles
Alpha T-stat

Test 3, Double sorts
19
Disentangling C-Rank level and beta using double sorts and building neutralized portfolio spreads
C-Rank beta does not explain C-Rank level
Results mostly consistent with mispricing rather than risk
C-Rank-beta return spread
C-Rank Singleneutral sort
Full sample 0.28 0.52[1.71] [2.47]
Cross sector 0.23 0.49[1.44] [2.15]
Within sector -0.25 -0.30[-1.14] [-1.14]
C-Rank return spread
C-Rank-Beta Singleneutral sort
Full sample 0.99 1.35[6.33] [7.00]
Cross sector 0.95 1.30[4.54] [5.22]
Within sector 0.12 -0.41[0.83] [-1.98]

The importance of the C-Rank features
The C-Rank measure has two unique features:
(1) A given firm’s competition is determined not only by its own financial statement but also by what other firms say about the given firm
(2) It gives more weight to the stronger firms (i.e. those that more firms mention them as competitors)
We show that both these features are important in capturing the competition strength and return predictability
20

C-Rank Feature 1: Own versus All
Event-time analysis: Buy-and-hold abnormal return of companies with under-and over-performing targeting firms
21
-3%-2%-1%0%1%2%3%4%5%6%
0 3 6 9 12 15 18 21 24
Months from portfolio formation
Cross-sector targeting firms
Targeting firms did well in the past year
Targeting firms did poorly in the past year
-3%
-1%
1%
3%
5%
0 3 6 9 12 15 18 21 24
Months from portfolio formation
Within-sector targeting firms
Targeting firms did well in the past year
Targeting firms did poorly in the past year
Outperforming cross-sector competition negatively impacts firm

C-Rank Feature 1: Own versus All – cont’d
22
-6%
-4%
-2%
0%
2%
4%
6%
0 3 6 9 12 15 18 21 24
Months from portfolio formation
Cross-sector mentioned firms
Mentioned firms did well in the past year
Mentioned firms did poorly in the past year
-6%-5%-4%-3%-2%-1%0%1%2%3%4%5%
0 3 6 9 12 15 18 21 24
Months from portfolio formation
Within-sector mentioned firms
Mentioned firms did well in the past year
Mentioned firms did poorly in the past year
Assess a firm’s competition using companies mentioned as competitors in that firm’s reports alone
Competition gauged from own firm reports behave differently

C-Rank Feature 2: Strong competitors
23
0.00%
0.20%
0.40%
0.60%
0.80%
1.00%
1.20%
1.40%
1.60%
C-Rank Number oftargeting firms
Mean size oftargeting firms
Sum size oftargeting firms
Quintile portfolio spreads
Excess return 6-factor alpha
C-Rank seems to outperform other measures

Conclusions
We implement a PageRank-type algorithm on 10-K filings to produce a dynamic measure of firm competitiveness (C-Rank)
A C-Rank portfolio spread yields an alpha of ~16% annually
Predictability is mainly cross-sector
Consistent with both risk and mispricing:• Seems mostly mispricing
24

THANK YOU!
25
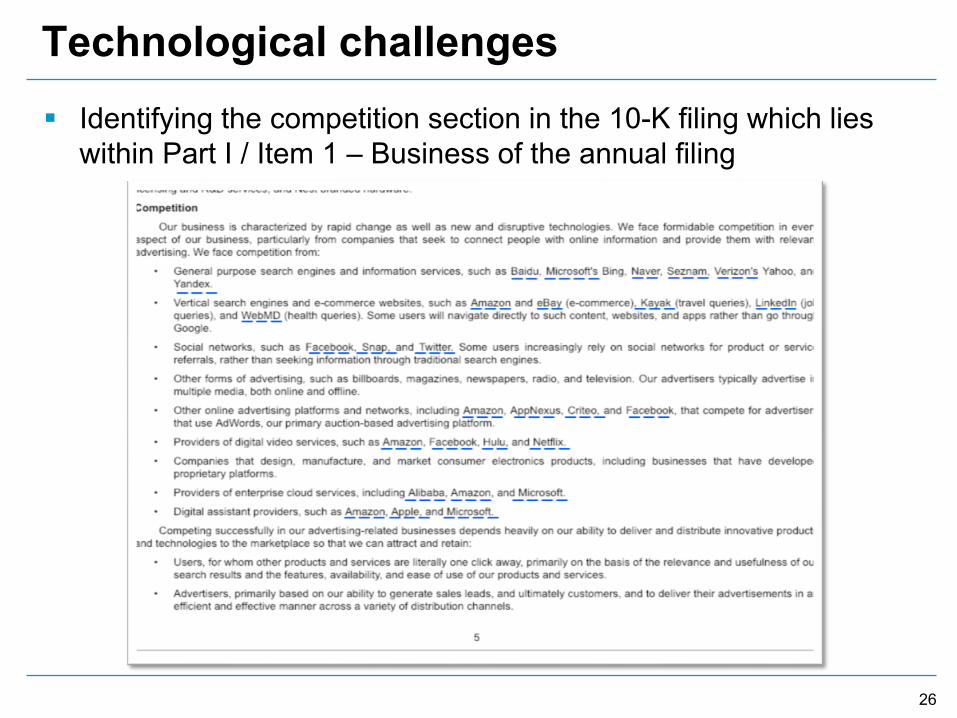
Technological challenges Identifying the competition section in the 10-K filing which lies
within Part I / Item 1 – Business of the annual filing
26

Technological challenges Example: entity extraction of the string “IBM” found in a competition section1. Google search of the
term: “IBM wiki”2. Identifying that the top
listed URL is the Wikipedia page of IBM
3. Accessing the Wikipedia page
4. Extracting ticker and other identifiers from the information box of the Wikipedia page
27

Technological challenges Identifying companies mentioned in the competition: Natural
Language Processing (NLP) methods + textual content analysis
28

Competition mentions in 10-Ks
0
5,000
10,000
15,000
20,000
25,000
30,000
35,000
40,000
45,000
0 1 2 3 4 5 6 7 8 9 10+
# of
repo
rts
# firms mentioned as competitors in a report
0
10,000
20,000
30,000
40,000
50,000
60,000
70,000
80,000
90,000
100,000
0 1 2 3 4 5 6 7 8 9 10+
# of
firm
-yea
rs
# reports in which a firm is mentioned as a competitor during a calendar year
29

C-Rank vs. firm size
Top competitors Largest firms Year 1st 2nd 3rd 4th 5th 1st 2nd 3rd 4th 5th 1995 IBM HPQ GE NIPNY ITC
GE T XOM KO MRK
1996 IBM MSFT HPQ WMT MSI
GE KO XOM INTC MSFT 1997 IBM MSFT HPQ LU JNJ
GE KO MSFT XOM MRK
1998 IBM MSFT HPQ LU MSI
MSFT GE INTC WMT XOM 1999 MSFT IBM LU HPQ MSI
MSFT GE CSCO WMT XOM
2000 MSFT IBM LU HPQ A
GE XOM PFE CSCO C 2001 IBM MSFT MSI SIEGY HPQ
GE MSFT XOM C WMT
2002 IBM MSFT HPQ CSCO GOOGL
MSFT GE XOM WMT PFE 2003 IBM MSFT CSCO WMT JNJ
GE MSFT XOM PFE C
2004 IBM MSFT WMT CSCO NVS
GE XOM MSFT C WMT 2005 IBM WMT MSFT A PFE
GE XOM MSFT C PG
2006 MSFT IBM WMT ELMG ABT
XOM GE MSFT C BAC 2007 IBM MSFT WMT GE GSK
XOM GE MSFT T PG
2008 MSFT WMT IBM GE A
XOM WMT PG MSFT GE 2009 IBM MSFT GE ELMG WMT
XOM MSFT WMT AAPL JNJ
2010 MSFT WMT GE IBM CSCO
XOM AAPL MSFT GE WMT 2011 MSFT IBM GE BAC ELMG
XOM AAPL MSFT IBM CVX
2012 MSFT GOOGL GE WMT IBM
AAPL XOM WMT MSFT GE 2013 GOOGL MSFT AAPL WMT IBM
AAPL XOM GOOGL MSFT GE
2014 GOOGL MSFT IBM FB WMT
AAPL XOM MSFT JNJ WFC 2015 GOOGL FB IBM MSFT MDT
AAPL MSFT XOM AMZN GE
2016 GOOGL FB PFE NVS MDT
AAPL MSFT XOM AMZN JNJ 2017 GOOGL NVS MDT FB PFE
AAPL MSFT AMZN FB JNJ
30

C-Rank correlations
Panel A. Full sample C-Rank full market C-Rank cross-sec C-Rank within-sec
Log(size) 0.568 0.410 0.239 Log(market-to-book) 0.019 0.008 -0.003 Past return 0.008 0.003 0.012 Profitability 0.080 0.051 0.072 Investment -0.018 -0.001 0.083 Beta 0.018 0.001 -0.109 Idiosyncratic volatility -0.107 -0.069 -0.137
Panel B. Competitive firms C-Rank full market C-Rank cross-sec C-Rank within-sec Log(size) 0.583 0.398 0.361 Log(market-to-book) 0.025 0.006 0.000 Past return 0.003 0.002 0.017 Profitability 0.121 0.063 0.127 Investment -0.039 -0.001 0.053 Beta -0.074 -0.081 -0.147 Idiosyncratic volatility -0.170 -0.112 -0.182
31

C-Rank correlations
Panel A. Full sample C-Rank full market C-Rank cross-sec C-Rank within-sec
Log(size) 0.568 0.410 0.239 Log(market-to-book) 0.019 0.008 -0.003 Past return 0.008 0.003 0.012 Profitability 0.080 0.051 0.072 Investment -0.018 -0.001 0.083 Beta 0.018 0.001 -0.109 Idiosyncratic volatility -0.107 -0.069 -0.137
Panel B. Competitive firms C-Rank full market C-Rank cross-sec C-Rank within-sec Log(size) 0.583 0.398 0.361 Log(market-to-book) 0.025 0.006 0.000 Past return 0.003 0.002 0.017 Profitability 0.121 0.063 0.127 Investment -0.039 -0.001 0.053 Beta -0.074 -0.081 -0.147 Idiosyncratic volatility -0.170 -0.112 -0.182
32

Controlling for stock characteristics Double-sort C-Rank portfolio means
6-factor alpha of the high-low C-Rank portfolios Full market Cross-sector Within-sector
Base results 1.35 1.30 -0.41 (7.00) (5.22) (-1.98)
Sorting characteristic
Size 1.07 0.77 -0.29 (8.42) (6.83) (-1.50)
Market-to-book 1.18 1.07 -0.45 (6.90) (4.92) (-2.23)
Past return 1.16 1.27 -0.11 (7.23) (5.96) (-0.64)
Profitability 1.31 1.30 -0.17 (7.74) (6.04) (-0.94)
Investment 1.31 1.34 -0.19 (7.10) (5.56) (-1.04)
Beta 1.13 1.19 0.00 (6.58) (4.96) (0.01)
Idiosyncratic volatility 1.19 1.27 0.04 (8.04) (6.58) (0.22)
33

Subsamples and long horizons 1-low C 2 3 4 5-high C high-low Full sample -0.10 0.03 0.12 0.61 1.24 1.35
(-1.62) (0.47) (1.04) (3.18) (7.23) (7.00) Panel A. Subsamples Excluding January -0.08 0.04 -0.08 0.03 0.72 0.80
(-1.25) (0.59) (-0.77) (0.21) (5.03) (5.01) Excluding Recessions -0.11 0.02 0.15 0.69 1.28 1.39
(-1.67) (0.29) (1.38) (3.58) (7.03) (6.74) 1995-2006 -0.18 0.12 0.35 0.98 1.78 1.96
(-1.75) (1.03) (1.86) (3.24) (6.04) (5.76) 2007-2017 -0.04 -0.06 -0.05 0.22 0.73 0.77
(-0.72) (-0.83) (-0.44) (0.96) (4.33) (4.48) Panel B. Longer investment horizons 3 months -0.10 0.05 0.21 0.64 1.13 1.23
(-1.57) (0.70) (1.88) (3.35) (6.95) (6.80) 6 months -0.09 0.08 0.25 0.68 1.06 1.15
(-1.35) (1.12) (2.19) (3.49) (6.83) (6.69) 12 months -0.05 0.06 0.29 0.71 0.96 1.01
(-0.80) (0.88) (2.40) (3.65) (6.66) (6.49) 18 months -0.03 0.08 0.32 0.71 0.88 0.91
(-0.38) (1.14) (2.60) (3.67) (6.28) (6.07)
34

Additional tests for risk
Test 1: Changes analysis
• If a large increase in a firm’s C-Rank indicates that the firm is under a bigger threat because more and stronger companies are pointing at it now, then the firm’s market value should react negatively
• Each month divide all companies that are recognized as competitors by other firms into five quintiles according to the change in C-Rank from the prior month
• Look at the difference between the average cumulative excess returns of the top and the bottom quintiles (the hedge portfolio) around the month of change
35

Additional tests for risk
Test 2: Sensitivity to targeting competitor’s performance
• The targeting risk explanation is based on the notion that when a company lists another company as a competitor in its 10-K, it intends to compete with that company, thereby increasing its risk
• Therefore, the market value of a company that is targeted by other firms will be negatively affected by the success of those firms
• Each month divide all firms into five equal-sized portfolios according to the average past 12-month returns of their targeting competitors. The average is value-weighted by the competitors’ C-Ranks. Hold the portfolios for 6 to 24 months
36

Additional tests for risk
All competitors Cross-sector competitors Within-sector competitors Holding period: 6m 12m 18m 24m 6m 12m 18m 24m 6m 12m 18m 24m
Mean excess return 0.07 -0.13 -0.23 -0.29 -0.22 -0.40 -0.41 -0.40 0.11 -0.05 -0.19 -0.21 (0.30) (-0.70) (-1.52) (-2.18) (-1.00) (-2.20) (-2.50) (-2.57) (0.42) (-0.24) (-1.08) (-1.44)
CAPM alpha 0.15 -0.07 -0.18 -0.25 -0.18 -0.37 -0.38 -0.38 0.19 0.01 -0.13 -0.17 (0.61) (-0.38) (-1.17) (-1.87) (-0.79) (-2.02) (-2.32) (-2.44) (0.72) (0.04) (-0.77) (-1.14)
3-factor alpha 0.14 -0.09 -0.20 -0.26 -0.20 -0.39 -0.40 -0.40 0.18 -0.01 -0.16 -0.18 (0.55) (-0.47) (-1.31) (-2.00) (-0.89) (-2.12) (-2.44) (-2.60) (0.67) (-0.05) (-0.90) (-1.26)
4-factor alpha 0.13 -0.12 -0.24 -0.29 -0.20 -0.39 -0.41 -0.40 0.18 -0.04 -0.19 -0.21 (0.54) (-0.60) (-1.52) (-2.18) (-0.86) (-2.14) (-2.46) (-2.56) (0.64) (-0.17) (-1.06) (-1.40)
5-factor alpha 0.22 -0.02 -0.16 -0.24 -0.14 -0.35 -0.38 -0.41 0.24 0.04 -0.12 -0.16 (0.85) (-0.09) (-0.98) (-1.75) (-0.59) (-1.87) (-2.24) (-2.58) (0.85) (0.19) (-0.64) (-1.04)
6-factor alpha 0.21 -0.04 -0.18 -0.26 -0.14 -0.36 -0.39 -0.41 0.23 0.02 -0.14 -0.17 (0.82) (-0.20) (-1.13) (-1.88) (-0.58) (-1.90) (-2.27) (-2.55) (0.82) (0.09) (-0.75) (-1.14)
Performance of hedge portfolio of high-minus-low targeting firms’ past returns
37

Additional tests for risk
All competitors Cross-sector competitors Within-sector competitors Holding period: 6m 12m 18m 24m 6m 12m 18m 24m 6m 12m 18m 24m
Mean excess return 0.07 -0.13 -0.23 -0.29 -0.22 -0.40 -0.41 -0.40 0.11 -0.05 -0.19 -0.21 (0.30) (-0.70) (-1.52) (-2.18) (-1.00) (-2.20) (-2.50) (-2.57) (0.42) (-0.24) (-1.08) (-1.44)
CAPM alpha 0.15 -0.07 -0.18 -0.25 -0.18 -0.37 -0.38 -0.38 0.19 0.01 -0.13 -0.17 (0.61) (-0.38) (-1.17) (-1.87) (-0.79) (-2.02) (-2.32) (-2.44) (0.72) (0.04) (-0.77) (-1.14)
3-factor alpha 0.14 -0.09 -0.20 -0.26 -0.20 -0.39 -0.40 -0.40 0.18 -0.01 -0.16 -0.18 (0.55) (-0.47) (-1.31) (-2.00) (-0.89) (-2.12) (-2.44) (-2.60) (0.67) (-0.05) (-0.90) (-1.26)
4-factor alpha 0.13 -0.12 -0.24 -0.29 -0.20 -0.39 -0.41 -0.40 0.18 -0.04 -0.19 -0.21 (0.54) (-0.60) (-1.52) (-2.18) (-0.86) (-2.14) (-2.46) (-2.56) (0.64) (-0.17) (-1.06) (-1.40)
5-factor alpha 0.22 -0.02 -0.16 -0.24 -0.14 -0.35 -0.38 -0.41 0.24 0.04 -0.12 -0.16 (0.85) (-0.09) (-0.98) (-1.75) (-0.59) (-1.87) (-2.24) (-2.58) (0.85) (0.19) (-0.64) (-1.04)
6-factor alpha 0.21 -0.04 -0.18 -0.26 -0.14 -0.36 -0.39 -0.41 0.23 0.02 -0.14 -0.17 (0.82) (-0.20) (-1.13) (-1.88) (-0.58) (-1.90) (-2.27) (-2.55) (0.82) (0.09) (-0.75) (-1.14)
Performance of hedge portfolio of high-minus-low targeting firms’ past returns
38

The importance of the C-Rank features
Testing feature 2:
• The key question: What is the marginal benefit of C-Rank over a simple counting of the number of targeting firms?
• Consider three simple algorithm-free alternative measures to C-Rank:
(1) Simple mention count (# of targeting firms)(2) Mean size of the targeting firms(3) Sum size of the targeting firms
• Replicate the portfolio sort analysis using the alternative measures
39