Embed Size (px)
Citation preview

Competition and Quality Restoration: An Empirical Analysis ofVendor Response to Software Vulnerabilities
Ashish Arora, Chris Forman, Anand Nandkumar1, Rahul Telang
{ashish, cforman, anandn, rtelang}@andrew.cmu.edu
Carnegie Mellon UniversityFirst Draft: October 2005
This version: February 2007
Abstract
We empirically estimate the effect of competition on ex-post quality in software markets byexploiting variation in number of vendors that share a common flaw or common vulnerabilities.We distinguish between two effects: the direct competition effect when vendors in the samemarket share a vulnerability, and the indirect effect, which operates through the increaseddisclosure threat and affects all vendors whose products share a vulnerability, whether or notthey compete in the same product market. Using time to patch release as our measure of quality,we find that the direct effect of competition is similar in magnitude to that of indirect effect :one additional competitor lowers expected patching times by 5% or about 8 days due to directeffect; one additional vendor sharing a vulnerability resulting in patching times falling by 5%on an average or about 8 days due to the indirect effect. Products with more users get patchedquicker as well. A 10% increase in end users is associated with vendors releasing patch earlierby about 1.4%. Our results show that, ex-post product quality in software markets is not onlyconditioned by rivals that operate in the same product market, but by also nonrivals, that sharethe same common flaw. Our results also support the notion that increased competition, directlyand indirectly, leads to faster patching times and improved consumer welfare.
Keywords: Vulnerability disclosure, quality, competition, patching.
working paper,comments welcome
1Corresponding author. Author names are in alphabetical order. We thank Avi Goldfarb, Tomas Roende, andseminar participants at Carnegie Mellon University, the International Industrial Organization Conference, the ZEW,and the Workshop on the Economics of Information Security for helpful comments. We further thank CERT/CC forproviding essential data. This research was partially supported by a grant from Cylab, Carnegie Mellon University, toAshish Arora and Rahul Telang. Anand Nandkumar thanks the Software Industry Center at Carnegie Mellon Univer-sity for financial support. Rahul Telang acknowledges generous support of National Science Foundation through theCAREER award CNS-0546009. Chris Forman gratefully acknowledges support from the Sloan Foundation (IndustryStudies Fellowship). All errors are our own.
1
1 Introduction
As software becomes more ubiquitous, software quality problems are likely to become more eco-
nomically significant. A recent study put the annual cost of major software defects to the U.S.
economy at over $60 billion (NIST 2002). This figure may substantially understate the true costs,
as it excludes the costs of information security incidents. Recent evidence has shown that the
number of reported information security incidents has grown with the number of reported soft-
ware defects, providing one sign of the potential costs of poor software quality. For example, the
number of information security incidents reported to CERT/CC (Center for Emergency Response
Team/Coordination Center), a large federally funded research laboratory that measures and re-
searches Internet security problems, grew from 2412 in 1995 to 137,529 in 2003. During the same
period, the number of reported software security defects or “vulnerabilities” grew from 171 in 1995
to 5990 in 2005. A recent New York Times article indicated the internet security, a main by-product
of lack of software quality, if anything, is getting worse (The New York Times, January 7, 2007).
One popular reason given for software quality problems is the presence of incumbents with
substantial market power in the software industry. However, the theoretical link between the
extent of competition and quality is ambiguous, as we discuss in our literature review, and there
is little empirical evidence one way or another. In particular, there is little, if any, empirical work
that examines the relationship between software quality and competition.
One of the challenges in such empirical work is the inherent difficulty of objectively measuring
software quality. Another is the lack of variation in number of competitors. Almost all software
markets are national if not global, making it difficult to estimate the effects of competition in
software markets using regional variation in competition (which is what has commonly been done
for other industries; discussed in more detail in the literature review below). In this paper, we make
use of two unique features of our data to overcome these issues. First, we use the time taken by
vendors to release patches to a recently known vulnerability as our proxy for quality. This provides
us with a quality metric that is objectively measurable. Patches are an important component of
post-sales product support and are an aspect of quality since end user losses depend on timely
availability of patches (Arora, Caulkins and Telang, 2006). Second, we use variation in the number
2

of vendors affected by a common flaw or a “common vulnerability” to empirically place bounds on
the effect of competition.
We begin by developing a set of hypotheses motivated by prior literature and by a prior model
of vendor patching behavior (Arora, Forman, Nandkumar and Telang 2006). End user losses are
increasing in the time elapsed between the initial disclosure of the vulnerability and the release of
the patch. Tardy patches should hurt vendor reputation and will influence customers to switch to
a rival (now or in the future). As a result, increases in competition from vendors within the same
product market (henceforth rivals) will lead to lower patch release times. We label this direct impact
of competition on patch release times as the competition effect. There is an additional effect as well.
When a vendor releases a patch, it de facto discloses the vulnerability to all potential attackers.
This affects its rivals who are working to release their patches. It also affects vendors in different
markets but whose products share the vulnerability (henceforth non-rivals). In other words, the
greater the number of vendors — both rivals and non-rivals — that share the vulnerability, the
shorter the expected public disclosure of the vulnerability. Since end user losses from unpatched
software are increasing in the time the vulnerability remains unpatched and disclosed, increases in
the number of vendors that share a vulnerability will lead to lower patch release times. We label
this relationship the disclosure effect.
We compare these hypotheses with actual data on vendor patch release times. To empirically
separate the effects of competition and disclosure, we exploit two sources of variation in our data.
First, we utilize the variation across vulnerabilities in the number of rivals and non-rivals affected.
Increases in the number of direct rivals to the vendor will influence patch release times through
both the competition and disclosure effects, while increase in non-rivals will influence patch release
times only through disclosure. Second, we utilize variation across vulnerabilities in how vendors
are informed of vulnerabilities. Vulnerabilities are publicly disclosed when a third party or another
vendor announces the existence of a vulnerability, and they are privately disclosed when CERT/CC
informs the vendor of the presence of a vulnerability while the vulnerability remains unknown to
the general public. We identify the competition effect by examining how changes in the number of
affected vendors influence average patch release times when vulnerabilities are publicly disclosed.
We identify the disclosure effect by comparing how changes in the number of affected vendors
3

influence average patch release times under private and public disclosure.
Addressing our research goals requires detailed data on software vulnerabilities, vendor patch
release times, market structure, and software characteristics. We examine vendor responses to 241
vulnerabilities reported to CERT/CC from September 2000 to August 2003. These data are among
the most complete of their kind that are available. We supplement these data with information
on market size obtained using a market survey conducted by Harte-Hanks Market Intelligence, a
commercial market research firm.
Our results demonstrate that the threat of disclosure has an economically and statistically
significant impact on patch release times: One more non-rival that shares the same vulnerability
will lead to a decrease of 5% or a decline of 8 days in expected patch release times. Competition
also plays a role: we show that one more rival lowers expected patch release times through the
effects of competition by 5% or 8 days, however these estimates are not statistically significant.
Last, we demonstrate that increases in a product’s installed base increase the losses from slower
patch release times and so induce vendors to patch earlier: A 10% increase in a product’s total
sales quantity is associated with a decline of 1.4% or 2 days in expected patch release times.
To our knowledge, our paper is the first to examine empirically the relationship between compe-
tition and software quality. Our research is also unique in demonstrating how products with com-
mon technological inputs can influence output market competition even when buyers perceive these
markets as unrelated. Recent work on information technology markets has emphasized strategic
interactions among vendors producing products that are complements in demand or which share
a common platform (e.g., Bresnahan and Greenstein 1996; Shapiro and Varian 1999; West and
Dedrick 2000 Gawer and Henderson 2006). Like this prior literature, we emphasize how firms that
share common components have interrelated output market decisions. However, in contrast to this
prior work, we do not require these firms to produce in markets that are substitutes or complements
in demand.
Our findings also inform the debate on how to best encourage provision of software quality.
For one, our research demonstrates that despite high levels of concentration in many software
markets, the threat of disclosure from vendors in related markets works to reduce patch release
4

times more effectively than increases in competition. Further, our research informs recent debate
on whether third-party information security agencies such as CERT/CC should inform the public
of new vulnerabilities, or whether they should instead disclose them only to affected vendors. Our
results show that the threat of potential disclosure provides powerful incentives for vendors to invest
in software patching.
2 Related Literature and Contribution
This paper is related to three streams of research: software quality and software process, economics
of information security, and competition and quality provision.
The software community has long been concerned with the determinants of software quality. The
literature has examined the link between quality and software development process (e.g., Banker,
Davis, and Slaughter 1998; Harter, Krishnan, and Slaughter 2000). These studies conclude that
higher levels of software process maturity is associated with greater software quality. Our study
is different from these studies in two important aspects. First, we focus on ex-post quality rather
than pre-release software quality. Second, while these studies focus on the process determinants of
software quality, we examine the link between software quality and competition.
Our research is motivated by recent theory work in the economics of information security that
has studied the relationship between the timing of vulnerability disclosure and the expected losses
from attacks (Schneier 2000; Arora, Telang, and Xu 2004; Cavusaglu et al 2005) and more broadly
research that has studied the factors shaping the timing and nature (public or private) of vulner-
ability disclosure by firms and third parties (Nizovtsev and Thursby 2005; Choi, Fershtman, and
Gandal 2005).
Empirical work examining vulnerability disclosure is rarer. Arora, Nandkumar and Telang
(2006) provide empirical evidence on the impact of vulnerability publication when disclosure is not
accompanied by patches. They find that vulnerability disclosure is associated with an increase in
the frequency of attacks. Further, they find that release of software patches result in a temporarily
increase in attack frequency although on average translates to lower frequency of attacks. This
5

suggests that the amount of information disseminated about a vulnerability and the timing of dis-
closure play a critical role in the extent of end user losses from a vulnerability. Early disclosure
of vulnerabilities also provides incentives for vendors to release patches earlier. Arora, Krishnan,
Telang and Yang (2005) use a dataset assembled from CERT/CC’s vulnerability notes and Secu-
rityFocus database to show that early disclosure leads to faster patch release times because early
disclosure increases the losses internalized by vendors from a vulnerability. Vendors also seem to
incur long term losses from vulnerabilities. Telang and Wattal (2004) use an event study method-
ology to show that vulnerability disclosure leads to a loss of market value. Our research is similar
to prior work in that we examine the economic outcomes from vulnerability disclosure. However, in
contrast to the prior work in this area, we study the relationship between competition and vendor
patch release times.
While a rich theory literature has examined the link between competition and quality, empir-
ical work has been limited due to the inherent challenges of measuring product quality2 and the
challenges in obtaining a measure of competition with sufficient variation to identify this relation-
ship. In general, prior work has demonstrated that increases in competition lead to better quality
provision (e.g., Domberger and Sherrr 1989; Dranove and White 1994; Borenstein and Netz 1999;
Hoxby 2000; Mazzeo 2003; Cohen and Mazzeo 2004). However, most prior work in this literature
has focused upon services industries such as banking, legal or health services in which markets
are local and empirical estimates are identified using cross sectional variation across geographic
markets. In contrast, we examine this relationship within the context of a major product market,
software, and obtain identification using variation in the number of products affected by software
vulnerabilities.
While prior work has demonstrated a link between competition and product quality, it has
not studied the interaction between firms in technologically related markets as we do. As noted
above, recent work has highlighted the impact of firm strategic decisions in technologically related
markets (e.g., Bresnahan and Greenstein 1996; Shapiro and Varian 1999; West and Dedrick 2000).
However, this research has focused exclusively on markets that are complements in demand. In2Prior theory work has demonstrated that increases in concentration can lead to an increase or decrease in product
quality. For examples, see Gal-Or (1983), Levhari and Peles (1973), Schmalensee (1979), Swan (1970), and Spence(1975).
6

our research we argue that vendors who share common inputs will have important implications
for vendors’ quality decisions. To our knowledge, ours is one of the first papers to demonstrate
empirically the interrelationships of strategic decisions among firms that share common inputs.
Such interrelationships are likely to be particularly salient in software markets, where vendors in
different market segments increasingly share common modules (e.g., Banker and Kauffman 1991;
Brown and Booch 2002).
3 Conceptual framework and hypotheses
Our hypotheses are motivated by a formal theoretical model developed in Arora, Forman, Nandku-
mar, and Telang (2006). Here we provide a conceptual framework and hypotheses that summarize
the results of this model.
Unlike many physical goods, the problems related to software can be mitigated even after prod-
uct release via the development of software patches (Arora, Caulkins and Telang 2006). This makes
both vulnerabilities in software as well as patches that fix vulnerabilities intrinsic to any “shrink
wrapped” software. The probability of a malicious attacker exploiting a specific vulnerability to
compromise end user computers is positively correlated with the amount of time the vulnerability
remains without a fix. Thus, the timing of patches determines the extent of end user losses, and
patches are perceived as a very important part of ex-post customer support. However, developing
software patches is costly, and decreases in patching release times will entail higher vendor patching
costs, other things equal. Two considerations drive the optimal timing of a vendor’s patch: (1) the
extent to which end user losses affect the future demand for the product and (2) the cost of fixing
the vulnerability. Typically, an early fix entails higher costs but also reduces customer losses and
so reduces loss of future sales.
In many cases, a newly discovered vulnerability could affect many different products (for future
reference we label these common vulnerabilities). For instance, a stack buffer overflow vulnerabil-
ity in Sendmail (a commonly used mail transfer agent)3, disclosed in 2003, affected 25 vendors,3Vulnerability number VU#897604 by CERT/CC classification. See http://www.kb.cert.org/vuls/id/897604 (ac-
cessed 09/22/2006).
7

including Apple, IBM, Wirex, Mirapoint, and Wind River 4. Some of the products produced by
these vendors potentially compete with one another while others are in very distinct markets. For
example, Wirex and Mirapoint produce email products, Wind River produces embedded software,
while many of the other products are operating systems. Even among the latter, there is consid-
erable variation in the hardware platforms. However, all these products use Sendmail code, and
hence, were affected by the vulnerability.
A common vulnerability is typically an artifact of a shared code base or design specification,
or due to a proprietary extension of a widely used software component. When a vulnerability is
known to be common to many products, public release of a patch by one vendor essentially discloses
the vulnerability in the other vendors’ products as well. As public disclosure of the vulnerability
provides information to attackers, the losses of end users that share the vulnerability are higher
after disclosure. In short, increases in the number of vendors sharing a vulnerability potentially
lead to earlier disclosure and greater end user losses, all else equal. Greater end user losses will
translate into vendor losses when users do not renew license fees or do not upgrade software.
Increases in the number of vendors sharing a vulnerability should increase the benefits to the
vendor from earlier patch release times. However, the costs of earlier patch release times do not
change with the number of vendors sharing the vulnerability. As a result, increases in the number
of vendors sharing the vulnerability induce the vendor to allocate more resources to patching the
vulnerability, resulting in an earlier patch release date.
Hypothesis 1: An increase in the number of vendors that share a common vulnerability increases
the disclosure threat and leads to reduction in the expected vendors patch release times.
We label this relationship between number of vendors and patch release times as the disclosure
effect ; all else equal, the disclosure effect should lead to shorter patch release times. Note that the
disclosure effect may be be caused by actual disclosure by other vendors: earlier patching by other
vendors induces a vendor to allocate more resources to patching. Or, it may be a result of potential
disclosure: decreases in the expected time to vulnerability disclosure caused by a greater number4The complete list of vendors consists of Apple, Conectiva, Debian, FreeBSD, Fujitsu, Gentoo, Linux, Hewlett-
Packard, IBM, MandrakeSoft, Mirapoint, NetBSD, Nortel Networks, OpenBSD, OpenPKG, Red Hat, SCO, SendmailInc., Sequent (IBM), SGI, Slackware, Sun Microsystems, SuSE, The Sendmail Consortium, Wind River Systems, andWirex.
8

of affected vendors are associated with increased investments in patching. For our purposes, these
alternative mechanisms give rise to an identical, observationally equivalent hypothesis.
Increase in the number of rivals will also decrease patch release time. The literature on product
quality and competition suggests that when there are many competing products, end users have
more choices, and thus, future sales of a product may be more sensitive to perceived quality (Levhari
and Peles 1973; Spence 1975; Schmalensee 1979). In our context, this implies that end users can
compare vendor patch release times and penalize laggards. In this paper we follow Arora, Forman,
Telang, and Nandkumar (2006) in examining the relationship between the number of rivals affected
by the vulnerability and expected patch release times. We label the impact of increases in number
of competitors on patch release times as the competition effect. For concreteness, we note that
increases in the total number of competitors – affected and unaffected–may also influence vendor
patch release times. While this relationship may be of independent interest, we focus primarily on
the competition due to end users being able to compare how quickly a vendor patches relative to
its rivals. Thus we use the variation in the number of competitors affected by the vulnerability as
well as the variation between vulnerabilities as sources of variation. This implies it is likely that the
effect of competition as estimated in this paper is only a part of overall competition effect. Stated
otherwise, the competition effect estimated in this paper is an underestimate of the true effect of
competition on quality.
Hypothesis 2 : An increase in the number of rivals that share a common vulnerability leads to a
reduction in expected vendor patch release times.
As noted above, increases in vendor patch release times lead to end user losses that will neg-
atively influence vendor profits. These losses will be increasing with the number of end uses, or
the total quantity of product that has been sold. However, the costs of faster patching times are
invariant with the number of users. As a result, expected patch release times will be decreasing in
total (cumulative) sales.
Hypothesis 3 : Expected vendor patch release times are decreasing in cumulative sales quantity.
9

4 Data and variables:
We assembled our data set of vulnerabilities from notes published by CERT/CC5. The vulner-
abilities analyzed in this study were disclosed between September 2000 to August 2003. On an
average, about 3000 vulnerabilities get reported to CERT/CC in a year, of which only about 10%
are deemed legitimate and technically or economically significant, and hence published. When a
vulnerability is reported to CERT/CC, it researches if the vulnerability is authentic and exceeds
CERT/CC’s minimum threshold value for severity, as measured by the CERT METRIC (which is
described later). It then contacts the vendor. The vendor may acknowledge the vulnerability in
its product. In this case, CERT/CC lists the product’s status as “vulnerable”. The vendor may
report that the product is not vulnerable, in which case CERT/CC lists the vendor’s status as
“not vulnerable”. The vendor may also choose not to respond in this case, CERT/CC records the
vendor’s status as “unknown”.
Our unit of observation is a vendor – vulnerability pair. CERT/CC published 526 vulnerability
notes over our sample period that affected 622 different vendors (as noted earlier, a vulnerability
may affect multiple vendors). In all, these vulnerability notes provided 4659 observations (vendor-
vulnerability pairs). Of these, 762 were listed as “not vulnerable”, 2182 were listed as “unknown,”
and 1714 were listed as “vulnerable”. We retained only observations with the status “vulnerable”
for the purpose of empirical analysis.
We additionally drop observations that would introduce significant heterogeneity into the sample
and obscure our efforts to identify the relationship between market structure and patching times.
We dropped observations from non-commercial vendors (such as universities and not-for-profit
vendors) and from foreign vendors (vendors that do not have significant technical operations in the
US).6 We also removed protocol vulnerabilities from the data, as patches to these vulnerabilities
typically involved protocol changes whose scope extends beyond a particular product. Further, we5Other data sources such as online forums do not usually give a “protected period” to vendors to patch vulner-
abilities before disclosing them publicly. Also, other sources also do not verify vulnerabilities in the same way thatCERT does.
6The list of eliminated vendors consists of Apache, BSD (FreeBSD, OpenBSD), Conectiva, Debian, GNU, Gentoo,ISC, KDE, MIT Kerberos, Open Group, OpenAFS, OpenLDAP, OpenSSH, OpenSSL, Openwall GNU Linux, SambaTeam, Sendmail Inc., Slackware, Sorceror Linux, Stunnel, Tcpdump.Org , The Linux Kernel Archives, Trustix ,TurboLinux, Turbolinux , University of Washington , XFree86, Xpdf, Yellow Dog Linux, mod ssl and zlib.org
10

dropped observations wherein the vendors discovered and disclosed the vulnerability to CERT/CC
of its own accord along with a patch.7 Our final sample includes 241 distinct vulnerabilities and
461 observations.
We use variance in the manner with which vulnerabilities are disclosed to identify the compe-
tition and disclosure effects. From CERT/CC data, we know the date when a vendor is notified
of the vulnerability. CERT/CC also records if and when the vulnerability was publicly disclosed.
Thus, we label vulnerabilities as instantly disclosed if the existence of the vulnerability had been
publicly disclosed (by some third party) prior to CERT/CC’s notification to the vendor. We label
vulnerabilities as non-instantly disclosed when CERT/CC discloses a vulnerability that had pre-
viously not been publicly disclosed. In the next two sections, we provide descriptive statistics for
dependent and independent variables under both types of disclosure.
4.1 Dependent Variable
Our dependent variable is DURATION, a measure of the number of days a vendor takes to release
the patch. Measurement of DURATION depends on the regime of disclosure – instant or non-
instant disclosure. If the vulnerability is instantly disclosed, DURATION is the elapsed time in
days between the date when the vulnerability was publicly disclosed and the date when the vendor
released the patch. If the vulnerability is non-instantly disclosed, DURATION is the elapsed time
between the CERT/CC notification to the vendor and the date when the vendor released the patch.
For the empirical analysis we use the log of (1 + DURATION) as our dependent variable. We label
this variable LOGDURATION.
Of the 461 obserations in our sample, 4.3%, or about 20 observations, had no patch. For
these unpatched observations, we assign the maximum value of LOGDURATION that we observed
in our sample (8.27). As we will show below, our results are unchanged when we use a tobit
model that treats these observations as right censored. Table 2 provides the descriptive statistics
for LOGDURATION by disclosure status. Average LOGDURATION is marginally higher under
instant disclosure than under non-instant disclosure (3.68 vs. 3.16).7These dropped vendors were included in our computation of the independent variables that proxy for competition
and disclosure threats as appropriate.
11

4.2 Independent Variables
In this section we discuss the construction of our independent variables. A description of all
variables is included in Table 1, while descriptive statistics are included in Table 2.
Variable DescriptionDURATION Time taken by vendors to issue a patch for a vulnerabilityLOGDURATION Log of DURATIONVENDOR Total number of vulnerable vendors affectedRIVALS Number of vulnerable Rivals.NON-RIVALS Number of vulnerable non-rivalsINSTANT Instant disclosureNONINSTANT Non-instant disclosureLOGQUANTITY log(1+total # of employees at customer (those used the software) sites).LOGVERSIONS log of number of versionsLOGSEVERITY log(1+severity metric)LEADER First vendor(s) to patch the vulnerabilityHARDWARE Vendors that also manufactures hardware
Table 1: Description of Variables
Competition: To determine how threats from competition and disclosure influence patch release
times, we construct three variables. VENDORS is equal to the total number of vendors listed as
“vulnerable” by CERT for a specific vulnerability. RIVALS is the number of vendors that CERT
lists as vulnerable and that operate in the same product market. NON-RIVALS is the number
of vendors that are vulnerable but which operate in a different market. We determined rivals
and non-rivals using market definitions in the Harte-Hanks CI Technology database (hereafter CI
database). 8 As an example, suppose the vendor-vulnerability pair was Microsoft-Windows XP and
the vulnerability was shared by products produced by Red Hat and Oracle. In this case, RIVALS
would include Red Hat but not Oracle (since both Red Hat and Microsoft are in the operating
system market). NON-RIVALS would include Oracle, while VENDORS would include both Red
Hat and Oracle. In those cases where the product was obscure and not included in the database,
we examined product manuals to classify the product.
Quantity: Data on cumulative sales quantity for a product was collected using the CI database.
These data contain establishment- and firm-level information on IT hardware and software invest-
ments. The CI database is one of the richest sources of data available on IT investment for U.S.8We discuss the construction of these variables in further detail below.
12

businesses. However, firms in the sample report only binary decisions of software use: details on
number of licenses are not reported. To develop a measure of the total installed base of the soft-
ware, we use the number of firms that indicated use of the product weighted by the number of
employees in the organization. For instance if 1000 establishments own at least 1 licensed copy
of Red Hat Linux, and each establishment has 500 employees, our measure for quantity would be
500,000, which is the aggregate number of employees in those firms. This puts more weight on
products used in larger firms, and arguably provides us a more accurate proxy for quantity. Since
the CI database oversamples certain industry sectors we follow Forman, Goldfarb, and Greenstein
(2005) and weight our data using County Business Patterns data from the U.S. Census. To compute
our final measure of quantity, we multiply the binary measure of software use for each firm by the
number of firm employees and by firm weights. We then sum across firms. Because the distribution
of quantity is highly skewed, we take the log of quantity (LOGQUANTITY) for our analysis.
Other variables: In order to account for differences in severity of vulnerabilities we use the log
of (one plus) CERT/CC’s severity measure, which is a number between 0 and 1809. We label this
variable LOGSEVERITY.
Anecdotal evidence from industry sources suggest that quality testing of patches on multiple
versions consumes additional time in the patch development process. Thus, we also control for the
log of the number of software versions that have been produced. In addition, in our regressions we
include market fixed effects to control for unobserved differences across product markets in factors
such as intensity of competition, ability of customers to change suppliers and ease of developing
patches. In total, we include 3 major market dummies.These include dummies for the operating
system, application server and web browser. These dummies constitute 88% of the observations.
Each category includes a minimum of 12 observations. The omitted category includes small markets
(which constituted less than or equal to 2% of the sample) for which we have insufficient observations
to identify a separate fixed effect. We also include firm dummies for 8 leading vendors who jointly
account for about 85% of the observations in our sample.10 Descriptive statistics for all of the9The set of criteria used to determine the severity measure includes whether (i) information about the vulnerability
is widely available; (ii) the vulnerability being exploited in the incidents has been reported to US-CERT; (iii) theInternet infrastructure is at risk because of this vulnerability; as well as (iv) the number of systems on the Internetthat are at risk from this vulnerability (v) the impact of exploiting the vulnerability and (vi) the ease with which thevulnerability can be exploited. (www.kb.cert.org/vuls/html/fieldhelp.Last accessed on January 12, 2007)
10These are Apple, HP (includes HP, Compaq, and Digital), Microsoft, Sun, SCO, RedHat, IBM (includes Lotus,
13

independent variables are included in Table 2. Table 2 also shows how these summary statistics
vary by disclosure type. Vulnerabilities that are instantly disclosed have overall a slightly lower
number of vendors than non-instantly disclosed vulnerabilities (7.88 vs. 11.65) as well as lower
rivals (5.38 vs. 7.31) and non-rivals (2.47 vs. 4.30).
Table 2: Descriptive statistics
Variable Mean Minimum Maximum Standard DeviationComplete Data(N=461)
DURATION (days) 168 1 3904 558LOGDURATION 3.52 0.69 8.27 1.92
VENDORS 9.02 1 37 8.04RIVALS 5.96 0 19 5.87
NONRIVALS 3.03 0 24 3.65LOGQUANTITY 13.95 6.22 17.41 2.26
VERSIONS 1.51 1 23 1.63SEVERITY 22.53 0 108.16 20.34
Instant disclosure sample (N=321)DURATION 223 1 3904 664
LOGDURATION 3.68 0.69 8.27 2.07VENDORS 7.88 1 30 7.32
RIVALS 5.38 0 18 5.54NONRIVALS 2.47 0 24 2.81
LOGQUANTITY 14.07 6.22 17.39 2.19VERSIONS 1.46 1 23 1.79SEVERITY 22.67 0 108.16 21.18
Non-instant disclosure sample (N=140)DURATION 57.80 1 3904 104.5
LOGDURATION 3.16 0.69 7.53 1.47VENDORS 11.65 1 37 8.97
RIVALS 7.31 0 19 6.37NONRIVALS 4.30 0 24 4.87
LOGQUANTITY 13.68 6.46 17.41 2.41VERSIONS 0.31 0 3.14 0.51SEVERITY 22.18 0.17 73.09 18.35
iPlanet, and IBM) and Oracle. The omitted category includes a number of smaller vendors for which we haveinsufficient observations to identify a separate fixed effect. Vendors that do not have fixed effects are Adobe, SGI,Allaire, Compaq, Macromedia, Netscape, Network Associates, Novell, Symantec, Trend Micro, and Veritas.
14

5 Empirical Models and results
In this section, we describe our method for identifying how competition and disclosure influence
vendors’ patch release times. We also discuss the results of our baseline empirical analysis.
5.1 Empirical Model
Our goal is to examine how the duration of patch release time for vendor i in market m facing
vulnerability v varies with changes in competition, disclosure, and quantity. To do this, one may
estimate the following linear model:
LOGDURATION imv = β0 + β1COMPETITION mv + β2DISCLOSUREmv + β3LOGQUANTITY im
+θ1Xi + θ2Zv + θ3Km + εiv (1)
where Xi is a vector of vendor controls that includes vendor fixed effects, Km a vector of market
fixed effects and Zv is a vector of vulnerability controls that includes severity metric. Our interest
is in identifying the parameters β1 through β3 which reflect the effects of competition, disclosure,
and market size, respectively. Hypotheses 1-3 predict that β1, β2, and β3 are negative.
The conceptual framework outlined in section 3 has the following implications: the threat
of disclosure arises from increases in the number of rivals and non-rivals affected by the same
vulnerability and arises only under non-instant disclosure. In contrast, the competition effect
arises from increases in the number of rivals under both instant and non-instant disclosure. Hence
one identify strategy is to use RIVALS to proxy for the effect of competition and NONRIVALS to
proxy for the effects of disclosure. Using this strategy, equation (1) can be written as follows:
LOGDURATION imv = β0 + β1RIVALSmv + β2(1− INSTANT v)(RIVALSmv + NON-RIVALSmv)
+β3LOGQUANTITY im + β4INSTANT v + θ1Xi + θ2Zv
15

Collecting terms gives us the following estimation equation:
LOGDURATION imv = γ0 + γ1RIVALSmv + γ2INSTANT vRIVALSmv + γ3INSTANT vNON-RIVALSmv +
γ4NON-RIVALSmv + γ5LOGQUANTITY im + γ6INSTANT v + θ1Xi + θ2Zv +
θ3Km + εiv (2)
where γ1= β1+β2. Equation 2 implies that identification of β1 and β2 arises from both variation in
type of disclosure between vulnerabilities as well as variation in the number of rivals and nonrivals
within a vulnerability. The model also implies that γ3+γ4=0 and γ2+γ4=0. This means that an
unconstrained regression that uses equation 2 would produce several estimates of disclosure threat
(β2), and hence may be over-identified. If we impose these constraints, the effects of competition
is identified using β1=γ1-γ4 and the threat of disclosure is identified using β2=γ4.
The competition effect in our setting arises on two counts: First, end users are likely to compare
vendors responses of rivals when they are affected by a common vulnerability and penalize vendors
that are laggards. This is the effect of competition that arises only when rivals share a common
vulnerability. Second, is effect of competition that depends on how many other rivals sell a similar
product regardless of whether they are affected by a common vulnerability. It is important to note
that the competition effect on account of rivals sharing the same vulnerability is identified from
variation in the number of rivals that share a common vulnerability. The competition effect that
depends on the amount of competition within a market is however identified through variation
between markets. In this paper, given the nature of our data, we can only identify the effect of
competition among rivals that share a common vulnerability. The overall effect of competition is
not identified otherwise than through market fixed effects.
Since market level fixed effects in the model control for differences in the number of total
competitors across markets, it is possible that β1 is small as it likely that competition on account
of sharing a common vulnerability is only a small part of the overall competition effect. As a result,
although β1 is identified separately from the effects of market structure, it is likely to be much small
and imprecisely estimated as market fixed effects soaks up a major portion of the competition effect.
Hence in our results section, we also present results from a regression that uses observations from
16
only the operating systems market to show the extent of competition effect in a setting where there
is no markets-level variation.
In all the specifications that use market fixed effects, a small percentage (12%) of observations
are from small markets that have insufficient observations to identify a separate fixed effect, however
our results are robust to their exclusion. Moreover, a percentage (15%) of observations are for
vendors that appear infrequently in our sample and so do not have a separate vendor fixed effect, so
our estimates will also reflect a small amount of cross-vendor variation. We retain these observations
to maintain a sample that reflects the distribution of vendor sizes across the population, however as
a robustness check we re-estimate the model using only vendors for which we estimated a separate
fixed effects and show that the results are qualitatively similar.
Identification of the model requires the assumption that LOGQUANTITY is statistically exoge-
nous. In support of this assumption we note that LOGQUANTITY reflects the stock of installations
in the CI database in 2002, rather than the purchase quantity in any particular year. However, we
recognize that LOGQUANTITY may reflect in part recent demand for software products which
may be correlated with unobservables that influence patch release times. If so, then this would lead
to a downward bias on our estimate; that is, it would lead us to overstate the relationship between
cumulative sales and quality provision. Re-estimating the models after excluding LOGQUANTITY
yields very similar estimates for other variables, indicating that the bias, if any, does not extend to
other estimates.
The effect of LOGQUANTITY on patch release times may be different for software vendors
that also sell hardware: such firms may also internalize the effect of vulnerable software on related
hardware sales. For example, vulnerabilities in Sun’s Solaris operating system may influence sales
of its workstations too, shifting the relationship between installed base of Solaris and patch re-
lease times compared to other software firms. To capture these potential differences, we interact
LOGQUANTITY with a vendor hardware dummy that is equal to one when a software vendor
also sells hardware (HARDWARE)11. Re-estimation of models without including HARDWARE
and HARDWARE*LOGQUANTITY as covariates yields similar estimates of β1 and β2, although11In the dataset hardware vendors are HP (includes Compaq and Digital Equipment Corporation), Sun Microsys-
tems and IBM
17

it yields different estimates of β3.
A key issue in estimation is controlling for heterogeneity between vulnerabilities. LOGSEVER-
ITY is one potential control that we include in our regression. However, LOGSEVERITY may not
control for all such heterogeneity. For instance, LOGSEVERITY may not account for differences in
the complexity in fixing vulnerabilities. Indeed an ideal method would be to use vulnerability fixed
effects. This, however would be infeasible in the context of our sample since our sample consists of
461 vendor-vulnerability pairs with 241 distinct vulnerabilities. As a robustness check, we estimate
a random effect specification that includes an additional random error term that is identical within
vulnerabilities.
Another concern is that the model introduces the possibility that INSTANT is endogenous:
instantly disclosed vulnerabilities may differ in some unobservable way that influences patching
times. We later examine the robustness of the assumption that INSTANT is uncorrelated with
unobservables that influence vendors patch release times.
5.2 Results
We first estimated an OLS specification12 using the full sample and then conducted a Breusch-
Pagan test for the presence of heteroskedasticity. The test overwhelmingly rejects the assumption
of homoskedasticity (chi sq. 130.30; p-value=0.00). As noted above, one significant source of
heteroskedasticity could be the presence of unobserved differences between vulnerabilities. Since
adding vulnerability fixed effects was not feasible we estimated a random effects specification.
We then estimated model 2 on the full sample without constraints and tested for the constraints
imposed by the model, namely, γ3+γ4=0 and γ2+γ4=0. We were unable to reject these constraints
imposed by equation 2 (χ2-2.61;p-value-0.27).
We also estimated a model 2 on the sample that comprised of operating systems vendors only
(OS sample henceforth) and then tested for the constraints γ3+γ4=0 and γ2+γ4=0. As with the full
sample, we were unable to reject these constraints imposed by equation 2 (χ2-3.61;p-value-0.17).12Results of the OLS can be furnished upon request
18

We present the estimates of the constrained model of the OS sample and full sample in columns
(1) and (2) of table 3 respectively.
Table 3: Estimates of equation (2) - Dependent variable LOGDURATION
OS sample Full sample Full sample Full sampleGLS (1) GLS (2) Tobit (3) IV (4)
INSTANT (γ6) -0.06 (0.48) -0.15 (0.37) -0.10 (0.39) -0.68 (1.11)RIVALS (γ1) -0.11∗∗∗(0.03) -0.10∗∗∗(0.03) -0.10∗∗∗(0.04) -0.13∗∗ (0.06)NONRIVALS(γ4) -0.05∗ (0.03) -0.05∗ (0.03) -0.06∗ (0.03) -0.11 (0.07)LOGQUANTITY (γ5) -0.10 (0.07) -0.14∗∗∗(0.06) -0.16∗∗∗(0.06) -0.12∗∗ (0.06)LOGVERSIONS 0.13 (0.19) 0.23 (0.17) 0.25 (0.18) 0.07 (0.16)LOGSEVERITY -0.16 (0.17) -0.15 (0.13) -0.17 (0.14) -0.17 (0.18)HARDWARE -0.87 (2.84) -3.70∗∗∗(1.57) -4.05∗∗∗(1.61) -2.97∗ (1.63)HARDWARE*LOGQUANTITY 0.10 (0.19) 0.29∗∗∗(0.11) 0.31∗∗∗(0.11) 0.23∗∗ (0.11)Constant 2.87∗∗∗(1.15) 6.80∗∗∗(0.88) 7.15∗∗∗(0.90) 6.73∗∗∗(1.14)N 366 461 461 461Implied Competition Effect (γ1-γ4) -0.06∗ (0.04) -0.05 (0.04) -0.04 (0.05) -0.02 (0.09)R2(overall) 0.10 0.14 - 0.11R2(between) 0.11 0.13 - 0.10Log Likelihood - - -903.72 -No. Of Vulns. 159 241 241 241Market Fixed effects - 3 3 3Vendor Fixed effects 7+ 8 8 8σu 1.72 1.72 1.79 1.56χ2 for restrictions 3.61 2.60 2.93 0.87
Notes: Estimates shown are those of from the random effects constrained regression model. The coefficientsof γ2 and γ3 are equal to -γ4. *Significant at 90% confidence level. ** Significant at 95% confidence level.*** Significant at 99% confidence level.+ Oracle dummy can no longer be estimated as it is not an operatingsystems vendor.
The estimates of the OS sample in column (1) shows that both disclosure effect and competition
effects are associated with a statistically significant decrease in patch release times. The competition
effect (γ1-γ4) is about 6% per rival or about 10 days. The disclosure effect (γ4) is about 5% or about
8 days. Thus the combined effect of competition and disclosure is about 18 days. The estimate
of quantity suggests that a 10% increase in quantity is associated with about a 1% decrease in
duration. This estimate, however is not statistically significant.
As conjectured when we estimated model 2 on the full sample with market fixed effects, the
19

estimate of competition effect is smaller in magnitude and imprecisely estimated. The results,
shown in column (2) of table 3, the implied competition effect (γ1-γ4) is about -0.05 and no longer
significant. The results however confirm hypothesis 1: an increase in the number of vendors affected
by the vulnerability leads to faster vendor patching times. Estimates of equation 2 suggest that
one additional nonrival is associated with a statistically significant (at the 10% level) 5% decline in
patch release times due to the disclosure effect, or about 8 days. We also find support for hypothesis
3: vendors with larger installed base release patches earlier. A 10% increase in LOGQUANTITY is
associated with 1.4% decline in duration. As mentioned above, the coefficient estimate of rivals and
nonrivals are statistically significant at 5%, the implied competition effect (γ1-γ4) is not precisely
estimated. Although one additional RIVAL is associated with a 10% decline in duration or about 17
days, the coefficient for RIVALS is not significantly different from the coefficient for NONRIVALS.
Thus the effect of competition recovered by subtracting the coefficient of NONRIVALS from that
of RIVALS is hence insignificant. The point estimate for the effects of competition is about 5% for
an increase of one RIVAL or about 8 days. Thus although an increase in competition is associated
with a decline in patch release times (based on the results from the OS sample), the presence of
market fixed effects possibly result in imprecise estimates of competition.
Also, as noted above, the use of market fixed effects in our regressions imply that only one
aspect of competition can be estimated: the effect of competition that stems from rivals that also
share the same vulnerability. Stated otherwise, we are unable to identify how increases in the total
number of rivals in a market influence vendor patching behavior13.
6 Robustness checks
In this section we outline some of the additional analyzes we undertook to examine the robustness
of our estimates to various assumptions. First, we examine the robustness of our results to an
alternative strategy for treating right-censored observations. Second, we check the robustness of
our results to the assumption that INSTANT is exogenous by presenting the results of instrumental13However the estimates of the market fixed effects are consistent with the notion that vendors release patches
earlier on an average in more competitive markets. For instance the estimate in column (2) for the Operating systemmarket fixed effect that has a total of 23 vendors is -1.75(0.70). The estimate of the application server market fixedeffect is -0.26(0.37). This market has a total of only 3 vendors
20

variable regressions. Finally, since our baseline estimates require accurate measurement of RIVALS
and NONRIVALS, we show the results of another model that uses an identification strategy that
does not rely on variance in the number of RIVALS and NONRIVALS.
6.1 Censoring
As a robustness check to our treatment of unpatched observations, we re-estimated equation 2 using
a tobit model in which unpatched observations are treated as right-censored. As with our baseline
random effects GLS specification we are unable to reject the constraints that γ3+γ4=0 and γ2+γ4=0
(χ2-2.93;p-value-0.23). In column (3) of table 3, we show the results of regressing LOGDURATION
on the independent variables in equation 2 using a random effects tobit specification with the
contraints γ3+γ4=0 and γ2+γ4=0. The point estimates of this model are qualitatively similar
to those of the random effects GLS regression described above. The parameter estimate of the
disclosure effect (γ4) is statistically significant at the 10% level and implies a reduction in time
to patch of 6% or 10 days per nonrival. The estimate of γ1 implies that one additional rival is
associated with 10% decline in duration, or about 17 days. The implied reduction in duration from
one more rival associated with the competition effect (β2) is about 4% or 6 days. As with the
results presented in the previous section, the estimate of the competition effect is not statistically
significant possibly due to the presence of market fixed effects. Estimates of the effects of increasing
quantity are similar to our baseline specification: a 10% increase in quantity (β3) is associated with
a 1.6% decrease in DURATION. This estimate is significant at 1% level.
We also conducted a Hausman test comparing the estimates of our baseline model in column
(1) with that of the constrained tobit model. The test rejects any systematic differences between
the two specifications (χ2 4.01;p-value 0.99). Hence we conclude that assigning the maximum value
of LOGDURATION to observations for which the vendor did not release a patch does not result
in biased estimates of competition and disclosure.
21

6.2 Potential endogeneity of instant disclosure
As noted above, identification in equation (2) are based on the assumption that INSTANT is
exogenous. However, it is plausible that instantly disclosed vulnerabilities may differ in some un-
observable ways that influences patching times. We present two sets of results that suggest that
endogeneity, if any does not bias out estimates of β1, β2 and β3. First we estimated a random instru-
mental variables (IV) effects specification that uses instruments for INSTANT, INSTANT*RIVALS
and INSTANT*NONRIVALS. Second, we identify the structural parameters β1 and β2 by solely
using the variation with a vulnerability. Both of these yield quantitatively similar estimates of the
β1, β2 and β3.
6.2.1 Instrumental variables
To examine whether endogeneity of disclosure is biasing our results, we show the results of IV
regressions that use data on the identity of the identifier of the vulnerability as instruments for
INSTANT. A vulnerability can be discovered by any of the following parties: end users, vendors,
CERT/CC, universities or information security consultants. Identifiers of vulnerabilities have dif-
ferent incentives to publicly disclose vulnerabilities. For example, a consultant may be more likely
to publicly disclose vulnerabilities relative to other parties since such discovery may signal the con-
sultant’s ability. However, end users may be more likely to work with either vendors or CERT/CC
since they are primarily concerned with minimizing losses from security incidents. Hence, the
sources of discovery of vulnerabilities are likely to be correlated with disclosure but are unlikely to
be correlated with duration of patching times, conditional on our other right hand side variables.
We use whether the vulnerability was discovered by a consulting firm (CONSULTANT), uni-
versity (UNIVERSITY) or end user (USER) to predict INSTANT. We implemented the method
outlined in Woolridge (2002), procedure 18.1. We first estimated a probit regression in which we
used the sources of discovery described above and other exogenous covariates in 2 to predict in-
stant disclosure. We then used the predicted value of the probit regression as an instrument for
INSTANT. We also used interactions of the probit predicted value with RIVALS and NONRIVALS
as instruments for INSTANT*RIVALS and INSTANT*NONRIVALS respectively in an error and
22

components two stage least squares regression (Baltagi, 1995).
Column (4) of Table 3 shows the results of the random effects IV model used to estimate equation
(2). Tests for the power of the instruments suggest that the instruments are adequate (χ2 statistic on
a Randon effects model for INSTANT 10.04; INSTANT*RIVALS 64.23; INSTANT*NONRIVALS
64.44). As before, we were unable to reject the constraints imposed by equation 2 (χ2 0.87;p-value
0.65). The coefficient estimate of RIVALS is statistically significant at 5% level and suggests that
one additional rival is associated with a 13% decline in duration times, or about 22 days. While
the effect of disclosure (γ4) is no longer statistically significant, the point estimate implies that one
additional nonrival is associated with a decrease in vendor patch release times by 11% or about 18
days. The implied competition effect (β1) is also not statistically significant and is 2% or about 3
days. The coefficient of LOGQUANTITY suggests that a 10% increase in quantity is associated
with a 1.2% decrease in patching time.
A Hausman test comparing the coefficients of the baseline random effects model with that of the
IV regression rejects any systematic differences between the estimates of the random effects model
and IV (χ2 0.75; p-value 1.00). Hence we conclude that the IV results suggest that endogeneity of
INSTANT, INSTANT*RIVALS and INSTANT*NONRIVALS if any does not affect our estimates
of β1, β2 and β3.
6.2.2 Identification using rivals and nonrivals
An alternative robustness check of our assumption on the exogeneity of INSTANT is to identify the
structural variables of interest entirely through the variation in the number of rivals and nonrivals
that are affected by a vulnerability. Since this approach does not use variation in the mode of
disclosure of vulnerabilities, it does not suffer from concerns over the endogeneity of disclosure
mode. This approach imposes the following constraints on equation 2; γ2=0, γ3=0 and γ6=0. Thus
the estimating equation can be written as
LOGDURATION imv = γ0 + γ1RIVALSmv + γ4NON-RIVALSmv +
γ5LOGQUANTITY im + θ1Xi + θ2Zv + θ3Km + εiv (3)
23

Since increases in the number of rivals influence vendors’ patch release decisions through in-
creased competition and threat of disclosure, γ1 identifies the combined effects of disclosure and
competition . In contrast, non-rivals influence vendors’ patch release decisions only through the
disclosure effect (γ4). Hence, we identify the competition effect through β1 = γ1 − γ4.
Column (1) of table 4 shows the results of regressions estimated using equation (3). The
disclosure effect (γ4) is statistically significant (at 10% level) and negative. One additional non-
rival lowers patching times by about 6% or about 10 days. The coefficient estimate of γ1 is about
-0.08 and statistically significant (at the 5% level). However, it is not statistically different from
γ4. Thus the implied effect of competition however appears to be small and marginally significant.
These estimates imply that although one additional rival is associated with a 8% decline in patching
time, this is mostly due to the disclosure effect. As noted above we are not able to estimate the
effect of competition precisely possibly because the market fixed effects soak up some of the effects
of competition. Further, the effects of quantity are similar to other models: a 10% increase quantity
is associated 1.3% decrease in LOGDURATION.
Overall, both the approaches in this and the previous subsection yield qualitatively similar esti-
mates of the effects of competition, disclosure and quantity. Hence we conclude that endogeneity of
INSTANT if any does not significantly affect our estimates of competition, disclosure and quantity.
6.3 Measurement error of RIVALS and NONRIVALS
The model outlined in equation (2) relied on an accurate definition of product markets. Any
measurement error in rivals or nonrivals could potentially bias the estimates of the competition
and disclosure effects. In this section we present the results of estimates of β1 and β2 obtained by
solely exploiting variation in the mode of disclosure of vulnerabilities; we assume in this section
that the effect of the marginal rival and nonrival are the same. The estimates impose a different
set of constraints to equation (2): In particular, we contrain γ1 to be equal to γ4 and constrain
γ2 to be equal to γ3. Recognizing that VENDORS is the sum of RIVALS and NONRIVALS, the
24
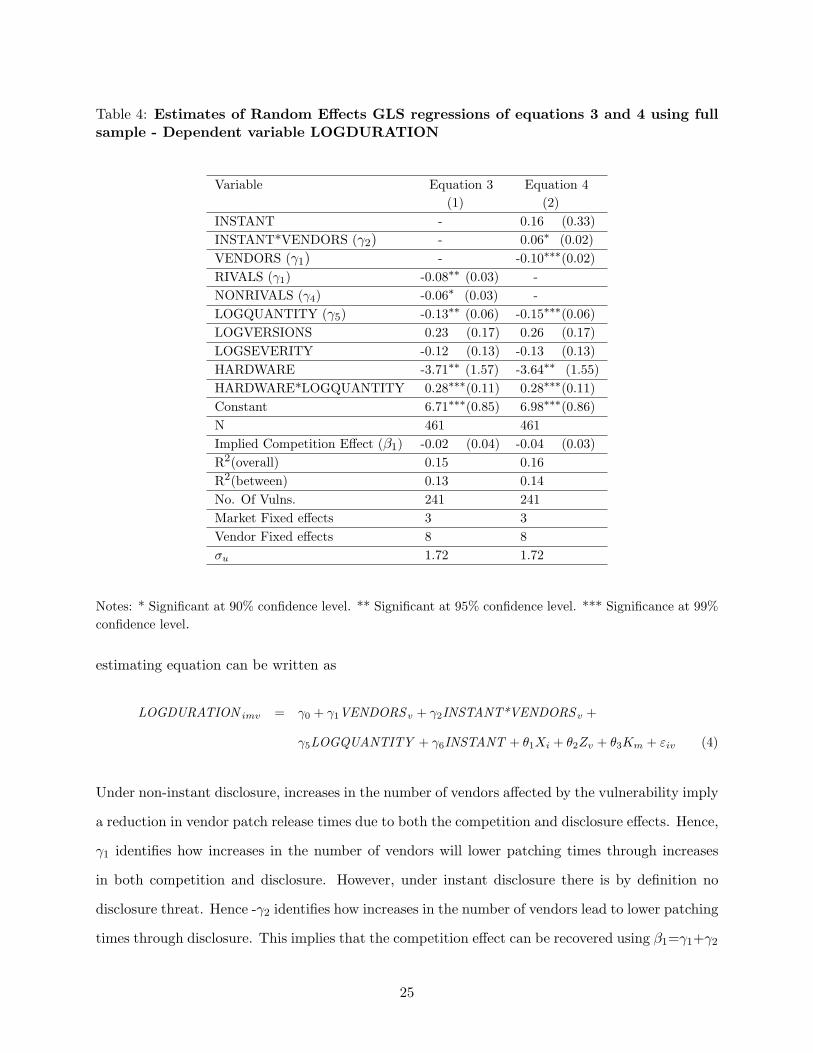
Table 4: Estimates of Random Effects GLS regressions of equations 3 and 4 using fullsample - Dependent variable LOGDURATION
Variable Equation 3 Equation 4(1) (2)
INSTANT - 0.16 (0.33)INSTANT*VENDORS (γ2) - 0.06∗ (0.02)VENDORS (γ1) - -0.10∗∗∗(0.02)RIVALS (γ1) -0.08∗∗ (0.03) -NONRIVALS (γ4) -0.06∗ (0.03) -LOGQUANTITY (γ5) -0.13∗∗ (0.06) -0.15∗∗∗(0.06)LOGVERSIONS 0.23 (0.17) 0.26 (0.17)LOGSEVERITY -0.12 (0.13) -0.13 (0.13)HARDWARE -3.71∗∗ (1.57) -3.64∗∗ (1.55)HARDWARE*LOGQUANTITY 0.28∗∗∗(0.11) 0.28∗∗∗(0.11)Constant 6.71∗∗∗(0.85) 6.98∗∗∗(0.86)N 461 461Implied Competition Effect (β1) -0.02 (0.04) -0.04 (0.03)R2(overall) 0.15 0.16R2(between) 0.13 0.14No. Of Vulns. 241 241Market Fixed effects 3 3Vendor Fixed effects 8 8σu 1.72 1.72
Notes: * Significant at 90% confidence level. ** Significant at 95% confidence level. *** Significance at 99%confidence level.
estimating equation can be written as
LOGDURATION imv = γ0 + γ1VENDORS v + γ2INSTANT*VENDORSv +
γ5LOGQUANTITY + γ6INSTANT + θ1Xi + θ2Zv + θ3Km + εiv (4)
Under non-instant disclosure, increases in the number of vendors affected by the vulnerability imply
a reduction in vendor patch release times due to both the competition and disclosure effects. Hence,
γ1 identifies how increases in the number of vendors will lower patching times through increases
in both competition and disclosure. However, under instant disclosure there is by definition no
disclosure threat. Hence -γ2 identifies how increases in the number of vendors lead to lower patching
times through disclosure. This implies that the competition effect can be recovered using β1=γ1+γ2
25

while the disclosure effect is just β2=-γ2.
Column (2) of Table 4 shows the results of random effects GLS estimation for equation 4. The
estimate of γ2 is a statistically significant 0.06 at (10% level), and implies that one additional
vendor is associated with a 6% decline in duration times due to disclosure threat (since β2 = −γ2),
or about 10 days. The coefficient of γ1 implies that one additional vendor is associated with a
10% or about 17 days decrease in patch release times due to the combined effect of competition
and disclosure. The estimate of competition γ1+γ2 suggests that one additional vendor leads a
4% decline in duration or about 7 days due to the effect of competition. However this estimate is
not statistically significant. Estimates of the effect of quantity (β3) suggest that a 10% increase in
installed base is associated with 1.5% decline in duration. Since the results of this specification are
qualitatively similar to the results shown in section 5, we conclude that possible mis-measurement
of RIVALS and NONRIVALS does not bias our estimates of β1 and β2.
7 Discussion and conclusion
In this study, we show how competition, disclosure, and market size influence decisions by software
vendors to invest in one key area of product quality: the patching of software vulnerabilities.
Our estimates show that disclosure threat has a significant impact on vendor patching behavior
in software markets: One additional nonrival lowers expected patching times by about 8 days.
We show that one additional rival in a market reduces patching times also by about 8 days due
to increasing internalization of customer losses, however this result is not statistically significant.
Last, we demonstrate that increases in market size leads to lower patching times: a 10% increase
in quantity leads to a 1.4% decline in patching times.
7.1 Limitations
As with any empirical work, the data that we bring to bear has some limitations. First, we are able
only able to identify how one facet of competition influences patch release times: competition from
vendors who are also affected by the same vulnerability. We are not able to separately identify the
26

overall impact of competition on software quality, nor are we able to identify the specific mechanism
through which competition influences patch release times. Further, as noted above we are unable to
identify whether increases in nonrivals influences patch release times through actual early disclosure
or through the threat of early disclosure. Though our empirical estimates may be consistent with
different competition and disclosure mechanisms, this does not influence the primary findings of
this paper: that increases in the number of vendors affected by vulnerabilities influence ex post
quality provision through the effects of competition and disclosure.
Our data on vulnerabilities were from a specific sample period. Moreover, though the source
of our vulnerability data, CERT/CC, is generally recognized as the leading provider of such data,
our sample includes only the most serious vulnerabilities disclosed during this time period. It is
possible that the effects of competition and disclosure may be different over a different time period
or over a broader sample.
Each of our models required differing identification assumptions regarding the measurement of
rivals and nonrivals and their relationship with vendor patch release times. However, by estimating a
variety of different models that provide very similar estimates we are able to improve the confidence
in our results.
7.2 Implications for research
Our research provides direct evidence on a question of considerable importance to academics, man-
agers, and policymakers: the relationship between market structure and ex-post quality provision
in the market for software. We showed that increases in the number of affected vendors had a
statistically and economically significant impact on vendor patch release times. We advance prior
empirical research on the relationship between market structure and quality competition in two
significant ways. First, while prior research in this area used cross-sectional market variation to
identify this relationship and so by necessity focused on service industries, we provide a setting
where we are able to examine this relationship in an important goods market: software. Second,
we showed that quality provision was influenced not only by the number of rivals competing with
the firm, but also by the number of non-rivals that were affected by the same vulnerability. This
27

suggests that future research on the determinants of quality provision should focus in particular on
the affect of changes in the number of firms that share similar dimensions of quality.
More broadly, this research provides evidence on how changes to technologically related infor-
mation technology markets affect firm behavior. Empirical research on this topic remains relatively
rare because of the difficulty in obtaining data sets with systematic variation in same and related
markets. Moreover, we differ from all prior work on this topic in a fundamental way. While prior
work has focused on changes to technologically related markets that are complements in demand
(e.g., Bresnahan and Greenstein 1999; Bresnahan and Lin 2006; Kretschmer 2005), we focus on
changes to markets that share common inputs.
In particular, we show that vendors in one market can influence strategic behavior in another
market that is unrelated (neither a complement nor substitute) in demand due to shared code.
We believe that this phenomenon is more important than is widely appreciated. Recent trends
in programming such as object-oriented programming and open source have emphasized software
reuse. Research on software engineering has long recognized the promises and challenges of software
reuse in the design and development of software. However, there has been relatively little research
on how this practice influences strategic decision-making in firms. Shared code bases have the
potential to influence product market strategies in unrelated markets through mechanisms other
than the ones we consider: for example, other dimensions of software quality and exposure to
intellectual property litigation. For example, in March 1993 SCO Group filed a well known lawsuit
against IBM for allegedly contributing proprietary SCO code to open-source Linux. This lawsuit
had implications for Linux users and software developers across a variety of industries (e.g., Foley
2003). In short, more research is needed to understand the implications of shared code base for the
strategic behavior of software firms.
7.3 Implications for managers and policymakers
Understanding the relationship between competition and software quality is important for managers
and policymakers. For users of software, understanding of this relationship may inform software
purchase decisions: other things equal, changes in quality provision induced by market structure
28

may influence vendor or product choice. In addition, for producers of software understanding of
this relationship will provide clues to competitior behavior. In particular, our results provide a first
step toward a better understanding of how the marginal entrant will influence quality provision by
competitors.
These findings also have implications for how vendors build their products. Vendors who use
code shared by rivals and non-rivals should be aware of the future implications of the competition
and disclosure effects for investments in ex post quality provision. While prior research on software
engineering economics has attempted to measure how software reuse influences development costs
(e.g., Banker and Kauffman 1991; Poulin et al 1993), our research shows that reuse may engender
greater costs of software quality provision in the future.
Last, these results have implications for the debate of how to improve software quality. Given
the rapid increase in the number of reported software vulnerabilities and the consequent economic
damages to end users, the factors that contribute to the timing of vendors’ patch release has
been a matter of great interest among members of the software community. Many members of
the security community have recommended regulation aimed at providing incentives for software
vendors to minimize the time window of exposure to end users. However the type of regulation that
would minimize social losses from vulnerabilities critically depends upon proper understanding of
factors that condition the timing of patch release to vulnerabilities. Our research demonstrates that
despite high levels of concentration in many software markets, threat of disclosure from vendors in
complementary markets works to reduce patching times almost as much as increases in the number
of direct competitors affected by vulnerabilities.
By demonstrating that disclosure threat can be used as a tool to induce vendors to patch
vulnerabilities faster, our results inform the debate on software quality in another way. Our results
suggest that non-instant disclosure could be more welfare-enhancing than instant disclosure. In
particular, our results suggest that for policy markets like CERT/CC, any disclosure policy should
influence judicious use of disclosure threat to elicit faster vendor responses to vulnerabilities.
29

References:
Arora A., Caulkins J., Telang R. (2006) “Sell First, Fix Later: Impact of Patching on SoftwareQuality”, Management Science , 52(3),465-471
Arora, A., Forman C., Nandkumar A., Telang R. (2006) ”Competition and Quality Restoration:An Empirical Analysis of Vendor Response to Software Vulnerabilities,” Working Paper, HeinzSchool of Public Policy & Management, Carnegie Mellon University.
Arora A., Krishnan R., Telang R. & Yang Y. (2005) ”An Empirical Analysis of Vendor Responseto Disclosure Policy,” Workshop on Economics of Information Security (WEIS05), Kennedy Schoolof Government, Harvard University, 2005.
Arora A., Nandkumar A. & Telang R. (2004) ”Impact of patches and software vulnerabilityinformation on frequency of security attacks - An empirical analysis, Information Systems Frontier,8(5), 350-362.
Arora A., Telang R. & Xu H. (2004)”Optimal Policy for Software Vulnerability Disclosure,”Workshop on Economics and Information Security (WEIS04), University of Minnesota, 2004.
Baltagi, Badi H. (1995) Econometric Analysis of Panel Data, Wiley, New York.
Banker, R. and R. Kauffman (1991), “Reuse and Productivity in Integrated Computer-AidedSoftware Engineering: An Empirical Study” MIS Quarterly 15(3): 375-401.
Banker, R., G. Davis and S. Slaughter (1998) “Software Development Practices, Software Com-plexity, and Maintenance Performance, ” Management Science, 44(4):433-450.
Borenstein S. and Netz J. (1999), “Why do All the Flights Leave at 8 am?: Competition andDeparture-Time Differentiation in airline markets,” International Journal of Industrial Organiza-tion, 20(3):344-365.
Bresnahan, T., and S. Greenstein, (1996), Technical Progress in Computing and in the Uses ofComputers. Brookings Papers on Economic Activity, Microeconomics, 1-78.
Bresnahan, T. and P-Y Lin, (2006), Economic and Technical Drivers of Technology Choice:Browsers. Working Paper, Harvard Business School, Harvard University.
Brown, A. and G. Booch (2002), “Reusing Open Source Software and Practices: The Impactof Open-Source on Commercial Vendors” in Software Reuse: Methods, Techniques, and Tools: 7thInternational Conference, ICSR-7 Proceedings, (ed.) C. Gacek, p. 123-136.
Cavusoglu H., H. Cavusoglu, S. Raghunathan (2005), ”Recent Issues in Responsible Vulnera-bility Disclosure,” Workshop on Economics and Information Security (WEIS), Boston, MA, June
Choi J.P., Fershtman C. & Gandal N. (2005) ”Internet Security, Vulnerability Disclosure, andSoftware Provision,” Workshop on Economics of Information Security (WEIS05), Kennedy Schoolof Government, Harvard University, 2005.
Cohen A. and Mazzeo M. (2004) “Competition, Product Differentiation and Quality Provi-sion: An Empirical Equilibrium Analysis of Bank Branching Decisions,” Finance and EconomicsDiscussion Series 2004-46. Washington: Board of Governors of Federal Reserve System, 2004.
Dranove D. and W.White (1994), “Recent Theory and Evidence on Competition in Hospital
30

Markets,” Journal of Economics and Management Strategy, 3(1):169-209.
Domberger S. and A. Sherr (1989), “The impact of competition on pricing and Quality of LegalServices,” International Review of Law and Economics, 9:41-56.
Forman C., Goldfarb A., and Greenstein S. (2005), “How did location affect adoption of thecommercial Internet? Global village vs. urban leadership” Journal of Urban Economics 58: 389-420.
Gal-Or E., (1983), “Quality and quantity competition” The Bell Journal of Economics, 14(2):590-600.
Gawer, A. and R. Henderson (2006), Platform Owner Entry and Innovation in ComplementaryMarkets: Evidence from Intel. NBER Working Paper #11852.
Harter, D.E., M.S. Krishnan, and S. Slaughter (2000), “Effects of Process Maturity on Quality,Cycle Time, and Effort in Software Product Development,” Management Science, 46(4):451-466.
Hoxby C. (2000), “Does Competition among Public Scools benefit Students or Taxpayers?,”American Economic Review, 90(5):1209-1238.
Foley, John (2003) “You May Be Next” Information Week, November 23, available at
http://www.informationweek.com/shared/printableArticle.jhtml?articleID=16400348.
Kretschmer, Tobias (2005) “Competing Technologies in the Database Management SystemsMarket” NET Institute Working Paper #05-17.
Levhari D. and Peles Y., (1973), “Market Structure, Quality and Durability.” The Bell Journalof Economics and Management Science, 4(1): 235-248
Mazzeo, M. (2002), “Product choice and oligopoly market structure” RAND Journal of Eco-nomics 33(2): 1-22.
Mazzeo M. (2003), “Competition and Service Quality in the U.S. Airline Industry,” Review ofindustrial Organization, 22: 275-296
Poulin, J.S., J.M. Caruso, and D.R. Hancock (1993), “The business case for software reuse,”IBM Systems Journal 32(4): 567-594.
Schmalensee R. (1979), “Market Structure, durability, and Quality: A Selective Survey,” Eco-nomic Inquiry, 17: 177-196
Schneier B. (2000) ”Full Disclosure and the Window of Exposure,” in: CRYPTO-GRAM, 2000.
Nizovtsev, D.T., M. ”Economic Analysis of Incentives to Disclose Software Vulnerabilities,”Workshop on Economics and Information Security (WEIS05), Kennedy School of Government,Harvard University, 2005.
Shapiro, C, and Varian H. (1999) Information Rules: A Strategic Guide to the Network Econ-omy. Boston: Harvard Business School Press.
Spence A.M., (1975), “Monopoly, Quality and Regulation” The Bell Journal of Economics 6(2):417-429
31

Swan P.L., (1970), “Durability of Consumer Goods,” American Economic Review, 60: 884-894
Telang R. and Wattal S. (2005) ”Impact of Software Vulnerability Announcements on theMarket Value of Software Vendors – an Empirical Investigation,” Workshop on Economics of In-formation Security (WEIS05), Kennedy School of Government, Harvard University, 2005.
West, J. and J. Dedrick, (2000) “Innovation and Control in Standards Architectures: The Riseand Fall of Japan’s PC-98. Information Systems Research 11(2): 197-216.
Wooldridge, J. (2002) “”Econometric Analysis of Cross Section and Panel Data. MIT press.
32