Embed Size (px)
Citation preview
Competencies, Technological Change and Network Dynamics
The case of the bio-pharmaceutical industry
Luigi Orsenigo*, Fabio Pammolli**, and Massimo Riccaboni***
* Department of Economics, Bocconi University, Milan
** Faculty of Economics “R.M. Goodwin”, University of Siena
*** Sant'Anna School of Advanced Studies, Pisa
Paper prepared for the TSER Dynacom Project
Acknowledgments: The authors wish to thank Giovanni Dosi, Stanley Metcalfe,
Keith Pavitt, Pier Paolo Saviotti, and participants to seminars held at Universidad
Complutense, Madrid, SPRU, University of Sussex, INRA; Grenoble, Columbia
University, New York, BETA, Strasbourg, for useful comments. Support from the
European Commission, DG XII, and from the Italian Ministry of University and
Scientific Research (MURST) is gratefully acknowledged.
1
1. IntroductionThis paper is a study on the organizational mechanisms guiding the search and
exploitation of technological competencies. It focuses on a specific organization form, namely
networks of collaborative relationships among firms, in a specific technology, pharmaceutical
biotechnology. There are several reasons why we believe this subject is interesting and relevant
to the broader Dynacom project.
First, networks of collaborative relationships among firms have attracted a great deal of
attention in recent times among sociologists, organizational theorists and industrial economists,
as it is now widely recognized that collaborative relationships are an important form of
organization of innovative activities, especially (but not only) in high technology industries. It is
therefore crucial to understand their logic, the processes that guide their emergence and
subsequent evolution and their implications for the performance of individual companies and
industries. In this paper, we focus only on a subset of these questions. We examine in particular
the dynamics of networks and derive only some very preliminary implications in terms of the
performance of firms, industries and countries. \ These issues will be the subject of a companion
paper, which will be focused on the analysis of the role and performance of European
companies within the global network
Second, biotechnology is a major new technological paradigm which has been deeply
transforming the nature of the relevant competencies and of the learning processes in various
industries, particularly in pharmaceuticals. The pharmaceutical industry used to be - and to a
large extent still is - one of the sectors where Europe enjoyed relative and in some cases
absolute technological and competitive advantages. However, over the past two decades these
advantages have been partly eroded. US companies have clearly taken the lead in innovation
and sales. Within Europe, British firms have shown a remarkable performance, whilst the
position of the German industry - which has been an absolute world leader for almost a century
- has been deteriorating. Whilst there is a considerable debate about the reasons and the extent
of this decline, a wide consensus appears to exist on the consideration that this (partial) decline
is linked to the joint working of two main factors: \ a series of big technological shocks and a
series of large institutional shocks (ranging from the introduction of tighter regulations in the
process of approval of drugs, to policies of cost containment of health expenditures, etc.). Thus,
it is certainly relevant to explore in some detail how these shocks have impacted on different
firms and national industries.
In this paper, we focus on technological shocks. It has been argued (see, for example
Henderson, 1994, Gambardella 1995, Henderson, Orsenigo and Pisano, 1999, Pammolli, 1997)
that the emergence of a new knowledge base in the pharmaceutical industry, based on biology
rather than on chemistry, has led to profound transformations in the procedures underlying drug
2
discovery and in the organisation of the innovative process within firms and among firms and
other institutions (like University laboratories). The different response of both individual
corporations and national industries to these changes is certainly a major part of the explanation
of the aggregate trends of competitiveness in this sector. For the specific purposes of this paper,
two issues stand out as particularly challenging.
First, the new knowledge base has a distinct scientific nature and therefore it is, in
principle, abstract, codified and - absent the establishment of intellectual property rights-
immediately accessible by everybody. \ This makes the case of pharmaceuticals largely different
from most of the cases on which the empirical literature about organizational transformations is
based, which deals mainly with engineering knowledge. Moreover, there might be somewhat of
a puzzle here. Given these properties, how is it that firms and national industries reacted so
differently to the ''molecular biology revolution''? Second, a distinct feature of the recent
evolution of the pharmaceutical industry has been the emergence of a dense network of
collaborative relations between various types of firms (new specialized entrants, large
established corporations, universities, etc.). What does explain this ''organizational innovation''
and what are the variables driving the dynamics of the network over time?
One can find in the literature widely different interpretations of the nature, motivations,
structure and functions of these networks, ranging from more sociologically oriented
approaches to economic explanations based on (various mixes of) alternative theoretical
backgrounds, e.g. transaction costs, contract theories, game theory and competence-based
accounts of firms' organization. In turn, these interpretations generate widely different
predictions about the evolution of collaborative relationships over time (Barley, Freeman and
Hybels; 1992; Arora and Gambardella, 1994; Gambardella 1995; Powell, Doput and Smith-
Doerr, 1996; Orsenigo et al., 1998)..
For example, with reference to the case of biotechnology, collaborative relations have
been often considered as a transient phenomenon, bound to decrease in scale and scope as the
technology matures and as higher degrees of vertical integration are established in the industry
(Pisano, 1991).
In a rather different perspective, the role played by scientific knowledge in pharmaceutical
research is stressed and the nature and properties of the learning processes fuel the emergence
and evolution of networks. In this vein, collaborations represent a new form of organization of
innovative activities, which are emerging in response to the increasingly codified and abstract
nature of the knowledge bases on which innovations draw (Arora and Gambardella,1994,
Gambardella, 1995). To be sure, substantial market failures exist in the exchange of a
commodity like information. However, the abstract and codified nature of science makes it
possible, in principle, to separate the innovative process in different vertical stages.
3
According to this perspective, a key factor in reducing the importance of this constraint to
division of innovative labor is the growth in physical, biological and engineering sciences. This
provides the opportunity of comprehending in new ways what is already known, abstracting
from the idiosyncratic and contextual features of specific applications, so that what is known
can be generalized to encompass several applications. Abstract and general knowledge tends to
be better articulated and easier to codify in useful ways. In recent years, the growth of
computing capabilities, both hardware and software, is assumed to have given a big boost to the
growth of such general and abstract knowledge. In turn, this has made possible a greater
separation between the production of general-purpose knowledge -- of general and abstract
knowledge -- and the use of such knowledge.
Thus, according to this approach, the innovative process can be adequately represented as
a sequence going downstream from science to marketing, in which division of labor can occur at
any stage of the process. Different types of institutions tend to specialize in the stage of the
innovative process in which they are more efficient: universities in the first stage, small firms in
the second, big established firms in the third. In this view, then, a network of ties between these
agents can provide the necessary coordination of the innovative process. Collaborations are
likely to be a permanent feature of the industry, with a large (and possibly continuously
expanding) number of entities interacting with an equally large number of other entities,
generating an intricate network within which each subject specializes in particular technological
areas or stages of the innovative process getting benefits from an increasing division of
innovative labor.
Finally, according to some more radical interpretations, the complex and interdisciplinary
nature of relevant knowledge bases in pharmaceutical R\&D tends to make technological
innovations the outcome of interactions and cooperation among different types of agents
commanding differentiated competencies and complementary resources (Orsenigo, 1989;
Pisano, 1991; Orsenigo et al., 1998). In this perspective, it has also been suggested that the locus
of innovation (and the proper unit of analysis) is no longer a firm, but a network of
differentiated agents (see Powell, Koput, Smith-Doerr, 1996). In this case, the direction of
causation is reversed. It is the structure of the network and the position of agents within it that
fundamentally determine agents' access to relevant sources of scientific and technological
knowledge and, therefore, innovative activities and performances (see also Kogut et al. 1994;
Walker et al., 1997).
However, albeit with some notable exceptions (see Powell, Doput and Smith-Doerr, 1996,
Walker, Kogut and Shan, 1997; Orsenigo et al., 1998), it has proved very difficult to provide
strong empirical evidence in support or against these different accounts. In fact, while the
natural test bed of these different interpretations should be based on the observation of network
dynamics over time, most of the analyses are static in nature or perform comparative statics

4
exercises. On the contrary, very little has been done, at the empirical level, on the dynamics of
collaborative relationships, i.e. how are they formed, how do they change over time, to which
sort of configuration do they converge at, if any.
We do not review here this rapidly expanding and complex literature. However, it is
possible to observe that despite their differences, most of these approaches and explanations
seem to agree in principle that, particularly in high growth, technology intensive industries,
networks of collaborative relationships have to be analyzed as organizational devices for the
coordination of heterogeneous learning processes by agents endowed by different skills,
competencies, access to information and assets.
Thus, learning ought to be a central concern in the analysis of collaborative relationships.
Beyond a rather generic agreement, though, available empirical analyses do not address the
specific nature and properties of the underlying knowledge bases and search activities that
should be used as explanatory constructs. Consequently, it becomes hard to understand clearly
what are the implied relationships (if any) between the structure and functions of the network
and its evolution on the one hand, and the fundamental features of the relevant learning
processes on the other.
Against this background, this paper aims to move a step forward in the direction of
establishing a closer connection between the structure and evolution of knowledge and the
structure and evolution of organizational forms in innovative activities.
As compared to the existing literature on network of collaborative agreements, this paper
is characterized by an explicit focus on the technological and cognitive determinants of the
structure and dynamics of relevant industrial variables (see Dosi, 1982).
The nature and evolution of underlying technological conditions are explored in order to
identify major boundaries to the range of possible structural configurations which the structure
of the network can assume over time.
We rediscover the mathematical language of the theory of directed graphs moving back
from concepts, measures, and explanations developed in the field of social network analysis, in
order to explain how scientific and technological knowledge induce distinguishable patterns of
change at the macro level of industry structure and evolution .
By means of graph theory, we develop a set of indicators that have not been exploited in
the field of social network analysis. In particular, graph theory appears to be very useful to
unravel the complex properties of empirical objects such diverse as technological and industrial
structures, revealing the existence of basic technological determinants of network structure and
evolution.
5
First, we describe some basic features of research strategies and heuristics underlying the
evolution of relevant knowledge bases in the field of analysis. Second, the relevant features of\
the structure and evolution of the industry network are examined.
We come to demonstrate that a mapping exists that goes from decompositions and
research heuristics observed in scientific and technological research to the patterns of structural
evolution at the macro level of the industry network.
In other words, the specific nature of relevant problem solving strategies and learning
processes turns out to be a fundamental determinant of the structure and dynamics of the
network of collaborative agreements.
The paper is organized as follows.
Section 2 briefly highlights the nature and goals of some fundamental research heuristics
and techniques developed by firms and institutions in the last twenty years in their efforts to
discover and develop new effective drugs. In particular, a fundamental distinction is captured
between co-specialized and transversal research technologies/strategies; that is, between
heuristics/research techniques that tend to be specific to particular domains, and
heuristics/research techniques that are both generic and, at the same time, complementary to co-
specialized ones.
In Section 3, we highlight some implications of the nature of these heuristics and research
strategies on the organization of innovative activities and on patterns of evolution of the
network of R&D collaborative relationships.
In Section 4 we turn to the empirical analysis of the evolution of the network. Graph
theory and numerical representations of networks are introduced, coming to show the existence
of a striking homomorphic relationship with the structure and evolution of most recurrent
research hypotheses and techniques used in problem solving activities. We refer to the notion of
Canonical Decomposition of a graph in order to disentangle two major drivers/components of
the structural evolution of the net, i.e., co-specialized and transversal actors that rely on co-
specialized and transversal research techniques.
The presentation of the main findings and the discussion of some implications for the
analysis of organization and industrial dynamics close the paper.
6
2. The growth of scientific and technological knowledge inpharmaceutical R&D
The last twenty-five years have witnessed a revolution in biological sciences, with
significant basic advances in molecular biology, cell biology, biochemistry, protein and peptide
chemistry, physiology, pharmacology and other relevant scientific disciplines. The application
of these new bodies of knowledge to pharmaceutical industry has had an enormous impact on
the nature of R&D activities, on the organizational capabilities required to introduce new drugs,
and on patterns of industry evolution (see Galambos, Sturchio, 1996; Henderson, Orsenigo,
Pisano, 1999).
In fact, the so-called “molecularization” of physiology, pathology and pharmacology,
corresponds to a principle according to which for the development of new powerful and
selective drugs search has to penetrate deeply into the human organism to unravel the
biochemical interactions at the cellular, infra-cellular and, most importantly, molecular levels.
According to the molecular biology paradigm, the route to understanding of human
organism (nature) is through the dissection of the system in its constituent parts, followed by the
study of these parts. The properties of the whole – and hence its behavior – are the sum of the
properties of the parts, while pathologies are analyzed in terms of specific alterations of the
molecules that constitute the human organism. This philosophy has had profound effect on the
methods of inquiry, leading scientists to pursue the pattern: “study: dissect, identify, classify,
and dissect further” (Testa, Meyer, 1995, p. 6).
In this perspective, the development of new drugs rests on the ability to generate more
general theories that yield an increasingly “deeper” explanation of processes that take place at
higher levels of organization of matter inside the human organism.
Notably, with reference to the range of possibilities for therapeutic intervention, the
convergence at the level of scientific explanations generated by the progress of fundamental
knowledge corresponds to the identification of longer and more complex chains of causal
events. In fact, for almost all the more complex pathologies, the inner dynamics of knowledge
has been leading to a proliferation of a priori hypotheses on plausible research trajectories.
Whilst new scientific explanations and discoveries can lead to deeper knowledge and, moreover,
more fundamental explanations of the nature of processes that happen in the human organism
can focus search at a given level of analysis, the very same achievements generate new
hierarchies of sub-hypotheses.
This dynamics creates a dilemma: by definition, more fundamental theories explain more
but, simultaneously, they multiply the number of points of entry for the discovery and the
development of new therapeutic treatments.
7
In other words, the very process of convergence at the level of scientific explanations can
lead to a process of divergence in research strategies generated along the hierarchy of
increasingly specific sub-hypotheses, with an increase in the number of alternative routes for
intervening in the disease process.
To put it differently, scientific progress certainly “simplifies” the search space,
eliminating certain alternatives that are proven to be wrong (Nelson 1959; Arrow, 1962).
However, at the same time, scientific discoveries generate a deformation and an expansion of
the search space, by suggesting new competing hierarchies of sub-hypotheses as well as
previously unconceivable opportunities of discovery. Moreover, many research techniques and
biological targets tend to be typically characterized by high degrees of co-specialization. That is
to say, research techniques tend to be relatively specific to particular fields of application. Thus,
a proliferation is observed in the number of trajectories, techniques, and ex ante conceivable
exploration strategies.
Moreover, technologies such as genomics, gene sequencing, transgenic animals, and
molecular biology have started to supply the industry with a huge number of novel biological
targets thought to be relevant to a vast array of diseases defined at the molecular level and
developing highly sensitive assays incorporating these targets.
The substantial growth of biological knowledge on the human organism at the cellular,
molecular and genetic levels notwithstanding, the discovery and development of drugs
continues to be a lengthy, expensive and often unsuccessful process. Within this context, the
increasing number of plausible targets has generated severe bottlenecks in the drug discovery
process, associated with the difficulty of quickly and cheaply analyzing function and disease
relevance of newly discovered targets and matching related compounds (see Vos, 1991).
Against this background, during the Eighties and Nineties new developments in solution
phase and solid phase chemistries, high-throughput screening technologies (HTS), information
technologies, and combinatorial chemistry have led to the development of research technologies
that allow to achieve a higher breadth of applications, measured in terms of the number of
disease areas and biological targets to which the technology may be applied.
In extreme synthesis, while several thousand genetic targets could not have been
addressed with the methods of conventional medicinal chemistry, the development of
combinatorial chemistry libraries, together with new techniques for high-throughput screening
and ever-improving bio-informatics tools, has gradually made it possible to test a large number
of potential drug targets against an even larger number of chemical entities1.
1 Combinatorial chemistry enables rapid and systematic assembling of a variety of molecular
entities, or building blocks, in many different combinations to create tens of thousands of diverse
8
More generally, during the Nineties a set of generic research technologies has been
developed, from Polymerize Chain Reaction to protein structure modeling, rapid computer
based drug assay and testing, recombinant chemistry techniques, drug delivery systems,
chemical separation and purification techniques that allow researchers to screen thousands of
potentially promising compounds.
On the whole, the recent evolution of research strategies and heuristics in pharmaceutical
R&D can be characterized by discerning between two main search regimes, that coexist within
the industry. The first regime is essentially based on research techniques that tend to be specific
to given fields of application (co-specialized technologies) while the second regime is
characterized by the emergence of new generic tools (transversal technologies).
In the case of co-specialized research technologies, the design and experimentation of
each new drug tends to require individual analysis, while lessons learned from the design and
experimentation of one therapeutic cannot be immediately transferred to the development of
other classes of drugs. Conversely, transversal technologies are in principle applicable to
multiple biological targets and diseases. However, since pharmaceutical R&D “deals with a
system – the human body – far more complicated than any mechanical or electronic system”
(Gambardella, 1995, p. 16), co-specialized and transversal techniques remain coupled to each
other, in the context of research projects and development activities carried out under conditions
of strong uncertainty2.
3. From growth of knowledge to network dynamics
So far, we have identified some properties of the processes of scientific discovery
underpinning research activities in the pharmaceutical industry. An extensive literature has
documented some of the consequences that the advent of molecular biology has produced on the
compounds that can be tested in drug discovery screening assays to identify potential lead compounds.Large libraries are available to be tested against both established and novel targets to yield potentiallead compounds for new medicines. Such vast numbers of compounds have been introducing a substantialchallenge to the drug discovery process and have created a need for faster and more efficient screening.High-throughput screening ( HTS ) methods make it possible to screen vast populations of compounds viaautomated instrumentation: that is, complex workstations capable of performing several functions withthe help of mechanical arms or simpler automated dilution devices.
2 For example, new technologies including high-throughput methods for sequencing genes, for
monitoring and comparing their expression in different situations, and following their inheritance infamilies prone to particular diseases, depend crucially on the integration of molecular biology withrobotics, and analytical instrumentation. The integration of these disciplines has started to providepowerful capabilities for generating and analyzing large volumes of data about genes and theirexpression, making it possible for the first time to mount a systematic search effort to discover andcharacterize the genes and biochemical pathways which underlie human diseases.

9
organization of innovative activities, at the firm level and at the industry level (Henderson,
1994; McKelvey, 1995; Gambardella, 1995; Orsenigo, 1989; Galambos and Sturchio, 1998;
Henderson et al., 1999). In particular, it has been emphasized that the emergence of a dense
network of collaborative relationships among firms of different types and other research
institutions has been a major feature of the recent evolution of the pharmaceutical industry.
In this section, we examine in more detail if and how the specific properties of the
processes of scientific discovery in molecular biology influence the patterns of evolution of the
network of collaborative relationships. Our main claim is that these basic properties ought to be
preserved in the dynamics of the network, if such a form of organization of innovative activities
has (at least partly) to be understood as an adaptive response to the structural cognitive features
of the dynamics of search activities. That is, if the specific properties of learning processes
influence and constrain the possible forms of organization of innovative activities.
Let us briefly summarize the basic properties of the dynamics of knowledge discussed in
the previous Section. First, a process of fast expansion of biological knowledge in the fields of
biochemistry, physiology and pathology has been surging within the industry. Secondly, such
growth of knowledge has taken the form of a branching process, in which general hypothesis
gives origin to a variety of sub-hypotheses, that in turn develop other sub-hypotheses at lower
levels of generality, and so on. Third, as a consequence, the structure of knowledge comes to
have a distinct hierarchical nature. Fourth, the overall process is highly cumulative, since it is
based on a dynamics that introduces progressive specifications of biological hypotheses at each
level of the hierarchy. Fifth, this dynamics of knowledge imposes a specific structure on the
degree of stability of the hypotheses. At higher levels of the hierarchy, hypotheses tend to stay
relatively stable, since their falsification occurs over a relatively long time scale, being based on
the falsification/selection of hypotheses at lower levels of generality. Sixth, during the Nineties
the appearance of transversal technologies for the production and screening of new molecular
structures has introduced a new dimension in the evolution of the relevant knowledge bases.
According to our conjectures, these basic properties ought to be reflected in the network
of collaborative relationships. We address only indirectly the question why collaborative
agreements have become such an important form of organization of innovative activities. This
would imply the specification of a fully-fledged model of how cognitive structures influence
organization forms (for a first attempt, see Pammolli and Riccaboni, 1999). We advance some
rather specific hypotheses on how the structure of the network should look like and treat the
empirical evidence as a sort of reduced form of a well-specified structural model.
It is important to notice that the task of specifying the linkages between the properties of
the dynamics of knowledge and the structural evolution of the network is somewhat facilitated
10
by the very special nature of the pharmaceutical-biotechnology industry, as a strongly science-
based sector. Differently from other industries or technologies, in this case, scientific research
has had (and continues to have) a direct and immediate relevance for innovative activities. The
proliferation of new companies specialized in the production of new techniques and products
directly derived by cutting edge academic scientific research and the development of a dense
network of collaborative relations among firms are – as it is well known – prominent features
of the industry.
In the following empirical analysis, a research hypothesis/technique is associated to a
specific R&D project embedded in a firm/institution. Every firm/institution is defined by the
collection of its research projects over time, while agreements are conceived as organizational
devices through which hypotheses/techniques are combined and in which an Originator can be
distinguished from a Developer (see Appendix 1 for technicalities).
On these bases, we can advance the following testable “predictions”.
First, as projects correspond to research hypotheses/techniques, and provided that the
latter proliferate over time, originated by an increasing number of firms, we would expect to
observe an expansion of the network over time. This growth may take place both through the
entry of new firms and by means of an increase in the number of agreements between existing
agents. Secondly, the hierarchical structure of growth of knowledge should result in a process of
hierarchization of the network, with the emergence of a core of firms/institutions who are able
to manage general hypotheses/projects. Third, given the cumulative nature of the growth of
knowledge, earlier (later) entrants in the network should embody more general and stable
(specific and unstable) hypotheses. Thus, we would expect to observe the development of a
stable core in the network – composed mainly by earlier entrants – linking with an expanding
turbulent fringe of later, more co-specialized, entrants. Fourth, this structure would be perturbed
by the entry of new agents embodying either new “general” hypothesis, a wide portfolio of
specialized techniques, or “transversal” techniques. In such a circumstance, one would observe
a reduction of the degree of hierarchization of the network, as these agents are in principle able
to link with many other actors and – in the case of transversal techniques – they would also
induce a shift in the profile of relationships between earlier and later entrants.
Please note that we are not making any assumptions about the role of firm size, degree of
diversification and propensity to enter into collaborative relationships. These are clearly
important firms characteristics that ought to be controlled for and that might induce dynamic
patterns in the network similar to those described above. We shall discuss these issues in the
concluding section.
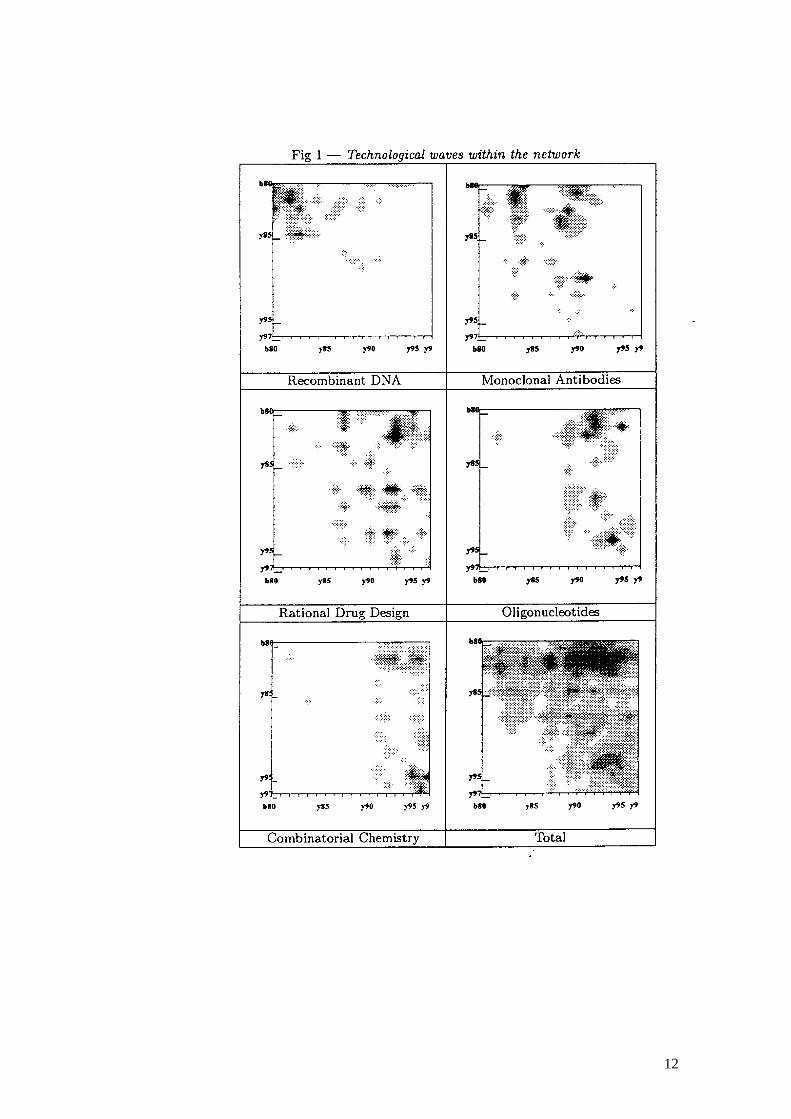
The importance of the technological determinants of the structural evolution of the
network of collaborative agreements can be appreciated, at a first glance, by looking at Figure 1.

11
Figure 1 is based on a 3D graphical representation of the network by means of level curves.
Columns correspond to the x-axis (Originators), while rows to the y-axis (Developers). Levels
z(x,y) = bij indicate the cumulated number of agreements between firms i and j, classified
according to year of entry into the network, with darker regions representing areas of higher
relational intensity.
Figure 1 shows that:
i) Originators have entered the network by introducing successive waves of new research
technologies, which shape the overall evolution of the network;
ii ) Firms already active within the network have not played a major role as Originators in
the new technological trajectories that have emerged after their entry;
iii ) Rather, earlier entrants have gained access to the new technological trajectories mainly
as Developers.
iv) As times goes by, the rate of entry in any given technological trajectory has been
slowing down. That is to say, entrants are closely linked to the generation of new technological
trajectories.
12
13
All in all, the evidence on patterns of entry, on relational roles of earlier and later entrants
(Originators/Developers) and, finally, on new technological waves, suggests the existence of a
dynamic process with the following properties. Major new technological breakthroughs initially
induce the entry of new Firms/Institutions, which act as specialized technology Originators. As
times goes by, Developers succeed in developing internal capabilities in the new fields.
Correspondingly, relational intensity, as well as flows of entry, shift forward to new
technologies and firms.
v) After 1992, the emergence of transversal technologies like combinatorial chemistry has
been perturbing the structure of the network. New entrants based on the new transversal
technologies and acting as Originators make more agreements than Developers because they
establish relations with a large variety of Firms/Institutions, irrespective of age.
4. The evolution of the industry network
This section analyzes in detail the transformations occurred in the organization of
innovative activities within the international pharmaceutical industry during the period
between 1978 and 1997.
Several graph theoretical measures are applied to investigate the evolution of the inter-
organizational R&D activity that has characterized the pharmaceutical industry after the
emergence of molecular biology.
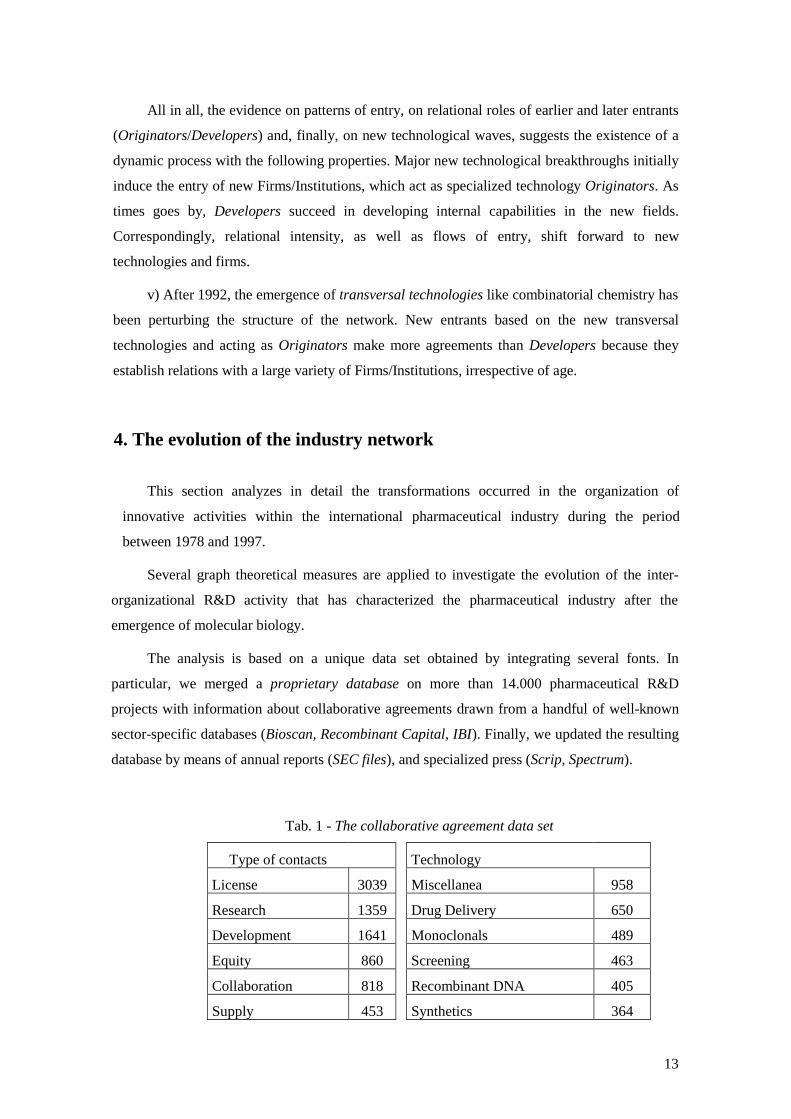
The analysis is based on a unique data set obtained by integrating several fonts. In
particular, we merged a proprietary database on more than 14.000 pharmaceutical R&D
projects with information about collaborative agreements drawn from a handful of well-known
sector-specific databases (Bioscan, Recombinant Capital, IBI). Finally, we updated the resulting
database by means of annual reports (SEC files), and specialized press (Scrip, Spectrum).
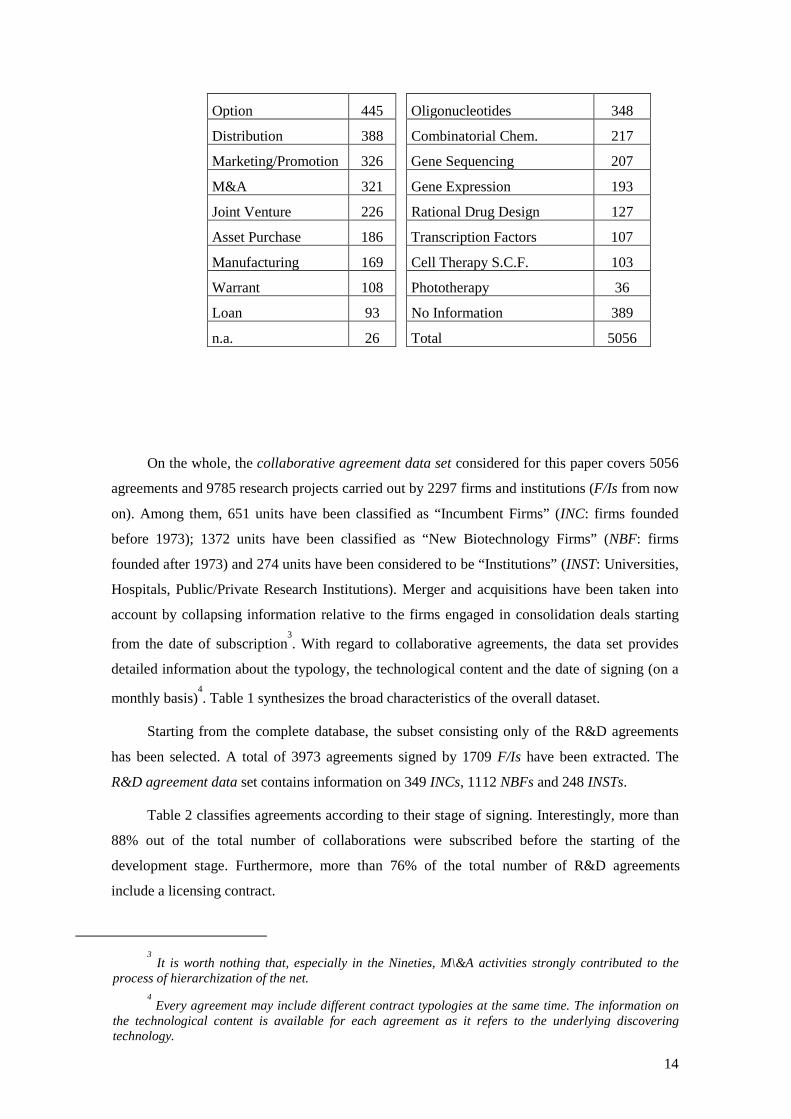
Tab. 1 - The collaborative agreement data set
Type of contacts Technology
License 3039 Miscellanea 958
Research 1359 Drug Delivery 650
Development 1641 Monoclonals 489
Equity 860 Screening 463
Collaboration 818 Recombinant DNA 405
Supply 453 Synthetics 364
14
Option 445 Oligonucleotides 348
Distribution 388 Combinatorial Chem. 217
Marketing/Promotion 326 Gene Sequencing 207
M&A 321 Gene Expression 193
Joint Venture 226 Rational Drug Design 127
Asset Purchase 186 Transcription Factors 107
Manufacturing 169 Cell Therapy S.C.F. 103
Warrant 108 Phototherapy 36
Loan 93 No Information 389
n.a. 26 Total 5056
On the whole, the collaborative agreement data set considered for this paper covers 5056
agreements and 9785 research projects carried out by 2297 firms and institutions (F/Is from now
on). Among them, 651 units have been classified as “Incumbent Firms” (INC: firms founded
before 1973); 1372 units have been classified as “New Biotechnology Firms” (NBF: firms
founded after 1973) and 274 units have been considered to be “Institutions” (INST: Universities,
Hospitals, Public/Private Research Institutions). Merger and acquisitions have been taken into
account by collapsing information relative to the firms engaged in consolidation deals starting
from the date of subscription3. With regard to collaborative agreements, the data set provides
detailed information about the typology, the technological content and the date of signing (on a
monthly basis)4. Table 1 synthesizes the broad characteristics of the overall dataset.
Starting from the complete database, the subset consisting only of the R&D agreements
has been selected. A total of 3973 agreements signed by 1709 F/Is have been extracted. The
R&D agreement data set contains information on 349 INCs, 1112 NBFs and 248 INSTs.
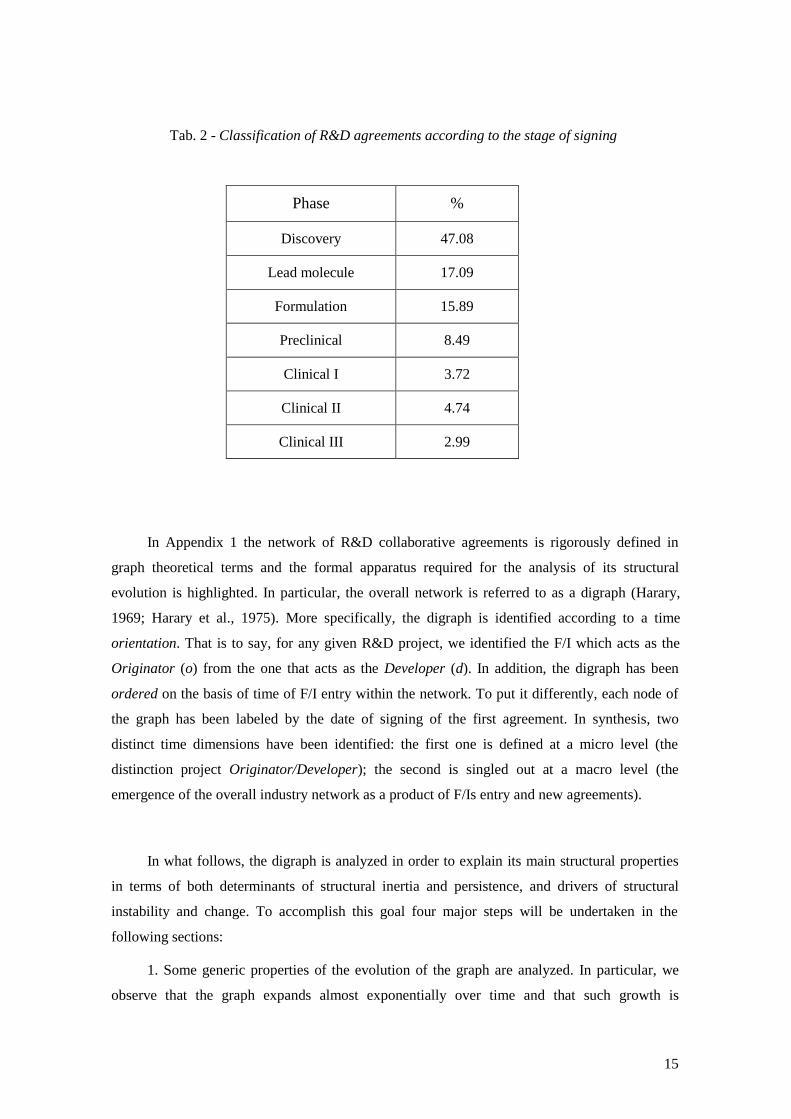
Table 2 classifies agreements according to their stage of signing. Interestingly, more than
88% out of the total number of collaborations were subscribed before the starting of the
development stage. Furthermore, more than 76% of the total number of R&D agreements
include a licensing contract.
3 It is worth nothing that, especially in the Nineties, M\&A activities strongly contributed to the
process of hierarchization of the net.4 Every agreement may include different contract typologies at the same time. The information on
the technological content is available for each agreement as it refers to the underlying discoveringtechnology.
15
Tab. 2 - Classification of R&D agreements according to the stage of signing
Phase %
Discovery 47.08
Lead molecule 17.09
Formulation 15.89
Preclinical 8.49
Clinical I 3.72
Clinical II 4.74
Clinical III 2.99
In Appendix 1 the network of R&D collaborative agreements is rigorously defined in
graph theoretical terms and the formal apparatus required for the analysis of its structural
evolution is highlighted. In particular, the overall network is referred to as a digraph (Harary,
1969; Harary et al., 1975). More specifically, the digraph is identified according to a time
orientation. That is to say, for any given R&D project, we identified the F/I which acts as the
Originator (o) from the one that acts as the Developer (d). In addition, the digraph has been
ordered on the basis of time of F/I entry within the network. To put it differently, each node of
the graph has been labeled by the date of signing of the first agreement. In synthesis, two
distinct time dimensions have been identified: the first one is defined at a micro level (the
distinction project Originator/Developer); the second is singled out at a macro level (the
emergence of the overall industry network as a product of F/Is entry and new agreements).
In what follows, the digraph is analyzed in order to explain its main structural properties
in terms of both determinants of structural inertia and persistence, and drivers of structural
instability and change. To accomplish this goal four major steps will be undertaken in the
following sections:
1. Some generic properties of the evolution of the graph are analyzed. In particular, we
observe that the graph expands almost exponentially over time and that such growth is
16
essentially driven by the entry of new firms/institutions, while the density of the graph slightly
decreases;
2. Some permanent structural properties of the digraph are identified. Despite the steady
rate of growth of the overall network, we find high levels of structural stability, both in terms of
degree of asymmetry, intransitiveness, and hierarchization. Moreover, the digraph is shown to
be “time reverse”, as time order and time orientation are inversely related.
3. The degree and sources of structural instability within the graph are investigated. As a
reference point (a sort of null hypothesis), we start hypothesizing a conservative process being
in place. At any point in time, such an inertial process would reproduce the same invariant
structural properties. If such a process captured the dynamics of the network, one would observe
a smooth structural change, despite the intense growth of the network. In particular, given that
the growth of the network is driven by flows of entry, structural inertia would be the effect of a
cumulative, incremental technological dynamics. Moreover, given the time reversal
phenomenon we mentioned above, it would be possible to locate the source of structural
stability at the level of the process driving the entry of new Originators.
However, the empirical analysis carried out in order to test the structural inertia
hypothesis has revealed two major sources of departure from such a conservative process. On
the one hand, a strong first mover advantage is observed for firms that entered the network
before 1981. On the other hand, some important destructuring patterns are identified for the
years following the peak of entry of 1992.
4. The departures from the structural inertia hypothesis are examined using the notion of
Canonical Decomposition of a bipartite graph (Dulmage Mendelsohn, 1958; 1959), which
allows us to categorize F/Is according to the role they play in the dynamics of the network.
Specifically we identify two groups of subjects; that is, a group of F/Is which interact locally
with given types of partners, and another group whose interactions are de-localized, i.e. are not
restricted to a particular category of partners. What is even more interesting, is that F/Is
belonging to any one of these two categories are immediately identifiable by the nature of the
competencies they embody. The formers are active in those technological sub-fields that are
recognized to be co-specialized, while the others are active in transversal technologies.
In synthesis, our empirical analysis reveals that major changes in the network structure
take place in correspondence with major shifts occurring at the level of the underlying scientific
and technological bases.
In order to properly identify that relationships, we have built an original formal apparatus
for the representation of the structural evolution of a network of interacting economic agents.
17
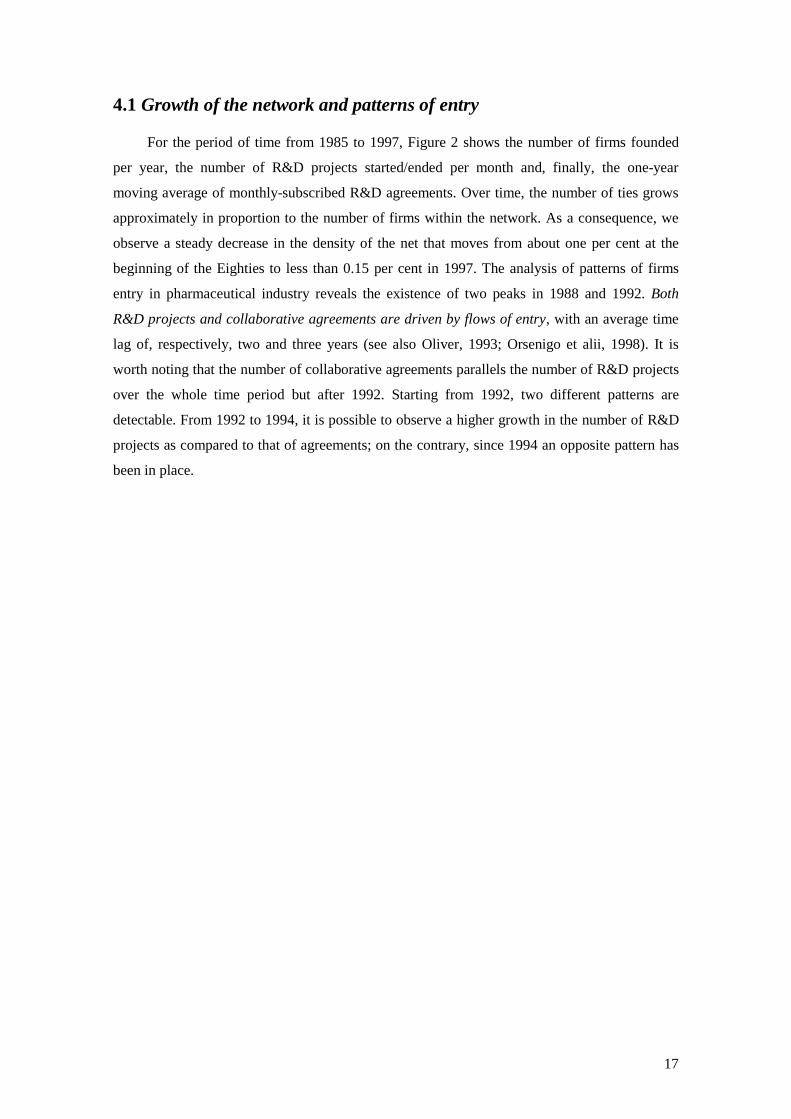
4.1 Growth of the network and patterns of entry
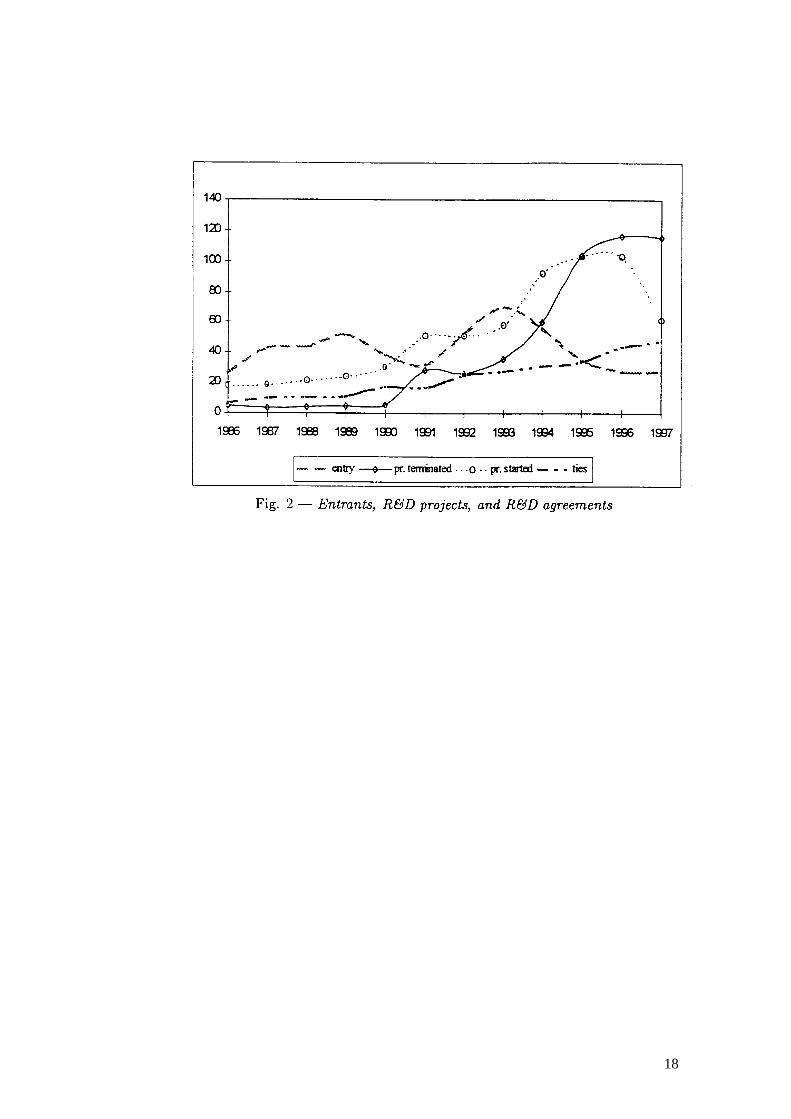
For the period of time from 1985 to 1997, Figure 2 shows the number of firms founded
per year, the number of R&D projects started/ended per month and, finally, the one-year
moving average of monthly-subscribed R&D agreements. Over time, the number of ties grows
approximately in proportion to the number of firms within the network. As a consequence, we
observe a steady decrease in the density of the net that moves from about one per cent at the
beginning of the Eighties to less than 0.15 per cent in 1997. The analysis of patterns of firms
entry in pharmaceutical industry reveals the existence of two peaks in 1988 and 1992. Both
R&D projects and collaborative agreements are driven by flows of entry, with an average time
lag of, respectively, two and three years (see also Oliver, 1993; Orsenigo et alii, 1998). It is
worth noting that the number of collaborative agreements parallels the number of R&D projects
over the whole time period but after 1992. Starting from 1992, two different patterns are
detectable. From 1992 to 1994, it is possible to observe a higher growth in the number of R&D
projects as compared to that of agreements; on the contrary, since 1994 an opposite pattern has
been in place.
18

19
4.2 Structural properties of the graph
The network of agreements at time t is represented as a digraph Gt(E,V), whose vertices V
and edges E consist, respectively, of F/Is active in pharmaceutical research and development (V)
and of R&D formal collaborations among them (E) drawn up by time t .The digraph Gt can be
univocally represented by an adjacency matrix Gt � A(G)t= [ado] t. Matrix entry ado is equal to 1
if an edge e(d,o) does exist at time t, while ado is equal to 0 otherwise. Matrix rows consist of all
the vertices Vd (Developers), while matrix columns consist of all the vertices Vo (Originators).
Thus, rows and columns vectors define, respectively, the sets of projects for which each F/I has
acted respectively as an Originator and a Developer until time t.
dDegree(i,t) and oDegree(i,t) of vertex i at time t are given by the sums of matrix entries
over row and column i. The total Degree(i,t) equals the sum of dDegree and oDegree.
As mentioned already, the set of vertices can be ordered according to time of entry into
the network. Consequently, it is possible to permute the adjacency matrix in order to obtain a
matrix A(G)�t = [ado]�t, where d�{ 1,…,n, o�{ 1,...,m, with {�(1) �…� � (d) �…� � (n) � t, and
{ � (1) �…� �(o)�…� �(m) � t, where � is the month of entry into the network.
Afterwards, it is possible to pass from A(G)�t to A(G)�(t+1) by adding rows and columns
corresponding to F/Is entering the network at time (t+1) and updating the entries of the new
matrix according to latest agreements.
Sometimes, we shall use a more concise representation of the digraph structure at time t,
by considering the block matrix B(G)�t��� obtained by collapsing rows and columns of matrix
A(G)�t that correspond to F/Is belonging to a common cohort of entrants defined by the time
period � =�t, t+� ) (Generation). Entries bij of B(G)�t��� indicate the total number of agreements
between Generations i (Developers) and j (Originators) at time t (see Table 3).
The analysis of the structural properties of the digraph has led to the following results:
A - The digraph is asymmetric
For almost all relationships e(d,o), �(d) � �(o) i.e., the Originator usually entered the
network after the Developer does. Early entrants act mostly as Developers. Moreover, earlier
generations of Developers establish a large number of agreements with a large number of later
entrants, which act as Originators.

20
Data presented in Table 3 show that a large number of R&D agreements are associated
with projects started by both younger firms and research institutions and developed by older
firms. In other words, the graph is characterized by a strong prevalence of inter-generation
agreements over intra-generation agreements.
Tab.3- Intergeneration and intrageneration R&D agreements.
O
ICN NBF1 NBF2 NBF3 NBF4 INST
ICN 203 387 722 434 218 32
NBF1 12 23 55 25 14 17
D NBF2 18 22 77 40 42 309
NBF3 13 10 41 38 35 246
NBF4 8 6 27 22 32 94
INST 1 4 7 3 5 8
INC= Firms founded before 1973
NBF1= Firms founded between 1973 and 1981
NBF2= Firms founded between 1982 and 1986
NBF3= Firms founded between 1987 and 1991
NBF4= Firms founded after 1992
INST= Research Institutions
This result is confirmed by two tests carried out on block matrix B(G)�t���, according to
different values of �.
The first one is the Conditional Symmetry Model (McCullagh, 1978; Everitt, 1977)
applied to the ordered data matrices. According to the model, the null hypothesis is:
H0: P(bij)=P(bji) for i<j
21
that is to say P(bij), the probability of observing a given number of agreements between a
generation i of Developers and j of Originators is equal to P(bji ), i.e. there is no structural bias
leading younger/older F/I to be more frequently Originators/Developers.
Within the model, the ratio between the frequency of values above and below the main
diagonal is set constant and equal to �:
�=Fij /Fji , i<j.
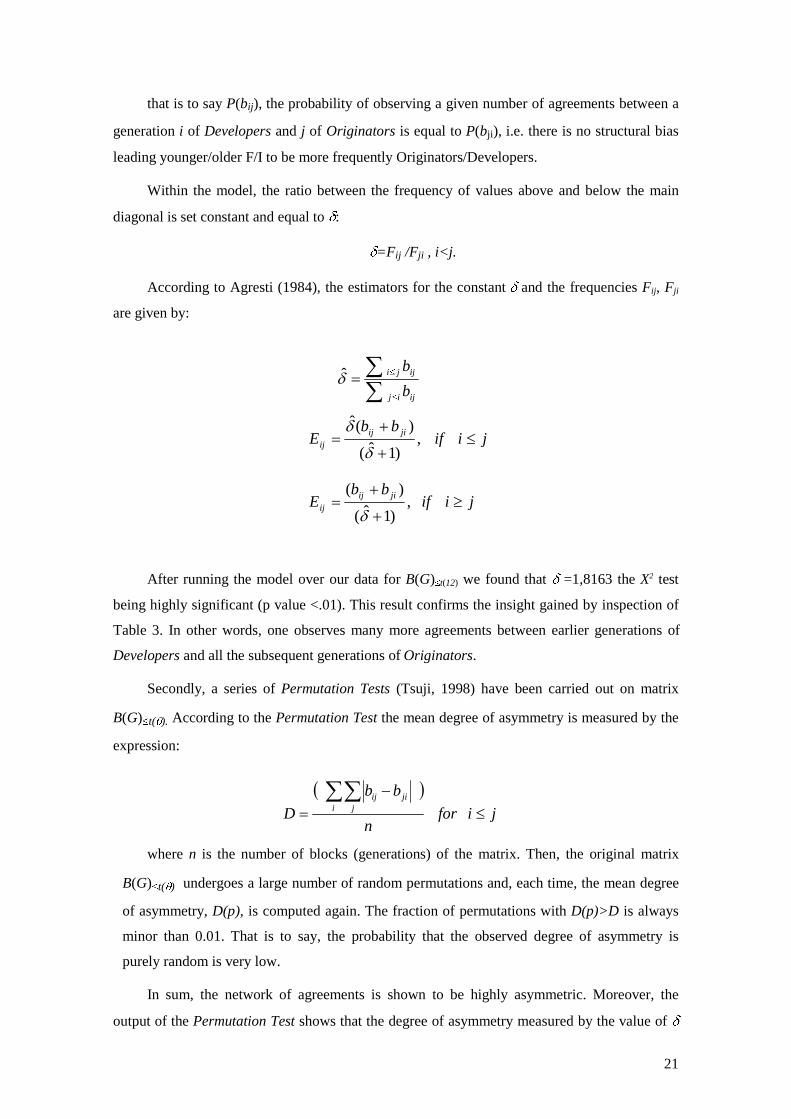
According to Agresti (1984), the estimators for the constant � and the frequencies Fij, Fji
are given by:
After running the model over our data for B(G)�t(12) we found that � =1,8163 the X2 test
being highly significant (p value <.01). This result confirms the insight gained by inspection of
Table 3. In other words, one observes many more agreements between earlier generations of
Developers and all the subsequent generations of Originators.
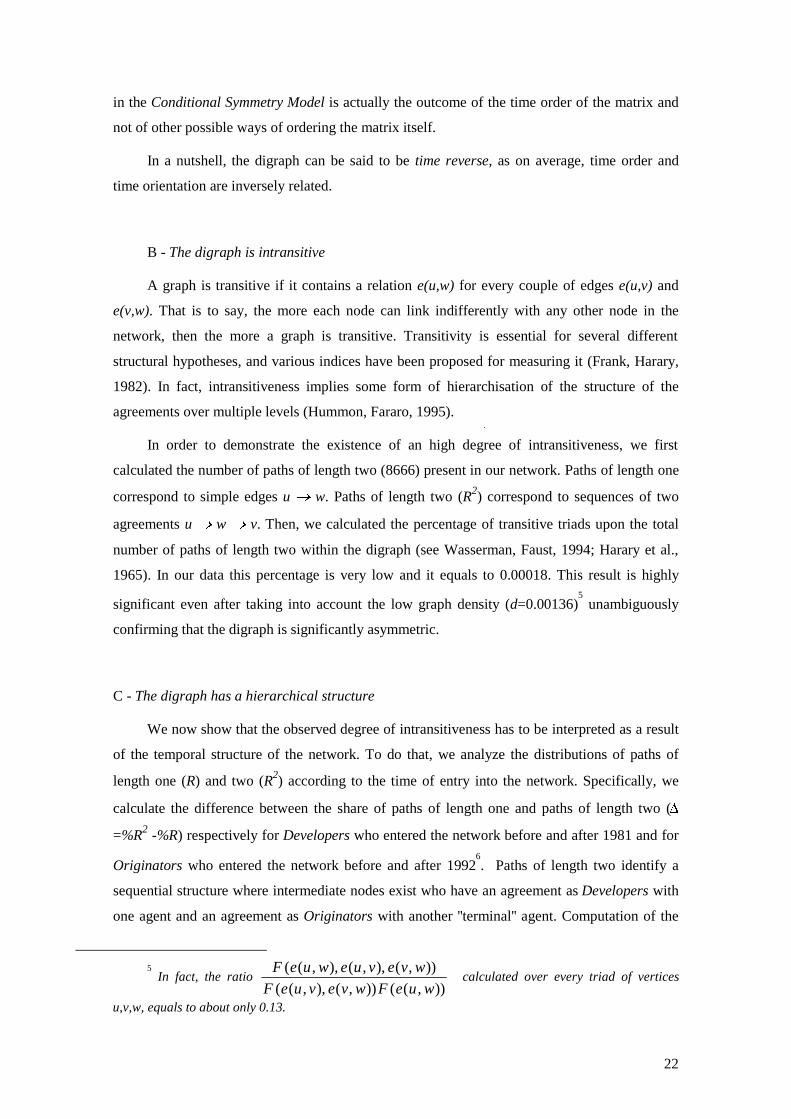
Secondly, a series of Permutation Tests (Tsuji, 1998) have been carried out on matrix
B(G)�t(�). According to the Permutation Test the mean degree of asymmetry is measured by the
expression:
where n is the number of blocks (generations) of the matrix. Then, the original matrix
B(G)�t(�) undergoes a large number of random permutations and, each time, the mean degree
of asymmetry, D(p), is computed again. The fraction of permutations with D(p)>D is always
minor than 0.01. That is to say, the probability that the observed degree of asymmetry is
purely random is very low.
In sum, the network of agreements is shown to be highly asymmetric. Moreover, the
output of the Permutation Test shows that the degree of asymmetry measured by the value of �
��
�
��
ijij
ijji
b
b�̂
jiifbb
E jiijij �
�
�� ,
)1ˆ(
)(ˆ
�
�
jiifbb
E jiijij �
�
�� ,
)1ˆ(
)(
�
� �jifor
n
bb
D i jjiij
�
�
���
22
in the Conditional Symmetry Model is actually the outcome of the time order of the matrix and
not of other possible ways of ordering the matrix itself.
In a nutshell, the digraph can be said to be time reverse, as on average, time order and
time orientation are inversely related.
B - The digraph is intransitive
A graph is transitive if it contains a relation e(u,w) for every couple of edges e(u,v) and
e(v,w). That is to say, the more each node can link indifferently with any other node in the
network, then the more a graph is transitive. Transitivity is essential for several different
structural hypotheses, and various indices have been proposed for measuring it (Frank, Harary,
1982). In fact, intransitiveness implies some form of hierarchisation of the structure of the
agreements over multiple levels (Hummon, Fararo, 1995).
In order to demonstrate the existence of an high degree of intransitiveness, we first
calculated the number of paths of length two (8666) present in our network. Paths of length one
correspond to simple edges u � w. Paths of length two (R2) correspond to sequences of two
agreements u � w � v. Then, we calculated the percentage of transitive triads upon the total
number of paths of length two within the digraph (see Wasserman, Faust, 1994; Harary et al.,
1965). In our data this percentage is very low and it equals to 0.00018. This result is highly
significant even after taking into account the low graph density (d=0.00136)5 unambiguously
confirming that the digraph is significantly asymmetric.
C - The digraph has a hierarchical structure
We now show that the observed degree of intransitiveness has to be interpreted as a result
of the temporal structure of the network. To do that, we analyze the distributions of paths of
length one (R) and two (R2) according to the time of entry into the network. Specifically, we
calculate the difference between the share of paths of length one and paths of length two (�
=%R2 -%R) respectively for Developers who entered the network before and after 1981 and for
Originators who entered the network before and after 19926. Paths of length two identify a
sequential structure where intermediate nodes exist who have an agreement as Developers with
one agent and an agreement as Originators with another ''terminal'' agent. Computation of the
5 In fact, the ratio
)),(()),(),,((
)),(),,(),,((
wueFwvevueF
wvevuewueF calculated over every triad of vertices
u,v,w, equals to about only 0.13.
23
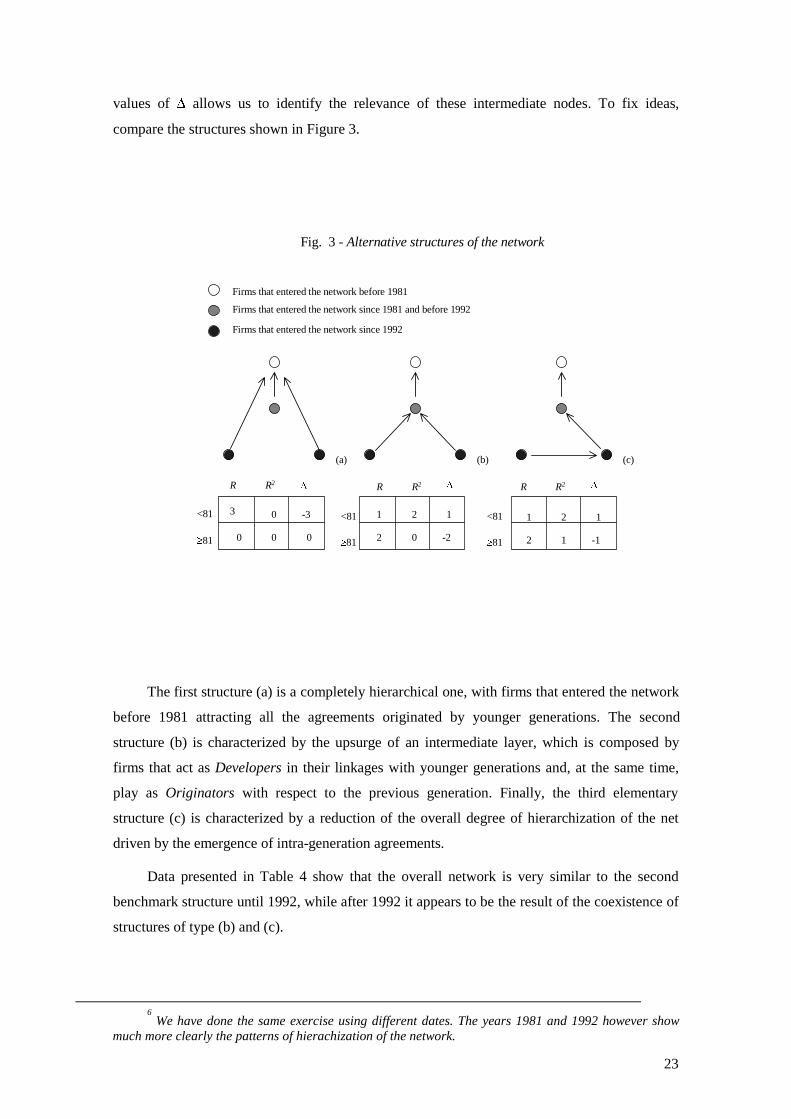
values of � allows us to identify the relevance of these intermediate nodes. To fix ideas,
compare the structures shown in Figure 3.
Firms that entered the network before 1981
Firms that entered the network since 1981 and before 1992
(a) (b)
<81
�81
<81 <81
�81
R RR2 R2� �
3
0
0
0
-3
0
1
2 0
2 1
-2
Firms that entered the network since 1992
R R2
1 2 1
2 1 -1�81
�
(c)
Fig. 3 - Alternative structures of the network
The first structure (a) is a completely hierarchical one, with firms that entered the network
before 1981 attracting all the agreements originated by younger generations. The second
structure (b) is characterized by the upsurge of an intermediate layer, which is composed by
firms that act as Developers in their linkages with younger generations and, at the same time,
play as Originators with respect to the previous generation. Finally, the third elementary
structure (c) is characterized by a reduction of the overall degree of hierarchization of the net
driven by the emergence of intra-generation agreements.
Data presented in Table 4 show that the overall network is very similar to the second
benchmark structure until 1992, while after 1992 it appears to be the result of the coexistence of
structures of type (b) and (c).
6 We have done the same exercise using different dates. The years 1981 and 1992 however show
much more clearly the patterns of hierachization of the network.
24
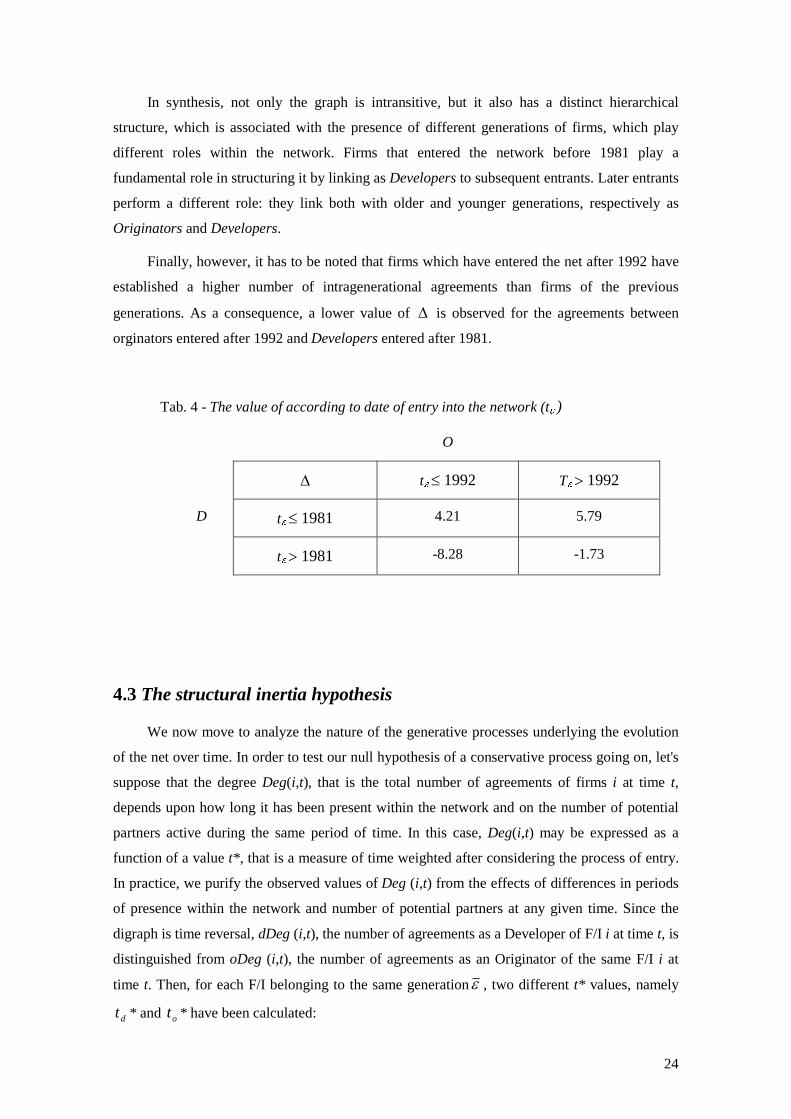
In synthesis, not only the graph is intransitive, but it also has a distinct hierarchical
structure, which is associated with the presence of different generations of firms, which play
different roles within the network. Firms that entered the network before 1981 play a
fundamental role in structuring it by linking as Developers to subsequent entrants. Later entrants
perform a different role: they link both with older and younger generations, respectively as
Originators and Developers.
Finally, however, it has to be noted that firms which have entered the net after 1992 have
established a higher number of intragenerational agreements than firms of the previous
generations. As a consequence, a lower value of � is observed for the agreements between
orginators entered after 1992 and Developers entered after 1981.
Tab. 4 - The value of according to date of entry into the network (t� )
O
� t� � 1992 T� � 1992
D t� � 1981 4.21 5.79
t� � 1981 -8.28 -1.73
4.3 The structural inertia hypothesis
We now move to analyze the nature of the generative processes underlying the evolution
of the net over time. In order to test our null hypothesis of a conservative process going on, let's
suppose that the degree Deg(i,t), that is the total number of agreements of firms i at time t,
depends upon how long it has been present within the network and on the number of potential
partners active during the same period of time. In this case, Deg(i,t) may be expressed as a
function of a value t* , that is a measure of time weighted after considering the process of entry.
In practice, we purify the observed values of Deg (i,t) from the effects of differences in periods
of presence within the network and number of potential partners at any given time. Since the
digraph is time reversal, dDeg (i,t), the number of agreements as a Developer of F/I i at time t, is
distinguished from oDeg (i,t), the number of agreements as an Originator of the same F/I i at
time t. Then, for each F/I belonging to the same generation� , two different t* values, namely
dt * and ot * have been calculated:

25
;)(* ��
���
�
�
tod tnt
.)(1
* ��
���
�
tdo tnt
where )( tn o �� and )( tn v �� are respectively the number of firms entering the network
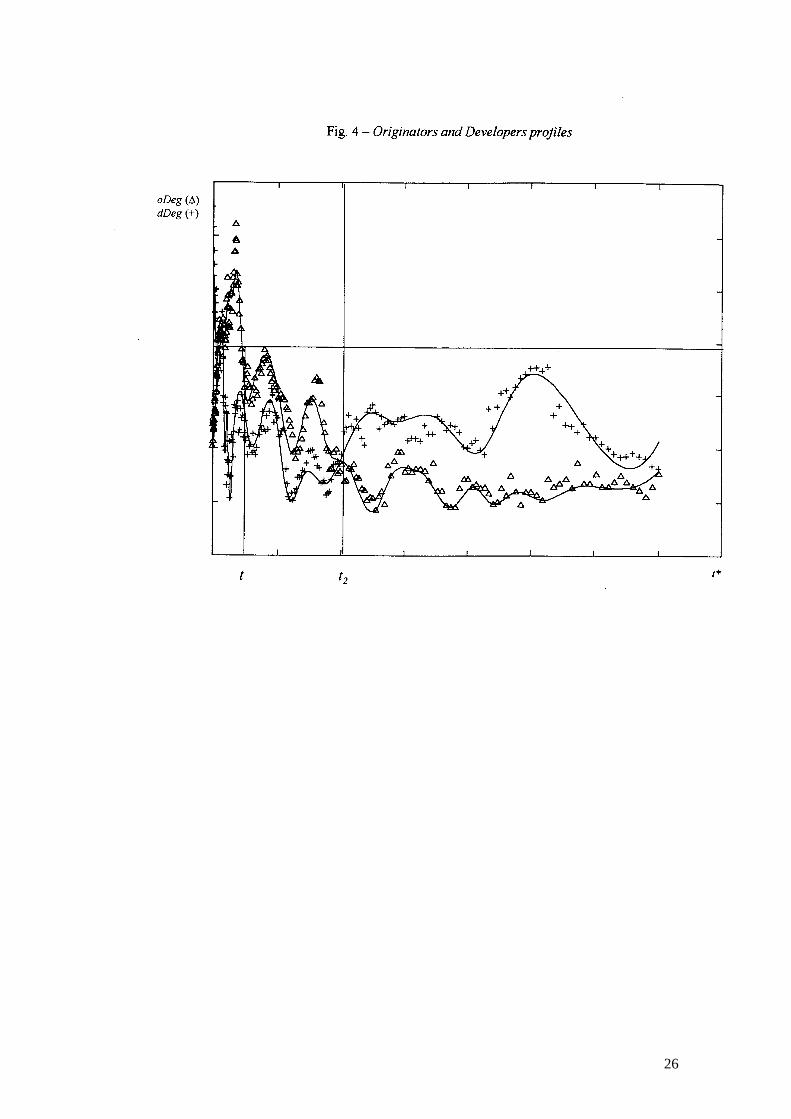
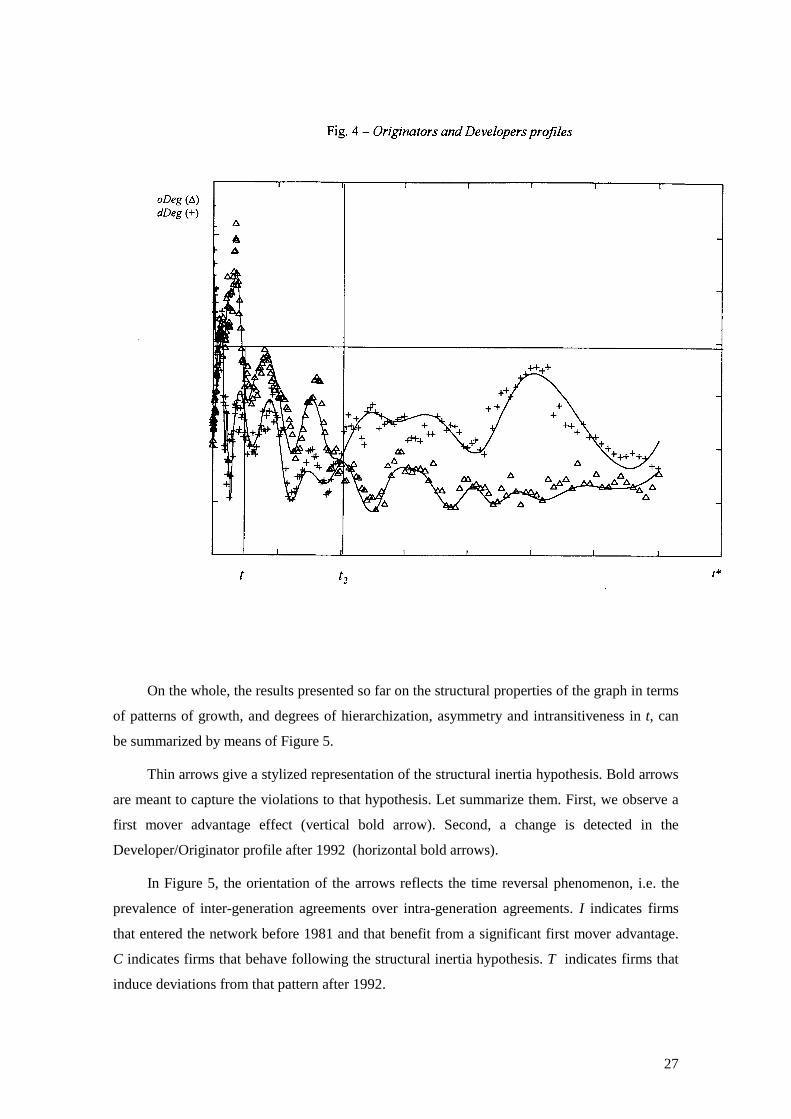
as Originators and Developers at time t and � is the last period of observation. In Figure 4,
dDeg( *, dt� ) the degrees of Developers which entered the network during the same month� are
plotted as crosses, while the degrees of Originators oDeg( *, ot� ) are plotted as triangles.
The analysis of dDeg( *, dt� ) and oDeg( *, ot� ) indicates two major deviations from the
structural inertia hypothesis:
i) Since Deg( *,t� )>Deg( *,~ t� ) for � <1981��~ , a persistent first mover advantage effect
is present ;
ii) Since dDeg( *, dt� )>oDeg( *, ot� ) for � >1992, an inversion of the Developer/Originator
profile can be detected after 1992.
That is to say, after controlling both for differences in time horizons and in the number of
F/Is active inside the network in any period of time, earlier entrants tend to establish a larger
number of agreements than later ones. Notably, the first mover advantage effect is stronger than
it would have been under the conservative process hypothesis. Besides, firms which entered the
net after 1992 established more agreements as Developers than expected according to the
hypothesis of a conservative growth process being in place.
26
27
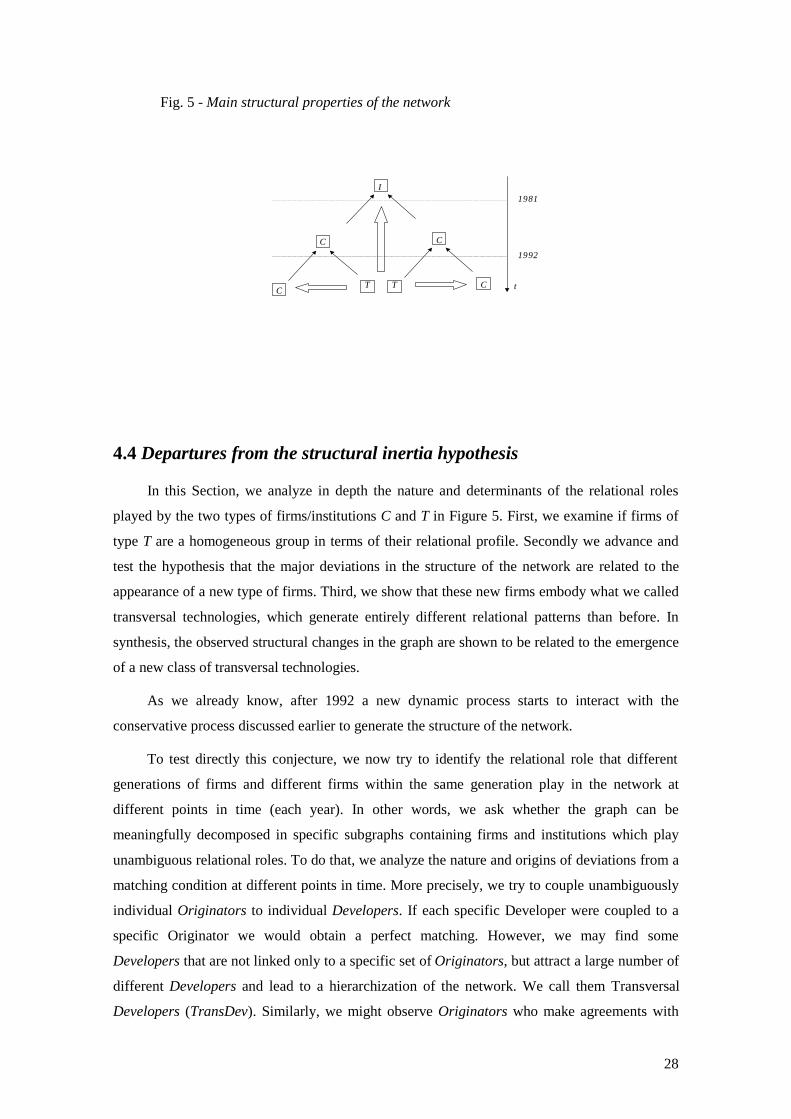
On the whole, the results presented so far on the structural properties of the graph in terms
of patterns of growth, and degrees of hierarchization, asymmetry and intransitiveness in t, can
be summarized by means of Figure 5.
Thin arrows give a stylized representation of the structural inertia hypothesis. Bold arrows
are meant to capture the violations to that hypothesis. Let summarize them. First, we observe a
first mover advantage effect (vertical bold arrow). Second, a change is detected in the
Developer/Originator profile after 1992 (horizontal bold arrows).
In Figure 5, the orientation of the arrows reflects the time reversal phenomenon, i.e. the
prevalence of inter-generation agreements over intra-generation agreements. I indicates firms
that entered the network before 1981 and that benefit from a significant first mover advantage.
C indicates firms that behave following the structural inertia hypothesis. T indicates firms that
induce deviations from that pattern after 1992.
28
Fig. 5 - Main structural properties of the network
I
t
C C
T TC
C
1981
1992
4.4 Departures from the structural inertia hypothesis
In this Section, we analyze in depth the nature and determinants of the relational roles
played by the two types of firms/institutions C and T in Figure 5. First, we examine if firms of
type T are a homogeneous group in terms of their relational profile. Secondly we advance and
test the hypothesis that the major deviations in the structure of the network are related to the
appearance of a new type of firms. Third, we show that these new firms embody what we called
transversal technologies, which generate entirely different relational patterns than before. In
synthesis, the observed structural changes in the graph are shown to be related to the emergence
of a new class of transversal technologies.
As we already know, after 1992 a new dynamic process starts to interact with the
conservative process discussed earlier to generate the structure of the network.
To test directly this conjecture, we now try to identify the relational role that different
generations of firms and different firms within the same generation play in the network at
different points in time (each year). In other words, we ask whether the graph can be
meaningfully decomposed in specific subgraphs containing firms and institutions which play
unambiguous relational roles. To do that, we analyze the nature and origins of deviations from a
matching condition at different points in time. More precisely, we try to couple unambiguously
individual Originators to individual Developers. If each specific Developer were coupled to a
specific Originator we would obtain a perfect matching. However, we may find some
Developers that are not linked only to a specific set of Originators, but attract a large number of
different Developers and lead to a hierarchization of the network. We call them Transversal
Developers (TransDev). Similarly, we might observe Originators who make agreements with
29
different agents. This would be the case of what we may call Transversal Originators
(TransOr).
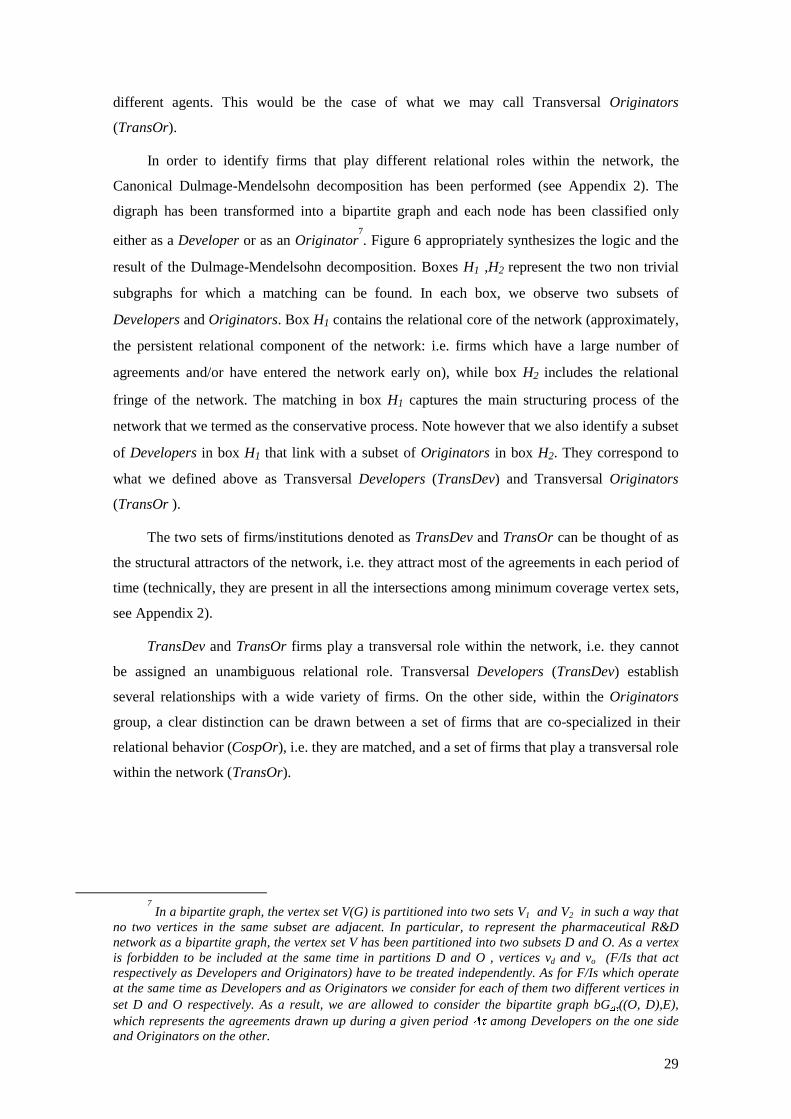
In order to identify firms that play different relational roles within the network, the
Canonical Dulmage-Mendelsohn decomposition has been performed (see Appendix 2). The
digraph has been transformed into a bipartite graph and each node has been classified only
either as a Developer or as an Originator7. Figure 6 appropriately synthesizes the logic and the
result of the Dulmage-Mendelsohn decomposition. Boxes H1 ,H2 represent the two non trivial
subgraphs for which a matching can be found. In each box, we observe two subsets of
Developers and Originators. Box H1 contains the relational core of the network (approximately,
the persistent relational component of the network: i.e. firms which have a large number of
agreements and/or have entered the network early on), while box H2 includes the relational
fringe of the network. The matching in box H1 captures the main structuring process of the
network that we termed as the conservative process. Note however that we also identify a subset
of Developers in box H1 that link with a subset of Originators in box H2. They correspond to
what we defined above as Transversal Developers (TransDev) and Transversal Originators
(TransOr ).
The two sets of firms/institutions denoted as TransDev and TransOr can be thought of as
the structural attractors of the network, i.e. they attract most of the agreements in each period of
time (technically, they are present in all the intersections among minimum coverage vertex sets,
see Appendix 2).
TransDev and TransOr firms play a transversal role within the network, i.e. they cannot
be assigned an unambiguous relational role. Transversal Developers (TransDev) establish
several relationships with a wide variety of firms. On the other side, within the Originators
group, a clear distinction can be drawn between a set of firms that are co-specialized in their
relational behavior (CospOr), i.e. they are matched, and a set of firms that play a transversal role
within the network (TransOr).
7 In a bipartite graph, the vertex set V(G) is partitioned into two sets V1 and V2 in such a way that
no two vertices in the same subset are adjacent. In particular, to represent the pharmaceutical R&Dnetwork as a bipartite graph, the vertex set V has been partitioned into two subsets D and O. As a vertexis forbidden to be included at the same time in partitions D and O , vertices vd and vo (F/Is that actrespectively as Developers and Originators) have to be treated independently. As for F/Is which operateat the same time as Developers and as Originators we consider for each of them two different vertices inset D and O respectively. As a result, we are allowed to consider the bipartite graph bG��((O, D),E),which represents the agreements drawn up during a given period �� among Developers on the one sideand Originators on the other.
30
Fig. 6 - Transversal and Co-specialized nodes within the graph
H1 H2
CospDev TransDev
CospOr TransOr CospOr
CospDev
Core Fringe
These results confirm that different kinds of relationships are present into the graph and
hence that a conservative process cannot represent its whole structural evolution.
It is now possible to demonstrate that the relational roles that have been identified
correspond to firms embodying different types of technologies.and that the changes over time in
such roles correspond to the emergence of a new set of technologies, i.e. transversal
technologies.
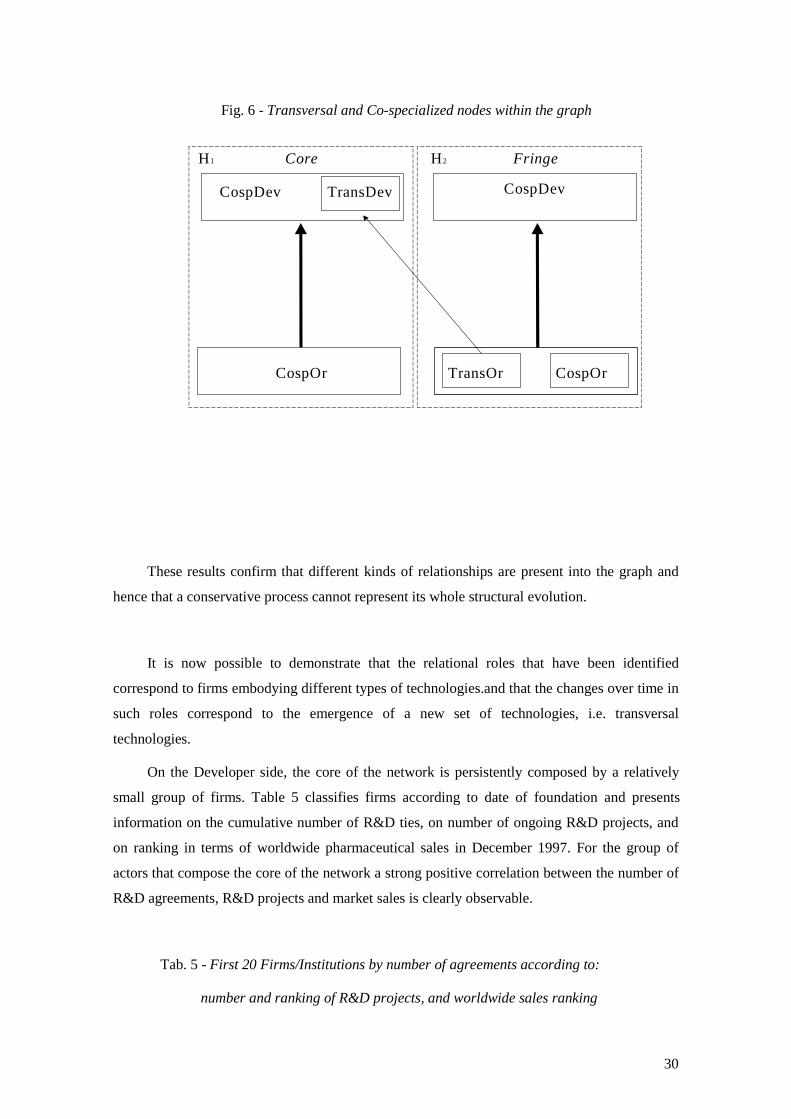
On the Developer side, the core of the network is persistently composed by a relatively
small group of firms. Table 5 classifies firms according to date of foundation and presents
information on the cumulative number of R&D ties, on number of ongoing R&D projects, and
on ranking in terms of worldwide pharmaceutical sales in December 1997. For the group of
actors that compose the core of the network a strong positive correlation between the number of
R&D agreements, R&D projects and market sales is clearly observable.
Tab. 5 - First 20 Firms/Institutions by number of agreements according to:
number and ranking of R&D projects, and worldwide sales ranking

31
Netw
ork Ranking
# Ties Firms & Institutions R&D
Projects
Sales
rank
1 145 Novartis 224(2) I3
2 141 Hoffmann - LaRoche 112(12) I6
3 88 Smith Kline 152(7) I9
4 81 Merck&Co 207(4) I2
5 77 Bristol - Myers Squibb 209(3) I4
6 74 American Home Products 124(10) I8
7 69 Lilly 138(8) I12
8 62 Abbott 93(13) I18
9 60 Pfizer 77(19) I7
10 52 Schering - Plough 113(11) I15
11 51 Pharmacia & UpJohn 174(6) I11
12 46 Glaxo Wellcome 204(5) I1
13 45 Centocor 22(101) NBF
14 43 Genentech 45(33) NBF
15 41 Incyte 10(257) NBF
16 40 Bayer 44(35) I16
17 39 Parke - Davis 88(16) I
18 37 Genetics Institute 19(123) NBF
19 36 NIH 131(9) P
20 34 Chiron 64(24) NBF
As shown in Table 6, the set of firms playing a TransDev role is composed by the very
same highly stable group of large R&D intensive pharmaceutical firms that entered the network
early on and that have been playing a role of structural attractors during the whole history of

32
bio-pharmaceutical industry. Moreover, those firms that started to act as TransDev since the
beginning of the Nineties were already part of the core of the network in the previous years.
Tab. 6 - First 15 firms active as TransDev, 1981-1997
TransDev Firms Number of years
Hoffmann-La Roche* 7
Glaxo Wellcome* 6
Smith Kline* 6
Abbott* 5
Bayer* 4
Bristol - Myers Squibb* 4
Merck & Co.* 4
Pfizer* 4
Schering - Plough* 4
Ciba - Geigy/Novartis* 4
DuPont* 3
Hoechst Marion Roussel 3
Lilly* 3
Sandoz/Novartis* 3
Wyeth - Ayerst* 3
(*) Firms that were Cosp Dev before 1992
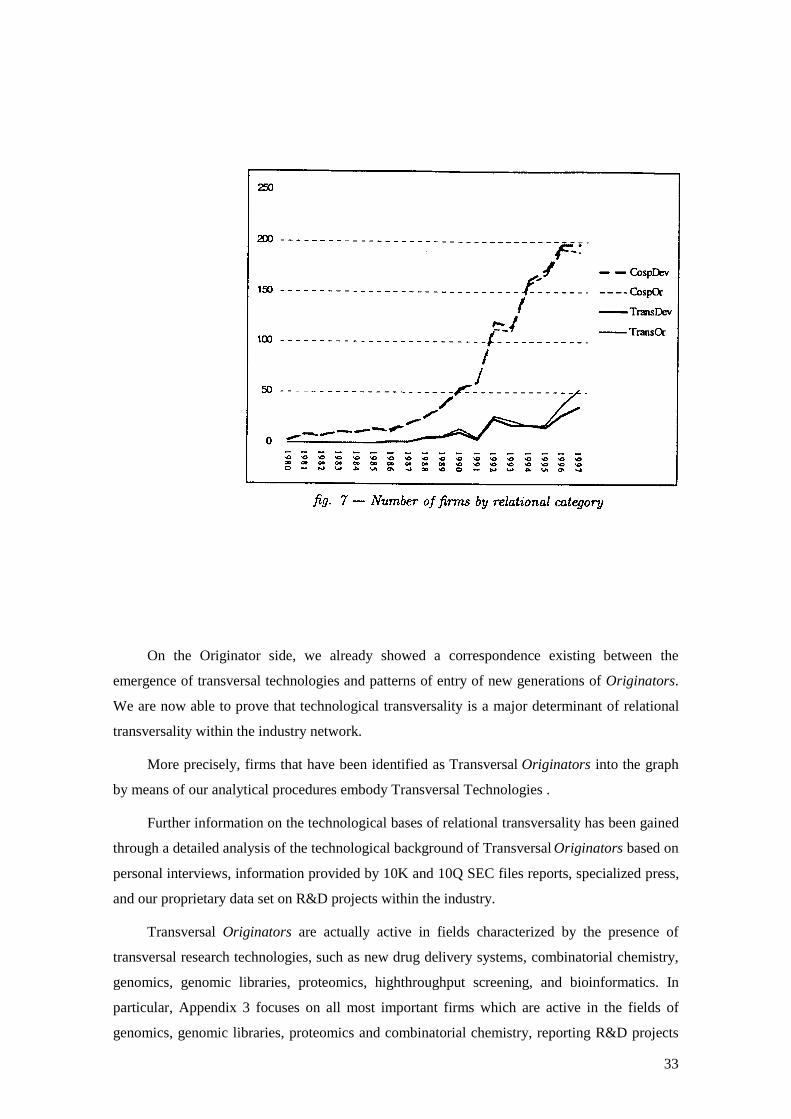
Figure 7 plots the moving average of the number of firms classified according to relational
categories in terms of co-specialization/transversality. It shows that a set of firms playing a
transversal role within the network has taken off after 1992. At the same time, throughout the
whole time period under observation, the number of firms that have been acting within the
network as CospOr steadily increase. Correspondingly, from 1992 to 1997 the network has been
characterized by the coexistence of both CospOr and TransOr firms.
33
On the Originator side, we already showed a correspondence existing between the
emergence of transversal technologies and patterns of entry of new generations of Originators.
We are now able to prove that technological transversality is a major determinant of relational
transversality within the industry network.
More precisely, firms that have been identified as Transversal Originators into the graph
by means of our analytical procedures embody Transversal Technologies .
Further information on the technological bases of relational transversality has been gained
through a detailed analysis of the technological background of Transversal Originators based on
personal interviews, information provided by 10K and 10Q SEC files reports, specialized press,
and our proprietary data set on R&D projects within the industry.
Transversal Originators are actually active in fields characterized by the presence of
transversal research technologies, such as new drug delivery systems, combinatorial chemistry,
genomics, genomic libraries, proteomics, highthroughput screening, and bioinformatics. In
particular, Appendix 3 focuses on all most important firms which are active in the fields of
genomics, genomic libraries, proteomics and combinatorial chemistry, reporting R&D projects
34
and agreements in the selected technological areas. Almost all the firms which were included in
our R&D agreements data base have been categorized as Transversal Originators .
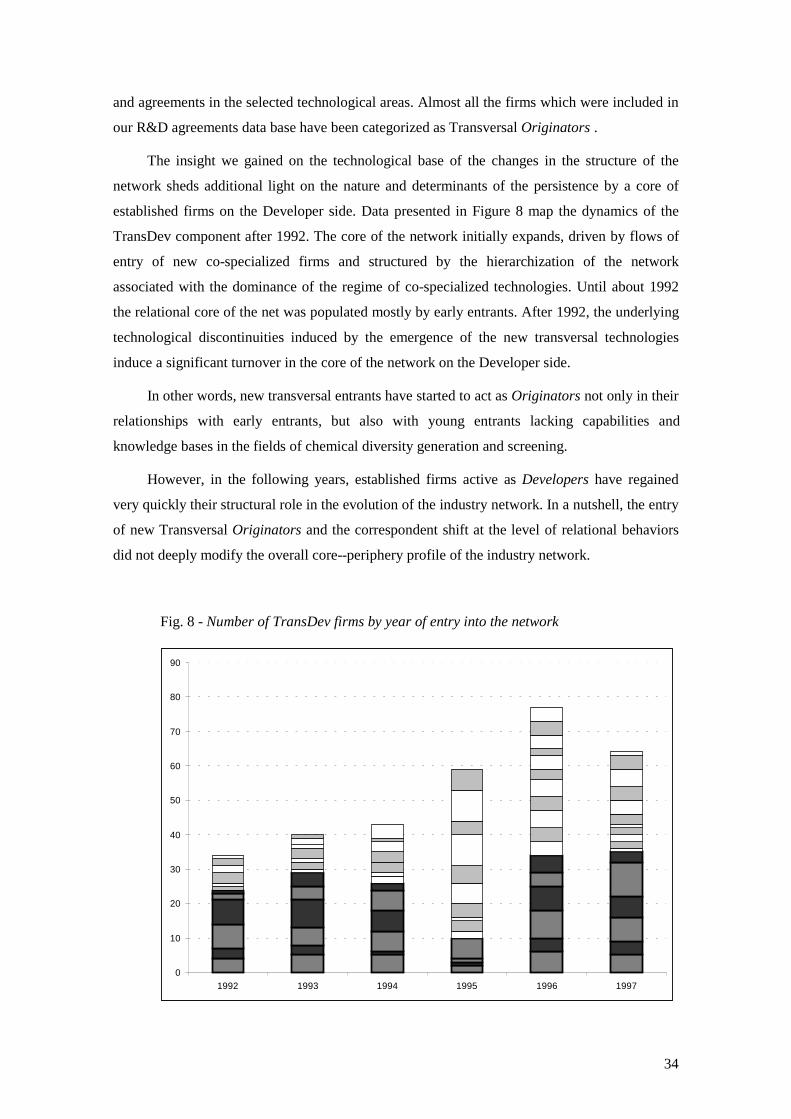
The insight we gained on the technological base of the changes in the structure of the
network sheds additional light on the nature and determinants of the persistence by a core of
established firms on the Developer side. Data presented in Figure 8 map the dynamics of the
TransDev component after 1992. The core of the network initially expands, driven by flows of
entry of new co-specialized firms and structured by the hierarchization of the network
associated with the dominance of the regime of co-specialized technologies. Until about 1992
the relational core of the net was populated mostly by early entrants. After 1992, the underlying
technological discontinuities induced by the emergence of the new transversal technologies
induce a significant turnover in the core of the network on the Developer side.
In other words, new transversal entrants have started to act as Originators not only in their
relationships with early entrants, but also with young entrants lacking capabilities and
knowledge bases in the fields of chemical diversity generation and screening.
However, in the following years, established firms active as Developers have regained
very quickly their structural role in the evolution of the industry network. In a nutshell, the entry
of new Transversal Originators and the correspondent shift at the level of relational behaviors
did not deeply modify the overall core--periphery profile of the industry network.
Fig. 8 - Number of TransDev firms by year of entry into the network
0
10
20
30
40
50
60
70
80
90
1992 1993 1994 1995 1996 1997
35
5. Concluding discussion
In this paper we have analyzed the structural evolution of the network of collaborative
agreements in pharmaceutical R&D in the last twenty years. Our results reveal that some
fundamental properties of the processes of growth of relevant knowledge bases are preserved in
the structural evolution of the net.
Specifically, both the growth of knowledge and the structural evolution of the network
have been characterized by fast expansion, proliferation of research trajectories and techniques,
and hierarchization. The cumulative nature of such processes has been imposing different
degrees of structural stability at different levels of the hierarchy. Finally, major changes in the
network structure have occurred in correspondence with the emergence of a new set of
transversal technologies.
We think that our results, while specific to the pharmaceutical industry, might bear
interesting implications for a variety of both empirical and conceptual issues.
First, our findings may contribute to the broad debate on the nature and motivations of the
network of alliances. Secondly, they can contribute to the analysis of the relationships between
science and technology, public research and industrial R&D and the like. More generally, they
may have some implications for theories which aim at explaining the forms of organization of
innovative activities, patterns of division of labour and industrial dynamics, particularly those
which emphasize the relevance of the notions of competencies, and dynamics capabilities of
firms.
In extreme synthesis, the main conclusion of this paper might be that the specific nature of
technology and related learning processes matters in shaping (or, at least, in defining some
boundaries to the possible) organizational forms of R&D, patterns of division of labour and
industrial dynamics.
In our view, the formation and subsequent evolution of the network of R&D alliances can
be interpreted primarily as an adaptive response to the emergence of a radically new knowledge
base within the industry, that is molecular biology. Scientific progress, however, did not only
simplify the search space by providing more general theories. It also led to an explosion of the
search space, significantly deforming it. Firms – both large established companies and NBFs –
could master at best only fragments of the relevant knowledge. The high rate of growth of
knowledge, its branching into increasingly specific and uncertain directions and – especially
after 1992 – the appearance of transversal technologies, have led to the generation of a wide
variety of approaches and lines of research.
36
These properties of relevant knowledge bases and related learning processes have induced
particular patterns of division of labour between different types of firms. In general, our results
indicate that two different logics of exploration and technological advance have been coexisting
and complementing each other in the process of network evolution. The first avenue has been
following a trajectory of increasing specification of biological hypotheses. The second has been
progressing towards the development of transversal techniques to generate and screen
compounds and molecules. The first trajectory has been generating patterns of division of
labour in which older generations of firms have been working at higher levels of generality
linking with successive generations of new entrants, who typically embodied increasingly
specific hypotheses and techniques. The second trajectory has tended to alter this inter-
generation structure. In synthesis, several mechanisms have influenced the patterns of division
of labour dynamically interacting to produce quite complex structures.
In both cases, established R&D-intensive pharmaceutical firms have been able to absorb
the new knowledge by interacting with new entrants. In fact, the expansion of the network has
been driven mainly by the entry of new agents embodying new techniques. The network has
taken a distinct hierarchical structure, with different firms operating at different levels of
generality, which was perturbed but not broken by transversal techniques.
The above evidences support, in our view, two hypotheses already advanced in the
literature, namely:
a) the cumulativeness of learning and competence building processes (see Henderson,
Orsenigo, and Pisano, 1999);
b) the significant capabilities by established multi-technology R&D intensive corporations
to absorb new knowledge and techniques generated outside firms boundaries, despite major
technological discontinuities and breakthroughs initially resulting in the growth of specialized
technology producers. (Cohen, Levinthal, 1989; Henderson, 1994; Henderson, Cockburn, 1996;
Granstrand, Patel, and Pavitt, 1997).
The evidence presented in this paper suggests also that firms have found serious
difficulties in modifying their structural position within the network. Put it in another way,
specialist firms have tended to remain specialists, while early entrants have enjoyed significant
first mover advantages, precisely because they have been able to embody knowledge at a high
level of generality. Thus, a major asymmetry seems to have characterized the evolution of the
network: while in many cases “generalist” firms have been able to (gradually) absorb
increasingly specific knowledge (at least along particular trajectories of research), specialist
firms found it much harder to move into the opposite direction.
First mover advantages, the asymmetry between “generalists” and specialists and – more
broadly – the observed process of hierarchization of the network, may well be related to other

37
“more traditional” variables, such as firms size, degrees of diversification, available resources,
etc. In more general terms, one can legitimately wonder if the observed dynamics of the
network is an “unconditional object”, which might have been generated by processes and
influenced by different variables than those emphasized in this paper.
Indeed, controlling for variables like firm size, diversification, propensity to make
agreements, etc., constitutes an important part of our future research agenda. It is worth noting,
however, that an explanation based on conventional firms features is not in contrast with our
interpretation. Moreover, the results we get support the potential value of an approach that
emphasizes the relevance of the specific properties of relevant knowledge bases, learning, and
technologies.
Finally, this paper might have further implications from a more technical perspective. The
graph-theoretic techniques we have used proved useful in mapping major technological
discontinuities on changes observed at the level of dominant organization forms. They might
have applications in other domains, whenever the identification of structural breaks and
homological relationships between technological and industrial spaces are important issues.
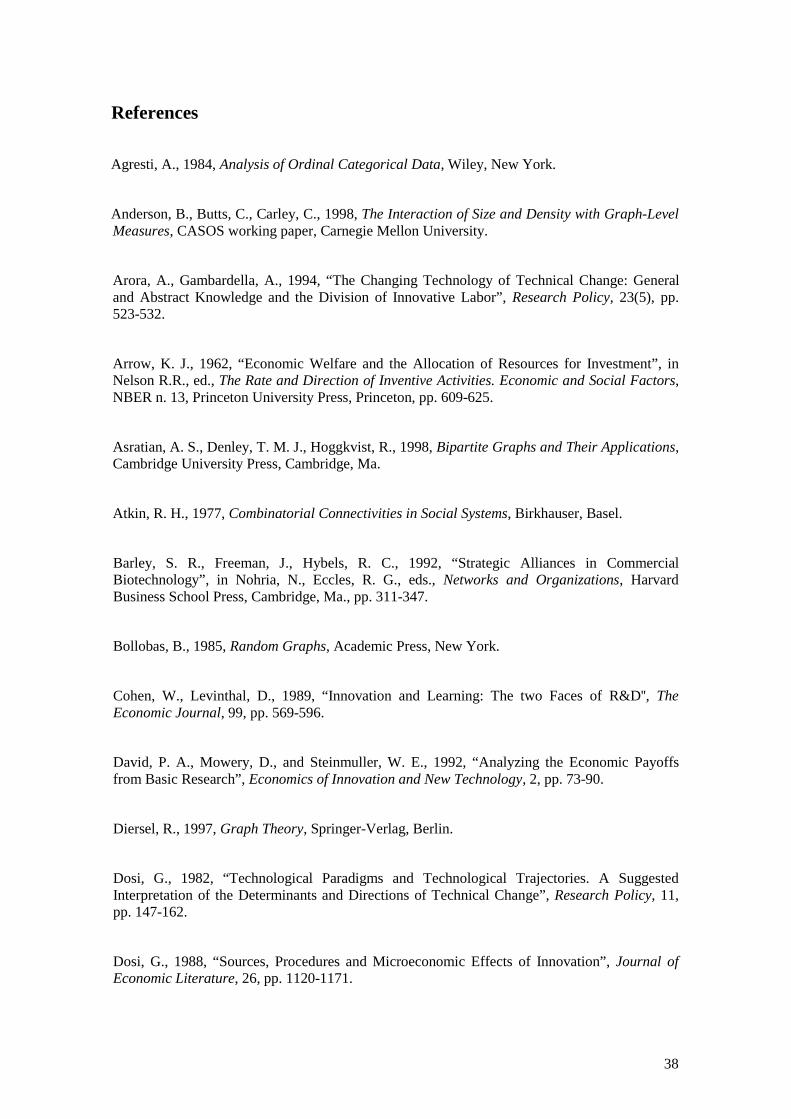
38
References
Agresti, A., 1984, Analysis of Ordinal Categorical Data, Wiley, New York.
Anderson, B., Butts, C., Carley, C., 1998, The Interaction of Size and Density with Graph-LevelMeasures, CASOS working paper, Carnegie Mellon University.
Arora, A., Gambardella, A., 1994, “The Changing Technology of Technical Change: Generaland Abstract Knowledge and the Division of Innovative Labor”, Research Policy, 23(5), pp.523-532.
Arrow, K. J., 1962, “Economic Welfare and the Allocation of Resources for Investment”, inNelson R.R., ed., The Rate and Direction of Inventive Activities. Economic and Social Factors,NBER n. 13, Princeton University Press, Princeton, pp. 609-625.
Asratian, A. S., Denley, T. M. J., Hoggkvist, R., 1998, Bipartite Graphs and Their Applications,Cambridge University Press, Cambridge, Ma.
Atkin, R. H., 1977, Combinatorial Connectivities in Social Systems, Birkhauser, Basel.
Barley, S. R., Freeman, J., Hybels, R. C., 1992, “Strategic Alliances in CommercialBiotechnology”, in Nohria, N., Eccles, R. G., eds., Networks and Organizations, HarvardBusiness School Press, Cambridge, Ma., pp. 311-347.
Bollobas, B., 1985, Random Graphs, Academic Press, New York.
Cohen, W., Levinthal, D., 1989, “Innovation and Learning: The two Faces of R&D'', TheEconomic Journal, 99, pp. 569-596.
David, P. A., Mowery, D., and Steinmuller, W. E., 1992, “Analyzing the Economic Payoffsfrom Basic Research”, Economics of Innovation and New Technology, 2, pp. 73-90.
Diersel, R., 1997, Graph Theory, Springer-Verlag, Berlin.
Dosi, G., 1982, “Technological Paradigms and Technological Trajectories. A SuggestedInterpretation of the Determinants and Directions of Technical Change”, Research Policy, 11,pp. 147-162.
Dosi, G., 1988, “Sources, Procedures and Microeconomic Effects of Innovation”, Journal ofEconomic Literature, 26, pp. 1120-1171.
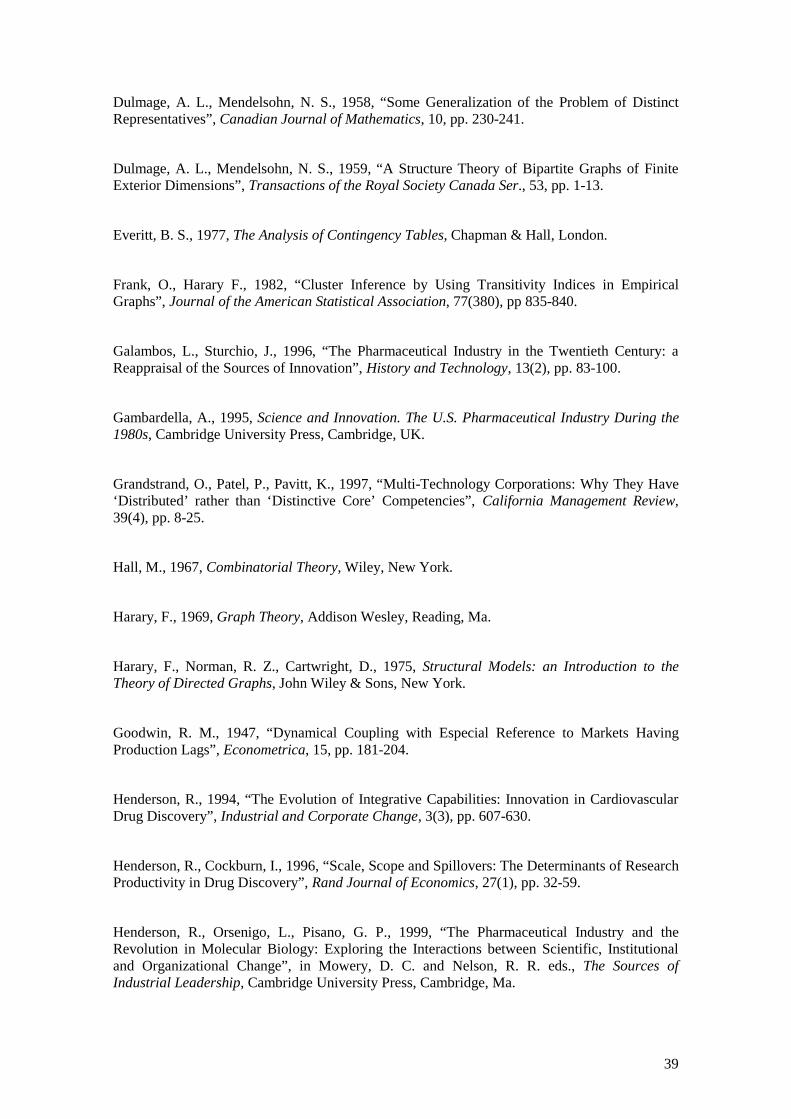
39
Dulmage, A. L., Mendelsohn, N. S., 1958, “Some Generalization of the Problem of DistinctRepresentatives”, Canadian Journal of Mathematics, 10, pp. 230-241.
Dulmage, A. L., Mendelsohn, N. S., 1959, “A Structure Theory of Bipartite Graphs of FiniteExterior Dimensions”, Transactions of the Royal Society Canada Ser., 53, pp. 1-13.
Everitt, B. S., 1977, The Analysis of Contingency Tables, Chapman & Hall, London.
Frank, O., Harary F., 1982, “Cluster Inference by Using Transitivity Indices in EmpiricalGraphs”, Journal of the American Statistical Association, 77(380), pp 835-840.
Galambos, L., Sturchio, J., 1996, “The Pharmaceutical Industry in the Twentieth Century: aReappraisal of the Sources of Innovation”, History and Technology, 13(2), pp. 83-100.
Gambardella, A., 1995, Science and Innovation. The U.S. Pharmaceutical Industry During the1980s, Cambridge University Press, Cambridge, UK.
Grandstrand, O., Patel, P., Pavitt, K., 1997, “Multi-Technology Corporations: Why They Have‘Distributed’ rather than ‘Distinctive Core’ Competencies”, California Management Review,39(4), pp. 8-25.
Hall, M., 1967, Combinatorial Theory, Wiley, New York.
Harary, F., 1969, Graph Theory, Addison Wesley, Reading, Ma.
Harary, F., Norman, R. Z., Cartwright, D., 1975, Structural Models: an Introduction to theTheory of Directed Graphs, John Wiley & Sons, New York.
Goodwin, R. M., 1947, “Dynamical Coupling with Especial Reference to Markets HavingProduction Lags”, Econometrica, 15, pp. 181-204.
Henderson, R., 1994, “The Evolution of Integrative Capabilities: Innovation in CardiovascularDrug Discovery”, Industrial and Corporate Change, 3(3), pp. 607-630.
Henderson, R., Cockburn, I., 1996, “Scale, Scope and Spillovers: The Determinants of ResearchProductivity in Drug Discovery”, Rand Journal of Economics, 27(1), pp. 32-59.
Henderson, R., Orsenigo, L., Pisano, G. P., 1999, “The Pharmaceutical Industry and theRevolution in Molecular Biology: Exploring the Interactions between Scientific, Institutionaland Organizational Change”, in Mowery, D. C. and Nelson, R. R. eds., The Sources ofIndustrial Leadership, Cambridge University Press, Cambridge, Ma.
40
Hummon, N. P., Fararo, T. J., 1995, “Assessing Hierarchy and Balance in Dynamic NetworkModels”, Journal of Mathematical Sociology, 20, pp. 145-159.
Lovasz, L., Plummer, M. D., 1986, “Matching Theory”, Annals of Discrete Mathematics, 29,North Holland, Amsterdam.
Mc Cullagh, P., 1978, “A Logistic Model for Paired Comparisons with Ordered CategoricalData”, Biometrika, 64, pp. 449-453.
Mc Kelvey, M., 1995, Evolutionary Innovation: The Business of Biotechnology, OxfordUniversity Press, Oxford.
Mirsky, L., 1971, Transversal Theory, An Account of Same Aspects of CombinatorialMathematics, Academic Press, New York.
Nelson, R. R., 1961, “The Simple Economics of Basic Scientific Research”, Journal of PoliticalEconomy, 67, pp. 297-306.
Nelson, R. R., 1994, “The Coevolution of Technology, Industrial Structure, and SupportingInstitutions”, Industrial and Corporate Change, 3(1), pp. 47-63.
Oliver Lumerman, A., 1993, New Biotechnology Firms. A Multilevel Analysis ofInterorganizational Relations in an Emerging Industry: Bringing Process into Structure, PhDdissertation, University of California, Los Angeles.
Orsenigo, L., 1989, The Emergence of Biotechnology, St. Martin Press, New York.
Pammolli, F., and Riccaboni, M., 1999, “Technological paradigms and the evolution ofnetworks”, Organization Science Winter Conference, Keystone, Co. Feb. 2000.
Pattison, P., 1993, Algebraic Models for Social Networks, Cambridge University Press,Cambridge, Ma.
Pisano, G. P., 1991, “The Governance of Innovation. Vertical Integration and CollaborativeArrangements in the Biotechnology Industry”, Research Policy, 20, pp. 237-249.
Powell, W. W., 1996, “Interorganizational Collaboration in the Biotechnology Industry”,Journal of Institutional and Theoretical Economics, 152(1), pp. 197-215.
Powell, W. W., Doput, K. W., Smith-Doerr, L., 1996, “Interorganizational Collaboration andthe Locus of Innovation: Networks of Learning in Biotechnology”, Administrative ScienceQuarterly, 41, pp. 116-145.
41
Richardson, G. B., 1972, “The Organization of Industry”, The Economic Journal, 82, pp. 883-896.
Rosenberg, N., 1976, Perspectives on Technology, Cambridge University Press, Cambridge,Ma.
Simon, H. A., 1969, “The Architecture of Complexity”, in The Sciences of the Artificial, MITPress, Cambridge, Ma.
Slepian, P., 1968, Mathematical Foundations of Network Analysis, Springer-Verlag, Berlin.
Testa, B., Meyer, U. A., 1995, Advances in Drug Research, Academic Press, New York.
Tsuji, R., 1997, Permutation Tests for Symmetry and Transitivity in Real-Valued Data,Proceedings of JAMS 24th Conference, Ryutsu Keizai University, Ibaraki, Japan.
Vos, R., 1991, Drugs Looking for Diseases, Kluwer Academic Publishers, Dordrecht.
Walker, G., Kogut, B., Shan, W., 1997, “Social Capital, Structural Holes and the Formation ofan Industry Network”, Organization Science, 8(2), pp. 109-125.
Wasserman, S., Faust, K., 1994, Social Network Analysis: Methods and Applications,Cambridge University Press, Cambridge, UK.
Winter, S.G., 1984, “Schumpeterian Competition in Alternative Technological Regimes”,Journal of Economic Behavior and Organization, pp. 287-320.

42
Appendix 1. Graphs and digraphs
In order to define the notion of a digraph, we have to introduce a definition of what a
network (net) is. A net is generally defined (see Harary et al., 1965; Slepian, 1968; Diersel,
1997) by the following axiom system:
1- A finite and non-empty set V of elements v called “vertices”;
2- A finite set E of elements e called “edges”;
3- A function f whose domain is E and whose range is contained in V;
4- A function s whose domain is E and whose range is contained in V;
A digraph (oriented graph) is a net which does not include neither loops (f(e) s(e)
e�E) nor parallel edges (f(ei) = f(ej) and s(ei) = s(ej) � ei = ej ei, ej � E).
Within the context of this paper, the structural proprieties of the network of R&D
agreements are investigate by interpreting sets V, E and functions f, s in the following way:
1- V: The set of Firms/Institutions (F/Is) that have at least one R&D project in their
pipelines. In our case each firm is associated with a set of projects. In other words, v should be
thought as the set of projects of F/I, while V should be thought as the collection of the project
sets corresponding to each F/I;
2- E: The pharmaceutical R&D projects included in the data set;
3- o(e): F/I that started an R&D project e. In addition, vo denotes the subset of v projects
originated by each F/I;
4- d(e): F/I that develop an R&D project e. In this case, vd denotes the subset of projects v
developed by each F/I.
As a consequence of the above definitions, every edge e within the graph is an oriented
edge defined by a couple (o,d). As far as our empirical analysis of the network structure is
concerned, we take into account only the subset of the R&D projects for which o � d. That is to
say, only projects associated to two or more F/Is are considered (no self loops). Moreover we
treat multiple and repeated relationships among the same actors as a single edge (no parallel
edges).
In order to study the dynamics of the digraph we define both a time orientation and a time
order of the graph. As the development phase follows by definition the starting date of a project,
43
maps o and d substantiate a time orientation of the graph either. What we need now is a time
order defined on the vertices according to the year of entering into the network. Formally:
- �(e(o)): month in which project e is started by o;
- �(e(o,d)): month in which F/I d start to cooperate with firm o to develop project e. By
definition �(e(o,d)) � �(e(o));
- ov
o v min:)(� �(e(o,d)) the month in which v signs its first agreement as an Originator;
- dv
d v min:)(� �(e(o,d)): the month in which v signs its first agreement as a Developer;
- v
v min)( �� � (e(o,d )) = ),(min dov
�� : date of entry within the network (the month in
which v signs its first agreement).
In other words, with reference to the structural evolution of the pharmaceutical R&D
network, a time ordering has been established according to both the year of foundation and the
year of entry of any given F/I within the network. It is important to notice that both orderings
are complete. On the contrary, the time-oriented graph generated by the distinction between
Originators and Developers will be showed to correspond to a partial order set (see Asratian et
al., 1998, Ch. 10) in particular to a time partially ordered set �� f,T�� . According to ordered
set theory, a non-empty subset C ={ kt,...,t,t 21 T� such that ff 21 tt … ktf is called a
chain. If C = T, the time order is complete. Moreover, two elements of T are said to be
comparable if they appear together in the same chain C. Conversely, non-empty set of pairwise
incomparable elements is called an antichain. Finally, the partition of � into disjoint time
chains corresponds to a time decomposition of the network.
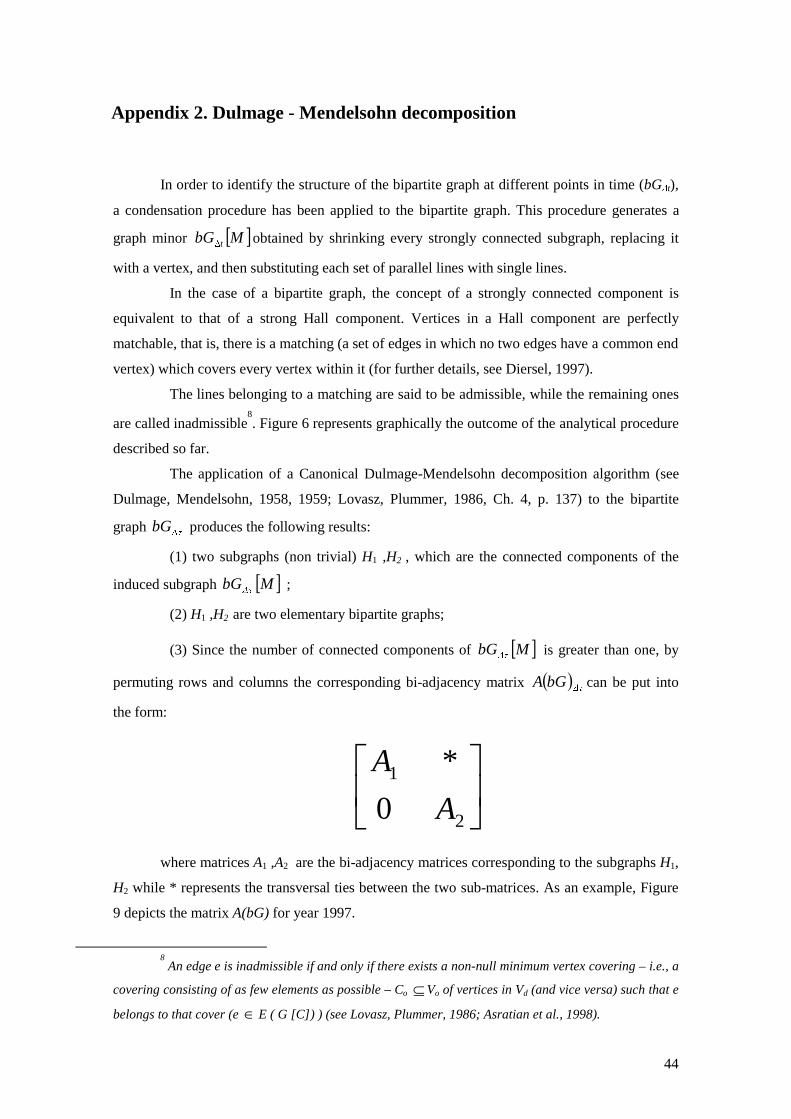
44
Appendix 2. Dulmage - Mendelsohn decomposition
In order to identify the structure of the bipartite graph at different points in time (bG�t),
a condensation procedure has been applied to the bipartite graph. This procedure generates a
graph minor � �MbG t� obtained by shrinking every strongly connected subgraph, replacing it
with a vertex, and then substituting each set of parallel lines with single lines.
In the case of a bipartite graph, the concept of a strongly connected component is
equivalent to that of a strong Hall component. Vertices in a Hall component are perfectly
matchable, that is, there is a matching (a set of edges in which no two edges have a common end
vertex) which covers every vertex within it (for further details, see Diersel, 1997).
The lines belonging to a matching are said to be admissible, while the remaining ones
are called inadmissible8. Figure 6 represents graphically the outcome of the analytical procedure
described so far.
The application of a Canonical Dulmage-Mendelsohn decomposition algorithm (see
Dulmage, Mendelsohn, 1958, 1959; Lovasz, Plummer, 1986, Ch. 4, p. 137) to the bipartite
graph ��bG produces the following results:
(1) two subgraphs (non trivial) H1 ,H2 , which are the connected components of the
induced subgraph � �MbG��
;
(2) H1 ,H2 are two elementary bipartite graphs;
(3) Since the number of connected components of � �MbG��
is greater than one, by
permuting rows and columns the corresponding bi-adjacency matrix � ���
bGA can be put into
the form:
�
���
�
2
1
0
*
A
A
where matrices A1 ,A2 are the bi-adjacency matrices corresponding to the subgraphs H1,
H2 while * represents the transversal ties between the two sub-matrices. As an example, Figure
9 depicts the matrix A(bG) for year 1997.
8 An edge e is inadmissible if and only if there exists a non-null minimum vertex covering – i.e., a
covering consisting of as few elements as possible – Co �Vo of vertices in Vd (and vice versa) such that e
belongs to that cover (e � E ( G [C]) ) (see Lovasz, Plummer, 1986; Asratian et al., 1998).

45
In the Canonical Dulmage-Mendelsohn decomposition we have applied, a major role is
assigned to the interplay between maximum matching and minimum vertex cover. As
transversal vertices are included in every minimum vertex covering of the graph, a greater
proportion of such kind of vertices over the total number of Originators implies a higher
number of time chains in which the graph can be decomposed. In other words, as the proportion
of transversal nodes on the total number of vertices within the graph increases, a linear
representation of the graph dynamics founded on a structural inertia hypothesis becomes less
and less suitable.