Embed Size (px)
Citation preview

Project funded by the
European Commission – DG TREN
Disclaimer: This report represents the views of the authors. These views are not necessarily those of the European Commission and should not be relied upon as a statement of the Commission or DG-TREN.
COMPETE Analysis of the contribution of transport policies to the competitiveness of the EU economy and comparison with the United States
COMPETE Annex 6
Impact of transport infrastructure on economic growth
Version 2.0
30.6.2006
Co-ordinator:
ISI Fraunhofer Institute Systems and Innovation Research, Karlsruhe, Germany
Partners:
INFRAS INFRAS Zurich, Switzerland
TIS Transport, Innovation and Systems Lisbon, Portugal
EE Europe Economics London, United Kingdom


COMPETE
Analysis of the contribution of transport policies to the competitiveness of the EU economy and com-parison with the United States
Report information:
Report no: 2
Title: Impact of transport infrastructure on economic growth. Annex 6 to COMPETE
Final Report
Authors: Nazish Afraz, Matteo Aquilina, Maurizio Conti, Andrew Lilico, (EE)
Version: 2.0
Date of publication: 30.06.2006
This document should be referenced as:
Afraz N, Aquilina M,Conti M, Lilico A (2006): Impact of transport infrastructure on economic growth.
Annex 6 to Final Report of COMPETE Analysis of the contribution of transport policies to the competi-
tiveness of the EU economy and comparison with the United States. Funded by European Commission
– DG TREN. Karlsruhe, Germany.
Project information:
Project acronym: COMPETE
Project name: Analysis of the contribution of transport policies to the competitiveness of the EU economy and comparison with the United States.
Contract no: TREN/05/MD/S07 .5358 5
Duration: 01.01.2006 – 31.08.2006
Commissioned by: European Commission – DG TREN
Lead partner: ISI - Fraunhofer Institute Systems and Innovation Research, Karlsruhe, Germa-ny.
Partners: INFRAS – Infras, Zurich, Switzerland.
TIS - Transport, Innovation and Systems, Lisbon, Portugal.
EE - Europe Economics, London, United Kingdom.
Document control information:
Status: Accepted
Distribution: COMPETE partners, European Commission
Availability: Public (only once status above is accepted)
Quality assurance: Ms Melanie Juenemann
Coordinator`s review: Dr. Wolfgang Schade
Signature:
Date:


Annex 6 to COMPETE Final Report: - i - Impact of transport infrastructure on economic growth
List of contents:
1 Introduction ................................................................................................ 1
2 Review of the theoretical literature............................................................. 4 2.1 Introduction............................................................................................ 4 2.2 Exogenous growth models .................................................................... 5 2.3 Endogenous growth models .................................................................. 5 2.4 Micro-economic linkages via increasing returns and specialisation ....... 9 2.5 Spatial Agglomeration Effects (New Economic Geography models) ... 11 2.6 Conclusions from the literature review................................................. 13
3 Review on the main methodological approaches in empirical analysis.... 14 3.1 The production function approach ....................................................... 14 3.2 The cost function approach ................................................................. 18 3.3 A theoretical comparison of the two approaches. ................................ 21 3.4 The VAR approach .............................................................................. 21
4 The empirical evidence ............................................................................ 22 4.1 The US evidence: production functions ............................................... 23 4.2 The US evidence: cost functions ......................................................... 28 4.3 The US evidence: other approaches ................................................... 31 4.4 The US evidence: VAR approach........................................................ 32 4.5 The EU evidence: production functions ............................................... 33 4.6 The EU evidence: cost and profit functions ......................................... 38 4.7 The EU evidence: VAR approach........................................................ 43 4.8 The EU evidence: a summary ............................................................. 45
5 Literature Review: Conclusion ................................................................. 46
6 Models of transport infrastructure and economic growth ......................... 50 6.1 Introduction.......................................................................................... 50 6.2 The different steps to construct the leisure model ............................... 50 6.3 An endogenous growth model with congestion a la Barro and Sala
I Martin ............................................................................................ 54 6.4 Calibrating the leisure model ............................................................... 55 6.5 The calibration of the BSIM model....................................................... 59 6.6 Dealing with infinite horizon ................................................................. 60 6.7 The simulation of the leisure model ..................................................... 61
7 References .............................................................................................. 64
8 List of studies about networks and their growth impacts.......................... 73

- ii - Annex 02 to COMPETE Interim Report: Literature review about networks and their economic growth impacts

Annex 6 to COMPETE Final Report: - iii - Impact of transport infrastructure on economic growth
List of tables
Table 3. EU: Production function approach .................................................................. 73
Table 4. EU: Cost function approach............................................................................ 80
Table 5. EU: VAR approach ......................................................................................... 85
Table 6. US: various approaches ................................................................................. 88

- iv - Annex 02 to COMPETE Interim Report: Literature review about networks and their economic growth impacts

Annex 6 to COMPETE Final Report: - v - Impact of transport infrastructure on economic growth
List of figures
Figure 1: Simulated Output........................................................................................... 61
Figure 2: Simulated Consumption ................................................................................ 61
Figure 3: Simulated Investment .................................................................................... 62
Figure 4: Simulated Investent in Transport Infrastructure............................................. 62
Figure 5: Simulated Capital Stock ................................................................................ 62
Figure 6: Simulated Transport Infrastructure Stock ...................................................... 63
Figure 7: Simulated labour effort .................................................................................. 63

- vi - Annex 02 to COMPETE Interim Report: Literature review about networks and their economic growth impacts

Annex 6 to COMPETE Final Report: - vii - Impact of transport infrastructure on economic growth
List of abbreviations
€ EURO
BEA US Bureau of Economic Analysis
BSIM Barro and Sala I Martin model
DM Deutsche Mark
EU European Union
EU-15 The 15 EU countries before the 2004 enlargement.
GDP Gross domestic product
ISTAT Istituto di Statistica (Italian statistical office)
OECD Organisation for Economic Co-operation and Development
OLS Ordinary Least Squares
R&D Research and Development
SUR Seemingly Unrelated Regressions
TFP Total factor productivity
UK United Kingdom
US United States of America
VAR Vector Auto Regression
VECM Vector Error Correction Model

- viii - Annex 02 to COMPETE Interim Report: Literature review about networks and their economic growth impacts

Annex 6 to COMPETE Final Report: - 1 - Impact of transport infrastructure on economic growth
Annex 06: Impact of transport infrastructure on economic growth
1 Introduction
Public infrastructure in general, and in particular transport networks (such as roads, railways,
airports, and waterways) have long been considered important inputs to economic and pro-
ductivity growth. The basic intuition behind this is that improvements in public infrastructure
(e.g. better roads) would be expected to raise the productivity of private inputs (say, by re-
ducing the time and cost of transporting goods from factory to retail outlet), reducing the
costs of production and raising the rate of total factor productivity growth. However, al-
though some research on the effects of public capital on productivity growth can be traced
back to the pioneering works of Meade in the 1950s and contributions published in the fol-
lowing decades (for instance, Mera, 1972 and De Rooy, 1978), it was the seminal contribu-
tion of Aschauer (1989a) that spurred recent academic interest in the field.
Aschauer (2000) ascribes this renewed interest to two factors. The first is that in the US pub-
lic investment spending, as a share of GDP, had declined significantly in the run-up to this
period. The trend seems to have been common to many other developed countries (for in-
stance, evidence on OECD countries reported in Kamps (2004) shows that the average public
investment to GDP ratio declined over the 1971-1990 period and there appear to be impor-
tant differences between countries (as one might have expected). Secondly, the fact that the
US non military capital accumulation, as a fraction of GDP, peaked in the late 1960s has been
seen by some authors (Aschauer, 1989a and Munnel 1990a) as one of the possible explana-
tions for the productivity growth slowdown that characterised the following two decades.
The early studies of this period suggested that public capital stock had a quantitatively impor-
tant impact on productivity. For instance, Aschauer (1989a) estimated a production function
using US annual data for the period 1949-1985 and found that a one per cent increase in the
stock of public capital infrastructure would have increased output by about 0.35 per cent.
Similar results were also found by Munnell (1990a) and Flores and Pereira (1993) and by As-
chauer (1989b) for the G7 countries. Interestingly, these studies suggested that core public
infrastructure (which is more closely related to the concept of transport infrastructure than
the wider stock of public infrastructure) had in general the highest impact on private output,
with the remaining categories of public capital playing a far smaller role.
These early results (which were mainly based on US samples) were widely regarded as im-
plausibly high and did not however find robust support in the studies that immediately fol-
lowed. For instance, Munnell (1990b) using a panel of US states, found a positive but signifi-
cantly lower effect of public capital on output. Tatom (1991), Holtz-Eakin (1994) and Kelejian
and Robinson (1997) were unable to find any significant effect of public capital on output
once appropriate econometric techniques had been employed and similar results were also
found (using a sample of OECD countries) by Evans and Karras (see Gramlich’s 1994 litera-
ture review for a comment on the early contributions).

- 2 - Annex 06 to COMPETE Final Report: Impact of transport infrastructure on economic growth
In general, studies that were conducted at a more disaggregated level (such as by sector or
state or region) tended to produce smaller estimates than these identified by studies employ-
ing national level data (Munnell, 1990 and Morrison and Schwartz, 1996) and also tended to
display an interesting variability both across time and cross-sectionally. Munnell (1991) ar-
gued that it is intuitively to be expected that estimates of the effect of public infrastructure
on output should rise with the level of aggregation: studies which employ regional level data
are likely to find lower estimates than those focusing on national samples, as the former
would neglect potential spillover effects of infrastructure investments: a highway in region A
might well help increase production in region A, but also in the neighbouring region B. While
most subsequent research has neglected this consideration, a few studies (Cohen and Morri-
son, 2003, for instance) tried to incorporate spatial effects and the effects of spillovers into
the analysis.
The main objections that were raised against the studies supporting the Aschauer findings
related to various weaknesses of the statistical analysis. For instance, it was argued that insuf-
ficient account had been taken of the possibility that rises in the stock of public capital are
driven by rises in GDP, rather than the other way round. Furthermore, production functions
might yield biased estimates if the simultaneity between output, capital and labour inputs is
not properly addressed.
Thirdly, it is known that some macroeconomic variables (such as capital stocks and GDP) re-
flect non-stationary processes: neglecting this possibility is likely to yield spuriously high im-
pacts of public capital stock on productivity growth. On the other hand, removing the prob-
lem by first differencing the series might cause the analysis to miss long run links between
the series if they happened to be cointegrated.
Finally, early studies using the production function framework relied on the Cobb-Douglas
functional form, which has come to be regarded as too simplistic a representation of tech-
nology.
More recent research has attempted to take account of some of these criticisms: production
functions have been generally estimated after performing preliminary analysis on stationarity
and cointegration; the use of cost functions has become more common, especially in the
case of studies using regional or sectorial data and vector auto-regressive models (VARs) have
been increasingly used in the most recent studies that rely entirely on time series data.
While the first papers following Aschauer’s (1989) study did not manage to provide strong
evidence in favour of or against the hypothesis that public infrastructure did have a positive
impact on GDP, the evidence in the most recent papers has generally been felt to point to
the existence of small but positive effects of public infrastructure expenditure on GDP. How-
ever, the general view is that the most recent research also suggests that there is a danger of
over-generalising these findings, as there are often important differences in the effects across
states, regions and sectors.
Another set of possible criticisms of the empirical literature relates to the definition of the
public infrastructure stock: while some studies adopt a broad definition of public infrastruc-
ture, other focus on the so called core infrastructure (railways, roads, water and sewer mains,
etc), with a minority focusing on transport infrastructure or particular kinds of it, such as
Annex 6 to COMPETE Final Report: - 3 - Impact of transport infrastructure on economic growth
roads or highways. It should be noted that the empirical results that can be found in the lit-
erature should be viewed bearing the definition of infrastructure capital firmly in mind, as it
might be argued that core infrastructure should be “more productive” than education and
office buildings and, comparing the results, the issue of the definition of public infrastructure
should be addressed. Furthermore, the measurement of the public infrastructure stock is not
an easy task (for instance, it is not clear how to assess the impact of congestion on the effec-
tiveness of a given stock of transport infrastructure). In addition, estimating the value of pub-
lic capital involves significant methodological challenges, since market values for public infra-
structure and equipment are often not available. In the US, the BEA uses a perpetual inven-
tory methodology to asses the value of public capital. Alternative measures of public capital
use time-series of government expenditure on public investment, assuming an explicit depre-
ciation rate to public capital.
An important problem when using a monetary value of public capital for studying its linkage
with economic activity is that this methodology may not be appropriate to study spatially
interconnected networks. The internal composition of the stock matters, because the mar-
ginal productivity of any link depends on the capacity and configuration of all the links in all
the networks. An aggregate monetary measure of public capital fails to capture these effects,
allowing only the estimation of the average marginal product of the network in the past
(Fenald 1999). This problem is of particular interest since most of the public capital stock is
associated with networks, such as roads, water systems, sewers, and electric grids among
others. Furthermore, as observed by Prichett (1996), the use of monetary values to compute
the stock of public infrastructure might give a distorted picture of the actual services provided
by the stock given the different degrees of efficiency that might have characterised past gov-
ernment investments.
Given these inherent problems in the measurement of the public capital stock, some econo-
mists have even questioned the use of monetary values to measure it, preferring “physical”
measures of the public infrastructure stock, such as road length, kilometres of railways, etc. A
drawback of such measures, however, is that they tend to neglect the quality of infrastruc-
ture.
Interestingly, the empirical literature on the effects of public infrastructure on output and
productivity growth developed largely independently from the research programme which
sought to explore the theoretical links between infrastructure capital and economic and pro-
ductivity growth. As Aschauer (2000) noted, the finding that public capital might be produc-
tive, does not necessarily imply that increasing public capital investment spending would lead
to higher growth rates of GDP. In fact, conventional growth models a la Solow predict that
higher investment (both private and public) would have effects only on the level of GDP,
rather than on its rate of growth. However, more recent theories suggest that public invest-
ment might have long run effects on the rate of growth of GDP. For instance, a higher stock
of public infrastructure might reduce costs of production by allowing greater specialisation,
thereby generating more output. In addition there may be further changes in factor markets
and firm location decisions that allow the development of spatial clusters of economic sec-
tors, thereby affecting innovation and allowing further reduction in costs (Lakshmanan and
Anderson, 2002). More recent theoretical and empirical research has sought to analyse the

- 4 - Annex 06 to COMPETE Final Report: Impact of transport infrastructure on economic growth
effects of public infrastructure in general equilibrium models that allow the joint addressing
of issues such as the optimal provision of public infrastructure capital, taxation and techno-
logical progress.
Our view is that the analysis briefly sketched above suggests that, in order to gain a better
understanding of the links between public infrastructure and productivity growth, it is neces-
sary to develop a through understanding of the theories that have been proposed to explain
these links. With this theoretical background, it is then necessary to critically evaluate the
empirical contributions: in particular, it is necessary to discuss the methodological approach,
the main results and the potential limitations of the analysis: this is important because if a
given result were supported by fairly robust studies employing different methodologies, our
confidence in that result would be greatly enhanced.
Given this approach, the remainder of this section is organised as follows. In Section 2 we
will review the recent theoretical literature on the links which exist between economic
growth and transport infrastructure. In Section 3 we will provide a background discussion on
the main approaches that have been used to empirically investigate the impact of public in-
frastructure on economic and productivity growth: production functions, cost functions and
the Vector Auto-Regressive model. In Section 4 we will discuss the main empirical results that
have been found in the literature. Some studies have sought to provide critical reviews of the
empirical evidence in this field, the most recent and up to date being perhaps these provided
in Sturm and De Haan (1998) and Romp and De Haan (2005): in this report we build on
these to add the most recent studies and some older ones not covered in those reviews. In
particular, given that the overall project is to include a comparative assessment of the situa-
tion in the EU and the US, we will deal separately with the empirical evidence related to the
US and the EU. Finally, section 5 contains some conclusions that can be drawn from the lit-
erature review. Section 8 includes tables summarising the main results and methodological
features of each study that has been reviewed, as well as a more in depth review of the theo-
retical literature on the effects of transport infrastructure on economic growth.
2 Review of the theoretical literature
2.1 Introduction
As discussed in the introduction of the economic analysis in the main part of the Interim Re-
port (see section 7), although many studies consider the impact on economic growth of pub-
lic infrastructure investment (specifically or including transport), there is only limited consen-
sus. In such an environment, one of the important roles of economic theory is in seeking to
develop understanding of the nature of the relationships in question. This primary focus of
this section is on the class of models that either explicitly model transport costs or are capable
of being modified to do so. The theoretical literature can be divided into the following cate-
gories. These categories are not entirely distinct, leaving room for occasional overlap, but are
nevertheless useful for understanding the literature:
Exogenous growth models,
Endogenous growth models,

Annex 6 to COMPETE Final Report: - 5 - Impact of transport infrastructure on economic growth
Public infrastructure enters as an input,
Public infrastructure enters via technology,
Micro-economic linkages via increasing returns and specialisation, and
Spatial agglomeration effect
The aim of this section is to describe and evaluate a number of different approaches to the
question at hand. We describe the major common approaches taken and the adaptations
that are particularly interesting for the analysis of the transport sector.
2.2 Exogenous growth models
In neoclassical exogenous growth models, exemplified for example in Solow (1956), public
capital can be included as an input along with physical capital and labour. Since all inputs are
subject to diminishing returns, increases in public capital will not lead to long run growth
effects, but would have a level effect on the economy. This class of models depends on ex-
ogenous technical progress, reflected in total factor productivity, to lead to long run GDP per
capita growth and since there is no room for public capital to affect technical progress, it
cannot have growth effects.
Real Business Cycle models can also be extended to include public capital. Baxter and King
(1993) for example introduce public capital into a Real Business Cycle model. They find that
productive government spending can have large level effects on output, as there is a direct
output affect and an indirect effect via marginal products of labour and capital. However, as
before, capital does not affect long run growth.
2.3 Endogenous growth models
The endogenous growth models introduce mechanisms whereby capital (defined more
broadly now to include other forms such as human capital) is not subject to diminishing re-
turns. Thus public capital has the potential of leading to long run growth effects. There are
two streams of work within this broad class of models which have attempted to introduce
public capital into the production function: one where public capital enters as a standard
input to the production function along with labour and physical capital, and the other where
public capital affects the productivity of the standard inputs by affecting the technology vari-
able. We discuss each approach below.
2.3.1 Public Infrastructure enters as an input in the production function
The Barro (1990) endogenous growth model is a useful starting point, and is used as the
basis for much further work (e.g. Barro and Sala-i-Martin (1992), Turnovsky (1997)).
The model begins with an infinite-lived household in a closed economy, maximising a stan-
dard time discounted utility function:
dtecuU t∫∞
−=0
)( ρ

- 6 - Annex 06 to COMPETE Final Report: Impact of transport infrastructure on economic growth
Where c is consumption per capita and ρ > 0 is the constant rate of time preference. The
utility function u(c) is then defined as one which exhibits constant elasticity of marginal utility,
-σ as follows:
σ
σ
−−
=−
11)(
1ccu
Each household has access to a production function,
Aky =
Where y is output per worker and k is capital per worker. k is used flexibly to encompass
physical capital plus other forms such as human capital. Although there are diminishing re-
turns to each factor independently, together they exhibit constant returns to scale.
Adding public services provided, g, as an input, the production function becomes:
⎟⎠⎞
⎜⎝⎛Φ=
kgky .
where the function Φ exhibits positive and diminishing marginal products. The marginal
product of public capital, holding private capital fixed, is given by:
)1('1 η−⋅⎟⎠⎞
⎜⎝⎛Φ=⎟⎟
⎠
⎞⎜⎜⎝
⎛⋅Φ−⋅⎟
⎠⎞
⎜⎝⎛Φ=
kg
yg
kg
dkdy
where η is the elasticity of y with respect to g.
We then add financing considerations to the model. Public capital is financed by distortionary
taxes under a balanced budget constraint.
⎟⎠⎞
⎜⎝⎛Φ⋅⋅===
kgkyTg ττ
where T is government revenue and τ is the tax rate. With households normalised to unity, g
and T represent aggregate expenditures and revenues.
The solution to the private optimisation problem yields the following growth path for per
capita consumption:
⎥⎦
⎤⎢⎣
⎡−−⋅⎟
⎠⎞
⎜⎝⎛Φ⋅−== ρητ
σγ )1()1(.1
kg
cc&
As long as g and T grow at the same rate as y (and therefore τ and g/y are constant), the
growth rate γ will be constant.
From the equation above we can see two effects of the size of government: an increase in
tax reduces consumption growth, while an increase in expenditure increases growth. When
government is small, the second effect is likely to dominate. The model yields the result that
growth is maximised when the government sets its share of GNP, g/y, equal to the share it
would get if the services were provided competitively as an input to production. There is thus
an optimal level of infrastructure capital. Investment in capital below this level is growth en-
hancing, while increases beyond this level have negative growth effects.
Annex 6 to COMPETE Final Report: - 7 - Impact of transport infrastructure on economic growth
The Barro (1990) model has since been extended in several different ways. For example, the
original model treats public capital as a “pure” public good i.e. both non-rivalrous and non-
excludable. Some adaptations have attempted to incorporate the rivalrous nature of con-
sumption that may arise in public infrastructure due to congestion. Other treatments incorpo-
rate the fact that public goods may be made excludable by charging a user fee (transport
examples include charges for the use of highways or airports).
Of the most recent of this literature, Ott and Turnovsky (2005) extend the Barro (1990)
model to include both rivalry and excludability. A conventional non-excludable public input,
financed out of tax revenue, is included alongside an excludable public input that requires
users to pay a fee. Keeping to the original Barro terminology of representing privately owned
capital by k, government owned capital, g, is now split into an excludable Es and a non-
excludable part, Gs.
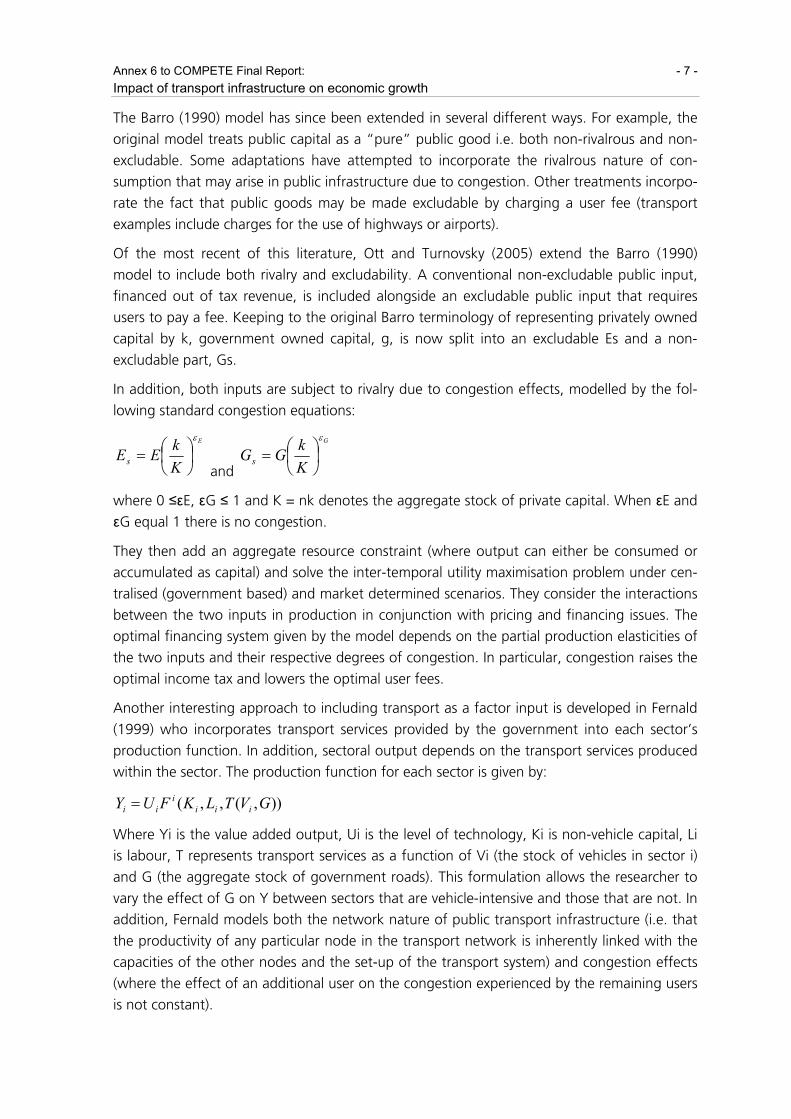
In addition, both inputs are subject to rivalry due to congestion effects, modelled by the fol-
lowing standard congestion equations:
E
KkEEs
ε
⎟⎠⎞
⎜⎝⎛=
and
G
KkGGs
ε
⎟⎠⎞
⎜⎝⎛=
where 0 ≤εE, εG ≤ 1 and K = nk denotes the aggregate stock of private capital. When εE and
εG equal 1 there is no congestion.
They then add an aggregate resource constraint (where output can either be consumed or
accumulated as capital) and solve the inter-temporal utility maximisation problem under cen-
tralised (government based) and market determined scenarios. They consider the interactions
between the two inputs in production in conjunction with pricing and financing issues. The
optimal financing system given by the model depends on the partial production elasticities of
the two inputs and their respective degrees of congestion. In particular, congestion raises the
optimal income tax and lowers the optimal user fees.
Another interesting approach to including transport as a factor input is developed in Fernald
(1999) who incorporates transport services provided by the government into each sector’s
production function. In addition, sectoral output depends on the transport services produced
within the sector. The production function for each sector is given by:
)),(,,( GVTLKFUY iiii
ii =
Where Yi is the value added output, Ui is the level of technology, Ki is non-vehicle capital, Li
is labour, T represents transport services as a function of Vi (the stock of vehicles in sector i)
and G (the aggregate stock of government roads). This formulation allows the researcher to
vary the effect of G on Y between sectors that are vehicle-intensive and those that are not. In
addition, Fernald models both the network nature of public transport infrastructure (i.e. that
the productivity of any particular node in the transport network is inherently linked with the
capacities of the other nodes and the set-up of the transport system) and congestion effects
(where the effect of an additional user on the congestion experienced by the remaining users
is not constant).

- 8 - Annex 06 to COMPETE Final Report: Impact of transport infrastructure on economic growth
2.3.2 Public Infrastructure enters as an input to the technological constraint
The models described above incorporate public capital as a factor input. This approach has
been criticised on the grounds that it assumes that firms know the marginal cost of infra-
structure and can therefore use it in the optimisation problem. Since public infrastructure is
financed mostly from government revenue, the per-unit cost of infrastructure is not market
determined and is unrealistic to calculate for each firm (Duggal et al. (1999)).
Other approaches have, therefore, developed which incorporate public capital in the tech-
nology constraint rather than as a factor input. Shioji (2001) specifies such a model, using an
approach in which output is affected via technology in an open economy. They start with a
standard production function in which a region’s output, Yt, depends on a technology vari-
able, A, in addition to capital, Kt and labour Lt,:
αα −⋅⋅= 1ttt LKAy
The level of technology is defined to be a positive function of public capital per capita:
c
LGBA ⎟⎠⎞
⎜⎝⎛=
where G is the public capital, B represents the intrinsic productivity of the region and it is
assumed strictly positive, c is a non negative parameter and L, the labour input, is assumed
constant over time.
Thus increases in public capital per capita improve productivity and therefore the output via
an external effect. They also incorporate an adjustment cost for investment: capital is mobile
between regions but with a cost. The cost of investment is given by:
⎟⎟⎠
⎞⎜⎜⎝
⎛⋅+⋅
t
tt K
II
21 ζ
Where It is the investment at time t and ζ is a positive constant i.e. the firm pays both the
price of the investment good (one unit of output) but also the adjustment cost.
Each firm maximises the present value of its net cash flow in an infinite time horizon. Their
model yields the result that the elasticity of output with respect to public capital is greater in
the long run because public capital influences output not just because of its own productivity
impact but also by attracting more private investment to the region.
In a similar vein, Duggal et al. (1999) also incorporate infrastructure in the technological con-
straint. In their model, infrastructure lowers costs and therefore increases productivity. In ad-
dition, infrastructure allows markets to expand and economies of scale to be achieved, fur-
ther lowering costs. Technology, At, is modelled as a non-linear function of infrastructure
and time:
gtt eA =
Where g, the growth rate of the technological index is given by
ctf eeegtφγ
=
where f is infrastructure capital, t is the time trend and c is a constant.

Annex 6 to COMPETE Final Report: - 9 - Impact of transport infrastructure on economic growth
They incorporate this growth rate into a non-standard production function that follows an S-
shape:
⎟⎠⎞
⎜⎝⎛ −+++= 2
321
1lnlnlnlnL
KL
LKAQβ
ββα
where Q is real output, K is the stock of non-residential capital adjusted by the rate of capital
utilisation, and L is the number of worker hours.
In the solution to the optimisation problem, they find that the impact of infrastructure is posi-
tive, but not constant. Increases in infrastructure enhance the total productivity of capital and
labour and thereby reduce costs and allow expansion in output.
2.4 Micro-economic linkages via increasing returns and specialisation
The macro-economic models described above link public capital to the production function,
but do not specify the process by which the capital leads to growth. In this sense, they give
us an idea of the existence and extent of the effect of public capital, but give no satisfying
answer to how, and thus have limited use in directing future public capital. Other approaches
have since then tried to incorporate micro-economic based processes into the model, for ex-
ample through reduced travel times and costs which lead to economies of scale and speciali-
sation, and thus to growth.
Romer’s (1987) model of endogenous growth with specialisation in production is a useful
starting point as it forms the basis for several extensions that include infrastructure. He starts
with a production function that uses labour, L, and intermediate inputs, where x(i) is the
amount of intermediate input i used:
∫ +ℜ⎟⎠⎞
⎜⎝⎛= di
LixgLxLY )(),(
g is defined as an increasing, strictly concave function, for example, g(x) = xα. He then adds
the assumptions that output increases with the degree of specialisation, and that there are
returns to scale in the production of intermediate goods. Specifically, Romer (1987) adds
fixed costs to the model to produce a u-shaped average cost curve, which limits the degree
of specialisation. In the dynamic version of the model, a primary resource constraint is added
which is interpreted as durable, general purpose capital good. A conventional inter-temporal
utility function is defined (similar to the one described in Barro (1990) above). Consumers are
each endowed with a stock of general purpose capital which they rent out to intermediate
goods producers. Every individual receives some output which must be allocated between
capital and investment in additional capital. Thus additions to the capital stock are defined by
cxYZ −= ),1(&
where Z is the durable capital (the primary input defined earlier) and c represents consump-
tion.
The effect of a private production model with imperfect competition is that there is a diver-
gence between marginal costs and price. Private returns to savings received by individuals are
lower than the social returns. Therefore, individuals do not fully internalise the benefits of a

- 10 - Annex 06 to COMPETE Final Report: Impact of transport infrastructure on economic growth
higher savings rate and as a result save and invest too little. In contrast a social planner takes
into account that a higher rate of savings leads not just to higher investment but also to
higher labour income.
Schiffbaur (2005) augments the standard model by specifying a more comprehensive micro-
economic linkage between infrastructure capital and productivity growth. First, productivity
and technological change are endogenised using the Romer (1990) closed economy model as
a starting point. Schiffbaur (2005) assumes that intermediate goods that are used in the pro-
duction of final output include proportional transportation and coordination costs. An im-
provement in infrastructure capital reduces these costs and therefore allows specialisation in
the production of intermediate goods. As the expected future profits of the intermediate
sector increase, the incentives to invest in R&D also increase. This endogenous technical
change is the only source of GDP growth in equilibrium and therefore GDP grows at the
same rate as the stock of technologies. Since labour is diverted to R&D from manufacturing,
the productivity of the sectors also determines the growth effect. The model is further en-
hanced by endogenising capital stock. Firms pay for their use of infrastructure capital. He
considers three separate ownership structure of infrastructure capital: a private monopoly, a
composition of price regulation and tax financing, and a public monopoly on a balanced
budget, finding that public provision provides the highest growth rates. The model is particu-
larly interesting because it reveals complementarities between infrastructure investments and
variables that affect the productivity of the R&D sector. This implies that differences in the
productivity of the R&D sector (driven for example by property rights or human capital) can
explain differences in growth, even if levels of public infrastructure capital are similar.
Bourgheas et al (2000) also model infrastructure as reducing the costs of producing interme-
diate goods. They start with the Romer (1987) model in which output Y(x) is a function of a
vector of inputs x(i):
∫+ℜ
= diixYxα)(
Where 0 < α <1. A cost function which includes fixed costs is added, the fixed costs limiting
the degree of specialisation, so that the average cost curve is u-shaped as in the original Ro-
mer model. Borgheas et al. (2000) endogenise the fixed costs element as a way of including
infrastructure in the model. The cost function is specified as:
iixYGCYGixh ∀+
= ,2
)()/()/),((2
Where G is the stock of public capital, C’ < 0 and C’’ >0 i.e. that fixed costs vary inversely
with the stock of public capital relative to the size of the economy.
Finally a primary resource constraint for the economy is added to the model along with the
assumption that the government runs a balanced budget and finances infrastructure by a
proportional tax of final output. The process of infrastructure accumulation is also modelled
explicitly as assuming that resources must be diverted from producing output in order to ac-
cumulate capital. Thus the accumulation of infrastructure also comes at a cost in terms of
output lost.

Annex 6 to COMPETE Final Report: - 11 - Impact of transport infrastructure on economic growth
There is both a positive impact on output that comes from a reduction in fixed costs and an
increase in specialisation, and a negative effect that comes from output diverted to accumu-
late capital. Both the positive and negative effects of infrastructure accumulation on output
growth interact to give a non-monotonic relationship between the two. A unique tax rate is
found that maximises growth by balancing savings between private and infrastructure capi-
tal.
2.5 Spatial Agglomeration Effects (New Economic Geography models)
Models that feature specialisation and scale effects have been enriched further by the New
Economic Geography models which include general equilibrium and imperfect competition in
the model. General equilibrium allows the improvements in transport to affect the markets
for other factor inputs, such as labour markets, and these effects to be traced back to out-
put. It is thus possible, at least in theory, to capture the various multipliers, interactions and
feedback effects that an economy naturally goes through. Furthermore, relaxing the perfect
competition assumption and allowing product variety also allows for willingness to pay and
monopoly power to determine how much of the reduction in costs will be passed on to con-
sumers. Public infrastructure has the effect of dropping transport costs and allowing econo-
mies of scale to be achieved. As a firm in a given location has access to a larger market area
and gains dominance, other suppliers are encouraged to locate close by, making the area
more attractive for successive firms as the required markets are located conveniently (in eco-
nomic jargon, external economies of scale lead to the process of cumulative causation). This
process encourages spatial concentration – the principal result of the New Economic Geogra-
phy models.
The Dixit and Stiglitz (1977) model is a starting point for several of the New Economic Geog-
raphy models. Krugman (1990) builds upon this model to produce the first bench-mark paper
for this series of literature. A two-region, two-factors of production model is proposed where
the utility function for all individuals is defined as:
µµ −= 1AM ccU
where cA and cM represent the consumption of agricultural and manufactured aggregates
respectively. Imperfect substitution and variety is then introduced by defining the manufac-
tured aggregate as:
)1/(
1
/)1(−
=
− ⎟⎠
⎞⎜⎝
⎛= ∑
σσσσ
N
iiM cc
where N are the number of potential products and σ > 1 is the elasticity of substitution be-
tween the products.
The first sector is agriculture, which requires one unit of labour per unit of output. Peasants
who provide agricultural labour are assumed to be completely immobile. However, workers
can move between the two regions. The total number of workers is:
21 LL +=µ

- 12 - Annex 06 to COMPETE Final Report: Impact of transport infrastructure on economic growth
Where L1 and L2 are the labour supplies of region 1 and region 2 respectively. Economies of
scale are introduced by specifying the production of manufactured goods to include both a
fixed cost and a constant marginal cost. The amount of labour used in producing xi units of
good i is:
ii xβαµ +=
The transport sector is introduced via two assumptions. Firstly, agricultural goods are costless
to transport. Secondly, there are “iceberg” transportation costs for manufactured goods –
i.e. that only a fraction of each unit that is shipped out arrives and the value of the rest
“melts” away in transition. The fraction that arrives is inversely proportional to transportation
costs.
Profits maximising firms set price equal to p1, taking the wages of workers in region 1, w1 as
given:
11 1wp β
σσ−
=
and similarly for region 2. Free entry is allowed so that profits are driven to zero. The solution
to the zero profit condition yields the result that output per firm is the same in every region –
irrespective of wage rates. This in turn implies that the number of manufactured goods pro-
duced in each region is proportional to the number of workers – i.e. n1/n2 = L1/L2
Equilibrium conditions are investigated by solving for consumption for each good by region
(where transported goods are suitably discounted) and also by taking into account the
movement of workers to the region offering higher real wages (i.e. nominal wages adjusted
for the relative price of goods in the region). There are three effects operating in the model
that are relevant for location. The first is the home market effect, which is that wages are
higher in the larger market. The second is the price index effect, which is that if wage rates
are equal, a movement of workers towards region 1 will lower the price index in region 1
and thus raise real wage. The second is the price index effect: workers in the region with a
smaller manufacturing operation will face less competition for the local peasant market than
those in the more populous region. The first two effects work towards divergence while the
third works towards convergence. Which force dominates depends on the value of the pa-
rameters. In particular, he finds that when transportation costs are high, we would expect to
see convergence.
Holtz-Eakin and Lovely (1996)’s two-sector model, similarly, specifies a mechanism by which
infrastructure allows a lowering of costs in the manufacturing sector and greater industry-
level external returns to variety. A general equilibrium framework is used which allows the re-
allocation of factor inputs and prices in response to changes in infrastructure. The two factor
inputs, capital and labour, are assumed to be inter-sectorally mobile and are allocated com-
petitively.
Intermediates are introduced in the production function, the production of which is charac-
terised by internal economies of scale. These economies of scale, together with the external
returns to variety described earlier, provide a mechanism for public infrastructure provision to
impact output. The model is further enriched by introducing market power in the market for
Annex 6 to COMPETE Final Report: - 13 - Impact of transport infrastructure on economic growth
intermediate goods. Intermediate goods are assumed not to be traded and final goods are
produced from intermediates produced locally. As market power declines, the mark-up of
price over marginal cost declines and each firm produces more as its variety is easily substi-
tuted for other varieties.
An increase in the provision of infrastructure in this model leads to a reduction in fixed costs,
an increase in the number of component producers and improvements in the external
economies of the manufactured good industry. However, the final effect on output in the
manufacturing sector is indeterminate and is influenced by the degree of monopoly power.
Therefore, in this model, there are not necessarily any growth effects resulting from an in-
crease in the provision of public infrastructure.
New Economic Geography models have a number of advantages over the other approaches:
firstly, the assumptions and mechanisms of the model are in line with what we observe in
modern economies – product differentiation and increased variety, spatial agglomeration and
persistent regional differences in wages, and specialisation that is not explained by the com-
parative advantage theory or differences in natural endowment.1 Secondly, the assumption
of general equilibrium is highly useful for capturing the full benefits/costs to the economy
rather than the more static partial equilibrium approach which could significantly underesti-
mate benefits as the economy responds dynamically to the opportunities presented by im-
proved infrastructure.
2.6 Conclusions from the literature review
This section has described and discussed the theoretical models that have been used, or have
the potential to be used, to explain the linkage between public infrastructure and growth.
The “black box” models of exogenous growth and traditional endogenous growth models
that incorporate infrastructure but simply assume a positive effect are no longer satisfactory
to take to the data. Empirical work on the basis of these models has thrown up the weakness
that these models do not specify sufficient form to allow an interpretation of the controver-
sial empirical results.
A satisfactory model, from the public policy point of view, must be able to go behind the link
between growth and public capital, understanding and explaining the mechanisms that allow
infrastructure to lead to significant economic effects. The models that have so far been put
forward for this purpose have been those that include micro-economic linkages in the cost or
production function. These models typically include specialisation and increasing returns, and
in the case of the New Economic Geography models, general equilibrium effects and imper-
fect competition. These models, which offer a richer structure for studying the mechanisms
behind the link between transport and growth, appear to have the highest potential to be
used effectively in further research of the effects of transport infrastructure.
1 Lakshmanan and Anderson (2002) quote the example of trade between Canada and the US, where
much trade is intraindustry rather than interindustry.

- 14 - Annex 06 to COMPETE Final Report: Impact of transport infrastructure on economic growth
3 Review on the main methodological approaches in empirical analysis
The empirical approaches that have sought to analyse the relation between public infrastruc-
ture and productivity growth have been subject to some criticisms. While some of these cri-
tiques are more likely to be important when a production function is used, others are of
more general validity and could also apply to a cost function approach. While we will analyse
these “more general” critiques when discussing the production function approach (mainly
because it is in that context that were first formulated (see, for instance, Holtz-Eakin, 1994
and Sturm and De Haan, 1995) their more general validly should be borne in mind.
3.1 The production function approach
The production function approach to the study of the effects of public infrastructure on eco-
nomic growth and productivity starts from a neoclassical production function like the one
represented in equation 1:
),,,( ttttt KGLKPAFY =
Y represents output, KP represents the stock of private capital, L the number of employed
workers (or the number of hours), KG, generally measured in monetary terms, represents
either the overall stock of public capital, or narrower aggregates like core infrastructure and
transport infrastructure and A represents the total factor productivity level of the country. KG
is inserted in the production function as an additional input.
Most studies (and virtually all the older ones) assume a Cobb-Douglas functional form for
equation 1:
γαβttttt KGLKPAY =
Equation 2 is commonly estimated in logarithm form:
ttttt kglkpay εγαβ ++++=
Where tε is the usual error term appended to the regression equation. Some authors esti-
mate a version of equation 3 with other additional regressors, like a capacity utilisation index
to account for business cycle fluctuations and a time trend, or assume constant returns to
scale to private inputs or to all inputs.2
If a version of equation 3 is estimated with panel data, it could be re-written as:
itiittitiit tkglkpay εγαβ +++++=
The subscript i denotes the cross sectional unit (e.g. a US state, an OECD country, a Spanish
region or a specific sector) and t the time dimension (usually year). The ia denotes an “indi-
vidual” effect which accounts for any unobservable time invariant factor that might affect
the productivity of each unit of observation (for example the level of level of managerial abil-
2 Some authors (see, for instance, Sturm and de Haan, 1995) test for the validity of the constant re-
turns to scale assumptions, others do not. In the appendix it is explicitly mentioned whether or not untested assumptions like constant returns to scale are made.

Annex 6 to COMPETE Final Report: - 15 - Impact of transport infrastructure on economic growth
ity, institutional features of the country/region, etc), and it is a vector of time dummies which
accounts for any shock which is common to all units of observation (e.g. a fiscal stimulus
from the central government in a given year, or the effects of neutral technical change).
The γ coefficient represents the elasticity of output with respect to public infrastructure capi-
tal, as it tells how much output would increase if the public infrastructure stock were in-
creased by 1 per cent. It can be shown that YKGMPKG /*)(=γ , where KGMP is the mar-
ginal product of KG, i.e. the increase in GDP brought about by a unit increase in KG. The
marginal product of capital is taken in some studies as a measure for the rate of return of
public infrastructure: however, as it depends on the public capital to output ratio, most stud-
ies prefer to report the elasticity measure, which is invariant to the units of measurement.
A first set of criticisms of using equations 3 and 4 relate to the assumption of a Cobb-
Douglas functional form to represent the underlying production technology. The Cobb-
Douglas is in fact a very simple and convenient representation of the production technology,
but it is based on some simplifying assumptions that often do not hold true in the data. For
instance, the Cobb-Douglas imposes a unitary elasticity of substitution between inputs which
implies, among the other things, that increases in public capital are assumed to raise the mar-
ginal and average product of both labour and private inputs. Furthermore, returns to scale
are independent of the scale of output, thereby “forcing” the same value for returns to scale
to hold for every observation unit (Portugal and Germany in a panel of EU countries, for in-
stance). These drawbacks of the Cobb-Douglas production function led some economists
(Everaert and Heylen, 2004 among the others) to estimate the more flexible translog produc-
tion function, which adds squares and cross products of each input as additional regressors.
However the translog tends to consume degrees of freedom and suffers of strong multicol-
linearity problems: as a consequence, the Cobb-Douglas is still widely used, even if there
seems to be a trend of abandoning the production function approach altogether for the cost
function and VAR framework (see below).
A second criticism moved to equations like 3 and 4 is that the public infrastructure stock is
treated symmetrically to the private inputs, which would be strictly valid only if it could be
safely assumed that there exists a market determined unit price of public infrastructure that is
known to individual firms (Duggal et al, 1999): as these conditions are unlikely to hold, pro-
duction functions like those in equations 3 and 4 are likely to violate standard marginal pro-
ductivity theory according to which input factors are paid according to their marginal prod-
uct.
A series of issues arise in the estimation of time series regressions like those exemplified by
equation 3. The first is the spurious correlation result that might arise in a time series frame-
work when some variables used in the estimation are not stationary. In very simple terms, a
time series is stationary when the first two moments of its statistical distribution (i.e. its mean
and variance) are constant.3 Ordinary econometric techniques are not well suited to deal with
3 And the value of the covariance between two time periods depends only on the distance between
the two periods and not on the actual time at which the covariance is computed. See Greene (2003) for a discussion of stationarity.

- 16 - Annex 06 to COMPETE Final Report: Impact of transport infrastructure on economic growth
non-stationary time series and the usual inference procedures are in general not valid. The
problem is that the time trends in non-stationary variables might lead to identify a close rela-
tionship between variables when in fact none exists. While some early studies like Aschauer
(1989a) did not test for stationarity, subsequent ones did: in particular, if the series are not
stationary, first differences of the series in general are (even if that should be tested rather
than assumed). Therefore many studies estimate versions of equation 3 in first differences.
While in principle the estimation in first difference should yield similar results to that in levels,
in practice it ignores the long run relationship that might exist between the variables,
“throwing-out” valuable information. It is however possible that equation 3 represents a
long run relationship even when the variables are not stationary, if the variables move to-
gether in time, i.e. if they are cointegrated: more recent studies have therefore employed all
the “battery” of statistical procedures to test for stationarity and cointegration. The empirical
evidence suggests that neglecting the non-stationary aspects of time series could be seriously
misleading. For instance, Sturm and de Haan (1995) found that the estimation on US data of
an equation similar to 3 yielded a positive and statistically significant elasticity of public capi-
tal, whereas the estimation of the more appropriate first difference version of the equation 3
yielded a lower and not statistically significant elasticity.
Production functions like these represented in equation 3 and 4 have been usually estimated
assuming that capital and labour are exogenous: however, it is well known that production
functions are likely to suffer from simultaneous equation bias which might arise for a variety
of reasons. For instance, in a panel data context, simultaneity might arise because the ia in
equation 4 are correlated with the inputs (for instance because some country specific shocks
which increase output might be correlated to, say, labour input): in this case the fairly stan-
dard fixed effects estimator will remove the simultaneity problem.4 However, simultaneity
might arise also because input quantities are correlated with the itε in equation 4, a fact that
has been often neglected in the empirical literature on the effects of public infrastructure on
economic growth: in this case, conventional estimation of equations 3 and 4 are likely to be
biased.5 It could be observed, in addition, that in the case of equation 4, the conventional
fixed effects estimator will be biased and inconsistent (Nickell, 1981). The simplest solution to
the simultaneity issue is to use simple instrumental variables techniques6: a possibility would
be to first difference equation 4, using as instruments for the endogenous variables appropri-
ate lags of the same endogenous variables (see for an application Holtz-Eakin, 1994).
More attention has been paid to the reverse causality between output and capital: as long as
public capital investment depends on the level of output (for instance because public capital
investment are financed from government savings), there might be a feedback which goes
from output to capital, rather than the other way round, which might cause equation 3 to
4 The fixed effects estimator however relies for the estimation on the time variation within each ob-
servation unit, discarding the potential useful information which is contained in the variation be-tween units (countries, regions). Furthermore, it is a common finding in the empirical literature on production functions that the within variation is sometimes very badly measured, which can make the fixed effects estimates not as reliable as one might think.
5 Unless some restrictive assumptions are made (see Griliches and Mairesse, 1998). 6 Like these based on the generalised method of moments.

Annex 6 to COMPETE Final Report: - 17 - Impact of transport infrastructure on economic growth
overestimate the elasticity of output with respect to public capital.7 Canning and Bennathan
(2000) have provided a useful example, as they assume that capital investments depend on
output according to the relation:
ttt dKYsK −=∆ )(
where s(Yt) is a saving function and d the depreciation rate. In the long run, the previous
relation implies that:
dYs
K tit
)(=
which shows how output might “cause” the public capital stock.
The reverse causality between output and the stock of public infrastructure has been dealt
with in different ways.
One possibility is to use instrumental variable techniques such as those described above,
which in general requires data in the form of a panel but do not require further information.
Fernald (1999) argued that if one has access to sector level data, an indirect test of the im-
portance of reverse causality would be to explore the magnitude of public capital elasticity
across different sectors. In fact, according to Fernald (1999), if the results showed that
changes in transport infrastructure were particularly productivity enhancing in sectors that
are intensive users of transport relative to other sectors of the economy, then it might be
argued that reverse causality is not a major issue, as we should not expect any higher effect
of public infrastructure in transport intensive sectors relative to the economy if transport in-
frastructure were in fact endogenous.
Cohen and Morrison (2003), in a cost function framework, tested for and could not reject
the exogeneity assumption of public infrastructure (highways in their case): the intuitive ex-
planation that they gave for their finding was that policy decisions are not likely to be driven
by economic conditions in the manufacturing sector of a state, given the relatively small
share of manufacturing costs over output (note that their sample was made up of the manu-
facturing sectors of 48 US states). This implies that samples where the cross sectional units of
observations are single (often manufacturing) sectors, the reverse causality issue might be less
likely to be important: of course, restricting the focus to the manufacturing sector is likely to
underestimate the overall benefits to the economy as a whole brought about by investments
in public infrastructure capital.
Canning and Bennathan (2000) argued that, under particular assumptions that they think are
in general backed by empirical evidence, the use of panel data could help overcome the re-
verse causality problem as it would be possible to estimate equation 4 with a simple dynamic
7 The direction of the bias is however not completely clear a priori, because as long as public capital
investment is undertaken as a countercyclical policy, we will tend to see high public capital stocks as-
sociated with relatively low level of outputs, implying that the estimation of equation 3 might under-
estimate γ if the cyclicality in the data is not adequately accounted for.

- 18 - Annex 06 to COMPETE Final Report: Impact of transport infrastructure on economic growth
ordinary least squares technique with no need to use instrumental variable methods, pro-
vided that the variables in equation 4 are integrated of order one, the production function
relation 4 is homogenous across countries and the investment relation 6 differs across coun-
tries.8
Other contributions have dealt with the reverse causality issue in a more structural approach.
While the details might differ, the basic idea has been to estimate equation 4 jointly with an
“infrastructure equation”. Examples of this strategy are Charlot and Schmidt (1999), Cadot
et al (1999), Cadot et al (2004) and Kemmerling and Stephan (2002). The basic idea behind
these studies was to endogenise public infrastructure by building an equation which seeks to
explain the process driving public capital formation (a part from GDP) and to estimate it
jointly with the production function using appropriate estimation techniques.9
3.2 The cost function approach
The production function is a technological relationship which tells the maximum possible
output that can be produced, given the input quantities. As such, it does not impose any
economic assumption on producer’s behaviour.
By way of contrast, the cost function is built on the assumption that, given market deter-
mined input prices and conditional on output Y and on other technical variables Z, producers
combine inputs to minimise the costs of producing Y. A cost function can therefore be repre-
sented as:
),,,(),,( KGTYWCZYWCC ==
W is a vector of factor prices (usually labour, capital and intermediate inputs), Y is the output
level and Z are technical variables beyond the control of the firm. Usually, Z variables are rep-
resented by a time trend (as a proxy for the time varying level of technology) and KG, the
stock of public infrastructure, which the firm is assumed to take as a public good, for which
no price is paid (and which therefore can be seen as an externality for the individual firm).
It is sometimes assumed that private capital is fixed in the short run, and therefore a variable
cost function -which has the private capital stock as one of its arguments- is estimated:
),,,,(),,( KPKGTYWVCZYWVCVC ==
In the cost function framework, input quantities and costs are endogenous, while factor
prices and output levels are assumed exogenous. While the assumption of exogenous factor
prices is usually defendable —especially in panels where the units of observation are (rela-
tively small) individual economic sectors or (probably to a lesser extent) regions — the en-
dogeneity assumption of output might be perhaps more problematic, even if most of the
literature seems to have implicitly assumed away this problem.
The Cobb Douglas functional form has rarely been used for cost functions (see, for instance,
La Ferrara and Marcellino, 2000), while flexible functional forms like the Translog or the Gen-
8 See Baltagi (2001) for a discussion of stationarity and cointegration in a panel data setting. 9 Another study that have attempted to estimate simultaneous equation models to solve the reverse
causality bias is Esfahani and Ramirez (2003).

Annex 6 to COMPETE Final Report: - 19 - Impact of transport infrastructure on economic growth
eralised Leontief have proved to be much more popular among applied researchers. These
two functional forms are flexible because, unlike the Cobb Douglas, they do not impose any
a priori restriction on the technology (see above). Flexible functional forms however require
the estimation of many more parameters than the simpler Cobb-Douglas and they often suf-
fer from severe multicollinearity problems that tend to reduce the precision of the estimates.
However, the multicollinearity problem is in part reduced because, using economic theory,
the cost functions in 6 or 7 are usually estimated together with the conditional input demand
equations10: the joint estimation of the cost function and the input demand equations as a
system allows additional degrees of freedom and ensures more efficient (i.e. precise) parame-
ter estimates.
An additional advantage of the cost function over the production function approach that has
been extensively exploited in the empirical literature, is the possibility of estimating the effect
that public infrastructure has on private sector demand for private inputs or, to put it another
way, the estimation of a cost function allows the researchers to test whether the stock of
public infrastructure is a substitute or a complement for each private input — for instance, it
is possible to test the a priori reasonable intuition that public infrastructure is a complement
to private capital (i.e. an increase in the former tends to increase the efficiency of the latter,
leading to higher production).
The information directly provided by the cost function is not directly comparable to that
which researchers can derive from the estimation of a production function. While the latter
provides a value for the elasticity of output with respect to public infrastructure, the former
provides information on the elasticity of costs with respect to public infrastructure:11 if that is
negative, then private costs fall when the stock of public infrastructure is raised.12 From the
elasticity of costs with respect to public infrastructure, it is possible to compute the effect
that an extra euro of public infrastructure has on the private sector in terms of cost savings in
a given year — the gross return of public infrastructure, also known as the shadow price of
public infrastructure13. The shadow price of public infrastructure can be regarded as the aver-
age benefits accruing each year to the private sector firms when an additional euro is spent
on public infrastructure: a positive value is a necessary condition for the public capital stock
to be “productive”. However, from Society’s point of view, the investment in public infra-
structure also has a social user cost, to which the shadow price should be compared to
evaluate the net benefits of an additional unit of public infrastructure.
10 Which, applying Sheppard’s lemma, are derived as the derivative of equations 6 or 7 with respect to
input prices. 11 See Morrison and Schwartz (1996) for a discussion on when the two measures are equivalent. 12 Some studies (see, for instance, Demetriades and Mamunes, 2000 and Bosca et al, 2002) have also
used duality theory to provide estimates of the elasticity of output with respect to public infrastruc-ture, in order to enhance the comparability with that part of the literature that adopts a production function framework.
13 The shadow price of public infrastructure is measured as minus the derivative of the cost function with respect to the stock of public infrastructure, so that a positive value means that an extra unit of public infrastructure reduces private costs.

- 20 - Annex 06 to COMPETE Final Report: Impact of transport infrastructure on economic growth
Nevertheless, as noted by Morrison and Schwartz (1996), building a social user cost of public
infrastructure is not an easy task: first of all, it is necessary to specify a depreciation rate and
an opportunity cost of public funds. Furthermore, public capital is financed out of distortion-
ary taxation, which is well known to impose a cost on the economy (the marginal cost of
public funds due to the excess burden of taxation). Morrison and Schwartz (1996) have com-
puted the social user cost of public infrastructure for the US states, assuming depreciation
rates similar to these used for private capital, using the Moody Baa bond yield on public in-
vestment as a proxy for the opportunity cost of public funds and adopting a range of as-
sumptions taken from the literature for the marginal cost of public funds. However, the diffi-
culties in building the social user cost has led many authors to assume it to be zero, or to
simply warn the reader that the net benefit of public infrastructure is likely to be lower than
what the shadow price might suggest. A further issue is that the few studies that have com-
pared the shadow price and the social user cost of public infrastructure have implicitly as-
sumed that the benefits to consumers are zero or negligible, even if this is unlikely to happen
in practice, as consumers may gain from more investment in public infrastructure (for in-
stance in terms of increased leisure if the infrastructure reduces journeys’ times).
Cost functions could also be used (see, for instance, Morrison and Schwartz, 1996) to quan-
tify the contribution of infrastructure capital to the rate of growth of total factor productivity,
even if this use of the cost function has been less popular among applied researchers. Morri-
son and Schwartz (1996), for instance, have shown that the total contribution of infrastruc-
ture capital to total factor productivity growth can be decomposed into a direct and an indi-
rect effect and that a positive shadow price of public infrastructure is not a sufficient condi-
tion for public infrastructure to foster total factor productivity growth.14
We mentioned above that the assumption that output is exogenous is not a minor one. This
has led some authors (see, for instance, Demetriades and Mamuneas, 2000) to estimate a
profit rather than a cost function. The profit function is the result of producers who choose
input and output quantities, given output and input prices, in order to maximise firms’ prof-
its.
This yields a function analogue to equation 7 above:
),,,(),,( KGTWPZWP Π=Π=Π
The profit function has, as arguments, the input and factor prices, assumed exogenous, and
a trend variable to proxy for technical progress and the stock of public infrastructure.15 Al-
though the theoretical advantages of the profit function approach are fairly clear, whether,
from a methodological point of view the profit function is to be preferred to the cost func-
tion in empirical studies is not entirely clear— so far, the latter is still a much more common
14 For public infrastructure to have a positive impact on productivity growth, it is necessary that, given
a positive shadow price, the rate of growth of public infrastructure more than keeps pace with out-put expansion and “therefore has an impact in addition to the required input [public infrastructure] increase to support output growth” (Morrison and Schwartz, 1996).
15 An example of a profit function is Demetiades and Mamuneas (2000) who have estimated a variable profit function (which differs from 9 as it has the stock of private capital as an additional regressor because private capital is assumed fixed in the short run) within a system of simultaneous equations derived from an intertemporal profit maximisation framework.

Annex 6 to COMPETE Final Report: - 21 - Impact of transport infrastructure on economic growth
approach among applied researchers who have however not yet addressed, to the best of
our knowledge, issues such as reverse causality or output endogeneity in a cost function
framework.
3.3 A theoretical comparison of the two approaches.
From a theoretical perspective these two approaches are very similar and in some special
cases they are exactly the same. Let’s start by assuming that transport infrastructure affect
costs. We can write a production function ),( nkfy = and a cost function )()( tkitnwc += where we assume that t is larger than one so that total costs are higher in
the presence of transport costs16. We can write the profit maximisation problem as itkwtnnkpfcpy −−=−= ),(maxπ so that the first order conditions would be
ptdk
dfi 1=
and p
tdndfw 1
=.
In the alternative approach we can imagine that labour costs t have a negative effect on the
productivity of labour and capital so that we could write )1,1( n
tk
tfy =
while firms pay the
costs of capital and labour not corrected for transport costs: ikwnc += . The maximisation
problem would become ikwnn
tk
tpfcpy −−=−= )1,1(maxπ
and the first order condi-
tions would be equivalent:
dknkdf
tp
dknkdf
pi ttt ),(1),( 111
== and dn
nkdft
pdn
nkdfpw ttt ),(1),( 111
==
3.4 The VAR approach17
As discussed in previous sections, empirical studies that have assessed the impact of public
infrastructure capital on output and productivity have adopted a “structural” approach,
based on either the production or the cost function. Vector autoregressive models (VAR),
instead, impose less theoretical a priori restrictions between the variables:18 for instance,
while the production function estimation is carried out assuming a causal relation which goes
from private and public inputs to output, VAR models do not impose any causal link, but
rather they facilitate the ascertaining of whether there are substantial feedback effects which
goes from, say, output to the stock of public infrastructure. Furthermore, while the produc-
tion function approach specifies the impact of public infrastructure on output, given the
other variables in the model, the VAR approach estimates of the long run effect of public
infrastructure on output incorporate both the direct effect that public infrastructure has on
output and also the indirect effects (e.g. through the impact that it has on private inputs). An
16 Of course if transport costs enter the function additively they have no effects at the margin. 17 This section draws heavily on Kamp (2004). 18 Roughly speaking, given k variables, a VAR consists of a system of k equations, where each variable
is regressed on past lags of itself and the other k-1 variables.
- 22 - Annex 06 to COMPETE Final Report: Impact of transport infrastructure on economic growth
additional advantage of VAR is that, unlike in the production function approach, the re-
searcher is not forced to assume that only one long run cointegration relation exists between
the variables. Another advantage of VAR is that they can be estimated with simple OLS equa-
tion by equation, even when some of the variables are non stationary.
However, without imposing any restriction on the data, VAR estimates cannot be given a
structural (causal) interpretation, and are therefore not very useful for policy purposes: re-
searchers therefore impose some restrictions on the variables which are based on theoretical
assumptions (for instance, that public capital does not react contemporaneously to shocks to
other variables in the system, or that private capital does not react contemporaneously to
shocks to GDP but is affected contemporaneously by shocks to public capital)19 whose impact
on the main results should be in principal carefully investigated.
Furthermore, the presence of non-stationary data is likely to distort the estimates of impulse
response functions, which are often the main output of the VAR approach, as they tell the
response of macroeconomic variables (like employment, private capital and GDP) to an unex-
pected change in one variable (say, public infrastructure). When non stationary variables are
present, it is therefore necessary, as in the production function approach, to first difference
these variables or, if one or more cointegration relations exist, the VAR equivalent to error
correction models (VECM) could be estimated.
Kamps (2004b) has noted that the majority of VAR studies that have sought to estimate the
impact of public infrastructure on GDP have not reported confidence intervals for the impulse
response functions. This is unfortunate because a positive and large impact of public infra-
structure on GDP could well be not significant, as some evidence reported in Kamps (2004)
seems to suggest. Therefore, in the Appendix, we will carefully report, for each VAR study
analysed, whether or not the results are accompanied by confidence intervals.
4 The empirical evidence
The main aim of this section is to provide an overview of some of the studies that we have
analysed for the literature review on the effects of transport and public infrastructure on
economic growth and productivity.
The tables in the Appendix list all the studies that we have been able to identify so far and
that should provide a robust picture of what can be found in the empirical literature on the
subject. For each study we have identified the authors, year of publication, source, geo-
graphical area (e.g. Spain, German regions, OECD countries, etc), approach (VAR, production
function, etc), a summary of the specification and estimation methodology, sample period,
sample type (time series rather than panel data), sector (total economy or, say, manufactur-
ing sectors), definition of the public infrastructure variable used in the study (public capital,
core infrastructure, transport infrastructure) and the study’s main results. In the light of the
methodological discussion of section 3, the tables in the Appendix should provide sufficient
19 See Kamps (2004b).

Annex 6 to COMPETE Final Report: - 23 - Impact of transport infrastructure on economic growth
information on the type, quality and relevance of the studies that we have analysed in this
literature review.
Having said that, in the remainder of this section we will discuss in some more detail some
studies that we believe represent well the main approaches that have been used in the ap-
plied research: in particular, we will structure the discussion on the basis of the methodologi-
cal approach employed in the individual studies.
A further comment might be important: the scope of the project is to assess the contribution
of transport infrastructure to economic growth. Unfortunately, most of the literature is con-
cerned on the measurement of the effects of public capital: while we believe that that litera-
ture can provide useful insights on the effects of transport infrastructure on economic
growth -given that the latter constitutes a large fraction of public infrastructure and it is rea-
sonable to expect that it is also the most productive- nevertheless we will put more emphasis
on these papers that have focused their attention to narrower definitions of the stock of pub-
lic capital, such as core infrastructure or transport infrastructure rather than the overall public
capital stock.
In addition a number of studies have provided empirical estimates for a series of countries
(either alone or within panel data studies) the bulk of which was made up by EU countries. In
that case we have decided to review the relevant study in the relevant EU section 20
Finally, It is important to note that, given the focus of the project, we have focused the litera-
ture review on the US and EU empirical evidence. Although that covers the large majority of
studies that have been published in the field, it does not exhaust all the international empiri-
cal evidence. There are also for instance some empirical estimates for countries such as Can-
ada, Japan and Australia, plus a series of cross country studies focusing on developing coun-
tries. While not covered in detail in this report, that evidence does not seem to alter signifi-
cantly the main conclusions that could be drawn from the EU and US evidence (see Romp
and de Haan, 2005).
4.1 The US evidence: production functions21
The seminal US paper is Aschauer (1989), to which many later papers are responses. The
main motivation behind this paper is to test empirically the existence of a relationship be-
tween public capital and production. The empirical strategy that the author follows consists
of estimating an aggregate production function of the US economy. He defines public infra-
structure as federal, state, and local capital stock of non-military equipment and structures.
The paper finds that non-military public capital has positive and significant effects on aggre-
gate output. His empirical exercise estimates the elasticity of production with respect to pub-
lic capital at 0.35. Core infrastructure (defined as motorways, airports, energy facilities, and
water systems) accounts for 55 percent of the effect of public capital on productivity. In addi-
tion to that, he finds evidence of a positive effect of public capital on total factor productivity
20 The tables in the Appendix allows their identification. 21 This section draws heavily on Duran-Fernandez (2006)

- 24 - Annex 06 to COMPETE Final Report: Impact of transport infrastructure on economic growth
and of increasing returns to scale in the production function. These results suggest that pub-
lic expenditure is in fact productive when it is invested in public capital.
The empirical strategy followed by Aschauer (1989) is now a common methodology in eco-
nomic literature to the point of being known as the ‘production function approach’, as dis-
cussed in section 3.1. His results raised several questions and prompted many further studies
of the effects of public infrastructure on the economy. Although few authors have ques-
tioned that infrastructure should be expected to have an impact on production, the magni-
tudes of the effects estimated by Aschauer have come under considerable challenge. An elas-
ticity of 0.35 implies a return rate of public infrastructure considerably higher than the asso-
ciated returns to private capital. This result also implies a severe shortage of public capital in
the US (in fact, the paper suggests that the reduction in infrastructure investment can be
identified as the main cause of the productivity slowdown that the US experienced in the
1970s and early 1980s).
One criticism of Aschauer’s study is that the aggregate correlation that he finds does not
imply any causal relationship between production and infrastructure. Garcia-Mila et al (1996),
and Evans and Karras (1994) suggest that if these variables are non-stationary, this relation-
ship might reflect only a spurious correlation. A more fundamental criticism concerns the
causal direction of any correlation: do public capital increments actually cause economic
growth, or does the causality operates in the opposite direction?
Other attempts to review Aschauer’s work focus on the estimation of aggregate production
functions at state level, such as Evans et al. (1994), Garcia-Mila et al (1996), Hotz-Eakin
(1994), and Kelejian et al. (1997). Conceptually, these papers follow the same empirical
strategy (based on panel data) and in most cases use the same definition of public capital.
The main advantage of this panel data approach in this context is that state level samples are
large enough to produce more reliable estimates than would be obtained by a time series
approach. The most important problem is the lack of primary data on public capital stock at
state level. Consequently, these studies have to use estimated figures for this variable. In
general, the estimated magnitude of the effect of public capital on production tends to be
considerably smaller or even negligible under this approach.
Hotz-Eakin (1994) replicates Aschauer’s (1989) analysis using state level data for the 48 con-
tiguous states, and finds results that contradict Aschauer’s original estimations. The empirical
results of the paper fail to show evidence of a positive relationship between public capital
stock and production both at absolute levels and growth rates. This result is robust under
different econometric specifications, aggregation levels of the infrastructure variable, and
estimation techniques. Garcia-Mila et al. (1996) repeat this study using essentially the same
econometric approach and dataset. The contribution of this paper is the consideration of
alternative measures and desegregated levels of public capital, confirming that at the state
level, the effects of public capital stock on absolute production levels are negligible. This pa-
per also performs formal tests that fail to reject endogeneity of public capital.
The empirical estimates in Evans and Karras (1994) imply that public capital has negative pro-
ductivity. He studies the relationship between production and public capital both at absolute
levels and growth rates. The explanation he offers is linked to an oversupply of public infra-
structure in the US. He argues that this is not the case for current government expenditure,

Annex 6 to COMPETE Final Report: - 25 - Impact of transport infrastructure on economic growth
since education spending has a positive effect on output. His results are based on the estima-
tion of a state-level production function that assumes fixed state effects and autocorrelation
in the error term. He suggests that the assumption of non-correlated errors in previous stud-
ies is the origin of biased estimates of the effect of public capital on production.
In Hotz-Eakin et al. (1995), a slightly different methodology is followed to analyse the effects
of public capital on economic growth. Rather than estimating output elasticity, this paper
develops a neoclassical growth model, which incorporates infrastructure capital. Using the
Seemingly Unrelated Regression (SUR) technique to estimate a set of simultaneous equations,
this paper concludes that public capital does not have an important quantitative role in ex-
plaining the growth patterns across states in the US.
The use of panel data answers some of the criticisms of Aschauer’s paper. However, it also
raises a puzzle: under some empirical strategies, the results not only estimate smaller returns
to public capital, but also contradict the idea of public capital as a productive input. Kelejian
et al. (1997) exemplify the extension of the lack of robustness of this approach. They use
data for the US 48 contiguous states to estimate state level production functions under sev-
eral econometric specifications. They conclude that the estimated elasticities are not consis-
tent, since the estimated effect varies its sign, magnitude, and significance level depending
on the chosen econometric specification and estimation technique. Moreover, it appears that
the robustness problem is not related to the quality of data, since more disaggregated defini-
tions of public capital do not generate consistent estimators.
Following the same line Garcia-Mila et al. (1996) find that there is no evidence of a positive
linkage between public capital and private output when studied within the aggregate pro-
duction function framework. Their results however are assessed within a very narrow frame-
work that does not exhaust all possible methods for examining the linkage between public
capital and productivity.
One promising strategy to address these puzzling results is the analysis of industry level data.
If the effects of public capital were unevenly distributed across industry sectors, this approach
would allow identifying industry specific effects not captured at the aggregate level. More-
over, the analysis, would give some insights about the mechanism through which public capi-
tal impacts economic activity.
Following these research lines, Fernald (1999) presents an industry level empirical analysis on
the effects of public infrastructure on economic activity. He focuses on road infrastructure,
arguing that production depends on transport services as an additional input factor to labour
and private capital. In his model, he proposes that transport services depend upon the flow
of services provided by the aggregate stock of public roads, as well as the stock of vehicles of
the industry. This theoretical framework presents an interesting feature that can be applied
to the study of public capital and economic activity. In particular, it implies that positive varia-
tions in road stock should be associated with more-than-proportional changes in productivity
growth of vehicle-intensive industries. According to the model, if roads have neutral effects
on productivity, changes in road infrastructure should not imply any particular relationship
between vehicle intensity and relative productivity performance.

- 26 - Annex 06 to COMPETE Final Report: Impact of transport infrastructure on economic growth
The empirical estimation of Fernald’s (1999) model reveals a positive output elasticity with
respect to road stock of 0.35, quite similar to Aschauer’s (1989) original estimation. How-
ever, the return rate that this elasticity implies is implausible, raising again the original critique
to Aschauer’s work on the magnitude of this effect. On the other hand, the paper goes fur-
ther and analyses the stability of the estimated elasticity, finding that although the extensive
road investment of the 1950s and 1960s had a very high marginal productivity, the produc-
tivity of roads is statistically significantly smaller after 1973. Quantitatively, the paper suggests
that between 1953 and 1973, the average contribution of road infrastructure to GDP was
1.4 percent per year, dropping to 0.4 percent after 1973.
The empirical analysis also makes clear that the estimated effect of road infrastructure into
productivity is smaller in the non vehicle-intensive industries, pointing out the direct causality
of this effect. The author argues that the construction of the interstate motorway system
between the late 1950s and early 1970s substantially boosted US productivity. However,
these findings should not be read to imply that similar levels of investment in road infrastruc-
ture would have the same return in the margin today. In plain words, he concludes that it is
unlikely that the high returns of the interstate motorway system could be replicated by build-
ing a second network –i.e. that the stock of existing roads matters in determining the mar-
ginal effects.
An interesting implication of Fernald (1999) is that the traditional Cobb-Douglas production
function specification might not be the most accurate way to model the actual behaviour of
public capital. If marginal productivity of public capital presents extra normal returns at low
levels of accumulation and diminishing returns at higher levels, it makes sense to model pub-
lic capital using a standard neoclassical S-shape production function. In Duggal et al. (1999),
time-series data for the US is successfully fitted using this specification. In this paper, the au-
thors find that at the 1999 levels of private capital stock and employment, the elasticity of
output with respect to infrastructure was 0.27. This effect is comparable to that found by
Aschauer (1989) when he separates out the effect of core infrastructure. The fitted model
suggests that at the 1999 level of infrastructure and capital, the US economy was close to a
production plateau with respect to labour input.
An attractive feature of the paper by Duggal et al. (1999) is that it models public capital ex-
plicitly as part of the constraining technological parameter A in equation (1), rather than as a
discretionary factor. This specification allows identifying the existence of positive non-linear
effects of the other productive factors on the growth rate of output. Indeed, the model
shows that infrastructure increases as it interacts with higher levels of technological innova-
tions.
An interesting extension of the production function approach is found in Shioji (2001). Based
on an open economy growth model, the paper derives an empirical application that allows
estimating the parameters of a production function. Rather than define a static production
function, they estimate how the economy converges to a steady state. The steady state level
of output is a function of public capital and the change in output for each region depends on
the distance between current output and steady state output. This formulation allows analys-
ing the dynamics of the effect of public capital, and determining the convergence rate of the
economy, conditional on infrastructure stock. This methodology is commonly referred to in

Annex 6 to COMPETE Final Report: - 27 - Impact of transport infrastructure on economic growth
the economic literature as the convergence approach. In this paper, it is applied to the analy-
sis of US states data and Japanese prefectures.
The estimations of this paper show that the effects of public infrastructure in the US and Ja-
pan are similar. The empirical analysis supports evidence of convergence across regions for
both Japan and the US. However, the convergence rate for the US is higher, possibly cor-
roborating the presence of larger idiosyncratic differences across states. The long run equilib-
rium elasticity of infrastructure is estimated in a range between 0.09 to 0.143 for the US, and
0.10 to 0.169 for Japan. These values are considerably lower than the short run elasticities
estimated in previous literature, suggesting the contribution of public capital to economic
growth is small, but not negligible.
The estimated marginal product of infrastructure is larger than that of private capital in both
countries, suggesting a shortage of public investment in both countries; however, a growth
accounting exercise suggests that the contribution of public infrastructure in the post-war
period has been modest.
From a theoretical point of view, the expansion of public capital stock in one region might
cause spillover effects in neighbouring regions. The direction and magnitude of these effects
in general depend on the mobility of input factors. Under assumptions of perfect mobility of
production factors, a positive variation of public infrastructure in any location increases the
marginal product of private input factors (labour and capital) in all regions. This increment is
reflected in higher wages and higher private capital return rates, as well as in labour and
capital migration to the region with more public capital.
On the other hand, under the assumption of imperfect mobility of production factors, an
unbalanced expansion of public capital investment across regions might lead to a worsening
in the payment of the non-mobile factor in the region with less public capital stock. At local
level, this effect can be interpreted as negative spillovers of public capital. An interesting ex-
tension of this argument is that the effect of an expansion of public capital at aggregate lev-
els is ambiguous, since it depends on the relative magnitude of the negative spillover, and
the relative size of the local economies that are affected. In Boarnet (1998) these arguments
are formalised in a two-city location model.
Boarnet (1996) presents an empirical extension of the two-city location model to analyse the
spillover effects of public capital at local level. Using disaggregated information at county
level for California, the author estimates a production function finding that public infrastruc-
ture has a positive and significant effect on output. Due to the availability of data, the author
narrows his investigation to a definition of public infrastructure that only includes street and
highway capital in urban areas. Depending on the econometric methodology, this value is
estimated between 0.16 and 0.22, considerably smaller than the estimation obtained with
national aggregated data. The paper finds evidence of negative spillover effects: under dif-
ferent specifications, public investment in infrastructure in neighbouring counties appears to
have a negative and significant impact. The implications at the aggregate level are ambigu-
ous: as long as the direct positive effect of public capital exceeds its negative spillovers, the
aggregate value of infrastructure might be positive.
- 28 - Annex 06 to COMPETE Final Report: Impact of transport infrastructure on economic growth
Boarnet (1996) assumes that spillover effects can only be transmitted across geographically
contiguous locations. In an extension of this paper (Boarnet (1998)) the author considers al-
ternative transmission mechanisms that are more likely to lead to spillover effects in locations
with similar industry and economic features. In this paper, the author extends the results of
his first study, finding that public infrastructure negative spillovers are stronger across loca-
tions with similar urbanisation level. As in Boarnet (1996), the paper finds evidence of posi-
tive direct effects of infrastructure capital — however, these effects are smaller than in earlier
literature. Finally, the paper suggests that the most important gains of public infrastructure
are found at the local level, and that these gains have important distribution effects across
locations.
A few comments on the main findings of the production-function approach are warranted.
The Aschauer (1989a) paper highlighted the importance of public capital on economic activ-
ity: although some early papers broadly confirmed his main findings, there seems to be a
consensus that the early estimates of the effects of public capital on economic activity over-
stated the magnitude of the effect. Moreover, the econometric methodology that the early
papers used is subject to severe critics. Furthermore, it was generally found that studies based
upon state level information, tend to generate smaller estimates, and solve some of the
econometric problems found in the earlier literature. However, in general they failed to esti-
mate robust results in the sense that they were significantly sensitive to the econometric
specification and estimation technique.
Recent work on this topic has incorporated a richer structure, analysing specific effects across
industry sectors and their interaction, spillover impacts at local level, and the implications of
convergence in growth rates. These studies exhibit complex features of this topic that were
often underestimated in the early literature. One issue with the production function approach
is that it imposes a minimal structure on the data. If sufficient structure is not imposed, the
estimated parameters of the underlying production function structure are likely to be biased
and will not be robust. The main problem from a conceptual point of view is that the produc-
tion function is viewed as a purely technological relationship and firms’ behaviour is not con-
sidered explicitly. A more comprehensive approach might consider marginal productivity con-
ditions as well as the production function, independently of whether the subject of analysis is
national, regional, or local level aggregated data (Nadiri et al. 1998).
4.2 The US evidence: cost functions
Despite providing useful information on the linkage between public capital and production,
the production function approach may not capture behavioural responses of firms to varia-
tions in public capital (Nadiri et al. 1998). In particular, most of the early literature does not
take advantage of the extensive framework for the analysis of firm behaviour, technology,
and performance provided in the cost-function based applied production-theory literature
(Morrison et al. 1996).
Morrison et al. (1996) use data for the 48 contiguous US states to investigate the links be-
tween public capital and production. They estimate a cost-function for the manufacturing
sector as well as firms’ demands for input factors, and the short-run pricing rule. The paper
assumes a generalised Leontief specification for the cost function. They aggregate production
Annex 6 to COMPETE Final Report: - 29 - Impact of transport infrastructure on economic growth
factors in four main categories: production-related labour, non production-related labour,
energy inputs, and private capital; a classification followed by numerous studies. The authors
estimate simultaneously all the equations of the econometric specification using SUR meth-
odology. Their public capital definition only considers core infrastructure, defined for this
purpose as motorways, water systems, and sewers.
This paper finds that returns to infrastructure investment are significant. Public infrastructure
has a direct impact on productivity growth, due to a direct cost-saving effect. This impact
ranges between 0.19 and 0.62 depending on the region. Nevertheless, the indirect produc-
tion expansion effect appears to have a negative impact on productivity. This suggests that
sluggish productivity growth may be attributed partly to a shortfall of infrastructure invest-
ment relative to output growth.
Estimated shadow values of public capital range between 0.05 and 0.34 depending on the
region and the year, usually exceeding its social cost; however, this result is not robust under
different methodologies. The author finds important variations at regional level. Moreover,
the positive input cost saving benefit to manufacturing firm from infrastructure investment
declines in all US regions from 1970 onward.
Nadiri et al. (1998) conduct a similar study extending the scope of his analysis to all industry
sectors in the US. The paper uses time-series data for 35 industries in the US to estimate a
standard cost-function. They find that the impact of highway infrastructure on cost reduc-
tions is relatively large in the agriculture, food, transport, trade, construction, and other ser-
vices industry sectors. In most manufacturing industries, cost elasticities range between 0.04
and 0.05 in absolute value.
They also find a positive output effect of infrastructure; concluding however that higher total
production costs associated with output expansion are financed almost entirely by cost saving
productivity gains. The results imply that the marginal benefits of motorways capital are posi-
tive in all but three industries. For most industries, particularly manufacturing, the marginal
benefit of a $1.0 increase in highway capital range between 0.2 and 0.6. This assessment
does not consider congestion effects.
The paper suggests that motorway infrastructure has a positive contribution to productivity
growth in all industries. At an aggregate level highway capital accounts for about 50 per cent
of total factor productivity growth over the period of study, 1947 to 1991. Moreover, the
estimated elasticities imply that the return rate of public infrastructure is equal to the return
rate of private capital (note that this does not include gains to consumers). One problem is
that these results are not stable through time, implying that the economic impact of highway
capital on producer’s cost has declined since the 1980s. Finally, the paper concludes that
road infrastructure has positive effects on all factor demands but these effects are of differ-
ent magnitudes.
Cohen et al. (2003b) present an extension of the cost-function approach that explicitly incor-
porates geographical spillovers of public infrastructure. They weigh the spillover effect that a
state i has on a neighbour state j using the share of the value of goods shipped between
them in the total value of goods shipped from state i to all its neighbours. They also assume a

- 30 - Annex 06 to COMPETE Final Report: Impact of transport infrastructure on economic growth
spatial auto-correlated structure in the error terms to incorporate the possibility of stochastic
geographical spillovers.
They find a positive and significant effect of infrastructure on productivity, which appears to
increase over time and is augmented by inter-state spillover effects on costs. The estimated
cost elasticity is 0.15 in absolute value. Spatial spillovers complement the cost-saving impacts
of public infrastructure investment. The results imply that most of this cost-saving effect is
likely to be associated with transport costs. Finally, the results suggest that public capital is a
substitute production factor with respect to private capital, intermediate inputs, and non-
productive labour; however, productive labour is a complement input. There is no evidence
of any effect on factor demand derived from infrastructure spillovers. This result suggests
that public capital investment depresses rather than stimulates private capital investment un-
der a spatial autocorrelation framework.
Cohen et al. (2003a) analyse the effects of airport infrastructure on productivity. They con-
sider interstate geographical spillovers as well as spatial autocorrelation, finding that the cost
elasticity with respect to airport infrastructure stock is 0.11. The paper finds evidence of posi-
tive interstate spillovers.
Nadiri and Mamuneas (1994) use a cost-function framework to study the effects of public
infrastructure and R&D on the cost structure of US manufacturing industries. The paper fol-
lows the cost-function approach, considering a broader definition of public capital, which
considers public infrastructure and publicly financed R&D.
The results of this paper suggest that there are significant productive effects from public in-
frastructure and publicly financed R&D. Infrastructure has a direct cost reduction effect that
ranges from zero to 0.21 depending on the industry. The magnitudes of the cost elasticities
for each industry are smaller than those reported in previous studies. There are strong differ-
ences in the cost structures across industries, and because of that, in the effects on the cost
structures. The paper suggests that public infrastructure and publicly financed R&D induce
productivity growth. The main results are that an increase in infrastructure capital services
leads to a decline in the demand for labour and capital in each industry, and to an increase in
the demand for intermediate inputs in most of the analysed industries.
The empirical approach of the cost-function studies presented in this section suggests that
public capital has a positive effect on cost reductions and hence economic growth. However,
the estimated effect appears to be considerably lower than the assessments carried out under
the production function approach. Extensions of this approach explicitly capture spillover
effects as well as time and spatial autocorrelations, with no major changes in the basic re-
sults: public infrastructure still has important effects on firms’ behaviour, and this is reflected
in variations in factor demands. One important implication of these papers is that public capi-
tal has distributive effects on the composition and productivity of firms across regions, and
on industry activities.
The conceptual difference between the aggregate production function and the cost-function
approaches is that they are based on contrasting theories of which variables are exogenous
to firms in the production process. Under the aggregate production function approach, the
implicit assumption is that productive factors are exogenously determined, and firms take

Annex 6 to COMPETE Final Report: - 31 - Impact of transport infrastructure on economic growth
their decisions based on the availability of these factors. Under this approach, the idea is to
assess whether positive variations of public capital stock increase production.
On the other hand, the cost-function approach implicitly assumes that input prices, not quan-
tities, are exogenous (Haughwout 2002). Thus, given a price vector and a public capital stock,
firms take optimal decisions on the quantity of private input factors they demand. Public
capital can be analysed from different perspectives: its impact on productivity, and its impact
on cost structures. However, this framework, extensively used in the analysis of individual
competitive firms, may not be satisfactory for describing production behaviour at large re-
gional levels of aggregation. Regions such as US states have complex factor markets in which
some authors argue that perfect competition assumptions fail (Haughwout 2002).
4.3 The US evidence: other approaches
Recent literature tackles this problem proposing a new microeconomic approach to the topic.
The proposal consists of estimating an empirical version of the Roback spatial location equi-
librium model. This model assumes two productive factors — labour as a mobile factor, and
land as a fixed one — together with public capital. Firms and households are assumed to be
profit and utility takers respectively. Under these assumptions, the value of non-priced non-
traded regional characteristics — such as climate or infrastructure stock — will be reflected in
differences in local factor prices. The model determines regional wages and land rents
endogenously. It also predicts that prices respond to variations in the level of specific site
productive characteristics (such as infrastructure), and non-productive local amenities. These
regional variations can be exploited to identify the effect of public infrastructure on output,
taking into account both firms and households behaviour.
The empirical strategy to implement this theoretical framework consists of using individual-
level data to fit a hedonic regressions model that relates workers’ wages, and land prices to
specific regional or local characteristics, and public capital stock. In the econometric specifica-
tion workers’ individual characteristics, as well as land particular features are used as controls.
Rudd (2000) follows this strategy using cross-section data of the 1980 US Census and addi-
tional fiscal controls. He finds that the elasticity of output with respect to capital is 0.08, the
elasticity of output with respect to infrastructure capital, defined as water distribution sys-
tems, sewers, and motorways, is 0.12, and the elasticity of output with respect to motorways
alone is 0.07. The model also proves that higher levels of infrastructure capital have a positive
effect on wages and rents in regions, while non-infrastructure capital has little or no effect.
Following the same approach, Haughwout (2002) use data from the American Housing Sur-
vey and a broad definition of public capital of metropolitan areas, to estimate an empirical
version of the Roback model for US cities. This paper finds that the marginal productivity of
infrastructure is estimated to be non-negative but small. Depending on the specification, it
ranges between zero and 0.027.
Despite these findings, the results of the exercise evidence important effects of public capital
on the relative price of input factors. For example, it shows that the elasticity of land value
with respect to infrastructure stock ranges between 0.11 and 0.22; however, an increase of
infrastructure stock has negligible effects on households’ wage income. This description indi-

- 32 - Annex 06 to COMPETE Final Report: Impact of transport infrastructure on economic growth
cates that factor markets capitalise the net benefits of non-traded publicly provided goods.
Moreover, the study shows that households’ willingness to accept lower wages for more
public infrastructure outweighs firms’ willingness to pay higher wages. Since household
benefits are consistently estimated as positive and relatively large, the model has important
distribution implications that suggest that households are the principal beneficiaries of infra-
structure in cities through possibly time savings.22.
An important feature highlighted in this paper, is that these results may be interpreted in a
strict ceteris paribus sense. Since the public sector budget constraint is not explicitly modelled
under this approach, the positive effects on production and wages are in fact the result of
increased infrastructure conditional on tax rates, and public expenditure. Hence, to observe
the exact description of the events described above, public infrastructure increments have to
be financed by exogenous sources. If this assumption is violated, the effects of public capital
on production might be different. This observation opens another research line in the analysis
of the linkage between public capital and production.
4.4 The US evidence: VAR approach
An alternative research line in the study of this topic is the estimation of models that do not
impose any a priori assumption about causality on the data. There are several examples in the
literature, which use vector autoregressive (VAR) models as an alternative approach to the
traditional production or cost function estimations. Besides the flexibility that they offer, an
advantage of VAR models is that they allow testing for the presence of effects between all
the variables of interest, even those which theory may not usually consider.
Pereira et al. (2001b) implement a vector autoregressive error correction VAR/ECM model of
twelve US industries. The model considers for its estimation aggregate industry production,
public and private investment, and aggregate industry employment. The model estimates the
elasticity of aggregate private output with respect to public investment at 0.047. However, in
eight out of twelve sectors, the effect of public investment is negative. The effects of public
investment on employment appear to be very small: in the long-run, 51 long-term jobs are
created per million dollars in public investment. However, the exercise implies that public
investment has a positive effect on private capital investment, with an estimated public pri-
vate capital elasticity of 0.397. Nevertheless, at industry level there is evidence of crowding-in
effects only in five out of twelve. In general, public investment has very different effects
across sectors. It tends to shift the industry composition of employment toward construction
and transport and the composition of private investment to the manufacturing sectors, public
utilities, and communications.
In Pereira (2001a), the author investigates the crowding-in effects of public capital in detail.
Following the same procedure as in Pererira et al. (2001b), the author finds that public in-
22 It should be noted that the welfare gains identified in Haugwout (2002) are not considered in GDP
growth accounting. Nevertheless, they sometimes represent important welfare gains for individuals and families. Furthermore, there are other important economic implications of transport infrastruc-ture that are not considered in GDP computations, such as the impact on the environment, the en-hancement of social networks and so forth.

Annex 6 to COMPETE Final Report: - 33 - Impact of transport infrastructure on economic growth
vestment crowds in private investment. The paper identifies the source of this crowding-in
effect as due mostly to public investment in sewage and water supply systems, and of public
investment in conservation and development structures. At industry level, the crowding-in
effect of public investment is particularly strong only in the cases of industry and transport
equipment.
The results presented above confirm the findings of earlier economic literature. However, the
paper presents a discouraging conclusion that might have important implications on previous
works. The estimated policy function at an aggregate level suggests that changes in the ag-
gregate public investment are positively correlated with lagged changes in aggregate private
output, negatively correlated with lagged changes in aggregate private employment, and
uncorrelated with lagged changes in aggregate private investment. This finding suggests en-
dogeneity of public investment with output. This result is an important caveat that should be
further explored.
4.5 The EU evidence: production functions
We have identified 17 studies that have presented empirical evidence on the relation be-
tween public infrastructure and economic growth and that have used a production function
approach. Of these, 3 (Evans and Karras (1994) Kamps (2004) and Kamps (2005)) used “in-
ternational samples”, while the others relied on national samples; 4 used time series analysis
(with appropriate econometric techniques to deal with non-stationarity issues) with the oth-
ers using a panel data approach.
The evidence displayed in the Appendix tables suggest that most studies estimating produc-
tion functions (or employing the related total factor productivity regression approach) identify
a positive effect of public infrastructure on output and productivity. With some notable ex-
ceptions (for instance, Sturm and de Haan, 1995 and Stephan, 2003 who find elasticities in
the range of 0.6-0.8 and 0.38-0.6523, respectively) the elasticities of output with respect to
the stock of public capital tend to range between 0.10 and 0.20, a far smaller value than the
0.35 originally identified by Aschauer (1989) and more in line with the findings of Munnell
(1990b) who found an elasticity of about 0.15.
For example, Bajo Rubio and Sosvilla-Rivero (1993) estimated a production function using
time series data for the Spanish economy using the Phillips and Hansen procedure and found
an elasticity of output with respect to public capital of about 0.2, depending on the exact
specification of the production function.24 Kamps (2005) followed Aschauer (2000)25 and
estimated an endogenous growth model which allows exploring the non linear link that
might exist between economic growth and infrastructure capital (the non linearity arising
23 This would correspond, in his sample, to a rate of return of about 43-73 per cent and 26-45 per
cent, depending on the output to public capital ratio. 24 They also found that the marginal productivity of public capital was slightly higher than that of pri-
vate capital (0.61 versus 0.36, respectively), which they interpreted as a suggestion that even in the presence of a complete crowding out of private capital, private output would still be increased by increasing public capital.
25 Who built on Barro (1990).
- 34 - Annex 06 to COMPETE Final Report: Impact of transport infrastructure on economic growth
from the government financing public capital through a tax levied on the private sector) and
deriving the growth maximising public capital stock: he found that, for a panel made up of
the “EU-15”, the elasticity of output with respect to public capital was about 0.20, a very
similar result from Kamps (2004a) who reported an elasticity of about 0.22 from a produc-
tion function for a panel of OECD countries. Picci (1999) estimated a production function for
the Italian regions and found, after first differencing the variables to take into account possi-
ble non stationarity, an elasticity of about 0.18.26 Stephan (2001) estimated a production
function for a panel of German and French regions and found a positive elasticity of about
0.08-0.11
A few studies even found negative or insignificant elasticities (Evans and Carras (1994), who
used a panel of five EU countries plus US and Canada, and Delgado and Alvarez (2000) who
used a panel of Spanish regions). Bonaglia et al (2000) and La Ferrara and Marcellino (2000),
using panel data for the Italian regions, found a positive but insignificant elasticity and a
negative and significant elasticity, respectively27. The same authors, however, report that pub-
lic capital significantly increased the rate of growth of total factor productivity and that the
elasticity of output to public capital was about 0.47 which is in a clear conflict with the find-
ings based on the production function28 and that cast some doubts over the overall “stabil-
ity” of the results.29
We have noted above that one of the explanations for the high results of Aschauer (1989a)
was the possibility of reverse causation between public capital and output. The large majority
of studies we have reviewed which employed the production function approach did not in-
vestigate the issue, perhaps taking the view that, in a panel context, allowing for fixed effects
would have been enough to solve the problem (notable exceptions are Bajo-Rubio and Sos-
villa-Rivero, 1993, La Ferrara and Marcellino, 2000 and Percoco, 2004).30 A similar considera-
tion could also be made for the possible simultaneity between output and private inputs.31
26 It is interesting to note that the regressions in levels yield a much higher value (about 0.5). 27 La Ferrara and Marcellino (2000) present estimates that should be robust to reverse causality bias,
even if the simple OLS results do not change the picture significantly. 28 The two approaches should yield comparable results. See La Ferrara and Marcellino (2000). 29 This is a remark that also Sturm and de Haan (1995) made in relation to their own estimates for the
Netherlands. 30 Kopp (2005) built on Fernald (1999) and estimated a model where, given n countries, the difference
between the TFP growth rates in each country and the average TFP growth rate, was regressed on the product between national vehicle intensity and growth in national road services and the product of overall vehicle intensity and overall growth in road services, and found that an increase in na-tional road services would improve, ceteris paribus, national productivity growth relative to the pro-ductivity growth of the n country group. Kopps (2005) argues that his approach allows to deal with reverse causality issues because it is reasonable to assume that countries which use roads more in-tensively (relative to the average) should benefit more from their expansion. In other words, if gov-ernments were simply building roads as a by product of output expansion, there would be no rea-son to expect any particular relation between a country transport intensity and its relative productiv-ity performance. Kopp (2005) also found a rate of return for road infrastructure capital of about 5 per cent.
31 But see what we said above on reverse causality and simultaneity issues in panel data context.

Annex 6 to COMPETE Final Report: - 35 - Impact of transport infrastructure on economic growth
However, a series of papers (Stephan, 2000, Cadot et al, 1999, Cadot et al, 2004 and Char-
lot and Schmidt, 1999) tried to deal with the existence of endogeneity of public capital using
a simultaneous equation framework.
For instance, Kemmerling and Stephan (2002) built a political economy model in which a
production function with public capital was estimated together with two equations explain-
ing the investment decisions by German local authorities and the allocation of funds from
higher tier governments in Germany. Estimating the model using appropriate econometric
techniques, they found that the elasticity of output with respect to public capital was positive
and significant (about 0.17, which would correspond to a rate of return of about 16 per
cent).
A similar approach was followed by Cadot et al (1999 and 2004) for a panel of French re-
gions: they in fact estimated a production function together with an equation to explain the
infrastructure investment decisions and found positive and significant elasticities, in the order
of about 0.08 and 0.10 (which would correspond to a rate of return of approximately 44 per
cent). Interestingly, the estimates they obtained were very close to these obtained ignoring
the endogeneity issue.
Charlot and Cadot (1999) took a similar approach and found large elasticities (about 0.3) of
output with respect to public capital. However, the results do not appear to be particularly
robust, because in a version of the model estimated by 3SLS the value of the elasticity falls
and becomes insignificant.
It is interesting to note that the results reported in some studies seem to be characterised by
significant variability across regions and across time.
For instance, the results for Italy provided by La Ferrara and Marcellino (2000) and Bonaglia et
al (2000) masked quite different elasticities for sub regional aggregates (such as North,
South, Centre) and across time. Public capital seems to have been more effective in stimulat-
ing growth in the south and the centre of the country rather than in the more developed
north32, and the negative elasticity found at the national level for the 1970-1994 period in
Marcellino and La Ferrara (2000) seems to hold only for the 1970s, while in more recent
years it appears to be large and increasing.33
Charlot and Cadot (1999) estimated the model explained above assuming a translog func-
tional form for the production function, which allows them to compute the relevant elastic-
ities for the French regions which made up their sample, and they found high values and
substantial variability (0.17-0.51), with elasticities which tended to be higher in more devel-
oped regions. Another example is Kamps (2004a) who estimated a production function in
first difference using a panel of 22 OECD countries: not only did he pool the observations
together but he also estimated separate regressions for each country. While the panel regres-
32 But see Percoco (2004) for a different result. Interestingly he obtained different results also for the
whole sample, as he found a positive elasticity of output with respect to public capital, although the estimated methodology differed from that employed by both Bonaglia et al (2000) and La Ferrara and Marcellino (2000).
33 However, to compute the estimates for sub regions or sub periods, the authors split the sample, thereby reducing substantially the degrees of freedom of the regressions.
- 36 - Annex 06 to COMPETE Final Report: Impact of transport infrastructure on economic growth
sion yields an elasticity of about 0.2234, the time series estimate show a large variability across
countries: from negative (though insignificant) estimates for Portugal and Ireland, to positive,
large and significant (Germany and The Netherlands, for instance).35
Finally, some studies have reported estimates using different aggregates for the public capital
stock. For instance, Sturm and de Haan (1995) estimated a production function in first differ-
ence, using different aggregates to measure the stock of public capital, like the total public
capital stock, buildings and infrastructure, only buildings and only infrastructure (land, road
and water construction). While the estimates appear in general implausibly high, as noted by
the same authors, infrastructure seems to play a far more important role in stimulating out-
put growth than buildings.
Bonaglia et al (2000) report estimates for a production function where the stock of public
capital is disaggregated into three components: transport, water and others (mainly commu-
nication and education) and found that the transport category has by far the largest positive
(and significant) effect for the country as a whole and for the sub-regional aggregates (with
the exception of the centre, where the elasticity was significantly negative). Similar results for
Italy are reported in Picci (1999) (where core public capital seems to be more productive, with
the exception of the North West of the country) and Destafanis and Sena (2004) (who esti-
mated the relationship that exist between total factor productivity and the stock of public
capital in a panel of Italian regions and found that public capital in general tends to increase
total factor productivity and that the effect is much stronger for core infrastructure than for
non core infrastructure).36 37 It is too early to draw robust conclusions, but the limited empiri-
cal evidence that we have reviewed seems to suggest that core infrastructure (of which
transport infrastructure is a large part) is more productive than non-core infrastructure, as
common wisdom would suggest.
We have mentioned in Section 1 the methodological problems that surround the definition
of one of the few monetary aggregate for the stock of public capital (however broadly de-
fined). Delgado and Alvarez (2000) is the only paper which does not rely on a monetary value
for the stock of public capital. They have collected information on physical measures for
some types of public infrastructure (e.g. km of high capacity roads, km of simple electrified
railways, km of gas pipelines, km of non high capacity roads, km of double line electrified
railways, etc) and used a principal component analysis technique to aggregate these physical
measures into a single infrastructure indicator which they then inserted into an otherwise
standard translog production function that was estimated for a panel of Spanish regions: the
34 He assumes that country fixed effects have an impact on the level of output only, which amounts to
assume that elasticities of public an private inputs are common across countries, which can be re-garded as a quite restrictive assumption, especially in cross-country regressions, where market con-ditions, and levels of economic development can vary widely.
35 We have to note that running the time series regression entails a heavy degrees of freedom loss. Furthermore, some results appear to be quite implausible, such as the 0.8 elasticity for Germany and the US and the 0.9 for the Netherlands.
36 However, the authors do not reports standard errors for the estimates 37 They also report the results form a Vector autoregressive model that suggests that core infrastruc-
ture and total infrastructure are weakly exogenous.
Annex 6 to COMPETE Final Report: - 37 - Impact of transport infrastructure on economic growth
main result of their analysis was that the elasticity of output with respect to the composite
infrastructure indicator was negative (-0.02).38
It is difficult to comment on the overall reliability and “quality” of the results. However, in
general, we might observe that the largest results for the elasticity of output with respect to
private capital could cast some doubts on the overall reliability of the econometric exercise
that produced them. For instance, Sturm and de Haan (1995) observed that their “large”
elasticity of public capital is associated to a really low or even negative elasticity of output
with respect to private capital, a result which is difficult to reconcile with standard economic
theory. In fact, if we make the standard assumptions that private firms combine capital and
labour to maximize profits, we expect, as formally shown, for instance, in standard economic
growth models a la Ramsey that the marginal product of capital will be equal to the real in-
terest rate, which depends, among the other things, on the rate of time preference and the
risk-profile of the investment. A negative of nearly zero elasticity of output with respect to
private capital would therefore be difficult to reconcile with standard economic theory.
In Table 1 we have reported the elasticities of output with respect to private capital, labour
and public capital for some of the studies we have discussed above.
It is difficult to identify a clear pattern between private and public capital elasticities from the
results shown in Table 1. However, the two studies with the highest public capital elasticities
tend to find private capital elasticities which are either negative (Sturm and de Haan, 1995)
or substantially lower than public capital elasticities, while those studies which report the
lowest public capital elasticity also find, in general, much higher private capital elasticities39
We noted above that the finding of a negative or nearly zero elasticity of private capital is not
easy to reconcile with neoclassical economic theory. In general, a natural expectation might
be that private capital should command a higher return than public capital, unless there are
serious shortages of public infrastructure in the economy, because it would seem reasonable
to assume that the risk profile of private investments is generally higher than that of public
investment. However, in financial economics it is not risk per se, but systematic risk (i.e. non-
diversifiable risks, arising, for example, because of a correlation between the risks and the
general economic cycle) that is the driver of returns. Following this insight, it might be ex-
pected that, in fact, public infrastructure expenditure returns should be greater than those
from private capital — for example if transport-using sectors such as freight tended to pro-
duce high returns when the economy in general is doing well but low returns in recessions.
38 No standard errors were reported by the authors. 39 An exception is Cadot et al (2004) who find a private capital elasticity which is higher than that of
public capital but who also find a perhaps unrealistic elasticity of labour which, according to stan-dard marginal productivity theory, it should reflect the share of labour in total income.

- 38 - Annex 06 to COMPETE Final Report: Impact of transport infrastructure on economic growth
Table 1: Elasticities of Output with respect to Public and Private Capital and Labour
Public capital Private capital Labour
Bajo-Rubio and Sosvilla-Rivero (1993)
0.18 0.43 0.39
Sturm and de Haan (1995) 0.63 to 0.80 -0.61to 0.82 0.93 to
Picci (1999) 0.18 to 0.36 0.07 to .17 0.46 to .83
Stephan (20003) 0.38 to 0.65 0.10 to .30 0.26 to .50
Cadot et al (2004) 0.08 0.18 0.77
Kemmerling and Stephen (2002)
0.17 0.57 0.32
Percoco 0.14 to 0.18 0.16 to 0.28 0.62 to 0.72
Delgado and Alvarez (1999) -0.03 0.63 0.25
4.6 The EU evidence: cost and profit functions
We have identified 14 studies that have provided empirical estimates of the effects of public
infrastructure on GDP and productivity: with some notable exceptions, they all find that the
stock of public infrastructure tends to reduce private sector costs. There appears to be sub-
stantial variability across studies, with some finding elasticities very close to zero, sometimes
not even significant, with other studies finding elasticities in the order of about -0.05/-0.1
(which means that an increase of 1 per cent in the capital stock would lead, on average, to a
reduction of private costs in the order of 0.05-0.1 per cent) and, finally, a minority finding
cost elasticities of about 0.20.
Unfortunately, some studies do not report standard errors for the elasticity estimates, and
therefore it is not possible to know whether, say, a negative elasticity was significantly differ-
ent from zero. Furthermore, we have noted above that the finding of a negative elasticity (or
a positive shadow price) is not sufficient to conclude the public capital is indeed optimally
provided: in fact, the shadow price of public infrastructure should be compared with its social
user cost: unfortunately, this has been done only in a few cases, perhaps reflecting the inher-
ent difficulty of deriving robust measures of the social user cost. Furthermore, a few studies
have reported only the elasticity of costs with respect to public infrastructure, rather than the
shadow price, which could be used as a proxy for the gross rate of return of investments in
public infrastructure.
All the studies that we have identified (with the notable exception of Lynde and Richmond,
1993 and Berndt and Hansson, 1992) used panel data on regional samples40 (or on groups of
40 In a few cases the relevant economic unit was the manufacturing sector(s) of the region while in
others the focus was on the total private sector in the region.

Annex 6 to COMPETE Final Report: - 39 - Impact of transport infrastructure on economic growth
manufacturing industries within a country), and this, combined with the flexible functional
forms employed for the cost function, allows the estimation of cost elasticities and shadow
prices of public infrastructure separately for each region (sector). While some papers have
shown that the average elasticity for the whole sample was quite informative of the dynamics
at regional (sector) level, others found that the value for the whole sample (i.e. the country
value) masked quite different impacts of transport infrastructure at regional (sector) level.
Moreno et al (2003) estimated a variable cost function assuming that the private capital stock
was a fixed input in the short run for a sample of 12 manufacturing industries, one for each
of the 15 Spanish regions from 1980 to 1991. They found that the elasticity of variable costs
with respect to the stock of public capital (defined as the stock of core public infrastructure)
was negative (i.e. core infrastructure tends to reduce variable costs) but hardly statistical sig-
nificant, with a similar pattern across regions. For the shadow price of public infrastructure,
they found an average value of 0.00441 (i.e. an additional 1000 pesetas would be worth, for
the private sector, 4 pesetas or, putting it different, public infrastructure would have a gross
rate of return of about 0.4 per cent). They also reported estimates for the elasticity of output
with respect to public core infrastructure and they found a positive elasticity of about 0.03,
much smaller than the “average” result from the production function approach. However,
Moreno et al (2003) found that the effects of public core infrastructure on private sector
costs are far from homogeneous at the sector level: for instance, electric machinery, food and
drinks and textiles seems to be these that have gained most from public core infrastructure,
while metallic minerals, chemistry and non metallic minerals and products these that gained
less.
Similar results were found by Bosca et al (2002) who estimated a variable cost function using
a panel of Spanish regions for the period 1980-1993.42 They in fact found that the average
elasticity of costs with respect to the public capital stock was about -0.03 and it was positive
in 15 out of 17 regions. The elasticity of output with respect to public infrastructure was
found to be 0.026 in the short run, very much in line with Moreno et al (2003). In the long
run, private capital can be adjusted by firms: therefore Bosca et al (2002) report new esti-
mates for the effects of the public capital stock assuming that the private capital stock was at
its long run optimal level. They find very similar results, with the long run elasticity of costs to
public capital being about -0.037 and that of output to the public capital stock about 0.035.
They also compared the shadow price of public infrastructure (or gross return) which (both in
the short and in the long run) is positive in all regions, with an average value of about 0.20
(which means that one more peseta of investment in public infrastructure would tend to re-
duce private costs by about 0.20 pesetas). More importantly, Bosca et al (2003) compare the
shadow price of public capital with a range of values for the user cost of public capital and
find that the former was always higher than the letter, even if the difference narrowed over
time, suggesting that the infrastructure gap in the Spanish economy had been falling over
time.
41 Not significantly different from zero. 42 The study was based on figures for the total economic sector at the regional level.
- 40 - Annex 06 to COMPETE Final Report: Impact of transport infrastructure on economic growth
Favourable evidence for a positive effect of public infrastructure for the Spanish case is also
found in Zugasti et al (2001), who found positive shadow prices for the stock of core public
infrastructure43 estimating a variable cost function for a panel of 14 Spanish industries, ob-
served over the period 1980-1991. The average shadow price (or gross return) was about
0.23 (in a range of 0.07-1.32). They also found an elasticity of output with respect to core
infrastructure that provides an upper bound for the cost function studies, namely 0.24. The
average value masks, however, significant variability across industries, with the construction
sector gaining the most (0.64) and the sector of electric materials much less (0.07).
Canaleta et al (1998) estimate a total cost function using data on Spanish regions and three
distinct sectors, agriculture, industry and services for the period 1964-1991. Their results are
broadly similar to the papers surveyed above, with a slightly higher elasticity of costs with
respect to public infrastructure (in absolute terms): interestingly, that elasticity is higher (in
absolute terms), when a broad measure of capital stock is considered, while it turns out to be
smaller when only public transport infrastructure is considered (in the case of agriculture it
even turns out positive.44 There is however some variation across sectors and regions, and
depending on the infrastructure variable chosen, even if it is not immediate to identify a clear
pattern in those differences.45 The authors try to explore the theoretical possibility that trans-
port infrastructure generates spillover effects, which would make the use of the stock of
transport infrastructure in the single region not appropriate to capture the full benefits of
transport infrastructure. They built a “new transport infrastructure” variable which, for a rep-
resentative region A is given by the average stock of infrastructure in all other regions
weighted by the share in the total flow of trade towards these other regions taken up by
trade from region A. Accounting for spillover effects seems to matter, as they find a small
increase in both cost and output elasticities, even if the increase is not particularly large.
The results for the Spanish case are somewhat supported by the existing empirical evidence
for Greece. For instance, Rovolis and Spence (2002) estimated a total cost function for the
manufacturing sector of Greek prefectures over the 1982-1991 period and found a negative
(-0.06) elasticity of costs with respect to public infrastructure stock, with no significant vari-
ability across regions.46 Though intimately related to the cost elasticity, the shadow price of
public infrastructure does present some variability across prefectures, with those prefectures
that are adjacent to the two large metropolitan areas having the highest shadow prices: in
particular, the average shadow value was about 0.35, with a maximum value of 1.65 and a
minimum level of 0.0004.
Mamatzakis (1999) estimated a total cost function for a panel of 20 2-digit large scale manu-
facturing industries in Greece over the period 1959-1990 and found that public infrastructure
(defined as core infrastructure) tends to decrease total costs,47 although there appears to be
43 The values for the elasticities are not reported but they have by definition the opposite sign of the
shadow price. 44 Standard errors for the estimates are however not reported. 45 A similar pattern is found also for the elasticity of output with respect to public capital. 46 However, it should be noted that standard errors for the estimates of elasticities are not reported. 47 No standard errors for the elasticities are shown.

Annex 6 to COMPETE Final Report: - 41 - Impact of transport infrastructure on economic growth
large differences across sectors, with some displaying positive elasticities (chemicals, tobacco,
textiles, footwear and wearing apparel). He also used the cost function estimates to decom-
pose total factor productivity growth as explained in Morrison and Schwartz (1996) and
found that core infrastructure contributed to only a small portion of total factor productivity
growth in the Greek manufacturing sector, and at a declining rate.
Lynde and Richmond (1993) used time series data for the UK economy to estimate a cost
function and used the results to decompose labour productivity growth into components
attributable to the growth in the private capital to labour ratio, to the growth in the public
capital to labour ratio and to a residual term (which captured the effects of technological
change, scale economies and market power). The result was that the rate of growth of public
capital to labour ratio added about 0.2 percentage points to the rate of growth of labour
productivity (which was 3.15 per cent each year over the sample period) and that over the
1980s the contribution was actually negative.
Some evidence of a positive effect of public infrastructure in reducing private costs can be
found, for West Germany, in a paper by Seitz and Licht (1995) who estimate a total cost
function using a panel of regional manufacturing sectors, with labour and capital as the only
production factor (and using value added, rather than gross output, as output)48 and find a
rather large elasticity of costs with respect to the stock of public infrastructure (-0.21)49, with
higher values (in absolute value) for regions that have largest areas (Nordrhein-Westfalen,
Bayern and Baden-Wurttemberg)50
Less favourable results for the effect of public infrastructure reducing costs is that contained
in La Ferrara and Marcellino (2000) who estimate a Cobb Douglas variable cost function for
Italian regions over the 1970-1994 period and find a positive, but low elasticity of costs with
respect to public capital (i.e. public capital would tend to increase costs). Across sub periods,
they find that only in the 1970s the elasticity was positive, while in the subsequent period it
was negative. However, also in the period 1980-1994, the shadow price of public infrastruc-
ture, though positive, was not high enough to cover its social user costs, suggesting that
there was an overprovision of public capital. At the level of macro-regions, the centre per-
formed better, followed by the South, where the elasticity was negative, but the shadow
price of public infrastructure remained lower than its social user cost.5152 Other evidence in
favour of overprovision of public infrastructure or, at least, of shadow prices than are not
high enough to more than outweigh their social user cost is provided in Berndt and Hanssen
48 We can recall that the implicit assumption underlying the estimation of a value added production or
cost function is that intermediate inputs are separable in the gross production function (Chambers, 1988).
49 No standard errors for the elasticities were provided. 50 Seitz (1994) presents empirical estimates of a cost function estimated with a panel of 31 2-digit
manufacturing industries in West Germany and found very low shadow prices of public infrastruc-ture (somewhat lower when core infrastructure was used rather than total infrastructure: the aver-age value of the shadow price, in the case of core infrastructure, was 0.0036, which means than an extra 1000 DM would have brought about 3.6 DM of benefits for the firms.
51 However, the authors warn about the possibility that their measure of the social user costs could overestimate its true value.
52 Similar results are reported in Bonaglia et al (2000).

- 42 - Annex 06 to COMPETE Final Report: Impact of transport infrastructure on economic growth
(1992), who estimate a labour requirement function53 for the Swedish economy using data
for the period 1964-1988 and show that while public infrastructure had been underprovided
in the early years of their sample, in the later period public infrastructure was actually over-
provided.
Demetriades and Mamuneas (2000) estimate a dynamic model or production based on an
inter-temporal maximization framework using a panel of the manufacturing sector of the 12
OECD countries (the G7 countries plus Australia, Belgium, Norway, Sweden and Finland) over
the 1972-1991 period. They assume that producers maximise the expected future values of
profits taking the public capital stock as given. They solve the model in two stages: in the
first, which corresponds to the short run, the private capital stock is assumed fixed for the
existence of internal adjustment costs and, therefore, firms choose input and output levels to
maximise variable profits. In the second stage firms choose their preferred level of private
capital stock.
This specification of the model allows them to specify the effects of public capital on output
both in the short and the long run. In the short run, public capital can increase output only
directly, and not through its effects on the private capital stock, which is fixed: the empirical
evidence presented by Demetriades and Mamuneas (2000) seems to suggest that public capi-
tal tends to increase output, with elasticities which varies form the 0.36 per cent in the UK to
2.06 per cent in Norway.54 These elasticities do not vary much in the long run, when firms
have fully adjusted their capital stock to their desired optimal level. Unlike other studies (see,
for instance, Rovolis and Spence, 2003, Seitz, 1994, Mamatzakis, 2000, Seitz and Licht, 1995
Everaert and Heylen, 2004) Demetriades and Mamuneas (2000) found that public and private
capital are substitutes, as labour and public capital (this is in agreement with the studies cited
above). As in some of the cost function studies, Demetriades and Mamuneas (2000) compare
rates of returns for public infrastructure (which are the equivalent of the shadow prices in the
cost function framework and which they define as the amount that the manufacturing sector
is willing to pay, in terms of increased profits, for an additional unit of public capital, at the
optimal level of output, capital and labour) to its costs55: in the short run, rates of return
(gross of depreciation) range from 11 per cent in the UK to 27 per cent in Italy, while in the
long run they range from 29 per cent in the US to 39 per cent in Italy.56 Comparing these
figures with their estimates for the user cost of public capital, they conclude that, in the long
run, public capital had been under-provided in all countries, but that the “public infrastruc-
ture gap” had been falling over time for all countries and that for some it was even closed at
the end of the sample period. For instance, Belgium seems to have closed its underinvest-
ment gap in the early 1980s, which is not surprising for the authors, given the extensive road
investment projects that were undertaken in the previous decade.
53 A labour requirement function is related to a variable cost function when labour is the only variable
input. 54 All the elasticities are statistically significant. 55 Unlike some of the studies discussed above, they astray from complications arising from the absence
of lump sum taxation. 56 An interesting features of these figures is that countries with the lowest public capital to output
ratios have the highest returns.
Annex 6 to COMPETE Final Report: - 43 - Impact of transport infrastructure on economic growth
4.7 The EU evidence: VAR approach
An increasing number of studies have been recently published that use Vector Auto Regres-
sive (VAR) models to explore the impact of public infrastructure on economic growth. VARs
seem indeed to have become the standard time series approach in the public infrastructure-
output growth literature, displacing the production function approach, which was more
popular in the early 1990s.
Most of the studies have been conducted at national level only, with only one (Kamps,
2004b) dealing with an OECD sample, and another one with a group of 6 countries (Mittnik
and Neumann, 2001).
Most of the evidence that we have been able to analyse seems to point towards the exis-
tence of a positive effect of public capital on output.
However, as we noted above, some studies suffer from methodological drawbacks (Kamps,
2004): some studies, like Ligthart (2000), specify VAR models in levels, based on the Sim’s
(1980) result that OLS estimates of VAR models in levels are consistent even when the vari-
ables are not cointegrated, neglecting that, unfortunately, the consistency does not carry
through to the impulse response function, which is used to assess the long run impact of
public capital on output. Other studies (like Pereira, 2005, Pereira and Roca-Sagales, 2001)
test for cointegration using the Engle-Granger procedure which does not allow testing for
the existence of more than a cointegration relation. Finally, the majority of studies do not
report confidence intervals for the impulse response estimates, which is rather unfortunate,
as it does not allow concluding whether a positive effect of public capital on output is signifi-
cantly different from zero.
Kamps is one the most recent and comprehensive studies in the public capital/economic
growth literature that relies on the VAR approach. He used a vector error auto regressive
model for 22 OECD countries over the period 1960-2001 to test the relationship which exists
between macroeconomic variables like output, private capital, employment and public capi-
tal. He found that, in the long run, the elasticity of output with respect to public capital was
positive and significant for twelve countries, negative and significant for one and not signifi-
cantly different from zero for the remaining nine.57 It should be remarked that the elasticities
that are in general estimated in VAR models differ from the production function elasticities,
as they incorporate any feedback effect between the variables in the model, as opposed to
the “ceteris paribus” elasticities which are estimated in production function studies. Further-
more, Kamps (2004)’s results58 show that public capital reacts to GDP shocks, which suggests
that public capital is endogenous.
Mittnick and Neumann (2001) estimated a vector error auto regressive model and found (for
a group of six countries: Germany, Canada, Japan, France, UK, The Netherlands) positive but
57 We might note that out of the 9 countries whose elasticity was not significantly different from zero,
8 had a positive value, which might suggest that the studies which fail to report confidence intervals could be misleading.
58 See also Pereira and Roca (2001) and Pereira and Roca (2003) who report evidence consistent with Kamps (2004). However, see Mittnik and Neumann (2001) for a different result.
- 44 - Annex 06 to COMPETE Final Report: Impact of transport infrastructure on economic growth
small elasticities of about 0.1 percent which were significantly different form zero only in the
case of Germany and The Netherlands.
At a country level, there is a lot of empirical evidence for Spain. For instance, Pereira and
Roca (1999, 2001 and 2003) found positive elasticities of output with respect to the public
capital stock, although confidence intervals for the elasticities were not computed. According
to the estimates presented in these papers, long run rates of return of public capital are
about 5-8 per cent.59 Higher rates of return for public investments in transport infrastructure
are found in Pereira and Andraz (2005) for Portugal (15 per cent). Interestingly, they also
examined the impact on output of narrower categories of transport investments, and found
that investments in ports had the highest return, followed by national roads, municipal roads,
airports and railways.
Mamatzakis (1999) for Greece and Flores de Frutos et al (1998) for Spain also concluded that
the effect of public capital on output was positive. However, Sturm et al (1999) for The
Netherlands and Litgarth (2000) for Portugal were not able to detect any positive impact of
public capital on output.
Some additional interesting findings are reported in the series of papers by Pereira and Roca
(1999, 2001 and 2003) who used the stock of transport and communication infrastructure as
their measure for the public capital stock. In their 1999 paper they estimate a VAR model for
the Spanish economy as a whole and, separately, for each region: while the average effect
for Spain was positive (with a rate of return of about 6 per cent), the regional results suggest
that there are strong disparities between regions. In particular, it was the most developed
regions to gain the most from public capital investments in terms of output increase. In their
2001 paper, Pereira and Roca estimated a VAR model for the whole Spanish economy and,
separately, for four distinct sectors (agriculture, manufacturing, construction and services).
Again, while the aggregate result was positive, this concealed different dynamics at sector
level, with the construction sector benefiting the most from public capital (followed by manu-
facturing and services) and with agriculture which was negatively affected by public capital
investments. Finally, in their 2003 paper, they find some empirical evidence supporting the
existence of spillover effects: they estimated a VAR model for the Spanish economy and,
separately, for each of the regions. However, the aggregation for the Spanish economy of
the regional results yielded a considerably smaller overall effect of public capital on output
than the effect which was estimated from the aggregate model: they therefore re-estimate
the regional VAR models with the capital stock of the other regions, as well as the other in-
puts and find out that the overall effect produced by aggregating the regional effects was
very similar to the Spanish aggregate model, suggesting that regional studies that neglect
spillover effects are likely to underestimate the effect of public infrastructure investments on
economic growth.
This latter result, together with those of Cohen and Morrison (2003 a and 2003b) as well as
Canaleta et al (1998) seems to suggest that the incorporation of spillover effects of transport
59 These rates of return are computed from the elasticity figure and the public capital-output ratio to
derive the long run impact (usually 20 to 25 years) of an additional unit of public capital on output and computing the annual rate of return that would produce that increase in output.

Annex 6 to COMPETE Final Report: - 45 - Impact of transport infrastructure on economic growth
networks into economic growth models might be an important step for a better analysis of
the effects of transport infrastructure on economic and productivity growth.
To the best of our knowledge, there is not any robust empirical evidence on both the exis-
tence and the magnitude of transport infrastructure spillovers on economic growth at the EU
level. However, the fact that spillover effects have been identified in the US (as well as in two
EU countries) might suggest that they could be important also for the EU a whole, even if
their magnitude might be different. For instance, spillover effects might be more important
between regions within a state than among countries within the EU, because of the greater
economic integration between the regions of a single country. However, in a more “dy-
namic” perspective, the realisation of a fast network in, say, France, might have important
spillover effects on the growth of, say, Spain and Italy, if, given the relative structure of the
two economies, the new French network would lead to a strong increase in trade and a
higher degree of specialisation in Spain and Italy.
4.8 The EU evidence: a summary
The empirical evidence for the EU countries that we have reviewed seems to suggest that
public infrastructure capital does affect private output. Even if it is difficult to compare such
different studies — for they differ not only for the approach they have chosen, but also for
the sector and sample used in the analysis and for the definition of the public capital stock60
— this main result does not seem to depend neither on the methodology or the nature of
the sample (regions, rather than countries, total economy rather than manufacturing sector)
used in the analysis.
However, different studies produce a wide range of estimates, with the production functions
displaying, perhaps, the upper bound for the elasticity of output with respect to public capi-
tal. We have tried to highlight some of the limitations of the production function studies that
we have reviewed, the most serious of which might be, perhaps, the inability of most studies
to convincingly take into account the reverse causality between output and public capital
(which is likely to be a serious concern if not properly taken into account, as the more recent
time series work using VAR has shown that public capital and output are indeed jointly de-
termined). However, even in the production function approach, a majority of studies seems
to point towards elasticities of about 0.10-0.20, notably smaller than the 0.35 originally iden-
tified by Aschauer (1989).
The studies that have relied on behavioural approaches (i.e. cost and profit function) consis-
tently point towards a positive role for public capital in reducing private sector costs. Even if it
is difficult to find a consistent pattern across studies, it seems fair to conclude that, with
some exceptions, there is evidence that, for the EU, cost function based studies seem to iden-
tify quite small elasticities of cost with respect to public capital. Although the elasticities as
well as the returns identified in cost function studies are not directly comparable to these
60 Furthermore, the output elasticity in production function studies is not directly comparable to the
cost elasticities estimated by cost function models or to the long run elasticities implied by impulse response functions estimated by VAR models.

- 46 - Annex 06 to COMPETE Final Report: Impact of transport infrastructure on economic growth
derived using a production function approach there seems to be some evidence that the
former tend to be fairly smaller than the latter.
Furthermore, cost function studies show that aggregate results often exhibit show consider-
able variability across regions and across sectors, although a consistent pattern does not
seem to have emerged yet: for instance, it is not clear whether more developed regions are
more likely, on average, to gain from public capital or whether a particular sector is likely to
benefit more from public infrastructure than others. A robust answer to this issue would re-
quire perhaps better information on the stock of public infrastructure than is provided by the
use of monetary values: for instance, virtually all the studies are silent on very relevant issues
such as the quality of the infrastructure stock, or the levels of congestion.
Finally, VAR studies seem to broadly confirm the main findings of the former two ap-
proaches. However, the fact that the large majority of studies we have reviewed do not re-
port confidence intervals is an unappealing feature of this part of the literature review, be-
cause, as argued by Kamps (2004), it is often the case that positive elasticities are often not
significant. However, the main message we can derive form the VAR literature is that the
empirical evidence seems to support the idea that public capital has a positive impact on pri-
vate output, with a magnitude which might be broadly put near the lower bound of the pro-
duction function studies.
All in all, the empirical evidence for the EU supports the evidence we have discussed above
for the US, and the conclusion that small but positive effects of public infrastructure exist is
probably the most natural one to draw, as many of the drawbacks which characterised most
of the early studies have been, at least in part, tackled by the subsequent literature.
Still, given the inability of most studies to control for important features of the capital stock
like quality of the infrastructure and congestion, and the existence of large variations across
countries and regions not immediate to rationalise, it would be hazardous to suggest some
more precise quantification of the effects of public infrastructure on output and economic
growth.
5 Literature Review: Conclusion
In the previous sections we have sought to provide a through discussion of the linkages be-
tween transportation infrastructure and economic growth. Not only have we extensively ana-
lysed the empirical economics literature for the EU and the US, but we have also attempted a
critical evaluation of the insights offered by the theoretical literature on the effects that pub-
lic capital in general and transport infrastructure in particular might have in fostering eco-
nomic and productivity growth.
Early empirical studies were often ad hoc, as they were developed largely outside any robust
economic model of the interactions which exist between transport infrastructure and eco-
nomic activity. However, perhaps reflecting the debate which the original empirical work by
Aschauer (1989a) raised, an increasing number of theoretical contributions that sought to
better illustrate the relationship between transport infrastructure and economic and produc-

Annex 6 to COMPETE Final Report: - 47 - Impact of transport infrastructure on economic growth
tivity growth finally started to appear in the 1990s, even if a substantial fraction of the em-
pirical work in the field is still not focused on these new theoretical developments.61
We have seen that the theoretical literature has identified a set of channels through which
transport infrastructure might affect economic and productivity growth. One of such chan-
nels is through classical endogenous growth models -whereby inputs have diminishing mar-
ginal returns but, together, they display constant returns- which can be used to show how
there is a growth maximising level of transport infrastructure which depends on the interac-
tion between the relative effects of transport infrastructure investment and the taxes levied
to finance it.
We have also discussed how endogenous growth models could be used to model the effect
of transport infrastructure on long run growth through its impact on the rate of technology
innovation and diffusion.
Furthermore, transport infrastructure might favour long run output growth by allowing an
increase in market size, which in turn might make it easier for private firms to exploit scale
economies and specialisation economies. Finally, we have shown how some theoretical mod-
els introduce general equilibrium and imperfect competition, allowing transportation infra-
structure to allow the development of industrial clusters and agglomeration economies.
Therefore, there appears to be in the theoretical literature a broad consensus on the mecha-
nisms through which, at the microeconomic level, transport infrastructure might affect eco-
nomic and productivity growth: transport infrastructure might reduce transportation costs,
which allows reducing private sector costs and increasing specialisation and the degree of
division of labour. In addition, transport infrastructure may bring about changes in factor
markets and firm location decisions that allow the development of spatial clusters of eco-
nomic sectors, which in turn affects innovation and allows further reduction in costs.
Furthermore, it seems clear from the literature that non-linearities in the effects of transport
infrastructure on economic growth are important: for instance, additions to a not well devel-
oped transport network or new investments in a low quality stock or investments aimed to
alleviate congestion problems eliminating bottlenecks would be likely to generate relatively
larger benefits, ceteris paribus, than in the case of an already developed high quality trans-
port network or a network with no congestion problems. However, the literature appears to
be still in its infancy to be able to offer a robust explanation of the links between transport
investment, the network dimension of transport infrastructure and economic growth.
We noted above as the theoretical and empirical literature developed quite independently.
Therefore, while the former has sought to apply microeconomic considerations to model the
transport infrastructure-economic growth relation, the latter –and especially the studies
which adopted the production function approach- has mainly followed a “macroeconomic
black box” approach which does not allow spelling out in some details the mechanisms that
drive the effects of transport infrastructure on productivity growth. In other words, the em-
61 This is not to say that the empirical contributions simply ignored the theoretical developments, as
some were either based on theoretical models or incorporated some of the insights provided by the theoretical literature (such as geographic spillovers) into their empirical framework.

- 48 - Annex 06 to COMPETE Final Report: Impact of transport infrastructure on economic growth
pirical literature, by large, describes the impact of public and transport infrastructure on eco-
nomic and productivity growth at an aggregate level, but it does not allow researchers “to
look” into the “black box”, which is rather unfortunate, as, often, the aggregate impact of
public infrastructure might be a poor proxy for the impact that specific transport projects
might have on aggregate growth.
Having said that, the empirical evidence that we have surveyed for this report seems to sug-
gest that public capital in general might have a positive effect on the level of economic activ-
ity, even if not as large as the early studies which employed production functions identified.
In fact, both in the case of the US and the EU, there seems to be a tendency for production
function studies to identify quite large returns for public capital and for transportation infra-
structure in particular, even if probably not as large as the early studies suggested, probably
because some of their most important methodological drawbacks had been somewhat taken
into account by later studies.
Furthermore, the theoretical literature has made clear how the relationship between public
capital and production is perhaps too complex to be tackled from the oversimplified perspec-
tive of the production function approach. The cost function approach –based on a behav-
ioural model of production which allows to better identify the direct and indirect effect that
public infrastructure might have on the cost structure and productivity growth of the private
sector- as well as the studies that adopt a more “structural” approach –whereby infrastruc-
ture effects are incorporated into more general models of the economy- seem to back the
theoretical insights that public capital and transport infrastructure might have a beneficial
effect in fostering economic growth and the level of output, but they also seem to suggest
that the returns of public infrastructure are positive, but lower than these identified by pro-
duction function studies.
However, a precise quantification of the effects of public infrastructure on output and eco-
nomic and productivity growth is more difficult to make, for a series of reasons.
First of all, some studies have suggested that there is a significant variability of infrastructure
returns and elasticities across regions and sectors and that it is extremely difficult to rational-
ise this variability: in other words, there is not consistent evidence suggesting that some sec-
tors or regions are more likely to gain (or to loose) more than others.
Second, there is some fairly robust empirical evidence that seems to support the insights of-
fered by the theoretical literature that public infrastructure might have non-linear effects on
the level of economic activity and growth: this is often picked up in cost and production
function studies by positive -but declining over time- returns to public capital and transporta-
tion infrastructure (e.g. Demetriades and Mamuneas, 2000 for the OECD countries and Mor-
rison and Schwarz, 1996 and Fernald, 1999 for the US62).
62 Fernald (1999) argued that the construction of the Federal Highway Network in the US spurred eco-
nomic growth in the subsequent years, leading to high returns of transport infrastructure, but that the returns subsequently fall: this could suggest, among the other things, that additional invest-ments in secondary layers of the network could not be as highly productive as the construction of the main network.

Annex 6 to COMPETE Final Report: - 49 - Impact of transport infrastructure on economic growth
However, empirical analysis of theoretical models which explicitly incorporate non-linearity
between public infrastructure and output into their framework are perhaps still in their in-
fancy, and therefore generalisations of findings of a few papers would be questionable.
Furthermore, the impact that quality and network aspects of transport infrastructure as well
as congestion effects might play on “driving” the overall effect of public infrastructure on
output, even if quite clear from a theoretical perspective, have not yet been investigated in
much depth in the economic literature so far.
Having said that, the evidence of small albeit positive benefits -in terms of higher output and
economic growth- stemming from public capital and, especially, from transport infrastruc-
ture-seems to find a broad support in the empirical literature, unlike what earlier literature
reviews (e.g. Gramlich, 1994 or Sturm and de Haan, 1998) seemed to suggest.
There are some further few caveats worth noting.
The first is that there is some evidence in the literature which suggests that empirical works
that have used samples at regional level have identified lower impacts of public and transport
infrastructure on economic growth than studies based on aggregate national data, the rea-
son being that the former neglect the spillover effects of public infrastructure across regions.
This could be one of the possible explanations for the lower estimates that are generally
found in the cost function approach, which relied almost exclusively on regional level data,
with respect to the time series studies which adopted a production function approach. Some
studies (e.g. Cohen et al, 2003a, 2003b) have indeed identified the existence of spillover ef-
fects of transport infrastructure and have concluded that neglecting them would lead to un-
derestimating the overall impact of transport infrastructure on private sector costs and pro-
ductivity.
In second place, while many studies have reported rates of returns from public infrastructure
investment, very few have actually compared them with the costs incurred by the govern-
ments.
In other words, it should be remarked that even if a positive rate of return is a necessary con-
dition for public infrastructure investment to be “productive”, it is not a sufficient condition
for it to be also worthwhile.
In fact, it would first be necessary to compute a user cost of public funds which should con-
sider depreciation, the opportunity costs and the marginal cost of public funds: if the user
cost were higher than the rate of return, then public infrastructure investment would be con-
suming more resources than it would be generating. 63
Furthermore, it should be observed that, even if the return of transport infrastructure were
higher than its user cost, it would not necessarily follow that the government should invest in
transport infrastructure. Given limited resources, the government might well decide to invest
63 We can note that the few studies that have compared the return of public infrastructure with its
cost have generally found that the rates of return were actually higher than the user cost, even if the difference was falling down over time
- 50 - Annex 06 to COMPETE Final Report: Impact of transport infrastructure on economic growth
in other kinds of public investments. Put it simply, the gross rate of return of transport infra-
structure should be compared to that of other types of public investment expenditures.
Unfortunately, the empirical literature that we have reviewed is not very helpful on this.
There is some evidence that core infrastructure (which is closely related to the concept of
transport infrastructure) seems to generate higher returns than other forms of public infra-
structure, like offices and buildings. However, there does not seem to be, to the best of our
knowledge, any robust theoretical and empirical attempt to compare returns to transport
infrastructure to these of other non infrastructure public investments, such as public expendi-
ture in education, R&D or health care.
6 Models of transport infrastructure and economic growth
6.1 Introduction
As discussed in the Main Report a new growth model has been developed and simulated.
The model deals with the effects of transport infrastructure both on the production capacity
of firms and on the utility of individuals. This latter aspect is the most innovative part of the
model as this fact has not been considered in the economic literature that has been devel-
oped so far: the Barro (1990), Barro and Sala I Martin (1992) and Turnovsky (1997) models
use a utility function that depends only on the level of consumption in each period. In these
models therefore transport infrastructure influences utility only through the (positive) effects
that it has on future productivity of capital and thus on increases in total production and con-
sumption. However, it seems sensible to assume that the level of development of transport
infrastructure has a direct effect on the utility of economic agents: roads, railways, harbours
and airports are used for leisure activities as well as for production porpuses. In the model
that we developed we have therefore taken into account this fact by inserting transport in-
frastructure directly in the utility function and assuming that it influences the labour supply
decisions of agents.
After the leisure model is discussed a variant of the Barro and Sala I Martin (2004) (BSIM from
now) model that takes into account the basic fact that transport infrastructure is subject to
congestion, (i.e. for a given quantity of infrastructure the quantity available to a single indi-
vidual declines as other individuals use the facility) has been developed for a simulation exer-
cise.
In the following paragraphs we describe the main features of both models, leaving the dis-
cussion of the simulation results to the main report.
6.2 The different steps to construct the leisure model
The development of new models is by no means an easy task and it is therefore very useful to
start from basic models that have been constructed and modify them to analyse the issues of
interest. We base our analysis on a series of Ramsey-like growth models that have been de-
veloped in the past and for which very important analytical results are already known.
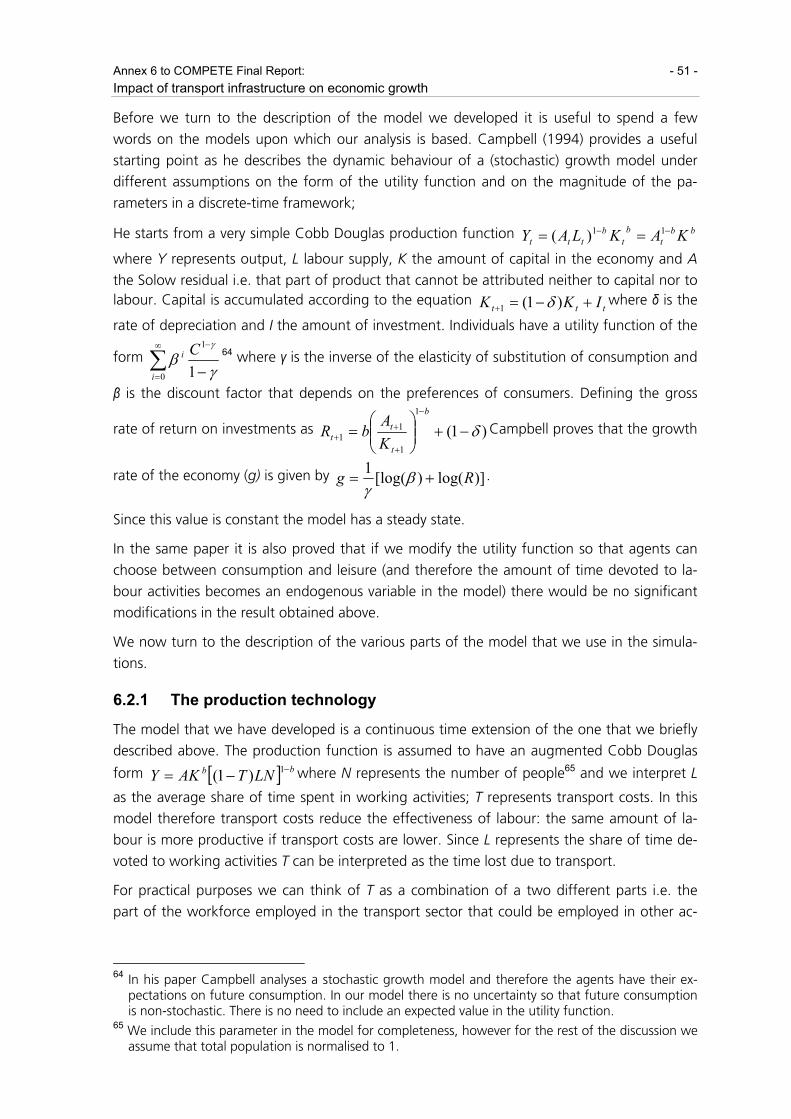
Annex 6 to COMPETE Final Report: - 51 - Impact of transport infrastructure on economic growth
Before we turn to the description of the model we developed it is useful to spend a few
words on the models upon which our analysis is based. Campbell (1994) provides a useful
starting point as he describes the dynamic behaviour of a (stochastic) growth model under
different assumptions on the form of the utility function and on the magnitude of the pa-
rameters in a discrete-time framework;
He starts from a very simple Cobb Douglas production function bbt
bt
bttt KAKLAY −− == 11)(
where Y represents output, L labour supply, K the amount of capital in the economy and A
the Solow residual i.e. that part of product that cannot be attributed neither to capital nor to labour. Capital is accumulated according to the equation
ttt IKK +−=+ )1(1 δ where δ is the
rate of depreciation and I the amount of investment. Individuals have a utility function of the
form ∑∞
=
−
−0
1
1i
i Cγ
βγ
64 where γ is the inverse of the elasticity of substitution of consumption and
β is the discount factor that depends on the preferences of consumers. Defining the gross
rate of return on investments as )1(1
1
11 δ−+⎟⎟
⎠
⎞⎜⎜⎝
⎛=
−
+
++
b
t
tt K
AbR Campbell proves that the growth
rate of the economy (g) is given by )]log()[log(1 Rg += βγ
.
Since this value is constant the model has a steady state.
In the same paper it is also proved that if we modify the utility function so that agents can
choose between consumption and leisure (and therefore the amount of time devoted to la-
bour activities becomes an endogenous variable in the model) there would be no significant
modifications in the result obtained above.
We now turn to the description of the various parts of the model that we use in the simula-
tions.
6.2.1 The production technology
The model that we have developed is a continuous time extension of the one that we briefly
described above. The production function is assumed to have an augmented Cobb Douglas
form [ ] bb LNTAKY −−= 1)1( where N represents the number of people65 and we interpret L
as the average share of time spent in working activities; T represents transport costs. In this
model therefore transport costs reduce the effectiveness of labour: the same amount of la-
bour is more productive if transport costs are lower. Since L represents the share of time de-
voted to working activities T can be interpreted as the time lost due to transport.
For practical purposes we can think of T as a combination of a two different parts i.e. the
part of the workforce employed in the transport sector that could be employed in other ac-
64 In his paper Campbell analyses a stochastic growth model and therefore the agents have their ex-
pectations on future consumption. In our model there is no uncertainty so that future consumption is non-stochastic. There is no need to include an expected value in the utility function.
65 We include this parameter in the model for completeness, however for the rest of the discussion we assume that total population is normalised to 1.
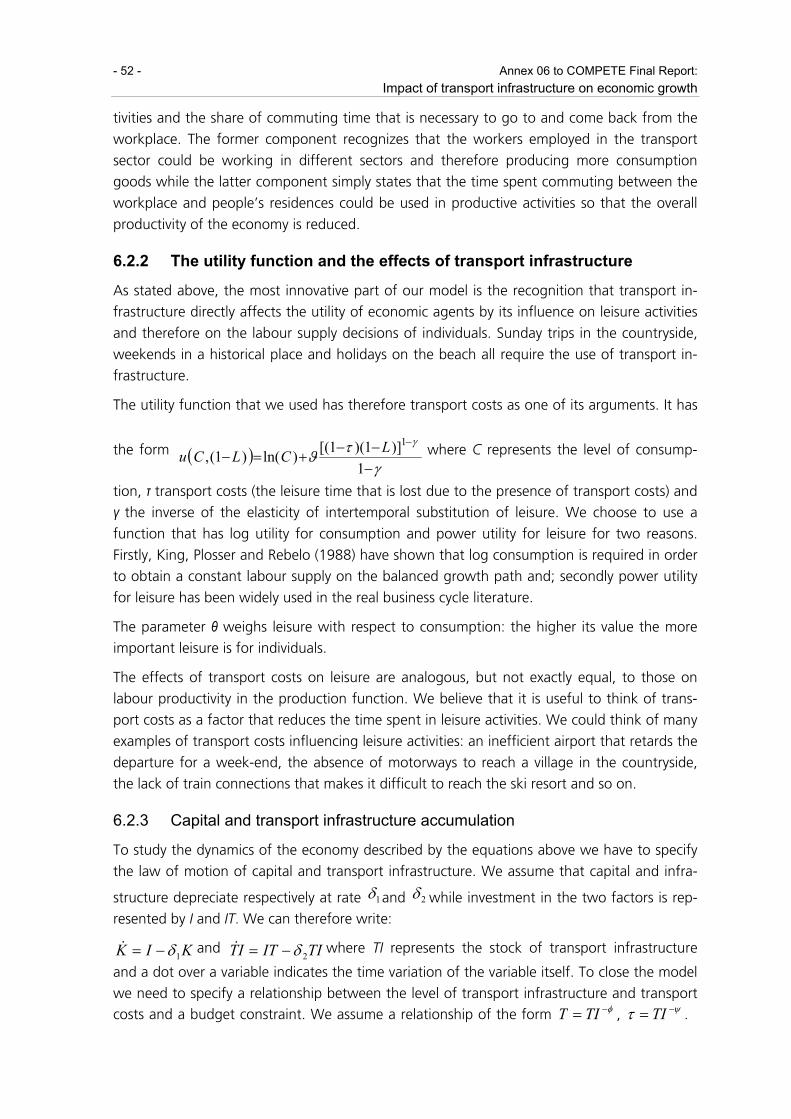
- 52 - Annex 06 to COMPETE Final Report: Impact of transport infrastructure on economic growth
tivities and the share of commuting time that is necessary to go to and come back from the
workplace. The former component recognizes that the workers employed in the transport
sector could be working in different sectors and therefore producing more consumption
goods while the latter component simply states that the time spent commuting between the
workplace and people’s residences could be used in productive activities so that the overall
productivity of the economy is reduced.
6.2.2 The utility function and the effects of transport infrastructure
As stated above, the most innovative part of our model is the recognition that transport in-
frastructure directly affects the utility of economic agents by its influence on leisure activities
and therefore on the labour supply decisions of individuals. Sunday trips in the countryside,
weekends in a historical place and holidays on the beach all require the use of transport in-
frastructure.
The utility function that we used has therefore transport costs as one of its arguments. It has
the form ( )γ
τϑγ
−−−
+=−−
1)]1)(1[()ln()1(,
1LCLCu where C represents the level of consump-
tion, τ transport costs (the leisure time that is lost due to the presence of transport costs) and
γ the inverse of the elasticity of intertemporal substitution of leisure. We choose to use a
function that has log utility for consumption and power utility for leisure for two reasons.
Firstly, King, Plosser and Rebelo (1988) have shown that log consumption is required in order
to obtain a constant labour supply on the balanced growth path and; secondly power utility
for leisure has been widely used in the real business cycle literature.
The parameter θ weighs leisure with respect to consumption: the higher its value the more
important leisure is for individuals.
The effects of transport costs on leisure are analogous, but not exactly equal, to those on
labour productivity in the production function. We believe that it is useful to think of trans-
port costs as a factor that reduces the time spent in leisure activities. We could think of many
examples of transport costs influencing leisure activities: an inefficient airport that retards the
departure for a week-end, the absence of motorways to reach a village in the countryside,
the lack of train connections that makes it difficult to reach the ski resort and so on.
6.2.3 Capital and transport infrastructure accumulation
To study the dynamics of the economy described by the equations above we have to specify
the law of motion of capital and transport infrastructure. We assume that capital and infra-
structure depreciate respectively at rate 1δ and 2δ while investment in the two factors is rep-
resented by I and IT. We can therefore write:
KIK 1δ−=& and TIITIT 2δ−=& where TI represents the stock of transport infrastructure
and a dot over a variable indicates the time variation of the variable itself. To close the model
we need to specify a relationship between the level of transport infrastructure and transport costs and a budget constraint. We assume a relationship of the form φ−= TIT , ψτ −= TI . �
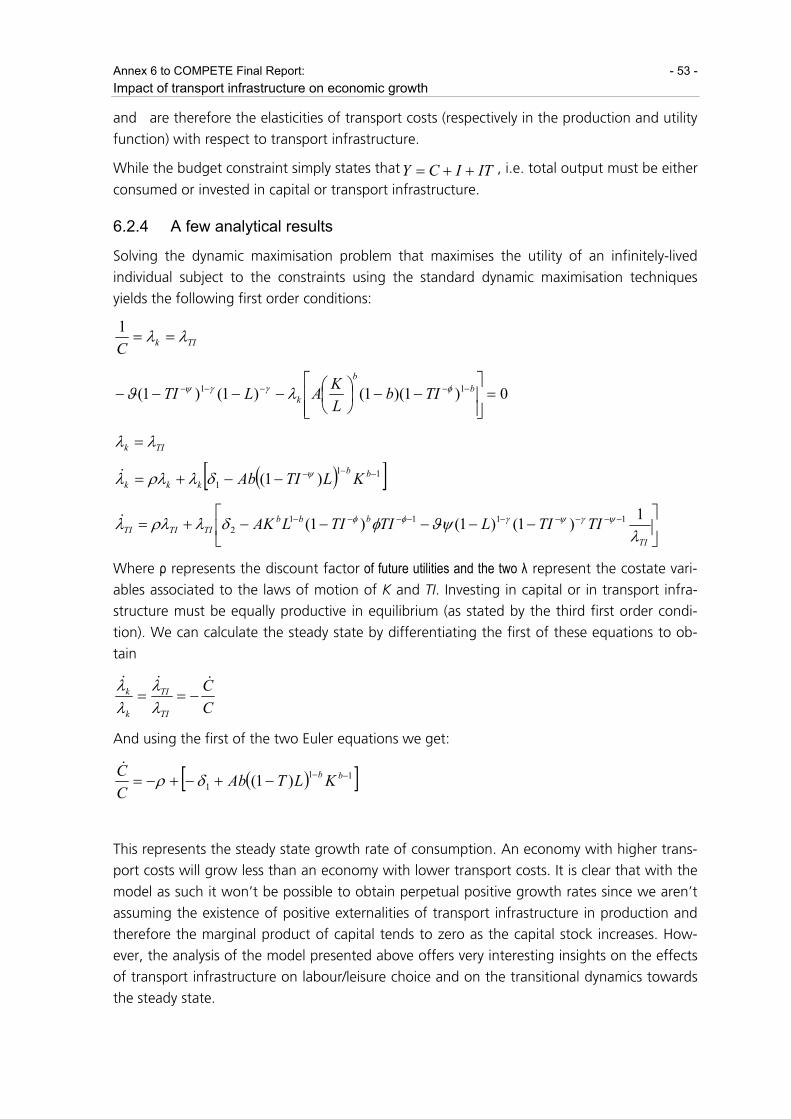
Annex 6 to COMPETE Final Report: - 53 - Impact of transport infrastructure on economic growth
and � are therefore the elasticities of transport costs (respectively in the production and utility
function) with respect to transport infrastructure.
While the budget constraint simply states that ITICY ++= , i.e. total output must be either
consumed or invested in capital or transport infrastructure.
6.2.4 A few analytical results
Solving the dynamic maximisation problem that maximises the utility of an infinitely-lived
individual subject to the constraints using the standard dynamic maximisation techniques
yields the following first order conditions:
TIkCλλ ==
1
0)1)(1()1()1( 11 =⎥⎥⎦
⎤
⎢⎢⎣
⎡−−⎟
⎠⎞
⎜⎝⎛−−−− −−−−− b
b
k TIbLKALTI φγγψ λϑ
TIk λλ =
( )[ ]111 )1( −−−−−+= bb
kkk KLTIAb ψδλρλλ&
⎥⎦
⎤⎢⎣
⎡−−−−−+= −−−−−−−−−
TI
bbbTITITI TITILTITILAK
λϑψφδλρλλ ψγψγφφ 1)1()1()1( 1111
2&
Where ρ represents the discount factor of future utilities and the two λ represent the costate vari-
ables associated to the laws of motion of K and TI. Investing in capital or in transport infra-
structure must be equally productive in equilibrium (as stated by the third first order condi-
tion). We can calculate the steady state by differentiating the first of these equations to ob-
tain
CC
TI
TI
k
k&&&
−==λλ
λλ
And using the first of the two Euler equations we get:
( )[ ]111 )1( −−−+−+−= bb KLTAb
CC δρ&
This represents the steady state growth rate of consumption. An economy with higher trans-
port costs will grow less than an economy with lower transport costs. It is clear that with the
model as such it won’t be possible to obtain perpetual positive growth rates since we aren’t
assuming the existence of positive externalities of transport infrastructure in production and
therefore the marginal product of capital tends to zero as the capital stock increases. How-
ever, the analysis of the model presented above offers very interesting insights on the effects
of transport infrastructure on labour/leisure choice and on the transitional dynamics towards
the steady state.
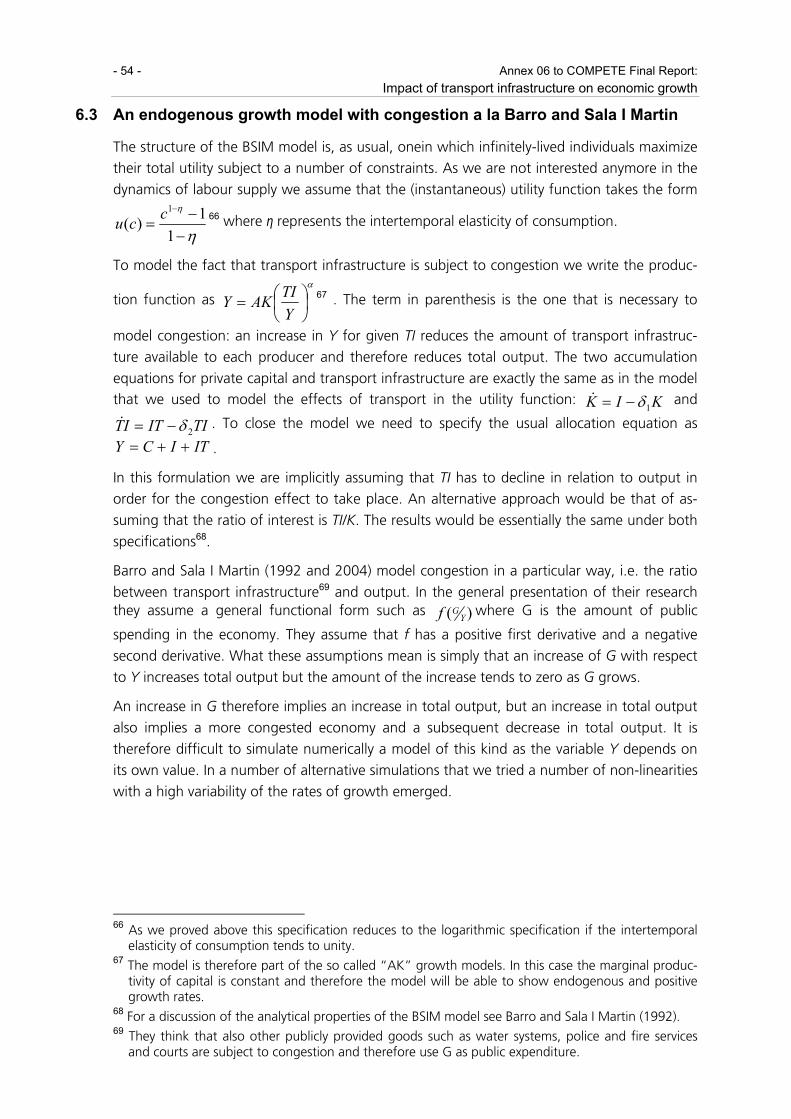
- 54 - Annex 06 to COMPETE Final Report: Impact of transport infrastructure on economic growth
6.3 An endogenous growth model with congestion a la Barro and Sala I Martin
The structure of the BSIM model is, as usual, onein which infinitely-lived individuals maximize
their total utility subject to a number of constraints. As we are not interested anymore in the
dynamics of labour supply we assume that the (instantaneous) utility function takes the form
η
η
−−
=−
11)(
1ccu 66 where η represents the intertemporal elasticity of consumption.
To model the fact that transport infrastructure is subject to congestion we write the produc-
tion function as α
⎟⎠⎞
⎜⎝⎛=
YTIAKY 67 . The term in parenthesis is the one that is necessary to
model congestion: an increase in Y for given TI reduces the amount of transport infrastruc-
ture available to each producer and therefore reduces total output. The two accumulation
equations for private capital and transport infrastructure are exactly the same as in the model that we used to model the effects of transport in the utility function: KIK 1δ−=& and
TIITIT 2δ−=& . To close the model we need to specify the usual allocation equation as
ITICY ++= .
In this formulation we are implicitly assuming that TI has to decline in relation to output in
order for the congestion effect to take place. An alternative approach would be that of as-
suming that the ratio of interest is TI/K. The results would be essentially the same under both
specifications68.
Barro and Sala I Martin (1992 and 2004) model congestion in a particular way, i.e. the ratio
between transport infrastructure69 and output. In the general presentation of their research they assume a general functional form such as )( Y
Gf where G is the amount of public
spending in the economy. They assume that f has a positive first derivative and a negative
second derivative. What these assumptions mean is simply that an increase of G with respect
to Y increases total output but the amount of the increase tends to zero as G grows.
An increase in G therefore implies an increase in total output, but an increase in total output
also implies a more congested economy and a subsequent decrease in total output. It is
therefore difficult to simulate numerically a model of this kind as the variable Y depends on
its own value. In a number of alternative simulations that we tried a number of non-linearities
with a high variability of the rates of growth emerged.
66 As we proved above this specification reduces to the logarithmic specification if the intertemporal
elasticity of consumption tends to unity. 67 The model is therefore part of the so called “AK” growth models. In this case the marginal produc-
tivity of capital is constant and therefore the model will be able to show endogenous and positive growth rates.
68 For a discussion of the analytical properties of the BSIM model see Barro and Sala I Martin (1992). 69 They think that also other publicly provided goods such as water systems, police and fire services
and courts are subject to congestion and therefore use G as public expenditure.

Annex 6 to COMPETE Final Report: - 55 - Impact of transport infrastructure on economic growth
It can be proved70 that the optimal ratio G/Y in this model must satisfy the condi-
tion)/(1
1)/()/('
YGYGfYGf
−= . With the Cobb Douglas functional form that we used in the
numerical simulations, that is equivalent to what Barro and Sala I Martin have used in their
1992 paper, the condition becomes: )/(1
11
YGYG
−=⎟
⎠⎞
⎜⎝⎛
−
α 71. This ratio is the one that maxi-
mises overall growth.
There are three solutions to this equation, namely 1
)/(+
=ααYG and ±∞=)/( YG . There-
fore it is optimal either to have a very low share72 of public capital (or transport infrastructure
in our case) or to have an infinitely high level of infrastructure. In the first case there would
be congestion but the marginal product of infrastructure would be high. In the second case
the marginal product would be negligible but there would be no congestion.
Of course the value that is economically more significant is the first one as it is one that can
be calibrated. We tried to plug in an initial value of transport infrastructure that satisfied this
condition as we thought that would be the one maximised growth and welfare. Unfortu-
nately when such a value is used as the initial one there are numerical problems that emerge:
the system is not capable of reaching a steady state.
In the alternative simulations that we have ran, by changing the initial value of transport in-
frastructure, in an attempt to replicate the results we obtained in our model, we noticed that
as the value of the ratio (TI/Y) in steady state is closer to the optimal one then total welfare is
maximised. Therefore we have a numerical confirmation of the analytical result of the BSIM
model.
6.4 Calibrating the leisure model
The analytical results that we derived are useful as they provide an image of what long run
dynamics we can expect from an economy described our model. However to have a clearer
picture of the transition towards the steady state, to evaluate the effects of changes in the
parameters, to make comparisons between economies that differ with respect to their initial
values and to carry out scenario and sensitivity analyses it is necessary to use numerical simu-
lations of this growth model. These simulations are as well very useful to understand the ef-
fects of policy changes and the data they generate can be analysed with statistical and/or
econometric tools.
70 See Barro and Sala I Martin (2004) p. 225 for details.
71 Starting from α)/()/( YGYGf = we get 1)/()/(' −= αα YGYGf and therefore
11
)/()/()/(
)/()/(' −
−
== YGYGYG
YGfYGf αα
α
α
72 The value of G with the parameters calibrated in our EU-15 and US model is .09.

- 56 - Annex 06 to COMPETE Final Report: Impact of transport infrastructure on economic growth
6.4.1 Parameters calibration
There are many parameters that we need to calibrate in the model. The exponent b in the
production function, � and � in the utility function, the discount factor �, the depreciation fac-
tors 1δ and 2δ , and the two elasticities Ф and �.
6.4.2 Production function and utility function
The economic literature suggests that the value of b, that represents the share of capital in
production, is around 0.35 (see, for instance, Kydland and Prescott, 1982). It is more complex
to have a clear picture of what value � should assume as it is much more difficult to measure.
In addition much of the effort to estimate intertemporal elasticities has been made with re-
gards to consumption so that the calibration of this parameter is very difficult. Hall (1988)
suggests that the econometric studies point out a value of this parameter (in relation to con-
sumption substitutability) that is close to zero and suggests an estimate of around 0.1. How-
ever Guvenen (2002) points out that the majority of macroeconomic studies use a value that
is close to one to replicate the features of real economies and that the result of Hall could be
driven by an omitted variable bias. Given the form of our utility function we have implicitly
assumed that the intertemporal elasticity of consumption is equal to one73.
For the intertemporal elasticity of leisure however there are reasons to believe that its value is
much closer to zero: in this case household are indifferent to the timing of leisure. Therefore
given that the level of consumption will grow over time they will be willing spend more time
in leisure as the economy develops to keep their utility constant over time. The reduction of
the amount of hours worked is an empirical characteristic of all industrialized economies.
Therefore we calibrate the value of at � 0.1.
The procedure to calibrate the weight of leisure in the utility function (θ) is not straightfor-
ward and, since it requires the calibration of � and � it will be described in the following para-
graphs74.
6.4.3 Depreciation rates
We use the depreciation rate that can be calculated starting from the data contained in
Kamps (2004) as the baseline value for 1δ and 2δ . For both the US and the EU-15 the value is
very close to 0.05.
We have no data that refer specifically to the depreciation of transport infrastructure, how-
ever it is often assumed a 30 year period as the baseline for depreciation. Therefore while we
stick to the calibrated value of 0.05 as the baseline value for our simulations but we also pro-
73 If we start from a utility function η
η
−−
=−
11)(
1CCu where � is the intertemporal elasticity of con-
sumption we can prove that )ln(1
)ln(lim1
1lim1
1
1
1CCcC
=±
±=
−− −
→
−
→
η
η
η
η η.
74 Someone might argue that we need to calibrate the parameter a in the production function. How-ever a is calculated at period 1 using the allocation and production equations and ensures that the first step of the model is consistent with the other initial values.

Annex 6 to COMPETE Final Report: - 57 - Impact of transport infrastructure on economic growth
vide an analysis of the scenario where the depreciation rate is assumed to be 0.021 such that
after 30 years the value of transport infrastructure would be 1/1000 of its initial value.
6.4.4 Elasticities of transport costs
Three parameters still need to be calibrated: the two elasticities of transport cost and the
weight of leisure in the utility function. It is not possible to plug in directly the value of these
parameters from the economic literature; however there is a way of estimating them using
the conditions that are implicitly contained in our model.
Starting from the production function of the model it is possible to calculate the elasticity of
output with respect to transport infrastructure:
[ ] bb LNTIAKY −−−=1)1( φ
[ ] 11 1)1()( −−−−− −−= φφ φTITIbLNAKdTIdY bbb
1)1()1( −−− −−= φφφ TITIbTIdTIYdY
Once we calibrate the initial value of the transport infrastructure, a thing that will be done in
the section dedicated to the calibration of initial values, two unknowns remain in the equa-
tion: the first one is Ф and the second one is the value of the elasticity itself. We now have
two alternative ways to estimate the value of Ф. The first possibility is plug into the equation
a value of the elasticity and solve the equation numerically for Ф. In the Main Report] we
showed that econometric estimates of TIdTI
Ydy
are around the value of 0.1 so that such a calcu-
lation is feasible. The second possibility stems from the interpretation that we suggested for
transport costs as time subtracted from other productive activities. Once we have an estimate
of this value we can simplify the equation and calculate Ф. We decided to exploit both these
possibilities and used a two step iterative procedure to get a value for Ф. The first step esti-
mates Ф using a value of the elasticity as close as possible to 0.1. We then use this estimate
coupled with an estimate for the amount of time lost due to transport (that can be calculated
via the formulaφ−TI ) and calculate the implied value Ф from the second possibility. We iter-
ate this process modifying the elasticity so that the two estimates of Ф converge.
In the iterations we make sure that the estimated time spent in transport activities is not too
different from empirical evidence.
According to the Labour Force Survey of Eurostat the average weekly working time for the
EU-15 is 36.9 hours. A recent study of the Italian National Institute of Statistics (ISTAT 2006)
suggests that the average time spent in travel is 1 hour and 37 minutes75. The estimate re-
gards only Italian workers and it includes also time spent in travel for non labour activities. To
estimate how much of this time is due to labour activities we calculate the ratio of (family
75 The data is calculated from a survey of households who keep a diary of their activities for a ran-
domly selected day. Given the level of aggregation that was randomly assigned to each household.
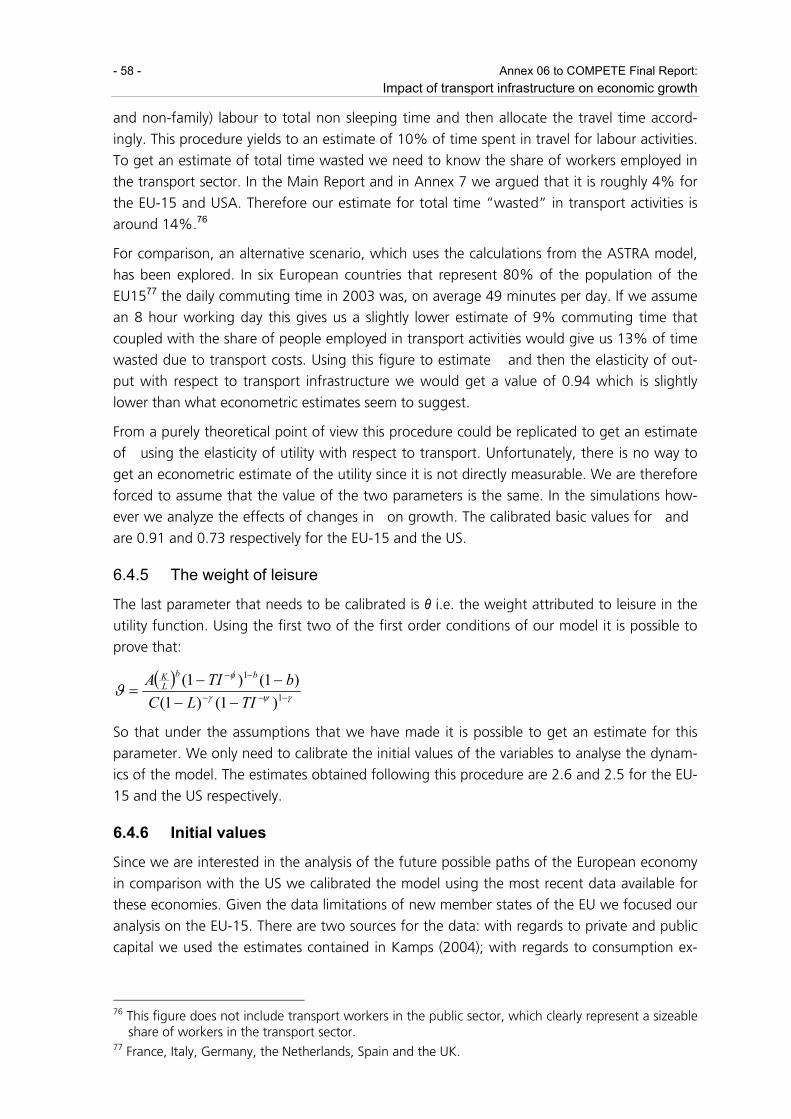
- 58 - Annex 06 to COMPETE Final Report: Impact of transport infrastructure on economic growth
and non-family) labour to total non sleeping time and then allocate the travel time accord-
ingly. This procedure yields to an estimate of 10% of time spent in travel for labour activities.
To get an estimate of total time wasted we need to know the share of workers employed in
the transport sector. In the Main Report and in Annex 7 we argued that it is roughly 4% for
the EU-15 and USA. Therefore our estimate for total time “wasted” in transport activities is
around 14%.76
For comparison, an alternative scenario, which uses the calculations from the ASTRA model,
has been explored. In six European countries that represent 80% of the population of the
EU1577 the daily commuting time in 2003 was, on average 49 minutes per day. If we assume
an 8 hour working day this gives us a slightly lower estimate of 9% commuting time that
coupled with the share of people employed in transport activities would give us 13% of time
wasted due to transport costs. Using this figure to estimate � and then the elasticity of out-
put with respect to transport infrastructure we would get a value of 0.94 which is slightly
lower than what econometric estimates seem to suggest.
From a purely theoretical point of view this procedure could be replicated to get an estimate
of � using the elasticity of utility with respect to transport. Unfortunately, there is no way to
get an econometric estimate of the utility since it is not directly measurable. We are therefore
forced to assume that the value of the two parameters is the same. In the simulations how-
ever we analyze the effects of changes in � on growth. The calibrated basic values for � and �
are 0.91 and 0.73 respectively for the EU-15 and the US.
6.4.5 The weight of leisure
The last parameter that needs to be calibrated is θ i.e. the weight attributed to leisure in the
utility function. Using the first two of the first order conditions of our model it is possible to
prove that:
( )γψγ
φ
ϑ −−−
−−
−−−−
= 1
1
)1()1()1()1(
TILCbTIA bb
LK
So that under the assumptions that we have made it is possible to get an estimate for this
parameter. We only need to calibrate the initial values of the variables to analyse the dynam-
ics of the model. The estimates obtained following this procedure are 2.6 and 2.5 for the EU-
15 and the US respectively.
6.4.6 Initial values
Since we are interested in the analysis of the future possible paths of the European economy
in comparison with the US we calibrated the model using the most recent data available for
these economies. Given the data limitations of new member states of the EU we focused our
analysis on the EU-15. There are two sources for the data: with regards to private and public
capital we used the estimates contained in Kamps (2004); with regards to consumption ex-
76 This figure does not include transport workers in the public sector, which clearly represent a sizeable
share of workers in the transport sector. 77 France, Italy, Germany, the Netherlands, Spain and the UK.

Annex 6 to COMPETE Final Report: - 59 - Impact of transport infrastructure on economic growth
penditure the data come from the European Commission Annual Macroeconomic Dataset
(AMECO). The base year is 2002 since that is the last year for which the Kamps estimates are
available. All values are per worker.
Given the level of aggregation of the model and our interest in the effects of transport infra-
structure our definition of the initial value of the variables is slightly different from the stan-
dard of economics textbooks. Capital is defined as the sum of private and public capital mi-
nus transport infrastructure capital. Consumption is the sum of private and public consump-
tion and transport infrastructure is the value of infrastructure capital.
The value for initial capital per worker in the EU-15 and in the US is respectively 141.86 and
154.87 (thousands of €). To get to the initial value of investment the average 1994 – 2002
share of investment has been calculated and then this ratio applied to the estimated value of
capital. In this way we should get a measure of investment that is independent of the cycle.
Initial consumption per worker is calibrated at 40.3 and 63.4 (thousands of €) respectively.
The initial working time is calibrated at 0.333, as Prescott (1986) suggests that household
spend one third of their time in market activities.
We only have to calibrate the initial value of transport infrastructure and investment in trans-
port infrastructure to have all the data necessary for the starting point of our simulation. Un-
fortunately it is not easy to find a measure for aggregate transport infrastructure neither for
the EU-15 nor for the US. There are data on the length of railways and roads, and on the
number of airports and harbours. Unfortunately it is very difficult to aggregate the data into
a single measure. We have therefore been forced to use an alternative approach. The Unifica-
tion of accounts and marginal costs for transport efficiency (UNITE)78 project at the University
of Leeds provides estimates for the value of gross transport infrastructure in seven EU coun-
tries79. As a first step we calculated the ratio between the average value of transport infra-
structure and the average public capital (from the Kamps dataset) in these countries. Then
we applied this ratio to the total stock of public capital in the EU-15 and the US to get an
estimate of the value of transport infrastructure. The results are 7.72 and 11.03 thousands of
€ per worker for the EU-15 and the US respectively. A procedure analogous to that used to
estimate the level of investment in capital has been used to estimate the level of investment
in transport infrastructure in the two economies. They are respectively 0.73 and 1.04.
6.5 The calibration of the BSIM model
The effort that we made when we calibrated the model in the previous section is useful also
in the calibration in the BSIM model. All the initial values are the same since capital, con-
sumption, transport infrastructure and investment in the two capital goods carry out directly.
We can also use the same depreciation rates as they have been calculated from the data at
our disposal. The only difference in the initial values that we have to take into account is that,
given that output enters the production function, we need to specify a value for initial out-
put. This value has been simply obtained summing initial consumption and initial investment
78 See www.its.leeds.ac.uk/projects/unite for details. 79 Belgium, Finland, Greece, Italy, Luxembourg, Portugal and Sweden.

- 60 - Annex 06 to COMPETE Final Report: Impact of transport infrastructure on economic growth
in capital and transport infrastructure in order for the equations of the model to be consis-
tent.
Unfortunately, we cannot use the same values that we used in the previous model for all the
parameters for two reasons: the first one is that the production and utility function have dif-
ferent specifications, the second reason is that given this difference we have to modify the
discount factor (ρ) in order to avoid that the system explodes with unreasonably high growth
rates. The fact that the BSIM model is capable of generating constant positive growth rates
due to the fact that the marginal productivity of capital is constant implies that consumption
can grow very easily (more capital implies more output and therefore more consumption).
Therefore if future consumption is weighed “too much” the optimal choice would be to con-
sume very little in the first periods of the simulations and then consume a very large amount
in the last few periods. Discounting the future consumption streams, i.e. stating that indi-
viduals prefer present consumption to future consumption, forces the system to have growth
rates that are not unreasonably high.
We now turn to the calibration of the parameter α. in the production function. To do it we
calculate the elasticity of output with respect to transport infrastructure in the new model:
αα
αα
αα
α
α
+=⎟
⎠⎞
⎜⎝⎛
+=
+=
⎟⎠⎞
⎜⎝⎛+
⎟⎠⎞
⎜⎝⎛
=
−
−
−
11
11
1
1
1
YTI
YTI
TIdTIYdY
TIY
YTI
YTI
YTI
dTIdY
We claimed that the estimated value of the elasticity is 0.1 and we therefore we can calculate
α and get the calibrated parameter as 0.1.
6.6 Dealing with infinite horizon
The model that we described assumes the existence of infinitely-lived individuals who maxi-
mise their utility. However, when running numerical simulations it is impossible to calculate
anything for an infinite number of periods. For the model to be solved numerically we have
to specify a finite time horizon so that the numerical calculations can be carried out. At this
point however there is a further aspect that we have to take into account. If we impose a
finite time horizon it is like saying to economic agents that the world is going to end at a
certain date. Then it would be optimal for them to let all the capital and transport infrastruc-
ture depreciate by that date and consume the entire product so that their total utility is
maximised. Notwithstanding its analytical correctness this is clearly a result that we need to
avoid as we are interested in the dynamics of an economy that continues its existence, on the
balanced growth path, even after the last period of analysis.
A simple procedure to solve the problem is described in Kalvelagen (2003) and implies giving
an extra weight to the discount factor in the last period so that consumption remains at the
same level after the last period of the simulations and that investment is at least replacing the

Annex 6 to COMPETE Final Report: - 61 - Impact of transport infrastructure on economic growth
depreciating stockafter the last period of the simulation. It is necessary to imply that the pa-
rameter β (equivalent to the one we described in the Campbell model) satisfies:
t−−= )1( ρβ for period t = 1…(P-1) where P represents the last period
P−− += 11 )1( ρρβ for t = P.
In this way we are sure that after period P consumption remains stable and investment in
transport infrastructure and capital ensure the replacement of the depreciating stock.
6.7 The simulation of the leisure model
In this section we report the path followed by the basic variables in the leisure mode to pro-
vide an easy way of comparing the EU15 and the USA economy.
0
20
4060
80
100
120
140160
180
200
1 3 5 7 9 11 13 15 17 19 21 23 25 27 29 31 33 35 37 39 41
Y
USAEU
Figure 1: Simulated Output
0
20
40
60
80
100
120
140
1 3 5 7 9 11 13 15 17 19 21 23 25 27 29 31 33 35 37 39 41
C
USAEU
Figure 2: Simulated Consumption
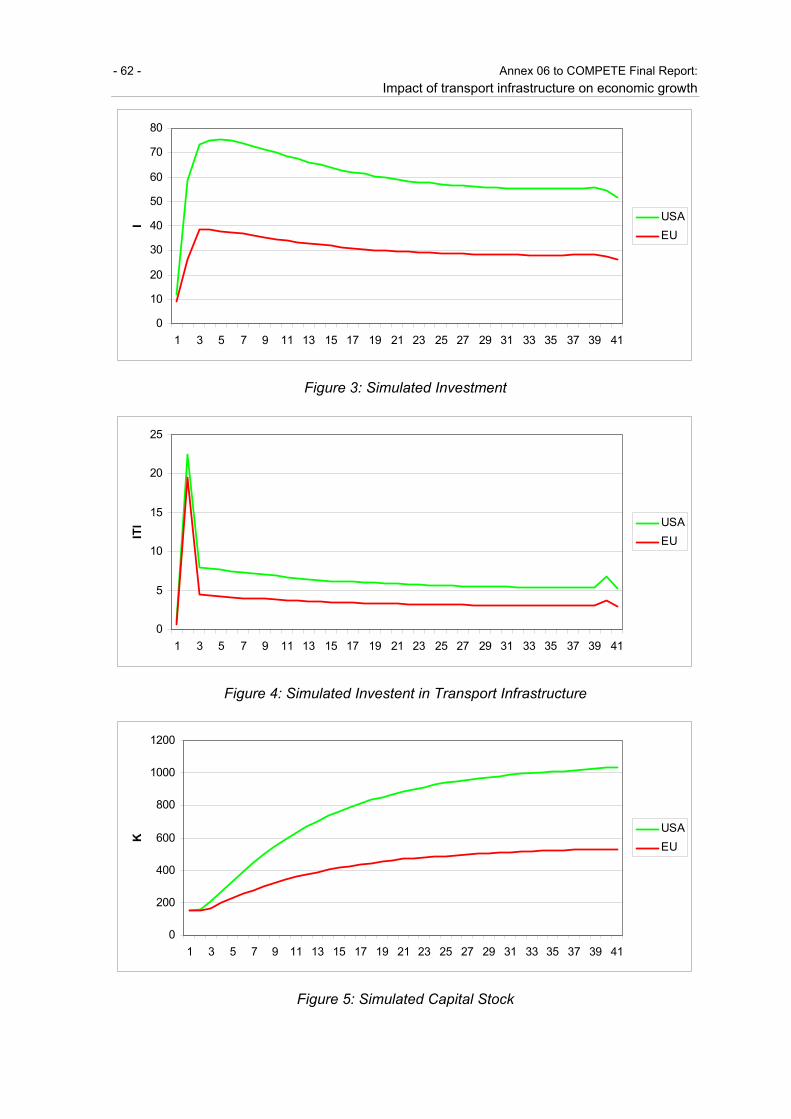
- 62 - Annex 06 to COMPETE Final Report: Impact of transport infrastructure on economic growth
0
10
20
30
40
50
60
70
80
1 3 5 7 9 11 13 15 17 19 21 23 25 27 29 31 33 35 37 39 41
I USAEU
Figure 3: Simulated Investment
0
5
10
15
20
25
1 3 5 7 9 11 13 15 17 19 21 23 25 27 29 31 33 35 37 39 41
ITI USA
EU
Figure 4: Simulated Investent in Transport Infrastructure
0
200
400
600
800
1000
1200
1 3 5 7 9 11 13 15 17 19 21 23 25 27 29 31 33 35 37 39 41
K
USAEU
Figure 5: Simulated Capital Stock
Annex 6 to COMPETE Final Report: - 63 - Impact of transport infrastructure on economic growth
0
20
40
60
80
100
120
1 3 5 7 9 11 13 15 17 19 21 23 25 27 29 31 33 35 37 39 41
TI
USAEU
Figure 6: Simulated Transport Infrastructure Stock
0
0.1
0.2
0.3
0.4
0.5
0.6
0.7
0.8
1 3 5 7 9 11 13 15 17 19 21 23 25 27 29 31 33 35 37 39 41
L
USAEU
Figure 7: Simulated labour effort

- 64 - Annex 06 to COMPETE Final Report: Impact of transport infrastructure on economic growth
7 References
Aschauer DA (1989a): “Is public expenditure productive?”. In: Journal of Monetary Econom-ics, vol. 23, pp. 177-200.
Aschauer DA (1989b): “Public investment and productivity growth in the group of seven”. In: Economics Perspectives, 1989b, vol. 13, pp. 17-25.
Aschauer DA (2000): “Do states optimize? Public capital and economic growth”. In Annals of Regional Science, vol. 43, 3, pp. 343-363.
Bajo Rubio O, Sosvilla Rivero S (1993): “Does public capital affect private sector perform-ance?”. In: Economic Modelling, pp. 179-185.
Baltagi BH (2001): “Econometric Analysis of Panel Data”. John Wiley & Sons.
Barro RJ (1990): “Government Spending in a Simple Model of Endogenous Growth”. In: The Journal of Political Economy, vol. 98, pp. 103-125.
Barro RJ, Sala-i-Martin X (1997): “Public Finance in Models of Economic Growth”. In: Review of Economic Studies, vol. 59, pp. 645-66.
Barro, R., and Sala I Martin, K., 1992, Public finance in models of economic growth, Review of Economic Studies, 59, 645 – 661
Barro, R., and Sala I Martin, K., 2004, Economic Growth, MIT Press.
Baxter M, King RG (1993): “Fiscal Policy in General Equilibrium”. In: American Economic Re-view, vol. 83, pp. 3
Berndt ER, Hansson B (1992): “Measuring the contribution of public infrastructure capital in Sweden”. In: Scandinavian Journal of Economics, vol. 94, pp. 151-168.
Boarnet M (1996): “Spillovers. The direct and indirect economic effect of transportation in-frastructure”. In: Department of Urban and Regional Planning and Institute for Transporta-tion Studies, University of California, Irvine. UCTC, 340.
Boarnet M (1998): “Spillovers and the locational effects of public infrastructure”. In: Journal of Regional Science, vol. 38, pp. 381-400.
Bonaglia F, La Ferrara EL, Marcellino M (2000): “Public capital and economic performance”. In: IGIER working paper, 163.
Bosca JE, Escriba FJ, Mugui MJ (2002): “The effect of public infrastructure on the private pro-ductive sector of Spanish regions”. In: Journal of regional Science, vol. 42, pp. 301-326.
Bosworth B (2003): “Productivity in Services Industries: Trends and Measurement Issues”, Brooking Institute Series
Bougheas S, Demetriades PO, Morgenroth ELD (2000): “International aspects of public infra-structure investment”. In: University of Nottingham Discussions Papers in Economics, 2.
Cadot O, Roller LH, Stephan A (1999): “A political economy model of infrastructure alloca-tion: an empirical assessment”. In: CEPR Discussion paper, 2336.
Cadot O, Roller LH, Stephan A (2004): “Contribution to productivity or pork barrel? The two faces of infrastructure investment”. In: DIW Discussions Papers, 458.

Annex 6 to COMPETE Final Report: - 65 - Impact of transport infrastructure on economic growth
Campbell, J.Y, 1994, Inspecting the Mechanism: An analytical approach to the stochastic growth model, Journal of Monetary Economics, 33, 463 – 506.
Canaleta CG, Arzoz PP, Garate MR (1998): “Public capital, regional productivity and spatial spillovers”. In: University of Navarra, mimeo.
Canning D, Bennathan E (2000): “The social rate of return on infrastructure investment”. In: World Bank Working Papers, 2390.
Chambers RG (1988): “Applied Production Analysis: A Dual approach”. Cambridge University Press, New York.
Charlot S, Schmitt B (1999): “Public infrastructure and economic growth in France’s regions”. In: ERSA 39th Congress.
Christopoulos D, Loizides J, Tsionas E (2001): “Efficiency in European railways: not as ineffi-cient as one might think”, Journal of Applied Economics, vol. 4, pp. 63-88
Cohen J, Morrison C (2003a): “Airport infrastructure spillovers in a network system”. In: Journal of Urban Economics, vol. 54, pp. 459-473.
Cohen J, Morrison C (2003b): “Public infrastructure investment, inter-state spillovers, and manufacturing costs”. Mimeo.
David Simmonds Consultancy (1999): “Analysis of Transport Schemes: Economic Impact Studies”, report for Department of the Environment, Transport and the Regions: London
Delgado Rodriguez MJ, Alvarez Ayuso I. (2000): “Public productive infrastructure and eco-nomic growth”. In ERSA 39th Congress.
Denis C, McMorrow K, Roger, W (2004): “An analysis of EU and US productivity develop-ments (a total economy and industry level perspective)”. Deliverable to European Commis-sion, Directorate General for Economic and Financial Affairs.
Demetriades PO, Mamuneas TP (2000): “Intertemporal output and employment effects of public infrastructure capital: evidence from 12 OECD economies”. In: Economic Journal, vol. 110, pp. 687-712.
De Rooy J (1978): “Productivity of social overhead capital: North-South comparisons”. In: Review of Business and Economic Research, vol. 14, pp. 44-60.
DeStefanis S, Sena V (2005): “Public capital and total factor productivity: new evidence from the Italian regions”. In: Regional Studies, vol 39, pp. 603-617.
Dixit AK, Stiglitz JE (1977): “Monopolistic competition and optimum product diversity”. In: American Economic Review, vol. 67, pp. 297-308.
Duggal V, Saltzman C, Klein L (1999): “Infrastructure and productivity: a nonlinear ap-proach”. Journal of Econometrics, vol. 92, pp. 47-74.
Duran-Fernandez R, Santos G (2006): “An empirical approach to public capital, infrastructure and economic activity: a literature review”. In: Transport Studies Unit, University of Ox-ford, mimeo.
Esfahani E, Ramires MT (2003): “Institutions, infrastructure and economic growth”. In: Jour-nal of Development Economics, vol. 70, pp. 443-477.

- 66 - Annex 06 to COMPETE Final Report: Impact of transport infrastructure on economic growth
Evans P, Karras G (1994): “Is government capital productive? Evidence form a panel of seven countries”. In: Journal of Macroeconomics, vol. 16, pp. 271-279.
Everaert G (2003): “Balanced growth and public capital: an empirical analysis with I(2) trends in capital stock data”. In: Economic Modelling, vol. 20, pp. 741-763.
Everaert, G, Heylen, F. (2004): “Public capital and long term labour market performance in Belgium”, Journal of Policy Modelling, 26, pp. 95-112.
Evans P, Karras, G (1994): “Are government activities productive? Evidence from a panel of U.S. states”. In: The Review of Economics and Statistics, vol. 76, pp. 1-11.
Fernald J (1999): “Roads to prosperity? Assessing the link between public capital and produc-tivity?”. In: The American Economic Review, vol. 89, pp. 619-638.
Flores de Frutos R, Garcia-Diez M, Perez Amal T (1998): “Public capital and economic growth: an analysis of the Spanish economy”. In: Applied Economics, vol. 30, pp. 985-994.
Flores de Frutos R, Pereira A (1993): “Public capital and aggregate growth in the United States: is public capital productive?”. In: University of California in San Diego Discussion Paper, 31.
Garcia-Mila T, McGuire T, Porter R (1996): “The effect of public capital in state-level produc-tion functions reconsidered”. In: The Review of Economics and Statistics, vol. 78, pp. 177-180.
Graham DJ, Couto A, Glaister S, Adeney W (2003): “Economies of scale and density in urban rail transport: effect on productivity”. In Transportation Research Part E: Logistics and Transportation Review, vol. 39, Issue 6
Gramlich, EM (1994): “Infrastructure Investment: a review essay”. In: Journal of Economic Literature, vol. 32, pp. 1176-1196.
Greene W. (2003): “Econometric Analysis”. Prentice Hall.
Griliches Z, Mairesse J (1998): “Production functions: the search for identification”. In: Strom S: “Essays in Honour of Ragnar Frish”. Econometric Society Monograph Series, Cam-bridge.
Guvenen, M. F., 2002, Reconciling conflicting evidence on the elasticity of intertemporal sub-stitution: a macroeconomic perspective, University of Rochester Working Paper 491
Hall, R.E., 1988, Intertemporal substitution in consumption, Journal of Political Economy, 96, 339 – 357.
Haughwout A (2002): “Public infrastructure investment, productivity, and welfare in fixed geographic areas”. In: Journal of Public Economics, vol. 83, pp. 405-428.
Holtz-Eakin D (1994): “Public-sector capital and the productivity puzzle”. In: The Review of Economics and Statistics, vol. 76, pp. 12-21.
Holtz-Eakin D, Shwartz AE (1995): “Infrastructure in a structural model of economic growth”. In: Regional Science and Urban Economics, vol. 25, pp. 131-151.
Holtz-Eakin D, Lovely ME (1996): “Scale economies, returns to variety, and the productivity of public infrastructure”, Regional Science and Urban Economics, vol. 26, pp. 105-123.
ISTAT, 2006, Rapporto Annuale, La situazione del paese nel 2005, ISTAT, Rome.

Annex 6 to COMPETE Final Report: - 67 - Impact of transport infrastructure on economic growth
Kalvelagen, E., 2003, An Elementary Ramsey growth model, mimeo. Available at www.gams.com/~erwin/micro/ramsey.pdf
Kalyvitis S (2003): “Public Investment and Endogenous Growth with Empirical Evidence from Canada”. In: Scottish Journal of Political Economy, vol. 50.
Kamps C (2004a): “New estimates of Government net capital stocks for 22 OECD countries 1960-2001”. In IMF working papers, 67.
Kamps C (2004b): “The dynamic effects of public capital: VAR evidence for 22 OECD coun-tries”. In: Kiel working paper, 1224.
Kamps C (2005): “Is there a lack of public capital in the European Union?”. In: Kiel Institute of World Economics.
Kelejian H, Robinson D (1997): “Infrastructure productivity estimation and its underlying econometric specifications: a sensitivity analysis”. In: Regional Science, vol. 76, pp. 115-131.
Kemmerling A, Stephan A (2002): “The contribution of local public infrastructure to private productivity and its political economy: evidence from a panel of large German cities”. In: Public Choice, vol. 113, pp.403-422.
Kim M (1985): “Total Factor Productivity in Bus Transport”, Journal of Transport Economics and Policy, vol. 17, pp. 173-182
King, R.G., Plosser, C.I., and Rebelo, S.T., 1988, Production, growth and business cycles II: New directions, Journal of Monetary Economics, 21, 195 – 232.
Kopp A (2005): “Aggregate productivity effects of road investment. A reassessment for Western Europe”. In: ERSA 45TH Congress.
Krugman P (1990) “Increasing Returns and Economic Geography”. In: NBER Working paper 3275.
Kune B, Mulder N, (2000): “Capital Stock and Productivity in French Transport: An Interna-tional Comparison”. CEPII no. 18.
Kydland, F. and Prescott, C., 1982, Time to build and aggregate fluctuations, Econometrica, 50: 1345 – 70.
La Ferrara EL, Marcellino M (2000): “Is public expenditure productive?”. In: mimeo, Universi-ta’ Bocconi.
Lakshmanan TR, Anderson WP (2002): “Transportation infrastructure, freight services sector and economic growth”. In: Report for The US Department for Transportation Federal Highway Administration,
Litgarth JE (2000): “Public capital and output growth in Portugal: an empirical analysis”. In: IMF working paper, 11.
London Economics, Black and Veatch Consulting, Shutler, ME (2003): “Scope for Efficiency Studies”, Report to Ofwat.
Lynde C, Richmond J (1993): “Public capital and long run costs in UK manufacturing”. In: Economic Journal, vol. 103, pp. 880-893.

- 68 - Annex 06 to COMPETE Final Report: Impact of transport infrastructure on economic growth
Mamatzakis EC (1999a): “Public infrastructure, private input demand, and economic per-formance of the Greek industry”. In: Queen Mary & Westfield College Working Paper, 406.
Mamatzakis EC (1999B): “Testing for long run relationship between infrastructure and pri-vate capital productivity: a time series analysis for the Greek industry”. In: Applied Eco-nomics Letters, vol. 6, pp. 243-246.
Mera K (1972): “Regional production functions and social overhead capital: an analysis of the Japanese case”. In: Regional and Urban Economics, vol. 3, 2, pp. 157-185.
Mittnik S, Neumann T (2001): “Dynamic effects of public investment: Vector autoregressive evidence from six industrialised countries”. In: Empirical Economics, vol. 26, pp. 429-446.
Moreno R, Lopez Bazo E, Artis M (2003): “On the effectiveness of private and public capital”. In: Applied Economics, vol. 35, pp. 727-740.
Morrison C, Schwartz AE (1996): “State infrastructure and productive performance”. In: The American Economic Review, vol. 86, pp. 1095-1111.
Munnell AH (1990a): “Why has productivity growth declined? Productivity and public in-vestment”. In: New England Economic Review, pp. 2-22.
Munnel AH (1990b): “How does public infrastructure affect regional economic perform-ance?”. In: New England Economic Review, pp. 11-32.
Munnel, AH (1991): “Comments on: “Is there too little capital? Infrastructure and economic growth”, by Charles Hulten and Robert Schwab”. In: American Enterprise Institute Con-ference on Infrastructure needs and policy options for the 1990s.
Nadiri MI, Mamuneas T (1998): “The effects of public infrastructure and R&D capital on the cost structure and performance of the U.S. manufacturing industries”. In: The Review of Economic and Statistics, vol. 76, pp. 22-37.
Nadiri MI, Mamuneas T (1998): “Contribution of highway capital to output and productivity growth in the U.S. economy and industries”. In: US Department of Federal Highway Ad-ministration.
National Economic Research Associates (1999): “A Framework for Assessing Studies of the Impact of Transport Infrastructure Projects on Economic Activity”, Report to the Standing Advisory Committee on Trunk Road Assessment, Department of the Environment, Trans-port and the Regions: London.
Nickell S (1981): “Biases in dynamic models with fixed effects”. In: Econometrica, vol. 49, pp. 1417-1426.
O’Mahony M, Oulton N, Vass J (1997): “Labour Productivity in Transport and Communica-tions: International Comparisons”. NIESR Discussion Paper No.117.
Ott I, Turnovsky SJ (June 2005): “Excludable and Non-excludable Public Inputs: Consequences for Economic Growth”. Mimeo University of Washington.
Oum TH, Waters WG, Yu C (1999): “A Survey of Productivity and Efficiency Measurement in Rail Transport”, Journal of Transport Economics and Policy, vol. 33, pp. 9 – 42.
Percoco M (2004): “Infrastructure and economic efficiency in Italian regions”. In: Networks and Spatial Economics. Vol. 4, pp. 361-378.

Annex 6 to COMPETE Final Report: - 69 - Impact of transport infrastructure on economic growth
Pereira A (2001a): “On the effects of public investment on private investment: What crowds in what?”. In: Public Finance Review, vol. 29, pp. 3-25.
Pereira A, Andraz J (2001b): “On the impact of public investment on the performance of U.S. industries”. In: Public Finance Review, vol. 31, pp. 66-90.
Pereira A, Andraz JM (2005): “Public Investment in Transportation Infrastructure and eco-nomic performance in Portugal”. In: Review of Development Economics, vol. 9, pp. 177-196.
Pereira A, Roca Sagales O (1999): “Public capital formation and regional development in Spain”. In: Review of Development Economics, vol. 3, pp. 281-294.
Pereira A, Roca Sagales O (2001): “Infrastructure and private sector performance in Spain”. In: Journal of Policy Modelling, vol. 23, pp. 271-384.
Pereira A, Roca Sagales O (2003): “Spillover effects of public capital formation: evidence from the Spanish regions”. In: Journal of Urban Economics, vol. 53, pp. 238-256.
Picci L (1999): “Productivity and Infrastructure in the Italian Regions”. In: Giornale degli Economisti a Annali di Economia”.
Prescott, E. C., 1986, Theory ahead of business cycle measurement, Federal Reserve Bank of Minneapolis Quarterly Review, 10, 9 – 22.
Pritchett L (1996): “Mind your P’s and Q’s”. In: World Bank Policy Research Paper, 1660.
Romer PM (1987) “Growth Based on Increasing Returns due to Specialisation”. In: American Economic Review Papers and Proceedings, vol. 77, pp. 56-62
Romer PM (1990) “Endogenous Technological Change” Journal of Political Economy 98, 5
Romp W, de Haan J (2005): “Public capital and economic growth: a critical survey”. In: EIB papers, vol. 10, pp. 40-70.
Rovolis A, Spence N (2002): “Duality theory and cost function analysis in a regional context: the impact of public infrastructure capital in the Greek regions”. In: Annals of Regional Science, vol. 36, pp. 55-78.
Rudd J (2000): “Assessing the productivity of public capital with a location equilibrium model”. In: FEDS Working Paper, 23.
Sanchez, PC, Villaroya JM: “Efficiency, technical change and productivity in the European rail sector: a stochastic frontier approach. In: International Journal of Transport Economics, vol. 27, pp. 55-76.
Seitz H (1994): “Public capital and the demand for private inputs”. In: Journal of Public Eco-nomics, vol. 54, pp. 287-307.
Seitz H, Licht G (1995): “The impact of public infrastructure capital on regional manufactur-ing production cost”. In: Regional Studies, vol. 29, pp. 231-240.
Schiffbauer M (2005): “Infrastructure and Growth: Smoothing the Way for Endogenous Technological Change”. Mimeo Bonn Graduate School of Economics
Shioji E (2001): “Public capital and economic growth: A convergence approach”. In: Journal of Economic Growth, vol. 6, pp 205-227.
Sims C (1980): “Macroeconomics and Reality”. In: Econometrica, vol. 48, pp. 1-48.

- 70 - Annex 06 to COMPETE Final Report: Impact of transport infrastructure on economic growth
Solow RM (1956): “A Contribution to the Theory of Economic Growth”. In: Quarterly Journal of Economics, vol. 70, pp. 65-94.
Stephan A (2003): “Assessing the contribution of public capital to private production: evi-dence from the German manufacturing sector”. In: International Review of Applied Eco-nomics, vol. 17, pp. 399-418.
Stephan A (2001): “Regional infrastructure policy and its impact on productivity: a compari-son of Germany and France”. In: DIW Discussions Papers.
Sturm JE, de Haan J (1995): “Is public expenditure really productive? New evidence for the US and the Netherlands”. In: Economic Modelling, vol. 12, pp. 60-72.
Sturm JE, de Haan J (1998): “Mpdelling government investment and economic growth on a macro level: a review”. In: Brackman S, van Eas, H Kuipers SK (eds), Market Behaviour and Macroeconomic Modelling. MacMillan Press, London.
Sturm JE, Kuper GH, Groote P (1999): “Output effects of infrastructure investment in the Netherlands, 1853-1913”. In: Journal of Macroeconomics, vol. 21, pp. 355-380.
Tatom JA (1991): “Public capital and private sector performance”. In: Federal Reserve Bank of st. Luis.
Transport Research Board (1991): “Primer on Transportation, Productivity and Economic De-velopment”, National Cooperative Highway Research Program Report 342, research spon-sored by the American Association of State Highway and Transportation Officials in coop-eration with the Federal Highway Administration.
Tretheway M, Waters WG, Fok AK (1997): “The total factor productivity of the Canadian railways, 1956-91”, Journal of Transport Economics and Policy, vol. 31, pp. 93 – 113.
Turnovsky SJ (1997: “Public and Private Capital in an Endogenously Growing Economy”. In: Macroeconomic Dynamics, vol. 1.
Wunsch P (1996): “Cost and Productivity of Major Urban Transit Systems in Europe: An Ex-ploratory Analysis”. In: Journal of Transport Economics and Policy, vol. 30 pp. 171 – 186.
Xu K, Windle R, Grimm C, Corsi T (1994): “Re-evaluating Returns to Scale in Transport” Journal of Transport Economics and Policy, vol. 28, pp. 275 – 286.
Zugasti A, Garcia RG, Maldonado JS (2001): “The effects of public infrastructure on the cost structure of Spanish industries”. In: Spanish Economic Review, vol. 3, pp. 131-150..

Annex 6 to COMPETE Final Report: - 71 - Impact of transport infrastructure on economic growth
Box 1: Some useful Key words
Convoy kilometres
Convoy kilometres, in the context of this report, refers to output in the public transport sector defined in terms of the capacity provided for public transport, rather than the actual utilisation of the service.
Cost function It is a function which relates costs of production to a set of input prices and output level. It results from th ecost-minimising behaviour of firms.
Diminishing eturns
A fall in the marginal product of an input that occurs as additional units of the input are added to production, holding all other inputs constant
Divisia index The Divisia index is a weighted sum of growth rates, where the weights are the components' shares in total value.
Economies of scale When an expansion in output leads to less than proportionate increase in costs, so that average costs per unit decrease
Economies of density In a network industry, returns to density tells the increase in costs brought about by changes in output, keeping network characteristics (e.g. customers or network length) fixed.
Elasticity Elasticity measures the percentage change that will occur in one variable in response to a one percentage change in another variable, holding all other things constant. Elasticity of substitution measures the elasticity of the ratio of two inputs to a production function with respect to the ratio of their marginal products. With competitive demands, this is also the elasticity with respect to their price ratio.
Homogeneity of degree N A functiony is said to be homogenous of degree N when, if you scale all arguments in the function by a factor x, the value of the function is multiplied by xN.
Marginal cost The marginal cost is the change in cost that arises to produce an additional unit of output.
Marginal product
The change in output as one more unit of an input is added, holding all other inputs constant.
Optimisation problem The optimisation problem for a firm usually involves profit maximisation: which is either to maximise production for a given level of costs, or minimise costs for a given level of output. An optimal level of inputs is chosen, given assumptions regarding the parameters of the production and cost function.
For a consumer the optimisation problem involves maximising utility by choosing levels of consumption of goods, subject to a budget constraint.
Perpetual inventory method It is one of the most widely used methods to build capital stock series from data on gross fixed capital formation and assumptions on the initial capital stock, scrap rates and (if the final objective is net, rather than gross, capital stock) depreciation rates.
Present value The present value of a stream of monetary values adjusts the funds for time preferences by discounting appropriately (usually with the rate of interest)
Production function A function that specifies the relationship between output

- 72 - Annex 06 to COMPETE Final Report: Impact of transport infrastructure on economic growth
and the inputs of production.
Public good A good that has the property that one individual's consumption of it does not reduce others' ability to consume (non-rivalrous). It is also not possible to exclude some consumers from consuming the good once the good has been provided (non-excludable).
Returns to scale In a production function framework, returns to scale tell, for a given increase in all inputs, the increase in output: there are increasing returns to scale when the increase in output is more than proportional than the increase in inputs.
Shadow price of public infrastructure
The shadow price of public infrastructure is measured as minus the derivative of the cost function with
respect to the stock of public infrastructure, so that a positive value means that an extra unit of public
infrastructure reduces private costs. The shadow price of public infrastructure might also be defined as the gross return of public infrastructure
Socially optimum A socially optimum equilibrium is one where the net social benefits are maximised (this includes both private costs and benefits and externalities imposed on others)
Social user cost of public infrastructure
It might be defined as the sum of the depreciation rate, the opportunity cost of public capital and the shadow price of public funds.
Total factor productivity Total factor productivity is a measure of the output of an industry or economy relative to the size of its factor inputs. A growth in TFP is the growth of real output beyond what can be attributed to increases in the quantities of labour and capital employed.
Tornqvist approximation Tornqvist approximation is a discrete-time approximation to a Divisia index, in which averages over time fill in the quantities of capital and labour.
Utility function A function that defines how the utility (well-being) of an individual changes with consumption of the goods, which can also be defined broadly to include leisure.

Anne
x 6
to C
OM
PETE
Fin
al R
epor
t: - 7
3 -
Impa
ct o
f tra
nspo
rt in
frast
ruct
ure
on e
cono
mic
gro
wth
8 Li
st o
f stu
dies
abo
ut n
etw
orks
and
thei
r gro
wth
impa
cts
The
follo
win
g lis
ts p
rese
nt a
n ov
ervi
ew o
n th
e di
ffer
ent
appr
oach
es o
f st
udie
s ab
out
netw
orks
and
the
ir gr
owth
impa
cts
for
the
EU a
nd t
he U
S. T
hree
dif-
fere
nt m
ajor
app
roac
hes
have
bee
n id
entif
ied:
Pr
oduc
tion
func
tion
appr
oach
.
C
ost
func
tion
appr
oach
.
V
ar a
ppro
ach.
Tabl
e 3.
EU
: Pro
duct
ion
func
tion
appr
oach
A
utho
r Ti
tle
Sour
ce
Regi
on
Met
hod-
olog
y Sp
ecifi
catio
n an
d es
timat
ion
Sam
ple
perio
d Sa
mpl
e ty
pe
Sect
or
Infr
astr
uctu
re
varia
ble
Mai
n re
sults
La F
erra
ra,
Mar
celli
no
TFP,
cos
ts
and
publ
ic
infr
astr
uc-
ture
: an
equi
voca
l re
latio
nshi
p
Mim
eo,
Uni
ver-
sita
' Boc
-co
ni
Italia
n re
gion
s TF
P re
-gr
essi
on,
prod
uc-
tion
func
-tio
n an
d co
st f
unc-
tion
TFP
regr
essi
on: T
FPg
on L
g, K
g, K
Gg
and
fe.
Prod
uctio
n fu
nctio
n:
leve
ls w
ith f
e. C
ost
func
tion
with
fe.
En-
doge
nity
in K
G in
the
pr
oduc
tion
func
tion
deal
t w
ith 2
SLS.
1970
-19
94
Pane
l re
gion
al
indu
stria
l se
ctor
Stoc
k of
pub
lic
capi
tal (
mai
nly
road
s, r
ailw
ays,
po
rts,
wat
er,
com
mun
icat
ions
, pi
pelin
es, s
anita
-tio
n, la
nd)
TFP
appr
oach
: for
Ital
y el
astic
ity
of K
G h
igh
(0.4
7) a
nd s
igni
fi-ca
nt. i
t is
pos
itive
for
Sou
th,
insi
gnifi
cant
for
Nor
th. P
rod
func
tion
appr
oach
: ela
stic
ity o
f K
G n
egat
ive:
acr
oss
sub
peri-
ods,
thi
s is
tru
e on
ly in
the
70s
, in
rec
ent
year
s it
is p
ositi
ve a
nd
incr
easi
ng; K
G e
last
icity
is
high
er in
the
sou
th, f
ollo
wed
by
the
cen
tre.
Cos
t fu
nctio
n:
KG
doe
s no
t re
duce
cos
ts f
or
Italy
(with
the
exc
eptio
n of
the
70
s). I
n so
me
area
s it
redu
ced
cost
s, b
ut t
here
was
ove
rin-
vest
men
t.

- 74
- An
nex
06 to
CO
MPE
TE F
inal
Rep
ort:
Im
pact
of t
rans
port
infra
stru
ctur
e on
eco
nom
ic g
row
th
Aut
hor
Title
So
urce
Re
gion
M
etho
d-ol
ogy
Spec
ifica
tion
and
estim
atio
n Sa
mpl
e pe
riod
Sam
ple
type
Se
ctor
In
fras
truc
ture
va
riabl
e M
ain
resu
lts
De
Stef
anis
, Se
na
Publ
ic c
api-
tal a
nd
Tota
l Fac
tor
Prod
uctiv
ity:
New
Evi
-de
nce
from
th
e Ita
lian
regi
ons,
19
70-9
8
Regi
onal
st
udie
s,
39, 5
, 20
05
Italia
n re
gion
s TF
P re
-gr
essi
on
and
non
para
met
-ric
met
h-od
s
Estim
atio
n of
coi
nte-
grat
ion
rela
tions
hip
1970
-19
98
Pane
l to
tal e
con-
omy
Publ
ic c
apita
l st
ock,
cor
e in
fras
-tr
uctu
re, n
on
core
infr
astr
uc-
ture
TFP
regr
essi
on s
how
s po
sitiv
e el
astic
ities
of
KG
for
cor
e in
fra-
stru
ctur
e an
d to
tal K
G, e
spe-
cial
ly in
the
NE,
SW
and
SE.
St
atis
tical
tes
ts a
re u
sed
that
se
em t
o su
ppor
t th
e vi
ew t
hat
core
infr
astr
uctu
re c
ause
s TF
P gr
owth
. Non
par
amet
ric e
sti-
mat
es r
einf
orce
the
eco
nom
et-
ric a
naly
sis'
con
clus
ions
Ev
erae
rt,
Hey
len
Publ
ic c
pai-
tal a
nd
prod
uctiv
ity
grow
th:
evid
ence
for
Be
lgiu
m,
1953
-199
6
Econ
omic
m
odel
ling
Belg
ium
TF
P re
-gr
essi
on
Engl
e G
rang
er c
oint
e-gr
atio
nn m
odel
to
deal
w
ith n
on-s
tatio
narit
y of
the
dat
a es
timat
ed
with
NLS
1953
-19
96
Tim
e se
ries
tota
l eco
n-om
y Pu
blic
cap
ital
stoc
k Im
posi
ng c
onst
ant
retu
rns
to
scal
e to
all
inpu
ts, t
hey
find
the
elas
ticity
of
outp
ut t
o K
G e
qual
to
0.2
9 (w
hich
impl
y a
rate
of
retu
rn t
o pr
ivat
e in
vest
men
t of
ab
out
29%
). Si
mul
tane
ity d
ealt
with
usi
ng t
he P
hilli
ps-H
anse
n pr
oced
ure
that
yie
ld s
imila
r re
sults
. The
y al
so u
sed
an
VEC
M t
o sh
ow t
hat
TFP
does
no
t ca
use
KG
. D
elga
do,
Alv
arez
Pu
blic
pro
-du
ctiv
e in
fras
truc
-tu
re a
nd
econ
omic
gr
owth
ERSA
39
TH
Con
gres
s,
2000
Span
ish
regi
ons
Prod
uc-
tion
func
-tio
n w
ith
regi
onal
fix
ed
effe
cts
Tran
slog
pro
duct
ion
func
tion
in le
vels
19
80-
1995
Pa
nel
Priv
ate
outp
ut
Agg
rega
tion
of
phys
ical
mea
sure
s fo
r ro
ads,
hig
h ca
paci
ty r
oads
, Po
rts,
pip
elin
es,
elec
tric
ity, n
um-
ber
tele
phon
e lin
es, d
oubl
e lin
e el
ectr
icity
rai
l-w
ays,
etc
usi
ng
prin
cipa
l com
po-
nent
ana
lysi
s
The
elas
ticity
of
outp
ut w
ith
resp
ect
to K
G is
slig
htly
neg
a-tiv
e (n
o st
anda
rd e
rror
pro
-vi
ded)
.

Anne
x 6
to C
OM
PETE
Fin
al R
epor
t: - 7
5 -
Impa
ct o
f tra
nspo
rt in
frast
ruct
ure
on e
cono
mic
gro
wth
Aut
hor
Title
So
urce
Re
gion
M
etho
d-ol
ogy
Spec
ifica
tion
and
estim
atio
n Sa
mpl
e pe
riod
Sam
ple
type
Se
ctor
In
fras
truc
ture
va
riabl
e M
ain
resu
lts
Bajo
-Rub
io,
Sosv
illa-
Rive
ro
Doe
s pu
blic
ca
pita
l af
fect
pri-
vate
sec
tor
perf
orm
-an
ce?
Econ
omic
M
odel
-lin
g, 1
993
Spai
n Pr
oduc
-tio
n fu
nc-
tion
with
va
riabl
es
divi
ded
by
K, t
akin
g pr
oduc
tive
capa
city
in
to a
c-co
unt
Estim
atio
n of
long
run
re
latio
nshi
p us
ing
Phill
ips
and
Han
sen
met
hodo
logy
plu
s an
EC
M
1967
-19
88
Tim
e se
ries
tota
l eco
n-om
y Pu
blic
sec
tor
capi
tal s
tock
El
astic
ity o
f ou
tput
to
KG
pos
i-tiv
e (a
bout
0.1
8-0.
20).
Mar
-gi
nal p
rodu
ctiv
ity o
f pu
blic
ca
pita
l hig
her
than
tha
t of
pr
ivat
e ca
pita
l. Th
e EC
M r
esul
ts
supp
ort
thes
e ob
tain
ed f
rom
th
e es
timat
ion
of t
he lo
ng r
un
rela
tions
hip.
Kam
ps
Is t
here
a
lack
of
publ
ic c
api-
tal i
n th
e Eu
rope
an
Uni
on?
Kie
l Ins
ti-tu
te f
or
Wor
ld
Econ
om-
ics,
200
5
22 O
ECD
co
untr
ies
(14
EU)
Prod
uc-
tion
func
-tio
n in
an
endo
ge-
nous
gr
owth
fr
ame-
wor
k
Gro
wth
rat
e re
gres
sed
on p
ublic
con
trol
var
i-ab
les,
fix
ed a
nd t
ime
effe
cts
and
a fu
nctio
n of
priv
ate-
publ
ic c
api-
tal r
atio
est
imat
ed b
y N
LS
1960
-20
01
Pane
l To
tal e
con-
omy
Net
pub
lic c
apita
l st
ock
The
elas
ticity
of
outp
ut t
o pu
blic
cap
ital i
s po
sitiv
e an
d si
gnifi
cant
bot
h fo
r th
e EU
and
th
e ex
tend
ed O
ECD
sam
ple
(abo
ut 0
.20)
. The
dat
a do
not
sh
ow a
ny s
igni
fican
t sh
orta
ge
or e
xces
s of
pub
lic c
apita
l for
m
ost
EU c
ount
ries.
The
re a
re
som
e lim
itatio
ns in
the
stu
dy,
such
as
assu
min
g co
untr
ies
are
in t
heir
stea
dy s
tate
, the
way
pu
blic
cap
ital i
s fin
ance
d, t
he
limite
d nu
mbe
r of
con
trol
va
riabl
e, t
he a
ssum
ptio
ns t
hat
capi
tal i
s th
e on
ly f
acto
r of
pr
oduc
tion.

- 76
- An
nex
06 to
CO
MPE
TE F
inal
Rep
ort:
Im
pact
of t
rans
port
infra
stru
ctur
e on
eco
nom
ic g
row
th
Aut
hor
Title
So
urce
Re
gion
M
etho
d-ol
ogy
Spec
ifica
tion
and
estim
atio
n Sa
mpl
e pe
riod
Sam
ple
type
Se
ctor
In
fras
truc
ture
va
riabl
e M
ain
resu
lts
Kem
mer
-lin
g,
Step
han
The
cont
ri-bu
tion
of
loca
l pub
lic
infr
astr
uc-
ture
to
priv
ate
prod
uctiv
ity
and
its
polit
ical
ec
onom
y :
evid
ence
fo
rm a
pa
nel o
f la
rge
Ger
-m
an c
ities
Publ
ic
Cho
ice,
11
3,
2002
87 G
er-
man
tow
ns
Prod
uc-
tion
func
-tio
n
Estim
ated
with
var
i-ab
les
divi
ded
by la
bour
w
ith r
e an
d w
ithin
a
syst
em (t
oget
her
with
an
equ
atio
n fo
r in
fra-
stru
ctur
e in
vest
men
t fu
nctio
n an
d an
in-
vest
men
t al
loca
tion
func
tion)
by
FIM
L
1980
, 19
86,
1988
Pane
l m
anuf
actu
r-in
g Pu
blic
infr
astr
uc-
ture
sto
ck
Posi
tive
elas
ticity
of
KG
(abo
ut
0.17
), im
plyi
ng a
rat
e of
ret
urn
of p
ublic
infr
astr
uctu
re o
f ab
out
16%
. Priv
ate
capi
tal i
s m
ore
prod
uctiv
e (3
3%).
Evan
s,
Kar
ras
Is g
over
n-m
ent
capi
-ta
l pro
duc-
tive?
Evi
-de
nce
from
a
pane
l of
seve
n co
un-
trie
s
Jour
nal o
f M
acro
-ec
onom
-ic
s, 2
, 16,
19
94
Belg
ium
, Fi
nlan
d,
UK
, Ger
-m
any,
G
reec
e,
US,
Can
-ad
a
Prod
uc-
tion
func
-tio
n
Firs
t di
ffer
ence
and
TFP
gr
owth
reg
ress
ed o
n gr
owth
in p
ublic
cap
i-ta
l. Y
ear
and
coun
try
effe
cts
plus
AR(
1) e
rror
1963
-88
Pa
nel
tota
l eco
n-om
y G
over
nmen
t ne
t ca
pita
l sto
ck
In t
he f
irst
diff
eren
ce m
odel
, af
ter
acco
untin
g fo
r tim
e ef
-fe
cts
and
coun
try
(ran
dom
and
fix
ed) e
ffec
ts, K
G c
oeff
icie
nt
not
sign
ifica
nt. T
he T
FP c
hang
e re
gres
sion
on
grow
th o
f pu
blic
ca
pita
l not
sig
nific
ant
(dou
bts
endo
geni
ty f
ully
tak
en in
to
acco
unt)
. C
harlo
t,
Schm
itt
Publ
ic in
fra-
stru
ctur
e an
d ec
o-no
mic
gr
owth
in
Fran
ce's
re
gion
s
ERSA
39
TH
Con
gres
s,
Dub
lin,
1999
Fren
ch
regi
ons
Prod
uc-
tion
func
-tio
n
Leve
ls, f
ixed
eff
ects
an
d en
doge
nity
cor
rec-
tion
atte
mpt
ed f
or
som
e sp
ecifi
catio
ns o
f th
e m
odel
1982
-93
Pa
nel
regi
onal
ec
onom
y St
ock
of p
ublic
ca
pita
l C
D w
ith f
ixed
eff
ects
fou
nd
stro
ng p
ositi
ve e
ffec
ts o
f G
K
on Y
(sim
ilar
to A
scha
uer,
ab
out
30%
). A
3SL
S (w
ithou
t fix
ed e
ffec
t) s
how
s a
smal
ler
unsi
gign
ifica
nt v
alue
. A t
rans
-lo
g fix
ed e
ffec
ts f
ind
high
po
sitiv
e ef
fect
s of
GK
(no
endo
gene
ity c
orre
ctio
n). S
ensi
-tiv
e to
reg
ion
and
perio
d

Anne
x 6
to C
OM
PETE
Fin
al R
epor
t: - 7
7 -
Impa
ct o
f tra
nspo
rt in
frast
ruct
ure
on e
cono
mic
gro
wth
Aut
hor
Title
So
urce
Re
gion
M
etho
d-ol
ogy
Spec
ifica
tion
and
estim
atio
n Sa
mpl
e pe
riod
Sam
ple
type
Se
ctor
In
fras
truc
ture
va
riabl
e M
ain
resu
lts
Step
han
Ass
essi
ng
the
cont
ri-bu
tion
of
publ
ic c
api-
tal t
o pr
i-va
te p
ro-
duct
ion:
ev
iden
ce
from
the
ge
rman
m
anuf
ac-
turin
g se
c-to
r
Inte
rna-
tiona
l re
view
of
appl
ied
econ
om-
ics,
4, 1
7,
2003
Ger
man
le
nder
s Pr
oduc
-tio
n fu
nc-
tion
Leve
ls a
nd f
irst
diff
er-
ence
. Fix
ed e
ffec
ts.
Pane
l cor
rect
ed s
tan-
dard
err
ors
to d
eal
with
gro
up w
ise
het,
se
rial c
orr.
1970
-96
Ti
me
serie
s cr
oss
sect
ion
regi
onal
ec
onom
y Pu
blic
gro
ss s
tock
of
fix
ed a
sset
s at
gr
ound
leve
l (r
oads
, hig
hway
s,
brid
ges,
rai
lway
s,
wat
erw
ay, d
ikes
, po
rts)
Larg
e el
astic
ities
(bet
wee
n 0.
38
and
0.65
fou
nd) w
hich
impl
y ra
te o
f re
turn
s of
bet
wee
n 26
% a
nd 7
2%, m
uch
high
er
than
priv
ate
capi
tal,
thou
gh
decl
inin
g th
roug
h tim
e. H
ow-
ever
, no
atte
mpt
to
cont
rol f
or
endo
gene
ity o
f in
puts
.
Picc
i Pr
oduc
tivity
an
d In
fra-
stru
ctur
e in
th
e Ita
lian
Regi
ons
Gio
rnal
e de
gli
Econ
omi-
sti e
an-
nali
di
Econ
o-m
ia, 1
999
Italia
n re
gion
s Pr
oduc
-tio
n fu
nc-
tion
Leve
l for
m. T
ime
ef-
fect
s an
d fix
ed r
egio
n ef
fect
s
1970
-19
95
Pane
l re
gion
al
econ
omie
s G
ross
cap
ital
stoc
k Fi
xed
effe
cts
estim
ates
sho
w
larg
e el
astic
ity o
f K
G (a
bout
0.
35) l
arge
r th
an p
rivat
e ca
pi-
tal.
If K
G s
plit
into
cor
e an
d no
n co
re, c
ore
posi
tive
(0.5
0!),
non
core
neg
. A f
irst
diff
m
odel
red
uces
KG
ela
st t
o 0.
18. a
long
diff
eren
ce r
egre
s-si
on s
till s
how
s hi
gh e
last
icity
. El
astic
ities
ten
d to
be
low
er in
th
e m
ore
deve
lope
d no
rth.
C
ore
mor
e pr
oduc
tive
than
no
n co
re e
very
whe
re. N
o co
r-re
ctio
ns f
or p
ossi
ble
endo
gen-
ity o
f in
puts

- 78
- An
nex
06 to
CO
MPE
TE F
inal
Rep
ort:
Im
pact
of t
rans
port
infra
stru
ctur
e on
eco
nom
ic g
row
th
Aut
hor
Title
So
urce
Re
gion
M
etho
d-ol
ogy
Spec
ifica
tion
and
estim
atio
n Sa
mpl
e pe
riod
Sam
ple
type
Se
ctor
In
fras
truc
ture
va
riabl
e M
ain
resu
lts
Stur
m,
Deh
an
Is p
ublic
ex
pend
iture
re
ally
pro
-du
ctiv
e?
New
evi
-de
nce
for
the
US
and
The
Net
her-
land
s
Econ
omic
M
odel
-lin
g, 1
2,
1, 1
995
US
and
Net
her-
land
s se
para
tely
Prod
uc-
tion
func
-tio
n
Leve
ls a
nd f
irst
diff
er-
ence
bec
ause
of
no
stat
iona
rity
and
coin
-te
grat
ion.
No
endo
ge-
neity
cor
rect
ion
at-
tem
pted
.
1949
-19
85
for
the
US;
19
60-
1990
fo
r Th
e N
ethe
r-la
nds
Tim
e se
ries
To
tal e
con-
omy
US:
priv
ate
non
resi
dent
ial c
apita
l st
ock.
The
Net
h-er
land
s: B
uild
-in
gs, i
nfra
stru
c-tu
re, s
um o
f th
e tw
o.
US:
the
app
ropr
iate
spe
cific
a-tio
n (f
irst
diff
) sug
gest
s po
sitiv
e K
G e
las
but
sign
ifica
nt a
t on
ly
10%
(and
cou
nter
intu
itive
re
sults
for
labo
ur a
nd c
ap e
las)
. Th
e N
ethe
rland
s: b
uild
ings
not
si
gnifi
cant
, inf
rast
ruct
ure
sig-
nific
ant,
tot
al p
ublic
cap
ital
sign
ifica
nt a
nd v
ery
larg
e.
Infr
astr
uctu
re e
last
icity
ran
ges
betw
een
0.6
and
0.8.
Pe
rcoc
o In
fras
truc
-tu
re a
nd
econ
omic
ef
ficie
ncy
in
Italia
n re
-gi
ons
Net
wor
ks
and
spa-
tial e
co-
nom
ics,
4,
2004
Italia
n re
gion
s Pr
oduc
-tio
n fu
nc-
tion
Estim
ated
in le
vel,
inef
ficie
ncy
in p
rodu
c-tio
n as
sum
ed e
stim
at-
ing
a st
ocha
stic
pro
-du
ctio
n fr
ontie
r w
ith
ML,
fix
ed e
ffec
ts c
on-
side
red
and
endo
gen-
ity t
aken
into
acc
ount
1970
-19
94
Pane
l to
tal e
con-
omy
Stoc
k of
roa
ds,
Railw
ays,
m
aritm
e in
fra-
stru
ctur
e, c
om-
mun
icat
ion
Elas
ticity
of
outp
ut w
ith r
e-sp
ect
to K
G is
pos
itive
(abo
ut
0.10
-0.2
0, d
epen
ding
on
the
spec
ifica
tions
) and
it s
eem
s hi
ghes
t in
the
nor
th w
est.
Ra
ilway
s se
ems
the
mos
t im
-po
rtan
t in
fras
truc
ture
typ
e in
st
imul
atin
g te
chni
cal e
ffic
ienc
y K
amps
N
ew E
sti-
mat
es o
f G
over
n-m
ent
net
Cap
ital
Stoc
ks f
or
22 O
ECD
co
untr
ies
1960
-200
1
IMF
wor
k-in
g pa
per,
04
/67
22 O
ECD
co
untr
ies
Prod
uc-
tion
func
-tio
n
first
diff
eren
ce w
ith
fixed
eff
ects
. 19
60-
2001
Pa
nel
Tota
l eco
n-om
y N
et p
ublic
cap
ital
stoc
k Th
e el
astic
ity o
f ou
tput
to
KG
is
pos
itive
but
rea
sona
ble
(abo
ut 0
.2).
Step
han
Regi
onal
in
fras
truc
-tu
re p
olic
y an
d its
im
pact
on
prod
uctiv
-ity
: a c
om-
paris
on o
f G
erm
any
and
Fran
ce
DIW
D
iscu
s-si
ons
pape
rs,
2001
Ger
man
an
d Fr
ench
re
gion
s
Prod
uc-
tion
func
-tio
n
Estim
ated
in le
vels
w
ith f
ixed
eff
ects
, with
an
err
or t
erm
fol
low
-in
g an
ARM
A s
erie
s, b
y M
L
Ger
-m
any:
19
70-
95;
Fran
ce:
1978
-92
Pane
l re
gion
al
econ
omy
Infr
astr
uctu
re
stoc
k C
obb
Dou
glas
yile
ds a
n el
astic
-ity
of
abou
t 0.
08-
0.11

Anne
x 6
to C
OM
PETE
Fin
al R
epor
t: - 7
9 -
Impa
ct o
f tra
nspo
rt in
frast
ruct
ure
on e
cono
mic
gro
wth
Aut
hor
Title
So
urce
Re
gion
M
etho
d-ol
ogy
Spec
ifica
tion
and
estim
atio
n Sa
mpl
e pe
riod
Sam
ple
type
Se
ctor
In
fras
truc
ture
va
riabl
e M
ain
resu
lts
Cad
ot,
Rolle
r,
Step
han
Apo
litic
al
econ
omy
mod
el o
f in
fras
truc
-tu
re a
lloca
-tio
n: a
n em
piric
al
asse
ssm
ent
CEP
R di
scus
sion
pa
pers
, 22
36,
1999
Fran
ce
regi
ons
Prod
uc-
tion
func
-tio
n
Prod
uctio
n fu
nctio
n es
timat
ed jo
intly
with
an
equ
atio
n to
exp
lain
tr
ansp
ort
infr
astr
uctu
re
1985
-19
91
Pane
l re
gion
al
econ
omy
Infr
astr
uctu
re
capi
tal s
tock
Th
e el
astic
ity is
abo
ut 0
.10
Bona
glia
et
al
Publ
ic c
api-
tal a
nd
econ
omic
pe
rfor
m-
ance
: evi
-de
nce
from
Ita
ly
Mim
eo,
Uni
ver-
sita
' Boc
-co
ni
Italia
n re
gion
s TF
P re
-gr
essi
on,
prod
uc-
tion
func
-tio
n an
d co
st f
unc-
tion
TFP
regr
essi
on: T
FPg
on K
g, K
Gg
and
fe.
Prod
uctio
n fu
nctio
n:
leve
ls w
ith f
e. C
ost
func
tion
with
fe.
En-
doge
nity
in K
G in
the
pr
oduc
tion
func
tion
deal
t w
ith 2
SLS.
1970
-19
94
Pane
l re
gion
al
econ
omy
Stoc
k of
pub
lic
capi
tal (
mai
nly
road
s, r
ailw
ays,
po
rts,
wat
er,
com
mun
icat
ions
, pi
pelin
es, s
anita
-tio
n, la
nd)
Con
flict
ing
resu
lts: t
he T
FP
regr
essi
on s
how
s po
sitiv
e ef
fect
s of
KG
(K h
as n
egat
ive
effe
cts)
. Pro
duct
ion
func
tion:
sm
all a
nd in
sign
ifica
nt f
or It
aly,
dr
iven
by
nort
h w
est
regi
ons.
D
isag
greg
atin
g K
G s
eem
s to
sh
ow, f
or It
aly,
tha
t tr
ansp
ort
has
a po
sitiv
e an
d si
gnifi
cant
ef
fect
. Th
is is
how
ever
not
co
nfirm
ed in
a T
FP r
egre
ssio
n fr
amew
ork.
The
cos
t fu
nctio
n sh
ows
a ne
gativ
e el
astic
ity o
f co
sts
with
res
pect
to
KG
. Dif-
fere
nces
acr
oss
regi
ons:
cen
tre
and
sout
h te
nded
to
show
po
sitiv
e ef
fect
s of
KG
. C
adot
, Ro
ller,
St
epha
n
Con
trib
u-tio
n to
pr
oduc
tivity
or
por
k ba
rrel
? Th
e tw
o fa
ces
of in
fra-
stru
ctur
e in
vest
men
t
DIW
Be
rlin
458,
20
04
Fren
ch
regi
ons
Prod
uc-
tion
func
-tio
n
Prod
uctio
n fu
nctio
n es
timat
ed jo
intly
with
an
equ
atio
n to
exp
lain
tr
ansp
ort
infr
astr
uctu
re
join
tly e
stim
ated
with
FI
ML
1985
-19
92
Pane
l re
gion
al
econ
omy
Infr
astr
uctu
re
capi
tal s
tock
Po
sitiv
e el
astic
ity (a
bout
0.0
8)

- 80
- An
nex
06 to
CO
MPE
TE F
inal
Rep
ort:
Im
pact
of t
rans
port
infra
stru
ctur
e on
eco
nom
ic g
row
th
Tabl
e 4.
EU
: Cos
t fun
ctio
n ap
proa
ch
Aut
hor
Title
D
ate
sour
ce
Regi
on
Met
hodo
logy
sp
ecifi
catio
n an
d es
timat
ion
sam
ple
perio
d sa
mpl
e ty
pe
sect
or
Infr
astr
uctu
re
varia
ble
resu
lts
De-
met
riade
s,
Ma-
mun
eas
Inte
rtem
pora
l ou
tput
and
em
ploy
men
t ef
fect
s of
pu
blic
infr
a-st
ruct
ure
capi
tal:
evi-
denc
e fr
om
12 O
ECD
co
untr
ies
2000
Ec
onom
ic
Jour
nal,
110,
200
0
Aus
tral
ia,
Belg
ium
, N
orw
ay,
Swed
en,
Finl
and,
US,
C
anad
a,
Japa
n, G
er-
man
y.
Fran
ce, I
taly
, U
K
Prof
it fu
nctio
n pl
us o
ther
eq
uatio
ns
deriv
ed f
rom
pr
oduc
ers
inte
rtem
pora
l m
axim
isat
ion
Non
line
ar S
URE
sy
stem
(sho
rt
run
prof
it fu
nc-
tion,
sup
ply
func
tion
and
capi
tal s
tock
eq
uatio
ns).
Tim
e ef
fect
s pl
us s
tate
spe
-ci
fic c
onst
ants
.
1972
-91
Pane
l M
anuf
ac-
turin
g G
over
nmen
t ca
pita
l sto
ck
reco
nstr
ucte
d us
ing
the
serie
s of
gro
ss c
apita
l fo
rmat
ion
by
prod
ucer
s of
go
vern
men
t se
rvic
es (e
xclu
-si
ve o
f m
ilita
ry
exp)
Publ
ic c
apita
l has
a p
ositi
ve e
ffec
t on
out
put
(fro
m +
0.36
to
abou
t +
2%),
labo
ur a
nd c
apita
l de-
man
d. In
the
sho
rt r
un, o
verin
-ve
stm
ent
of p
ublic
cap
ital o
nly
in
Aus
tral
ia, N
orw
ay a
nd U
S, o
pti-
mal
pro
visi
on in
Sw
eden
and
Fi
nlan
d, u
nder
prov
isio
n in
the
ot
hers
. In
the
long
run
, und
erpr
o-vi
sion
eve
ryw
here
, tho
ugh
decl
in-
ing
in m
ost
coun
trie
s. C
ount
ries
with
low
KG
to
outp
ut r
atio
s ha
ve
the
high
est
retu
rns.
Priv
ate
capi
tal
mor
e pr
oduc
tive
than
pub
lic
capi
tal (
exce
pt S
wed
en, A
ustr
alia
, Be
lgiu
m a
nd F
inla
nd)
Bern
dt,
Han
sson
M
easu
ring
the
cont
ribu-
tion
of p
ublic
in
fras
truc
ture
ca
pita
l in
Swed
en
1992
Sc
andi
na-
vian
Jou
rnal
of
Eco
nom
-ic
s, 9
4,
1992
Swed
en
Labo
ur r
e-qu
irem
ent
func
tion
Leve
ls (a
ll va
ri-ab
les
divi
ded
by
outp
ut t
o re
-du
ce h
et-
eros
keda
stic
ity).
Poss
ible
en-
doge
neity
of
outp
ut t
este
d an
d re
ject
ed
1964
-198
8 Ti
me
serie
s To
tal
econ
omy
Agg
rega
te p
ub-
lic in
fras
truc
ture
st
ock;
cor
e pu
b-lic
infr
astr
uctu
re
stoc
k (r
oads
, hi
ghw
ays,
mas
s tr
ansi
t, a
irpor
ts,
wat
er a
nd s
ewer
m
ains
, rai
lroad
s.
Publ
ic c
apita
l red
uces
var
iabl
e co
sts
(in t
heir
case
labo
ur),
but
ther
e is
an
over
prov
isio
n of
pub
lic
capi
tal (
assu
min
g th
e be
nefit
s fo
r co
nsum
ers
are
zero
, as
com
mon
pr
actic
e in
thi
s lit
erat
ure)
, in
the
late
par
t of
the
sam
ple.
Lynd
e,
Rich
mon
d Pu
blic
cap
ital
and
long
run
co
sts
in U
K
man
ufac
tur-
ing
1993
Ec
onom
ic
Jour
nal,
103,
199
3
UK
co
st s
hare
s de
rived
fro
m a
co
st f
unct
ion
Cos
t sh
ares
are
es
timat
ed in
le
vels
, usi
ng t
he
Phili
ps a
nd
Han
sen
proc
e-du
re t
o ta
ke
into
acc
ount
th
eir
non
sta-
tiona
ry f
eatu
res
1966
-199
0 Ti
me
serie
s M
anuf
ac-
turin
g se
ctor
Publ
ic c
apita
l st
ock
(exc
lusi
ve
of d
wel
lings
)
They
use
d th
e re
sults
to
deco
m-
pose
the
rat
e of
gro
wth
of
labo
ur
prod
uctiv
ity in
to a
ter
m d
ue t
o pr
ivat
e ca
pita
l/lab
our
grow
th,
publ
ic c
apita
l/lab
our
grow
th a
nd
a re
sidu
al. C
hang
es in
KG
/labo
ur
ratio
exp
lain
ed a
bout
6%
of
rate
of
gro
wth
in la
bour
pro
duct
ivity
(a
s pr
ivat
e ca
pita
l to
labo
ur r
atio
), ev
en if
in t
he 1
980s
KG
con
trib
u-tio
n w
as n
eglig
ible
.

Anne
x 6
to C
OM
PETE
Fin
al R
epor
t: - 8
1 -
Impa
ct o
f tra
nspo
rt in
frast
ruct
ure
on e
cono
mic
gro
wth
Aut
hor
Title
D
ate
sour
ce
Regi
on
Met
hodo
logy
sp
ecifi
catio
n an
d es
timat
ion
sam
ple
perio
d sa
mpl
e ty
pe
sect
or
Infr
astr
uctu
re
varia
ble
resu
lts
Bosc
a et
al
The
effe
ct o
f pu
blic
infr
a-st
ruct
ure
on
the
priv
ate
prod
uctiv
e se
ctor
of
Span
ish
regi
ons
2002
Jo
urna
l of
Regi
onal
Sc
ienc
e
Span
ish
regi
ons
Var
iabl
e co
st
func
tion,
inpu
t de
man
d eq
ua-
tions
and
a
shor
t ru
n pr
icin
g eq
ua-
tion
Estim
atio
n us
ing
SURE
19
80-1
993
Pane
l Pr
ivat
e se
ctor
Pu
blic
cap
ital
stoc
k Th
e sh
adow
pric
e of
pub
lic c
apita
l is
pos
itive
, im
plyi
ng a
red
uctio
n of
va
riabl
e co
sts:
the
ave
rage
val
ue
for
the
elas
ticity
is -
0.03
(dec
linin
g ov
er t
ime)
, and
it is
pos
itive
in 1
5 ou
t of
17
regi
ons.
The
sha
dow
K
G is
pos
itive
in 1
5 ou
t of
17
regi
ons
(and
larg
e in
som
e) e
ven
in t
he lo
ng r
un (w
hen
the
priv
ate
capi
tal i
s ad
just
ed t
o its
long
run
eq
uilib
rium
). Th
e ou
tput
ela
stic
ity
of K
G is
abo
ut 0
.02
and
slig
htly
hi
gher
in t
he lo
ng r
un. T
he a
ctua
l K
G w
as u
nder
prov
ided
in t
he
early
per
iod
whi
le t
he g
ap w
as
near
ly c
lose
d in
199
3. K
G a
nd K
co
mpl
emen
ts
Mor
eno
et
al
On
the
effe
c-tiv
enes
s of
pr
ivat
e an
d pu
blic
cap
ital
2003
A
pplie
d Ec
onom
ics
Span
ish
regi
ons
Var
iabl
e co
st
func
tion,
cos
t sh
ares
plu
s re
gion
al a
nd
sect
oral
ef-
fect
s
Estim
atio
n us
ing
SURE
and
re-
gion
al a
nd
sect
oral
eff
ects
1980
-199
1 Pa
nel
12 m
anu-
fact
urin
g in
dust
ries
Stoc
k of
pub
lic
core
infr
astr
uc-
ture
The
elas
ticity
of
varia
ble
cost
s w
ith r
espe
ct t
o K
G is
neg
ativ
e (-
0.02
) but
har
dly
sign
ifica
nt. T
he
aver
age
outp
ut e
last
icity
is p
osi-
tive
but
low
(0.0
2). D
iffer
ent
sect
ors
and
regi
ons
show
ed
rath
er d
iffer
ent
patt
erns
, how
-ev
er. E
lect
ric m
achi
nery
, foo
d an
d dr
inks
and
tex
tiles
are
the
se g
ain-
ing
mos
t fr
om K
G. K
G a
ppea
rs t
o be
mor
e im
port
ant
whe
n pr
ivat
e ca
pita
l is
scar
ce.

- 82
- An
nex
06 to
CO
MPE
TE F
inal
Rep
ort:
Im
pact
of t
rans
port
infra
stru
ctur
e on
eco
nom
ic g
row
th
Aut
hor
Title
D
ate
sour
ce
Regi
on
Met
hodo
logy
sp
ecifi
catio
n an
d es
timat
ion
sam
ple
perio
d sa
mpl
e ty
pe
sect
or
Infr
astr
uctu
re
varia
ble
resu
lts
Rovo
lis,
Spen
ce
Dua
lity
the-
ory
and
cost
fu
nctio
n an
alys
is in
a
regi
onal
co
ntex
t: t
he
impa
ct o
f pu
blic
infr
a-st
ruct
ure
capi
tal i
n th
e G
reek
re-
gion
s
2002
A
nnal
s of
re
gion
al
Scie
nce,
36,
20
02
Gre
ece
pref
ectu
res
Cos
t fu
nctio
n pl
us c
ost
shar
es.
estim
atio
n by
SU
RE, f
ixed
ef
fect
s in
bot
h co
st a
nd in
put
dem
and
equa
-tio
ns,
1982
-199
1 Pa
nel
man
u-fa
ctur
ing
Infr
astr
uctu
re
stoc
k K
G r
educ
es c
osts
in a
ll re
gion
s (t
he v
alue
is 0
.06,
alth
ough
sta
tis-
tical
sig
nific
ance
not
che
cked
). K
G
is a
sub
stitu
te f
or la
bour
and
in
term
edia
te in
puts
and
a c
om-
plem
ent
for
capi
tal.
Seitz
Pu
blic
cap
ital
and
dem
and
for
priv
ate
inpu
ts
1994
Jo
urna
l of
publ
ic e
co-
nom
ics,
54,
19
94
31 2
-dig
it m
anuf
actu
r-in
g in
dus-
trie
s
Cos
t fu
nctio
n pl
us c
ost
shar
es
estim
atio
n by
SU
RE, f
ixed
ef
fect
s in
bot
h co
st a
nd in
put
dem
and
equa
-tio
ns.
1970
-198
9 Pa
nel
man
ufac
-tu
ring
Tota
l pub
lic
capi
tal
stoc
k/co
re in
fra-
stru
ctur
e (H
ous-
ing,
Tra
nspo
rt,
com
mun
icat
ion,
re
crea
tion)
cor
-re
cted
for
CU
The
shad
ow v
alue
of
publ
ic c
api-
tal i
s po
sitiv
e (i.
e. it
red
uces
tot
al
cost
s) b
ut v
ery
low
: 100
0DM
of
publ
ic c
apita
l wou
ld r
educ
e to
tal
cost
s by
abo
ut 2
DM
(tot
al G
K) o
r 3.
6 D
M (c
ore
infr
astr
uctu
re).
KG
an
d K
com
plem
ents
KG
and
la-
bour
sub
stitu
tes.
M
amat
-za
kis
Publ
ic in
fra-
stru
ctur
e,
priv
ate
inpu
t de
man
d, a
nd
econ
omic
pe
rfor
man
ce
in t
he G
reek
in
dust
ry
1999
M
imeo
, Q
ueen
Mar
y an
d W
est-
field
Col
lege
20 2
-dig
it m
anuf
actu
r-in
g in
dus-
trie
s
Cos
t fu
nctio
n pl
us c
ost
shar
es
Estim
atio
n by
SU
RE
1959
-199
0 Pa
nel
larg
e sc
ale
man
ufac
-tu
ring
Cor
e in
fras
truc
-tu
re
Publ
ic c
apita
l red
uces
tot
al c
osts
(e
last
iciti
es b
etw
een
-0.0
2 to
-0.
78. a
nd in
mos
t in
dust
ries
also
m
argi
nal c
osts
. KG
is a
com
ple-
men
t to
priv
ate
capi
tal,
subs
titut
e fo
r L.
KG
con
trib
utes
pos
itive
ly f
or
mos
t of
the
indu
strie
s to
pro
duc-
tivity
gro
wth
(fro
m -
0.03
% t
o +
0.
53%
), ev
en if
at
a de
clin
ing
rate

Anne
x 6
to C
OM
PETE
Fin
al R
epor
t: - 8
3 -
Impa
ct o
f tra
nspo
rt in
frast
ruct
ure
on e
cono
mic
gro
wth
Aut
hor
Title
D
ate
sour
ce
Regi
on
Met
hodo
logy
sp
ecifi
catio
n an
d es
timat
ion
sam
ple
perio
d sa
mpl
e ty
pe
sect
or
Infr
astr
uctu
re
varia
ble
resu
lts
Gil
Ca-
nale
ta e
t al
Publ
ic c
api-
tal,
regi
onal
pr
oduc
tivity
an
d sp
atia
l sp
illov
ers
1998
U
nive
rsity
of
Nav
arra
Sp
anis
h re
gion
s C
ost
func
tion
and,
sep
a-ra
tely
, a p
ro-
duct
ion
func
-tio
n in
corp
o-ra
ting
prof
it m
axim
iasa
tion
rest
rictio
ns
Estim
atio
n w
ith
sure
and
FE
in
both
cos
t fu
nc-
tion
and
shar
es
1964
-199
1 Pa
nel
Agr
icul
-tu
re,
indu
stry
an
d se
r-vi
ces
Stoc
k of
pub
lic
capi
tal o
r tr
asnp
ort
infr
a-st
ruct
ure
Elas
ticity
of
cost
s w
ith r
espe
ct t
o to
tal K
G is
neg
ativ
e (a
bout
-0.
14),
whi
le f
or t
rans
port
cap
ital i
s lo
wer
(in
abs
olut
e va
lue)
and
eve
n po
si-
tive
for
agric
ultu
re. P
rodu
ctio
n el
astic
ities
are
in g
ener
al p
ositi
ve
and
reas
onab
ly lo
w w
hen
tran
s-po
rt is
use
d, a
nd h
ighe
r w
hen
tota
l KG
is u
sed.
Whe
n th
ey a
c-co
unt
for
spill
over
eff
ects
(the
y us
e a
wei
ghte
d av
erag
e of
the
ot
her
regi
ons
tran
spor
t in
fras
truc
-tu
re w
eigh
ted
by s
hare
s in
tra
de
flow
s) t
he p
rodu
ctio
n el
astic
ities
te
nd t
o gr
ow.
Seitz
, Lic
ht
The
impa
ct
of p
ublic
in
fras
truc
ture
ca
pita
l on
regi
onal
m
anuf
actu
r-in
g pr
oduc
-tio
n co
sts
1995
Re
gion
al
Stud
ies,
29,
3,
199
5
Ger
man
le
nder
s C
ost
func
tion
and
fact
or
shar
es
Estim
atio
n by
SU
RE a
ssum
ing
fixed
eff
ects
in
the
cost
as
wel
l as
fac
tor
shar
e eq
uatio
ns.
Fact
or p
rices
an
d ou
tput
in
stru
men
ted
1971
-198
8 Pa
nel
Man
ufac
-tu
ring
sect
or a
t re
gion
al
leve
l
Publ
ic c
apita
l st
ock
KG
com
plem
ent
to p
rivat
e ca
pita
l an
d su
bstit
ute
to la
bour
inpu
t.
Elas
ticity
of
cost
s to
pub
lic c
apita
l st
rong
ly n
egat
ive
ever
ywhe
re (-
0.2
on a
vera
ge),
espe
cial
ly in
re
gion
s w
ith la
rge
area
s.
Avi
les
Zuga
sti e
t al
The
effe
ct o
f pu
blic
infr
a-st
ruct
ure
on
the
cost
st
ruct
ure
of
Span
ish
indu
strie
s
2001
Sp
anis
h Ec
onom
ic
revi
ew, 3
, 20
01
Spai
n V
aria
ble
cost
fu
nctio
n w
ith
fact
or s
hare
s
Estim
atio
n w
ith
sure
and
FE
in
the
cost
fun
c-tio
n. E
ndog
ene-
ity t
ests
on
publ
ic a
nd
priv
ate
capi
tal
perf
orm
ed a
nd
reje
cted
1980
-199
1 Pa
nel
19 in
dus-
trie
s St
ock
of c
ore
publ
ic in
fras
truc
-tu
re
Posi
tive
shad
ow p
rice
of p
ublic
ca
pita
l, ev
en if
larg
e va
riatio
n ac
ross
indu
strie
s. T
he e
last
icity
of
outp
ut w
ith r
espe
ct t
o K
G is
po
sitiv
e an
d, o
n av
erag
e eq
ual t
o 0.
24 (l
ower
tha
n th
at o
f pr
ivat
e ca
pita
l).La
bour
and
inte
rmed
iate
m
ater
ials
are
sub
stitu
tes
to K
G in
al
l ind
ustr
ies.

- 84
- An
nex
06 to
CO
MPE
TE F
inal
Rep
ort:
Im
pact
of t
rans
port
infra
stru
ctur
e on
eco
nom
ic g
row
th
Aut
hor
Title
D
ate
sour
ce
Regi
on
Met
hodo
logy
sp
ecifi
catio
n an
d es
timat
ion
sam
ple
perio
d sa
mpl
e ty
pe
sect
or
Infr
astr
uctu
re
varia
ble
resu
lts
Ferr
ara,
M
arce
llino
TF
P, c
osts
an
d pu
blic
in
fras
truc
-tu
re: a
n eq
uivo
cal
rela
tions
hip
2000
M
imeo
, U
nive
rsita
' Bo
ccon
i
Italia
n re
-gi
ons
TFP
regr
essi
on,
prod
uctio
n fu
nctio
n an
d co
st f
unct
ion
TFP
regr
essi
on:
TFPg
on
Lg, K
g,
KG
g an
d fe
. Pr
oduc
tion
func
tion:
leve
ls
with
fe.
Var
iabl
e co
st f
unct
ion
with
fe.
En-
doge
nity
in K
G
in t
he p
rodu
c-tio
n fu
nctio
n de
alt
with
2SL
S.
1970
-199
4 Pa
nel
regi
onal
in
dust
rial
sect
or
Stoc
k of
pub
lic
capi
tal (
mai
nly
road
s, r
ailw
ays,
po
rts,
wat
er ,
com
mun
icat
ions
, pi
pelin
es, s
anita
-tio
n, la
nd)
TFP
appr
oach
: for
Ital
y el
astic
ity o
f K
G h
igh
(0.4
7) a
nd s
ig. i
t is
pos
fo
r So
uth,
insi
gnifi
cant
for
Nor
th.
Prod
fun
ctio
n ap
proa
ch: e
last
icity
of
KG
neg
ativ
e: a
cros
s su
b pe
ri-od
s, t
his
is t
rue
only
in t
he 7
0s, i
n re
cent
yea
rs is
pos
and
incr
easi
ng;
KG
ela
stic
ity is
hig
her
in t
he
Sout
h, f
ollo
wed
by
the
cent
re.
Cos
t fu
nctio
n: K
G d
oes
not
re-
duce
cos
ts f
or It
aly
(with
the
ex
cept
ion
of t
he 7
0s).
In s
ome
area
s it
redu
ced
cost
s, b
ut t
here
w
as o
verin
vest
men
t.
Ever
aert
, H
eyle
n Pu
blic
cap
ital
and
long
te
rm la
bour
m
arke
t pe
r-fo
rman
ce in
Be
lgiu
m
2004
Jo
urna
l of
polic
y M
od-
ellin
g, 2
6,
2004
Belg
ium
D
ynam
ic s
truc
-tu
ral m
odel
EC
M jo
int
esti-
mat
ion
of f
acto
r de
man
d eq
ua-
tions
, wag
e eq
uatio
n, d
o-m
estic
and
ex
tern
al d
e-m
and
1968
-199
6 Ti
me
serie
s to
tal
econ
omy
Publ
ic c
apita
l st
ock
The
elas
ticity
of
cost
s to
pub
lic
capi
tal i
s ne
gativ
e an
d si
gnifi
cant
(-
0.28
, whi
ch im
plie
s on
e m
ore
euro
of
publ
ic c
apita
l red
uces
to
tal c
osts
of
0.24
eur
os).
Priv
ate
and
publ
ic c
apita
l are
com
ple-
men
ts a
nd p
ublic
cap
ital a
nd
labo
ur s
ubst
itute
s.
Bona
glia
et
al
Publ
ic c
apita
l an
d ec
o-no
mic
per
-fo
rman
ce:
evid
ence
fr
om It
aly
2000
M
imeo
, U
nive
rsita
' Bo
ccon
i
Italia
n re
-gi
ons
TFP
regr
essi
on,
prod
uctio
n fu
nctio
n an
d co
st f
unct
ion
TFP
regr
essi
on:
TFPg
on
Kg,
K
Gg
and
fe.
Prod
uctio
n fu
nctio
n: le
vels
w
ith f
e. V
aria
ble
cost
fun
ctio
n w
ith f
e. E
n-do
geni
ty in
KG
in
the
pro
duc-
tion
func
tion
deal
t w
ith 2
SLS.
1970
-199
4 Pa
nel
regi
onal
ec
onom
y St
ock
of p
ublic
ca
pita
l (m
ainl
y ro
ads,
rai
lway
s,
port
s, w
ater
, co
mm
unic
atio
ns,
pipe
lines
, san
ita-
tion,
land
)
Con
flict
ing
resu
lts: t
he T
FP r
egre
s-si
on s
how
s po
sitiv
e ef
fect
s of
KG
(K
has
neg
ativ
e ef
fect
s). P
rodu
c-tio
n fu
nctio
n: s
mal
l and
insi
gnifi
-ca
nt f
or It
aly,
driv
en b
y no
rth
wes
t re
gion
s. D
isag
greg
atin
g K
G
seem
s to
sho
w, f
or It
aly,
tha
t tr
ansp
ort
has
a po
sitiv
e an
d si
g-ni
fican
t ef
fect
. Th
is is
how
ever
no
t co
nfirm
ed in
a T
FP r
egre
ssio
n fr
amew
ork.
The
cos
t fu
nctio
n sh
ows
a ne
gativ
e el
astic
ity o
f co
sts
with
res
pect
to
KG
. Diff
er-
ence
s ac
ross
reg
ions
: cen
tre
and
sout
h te
nded
to
show
pos
itive
ef
fect
s of
KG
.

Anne
x 6
to C
OM
PETE
Fin
al R
epor
t: - 8
5 -
Impa
ct o
f tra
nspo
rt in
frast
ruct
ure
on e
cono
mic
gro
wth
Tabl
e 5.
EU
: VA
R a
ppro
ach
Aut
hor
Title
so
urce
Re
gion
M
etho
d-ol
ogy
spec
ifica
tion
and
estim
atio
n sa
mpl
e pe
riod
sam
ple
type
se
ctor
In
fras
truc
ture
va
riabl
e re
sults
Pere
ira, R
oca
Publ
ic c
apita
l fo
rmat
ion
and
regi
onal
dev
el-
opm
ent
in S
pain
Revi
ew o
f D
evel
opm
ent
Econ
omic
s, 3
, 3,
199
9
Spai
n V
AR
VA
R in
firs
t di
ffer
-en
ce
1970
-198
9 Ti
me
serie
s to
tal e
con-
omy
Publ
ic c
apita
l st
ock
in t
rans
-po
rt a
nd
com
mun
ica-
tion
infr
a-st
ruct
ure
Empl
oym
ent
and
priv
ate
capi
tal e
last
icity
with
re-
spec
t to
pub
lic c
apita
l sto
ck is
0.4
, whi
le o
utpu
t el
astic
ity is
0.3
8 (a
one
add
ition
al p
eset
a of
pub
lic
capi
tal r
aise
s ou
tput
by
4.38
pes
atas
in t
he lo
ng r
un,
whi
ch im
plie
s a
rate
of
retu
rn o
f 6%
). Ef
fect
s of
pu
blic
cap
ital u
neve
n in
the
reg
ions
, with
the
mos
t de
velo
ped
ones
gai
ning
the
mos
t. H
owev
er, c
onfi-
denc
e in
terv
als
not
repo
rted
Pe
reira
, Roc
a In
fras
truc
ture
and
pr
ivat
e se
ctor
pe
rfor
man
ce in
Sp
ain
Jour
nal o
f Po
licy
Mod
el-
ling,
23,
200
1
Spai
n V
AR
VA
R in
firs
t di
ffer
-en
ce
1970
-199
3 Ti
me
serie
s to
tal e
con-
omy
and
4 se
ctor
s (a
gric
ultu
re,
man
ufac
tur-
ing,
con
-st
ruct
ion,
an
d se
rvic
es)
sepa
rate
ly
Publ
ic c
apita
l st
ock
in t
rans
-po
rt a
nd
com
mun
ica-
tion
infr
a-st
ruct
ure
Publ
ic c
apita
l sto
ck n
ot a
n ex
ogen
ous
varia
ble.
El
astic
ities
of
empl
oym
ent,
priv
ate
capi
tal a
nd o
utpu
t ar
e po
sitiv
e (0
.49,
0.5
2 an
d 0.
31, i
mpl
ying
mar
gina
l pr
oduc
ts o
f 3.
28, 1
0.18
, 5.5
(and
a r
ate
of r
etur
n of
7.
7%).
Elas
ticiti
es t
end
to b
e ne
gativ
e fo
r ag
ricul
-tu
re, a
nd p
ositi
ve f
or t
he o
ther
sec
tors
, with
con
-st
ruct
ion
bene
fitin
g th
e m
ost
(the
out
put
elas
ticity
is
1.23
for
con
s., 0
.81
for
man
ufac
turin
g an
d 0.
37 f
or
serv
ices
). M
argi
nal p
rodu
cts
sugg
est
that
man
ufac
-tu
ring
take
s th
e 41
.5 o
f th
e ef
fect
s of
pub
lic c
apita
l on
out
put,
ser
vice
s 37
and
con
stru
ctio
n 22
. How
-ev
er, c
onfid
ence
inte
rval
s no
t re
port
ed
Pere
ira, R
oca
Spill
over
eff
ects
of
pub
lic c
apita
l fo
rmat
ion:
evi
-de
nce
from
the
Sp
anis
h re
gion
s
Jour
nal o
f U
rban
Eco
nom
-ic
s
Spai
n an
d Sp
anis
h re
gion
s
VA
R V
AR
in f
irst
diff
er-
ence
19
70-1
995
Tim
e se
ries
tota
l eco
n-om
y Pu
blic
cap
ital
stoc
k in
tra
ns-
port
and
co
mm
unic
a-tio
n in
fra-
stru
ctur
e
Publ
ic c
apita
l not
exo
geno
us in
the
mod
el. E
last
icity
of
out
put
is p
ositi
ve in
Spa
in u
sing
agg
rega
te d
ata
(0.5
2, w
hich
impl
ies
a m
argi
nal p
rodu
ct o
f ab
out
2.9
and
a ra
te o
f re
turn
of
5.5%
). Th
e re
gion
al a
naly
sis
show
som
e di
sper
sion
and
the
agg
rega
te e
ffec
ts
over
all
regi
ons
acco
unt
for
only
44%
of
the
tota
l ef
fect
der
ived
in t
he a
ggre
gate
mod
el. C
onsi
derin
g al
so t
he c
apita
l ins
talle
d in
oth
er r
egio
ns a
lters
the
re
sults
sig
nific
antly
: the
pub
lic c
apita
l in
the
regi
on
affe
cts
posi
tivel
y ou
tput
, as
capi
tal i
nsta
lled
outs
ide
does
. Thi
s sh
ows
that
spi
llove
rs e
ffec
ts t
end
to b
e im
port
ant,
esp
ecia
lly f
or p
erip
hera
l reg
ions
. How
-ev
er, c
onfid
ence
inte
rval
s no
t re
port
ed

- 86
- An
nex
06 to
CO
MPE
TE F
inal
Rep
ort:
Im
pact
of t
rans
port
infra
stru
ctur
e on
eco
nom
ic g
row
th
Aut
hor
Title
so
urce
Re
gion
M
etho
d-ol
ogy
spec
ifica
tion
and
estim
atio
n sa
mpl
e pe
riod
sam
ple
type
se
ctor
In
fras
truc
ture
va
riabl
e re
sults
Pere
ira,
And
raz
Publ
ic in
vest
men
t in
Tra
nspo
rtat
ion
Infr
astr
uctu
re a
nd
Econ
omic
per
-fo
rman
ce in
Po
rtug
al
Revi
ew o
f D
evel
opm
ent
Econ
omic
s, 9
, 2,
200
5
Port
u-ga
l V
AR
VA
R in
firs
t di
ffer
-en
ce
1976
-199
8 Ti
me
serie
s to
tal e
con-
omy
Publ
ic in
vest
-m
ent
in t
rans
-po
rtat
ion
infr
astr
uctu
re
as a
who
le
and
disa
ggre
-ga
ted
(na-
tiona
l roa
ds,
mun
icip
al
road
s, h
igh-
way
s, p
orts
, ai
rpor
ts,
railw
ays)
Publ
ic in
vest
men
t ex
ogen
ous,
whi
le t
his
is n
ot t
he
case
for
som
e su
b-ca
tego
ries.
Pub
lic in
vest
men
t ra
ises
priv
ate
inve
stm
ent
(ela
stic
ity 0
.64)
em
ploy
-m
ent
(ela
stic
ity 0
.08
whi
ch im
plie
s 23
0 ad
ditio
nal
jobs
cre
ated
out
of
one
mill
ion
euro
s in
pub
lic in
-ve
stm
ent
in t
rans
port
infr
astr
uctu
re) a
nd o
utpu
t (e
last
icity
0.1
8 w
hich
impl
ies
a ra
te o
f re
turn
of
15.9
%).
At
disa
ggre
gate
d le
vel t
he r
esul
ts a
re c
on-
firm
ed: i
n pa
rtic
ular
, pub
lic in
vest
men
t in
nat
iona
l ro
ads
have
the
larg
est
effe
ct o
n bo
th o
utpu
t, e
m-
ploy
men
t an
d pr
ivat
e ca
pita
l; pu
blic
inve
stm
ents
in
airp
orts
are
the
leas
t ef
fect
ive
Ligt
hart
Pu
blic
cap
ital,
and
outp
ut g
row
th in
Po
rtug
al: a
n em
piric
al a
naly
sis
IMF
wor
king
pa
pers
, 11,
20
00
Port
u-ga
l V
AR
Leve
ls a
nd f
irst
dif-
fere
nces
and
VA
R 19
65-1
995
Tim
e se
ries
tota
l eco
n-om
y Eq
uipm
ent
and
tran
spor
t m
ater
ial,
cons
truc
tion,
co
re in
fra-
stru
ctur
e
Posi
tive
elas
ticity
(abo
ut 0
.20-
0.35
) for
the
pro
duc-
tion
func
tion,
cor
e in
fras
truc
ture
the
mos
t im
por-
tant
. How
ever
, VA
R m
odel
s su
gges
t th
at t
he K
G
effe
ct o
n ou
tput
is in
sign
ifica
nt
Kam
ps
The
dyna
mic
ef
fect
s of
pub
lic
capi
tal:
VA
R ev
iden
ce f
or 2
2 O
ECD
cou
ntrie
s
Kie
l wor
king
pa
per
1224
, 20
04
22
OEC
D
coun
-tr
ies
VA
R V
AR
estim
ated
with
Jo
hans
en M
L pr
oce-
dure
1960
-200
1 Ti
me
serie
s to
tal e
con-
omy
Publ
ic n
et
capi
tal s
tock
Fo
r m
ost
coun
trie
s (1
3) t
he lo
ng r
un e
last
icity
of
outp
ut t
o K
G is
pos
itive
and
sig
nific
ant
at t
he 6
8%
leve
l, fo
r tw
o is
neg
ativ
e, a
nd f
or t
he o
ther
s is
not
si
gnifi
cant
ly d
iffer
ent
from
zer
o.
mitt
nik,
N
eum
ann
Dyn
amic
eff
ects
of
pub
lic in
vest
-m
ent:
Vec
tor
auto
regr
essi
ve
evid
ence
fro
m s
ix
indu
stria
lized
co
untr
ies
Empi
rical
ec
onom
ics,
26,
20
01
Can
-ad
a,
Fran
ce,
UK
, Ja
pan,
Th
e N
ethe
r-la
nds,
G
er-
man
y
VA
R V
ECM
est
imat
ed
with
Joh
anse
n M
L pr
oced
ure
Can
ada:
19
55-9
4;
Fran
ce: 1
970-
94; U
K:
1962
-93;
Ja
pan:
195
5-94
; The
N
ethe
rland
s:
1977
-94;
G
erm
any:
19
60-8
9.
Qua
rter
ly
data
Tim
e se
ries
Tota
l eco
n-om
y Pu
blic
inve
st-
men
t Th
e lo
ng r
un e
last
icity
of
outp
ut t
o pu
blic
inve
stm
ent
is s
mal
l. Po
sitiv
e, b
ut in
gen
eral
insi
gnifi
cant
(with
th
e ex
cept
ion
of G
erm
any
and
The
Net
herla
nds)
. Pu
blic
inve
stm
ent
does
not
in g
ener
al s
eem
s to
be
driv
en b
y G
DP.
Stur
m, J
a-co
bs, G
root
e O
utpu
t ef
fect
s of
in
fras
truc
ture
in
vest
men
t in
The
N
ethe
rland
s 18
53-1
913
Jour
nal o
f M
acro
econ
om-
ics,
2, 2
1, 1
999
The
Net
her-
land
s
VA
R V
AR
1853
-191
3 Ti
me
serie
s To
tal e
con-
omy
Tran
spor
t in
fras
truc
ture
ca
pita
l for
ma-
tion
Posi
tive
effe
cts
in t
he s
hort
run
, ins
igni
fican
t in
the
lo
ng r
un

Anne
x 6
to C
OM
PETE
Fin
al R
epor
t: - 8
7 -
Impa
ct o
f tra
nspo
rt in
frast
ruct
ure
on e
cono
mic
gro
wth
Aut
hor
Title
so
urce
Re
gion
M
etho
d-ol
ogy
spec
ifica
tion
and
estim
atio
n sa
mpl
e pe
riod
sam
ple
type
se
ctor
In
fras
truc
ture
va
riabl
e re
sults
Flor
es d
e Fr
utos
, G
arci
a, P
erez
Publ
ic c
apita
l and
ec
onom
ic
grow
th: A
n an
alys
is o
f th
e Sp
anis
h ec
onom
y
App
lied
Eco-
nom
ics,
30,
8,
1998
Spai
n V
AR
VA
RMA
in f
irst
diff
eren
ces
19
64-1
992
Tim
e se
ries
natio
nal
econ
omy
Infr
astr
uctu
re
capi
tal s
tock
Po
sitiv
e ef
fect
s on
out
put
Mam
atza
kis
Test
ing
for
the
long
run
rel
atio
n-sh
ip b
etw
een
infr
astr
uctu
re a
nd
priv
ate
capi
tal
prod
uctiv
ity a
tim
e se
ries
anal
y-si
s fo
r th
e G
reek
in
dust
ry
App
lied
Eco-
nom
ics
Lett
ers,
6,
4, 1
999
Gre
ece
VA
R V
ECM
19
59-1
993
Tim
e se
ries
natio
nal
econ
omy
Publ
ic c
apita
l st
ock
Publ
ic c
apita
l exo
geno
us, p
ositi
ve e
ffec
ts o
f K
G o
n ou
tput
Ever
aert
Ba
lanc
ed g
row
th
and
publ
ic c
api-
tal:
an e
mpi
rical
an
alys
is w
ith I(
2)
tren
ds in
cap
ital
stoc
k da
ta
Econ
omic
M
odel
ling,
20,
20
03
Belg
ium
VA
R V
ECM
est
imat
ed
with
Joh
anse
n M
L pr
oced
ure
1953
-199
6 Ti
me
serie
s na
tiona
l ec
onom
y Pu
blic
cap
ital
stoc
k Po
sitiv
e el
astic
ity o
f ou
tput
(abo
ut 0
.14)

- 88
- An
nex
06 to
CO
MPE
TE F
inal
Rep
ort:
Im
pact
of t
rans
port
infra
stru
ctur
e on
eco
nom
ic g
row
th
Tabl
e 6.
US
: var
ious
app
roac
hes
Aut
hor
Title
So
urce
Re
gion
M
etho
dolo
gy
Spec
ifica
tion
Sam
ple
Perio
d Sa
mpl
e ty
pe
Infr
astr
uctu
re V
aria
ble
Resu
lts
Asc
haue
r,
D.A
. Is
pub
lic e
xpen
di-
ture
pro
duct
ive?
Jo
urna
l of
Mon
e-ta
ry E
cono
mic
s,
1988
US:
Nat
iona
l O
LS. C
ompl
emen
tary
reg
ress
ions
ar
e ru
n us
ing
Firs
t O
rder
Aut
ocor
-re
latio
n C
oeff
icie
nt (F
OA
RC),
Inst
rum
enta
l Var
iabl
es (I
V),
and
Non
Lin
ear
Leas
t Sq
uare
s (N
LLS)
to
test
the
rob
ustn
ess
of t
he r
esul
ts.
Cob
b-D
ougl
ass
pro-
duct
ion-
func
tion
estim
ated
for
abs
olut
e le
vels
and
Tot
al F
acto
r Pr
oduc
tivity
.
Ann
ual
1949
-198
5 Ti
me-
Serie
s M
onet
ary
valu
e of
pu
blic
cap
ital s
tock
de
fined
as
fede
ral,
stat
e, a
nd lo
cal c
apita
l st
ock
of e
quip
men
t an
d st
ruct
ures
.
Elas
ticity
of
publ
ic c
apita
l is
0.35
C
ore
infr
astr
uctu
re –
i.e. m
otor
way
s,
airp
orts
, ele
ctric
al a
nd g
as f
acili
ties,
wat
er
sew
ers-
acc
ount
s fo
r 55
% o
f th
e ef
fect
of
publ
ic c
apita
l sto
ck o
n pr
oduc
tivity
.
Boar
net,
M.
The
dire
ct a
nd
indi
rect
eco
-no
mic
eff
ect
of
tran
spor
t in
fra-
stru
ctur
e.
Uni
vers
ity o
f C
alifo
rnia
at
Irvin
e. W
orki
ng
Pape
r, 1
996
Cal
iforn
ia:
Cou
ntie
s O
LS. C
ompl
emen
tary
reg
ress
ions
ar
e ru
n us
ing
pool
ed lo
ng d
iffer
-en
ces.
Cob
b-D
ougl
ass
pro-
duct
ion-
func
tion
with
fix
ed c
ount
y le
vel
estim
ated
in lo
ng
diff
eren
ces.
It c
ontr
ols
for
fixed
geo
grap
hica
l sp
illov
ers.
Ann
ual
1969
-198
8
Pane
l D
ata
Mon
etar
y va
lue
of
stre
et a
nd h
ighw
ay
capi
tal s
tock
.
Cou
nty
infr
astr
uctu
re h
as a
pos
itive
and
si
gnifi
cant
eff
ect
on o
utpu
t: E
stim
ated
el
astic
ity r
ange
s be
twee
n 0.
16 a
nd 0
.22.
C
ount
y in
fras
truc
ture
app
ears
to
have
ne
gativ
e an
d si
gnifi
cant
geo
grap
hica
l sp
illov
ers.
Boar
net,
M.
Spill
over
s an
d th
e lo
catio
nal e
ffec
ts
of p
ublic
infr
a-st
ruct
ure.
Jour
nal o
f Re
-gi
onal
Sci
ence
, 19
98
Cal
iforn
ia:
Cou
ntie
s
Pool
ed O
LS lo
ng d
iffer
ence
s.
Com
plem
enta
ry IV
reg
ress
ions
are
ru
n to
tes
t en
doge
neity
of
publ
ic
capi
tal.
Cob
b-D
ougl
ass
pro-
duct
ion-
func
tion
with
fix
ed c
ount
y le
vel
estim
ated
in lo
ng
diff
eren
ces.
It c
ontr
ols
for
fixed
geo
grap
hica
l sp
illov
ers.
Ann
ual
1969
-198
8 Pa
nel
Dat
a M
onet
ary
valu
e of
st
reet
and
hig
hway
ca
pita
l sto
ck.
Cou
nty
infr
astr
uctu
re is
pro
duct
ive
with
an
est
imat
ed e
last
icity
ran
ging
bet
wee
n 0.
23 a
nd 0
.30
depe
ndin
g on
the
spe
cifi-
catio
n.
Ther
e ar
e ne
gativ
e sp
illov
ers
from
pub
lic
capi
tal a
nd t
hese
are
str
onge
r ac
ross
si
mila
r ur
bani
sed
coun
ties.
C
ohen
, J. a
nd
Mor
rison
, C.
Airp
ort
infr
a-st
ruct
ure
spill
-ov
ers
in a
net
-w
ork
syst
em.
Jour
nal o
f U
rban
Ec
onom
ics,
200
3 M
anuf
. US:
48
Con
tigu-
ous
Stat
es
OLS
. Com
plem
enta
ry r
egre
ssio
ns
are
run
unde
r G
ener
alis
ed M
etho
d of
Mom
ents
(GM
M) w
ith S
patia
l A
utor
egre
ssiv
e Er
ror
(SA
R) r
egre
s-si
ons
to t
est
the
robu
stne
ss o
f th
e re
sults
.
Gen
eral
ised
Leo
ntie
f co
st-f
unct
ion.
It c
on-
trol
s fo
r fix
geo
grap
hi-
cal s
pillo
vers
and
sp
atia
l aut
ocor
rela
tion.
Ann
ual
1982
-199
6
Pane
l D
ata
Mon
etar
y va
lue
of
airp
ort
infr
astr
uctu
re
stoc
k.
Airp
ort
infr
astr
uctu
re is
pro
duct
ive
with
an
est
imat
ed c
ost
elas
ticity
of
0.11
3 in
ab
solu
te v
alue
. A
irpor
t in
fras
truc
ture
has
pos
itive
spi
ll-ov
er e
ffec
ts.
Coh
en, J
. and
M
orris
on, C
. Pu
blic
infr
astr
uc-
ture
inve
stm
ent,
in
ter-
stat
e sp
ill-
over
s, a
nd m
anu-
fact
urin
g co
sts.
Mim
eo.,
2003
M
anuf
. US:
48
Con
tigu-
ous
Stat
es
Max
imum
Lik
elih
ood
(ML)
with
sp
atia
l aut
ocor
rela
tion
(SA
R); a
nd
Seem
ingl
y U
nrel
ated
Reg
ress
ions
(S
UR)
.
Gen
eral
ised
Leo
ntie
f co
st-f
unct
ion.
It c
on-
trol
s fo
r fix
ed g
eo-
grap
hica
l spi
llove
rs a
nd
both
spa
tial a
nd t
ime
auto
corr
elat
ion.
1982
-199
6 Pa
nel
Dat
a
Mon
etar
y va
lue
of
mot
orw
ays
capi
tal
stoc
k.
Infr
astr
uctu
re is
pro
duct
ive
but
pres
ents
sm
all r
etur
ns: c
ost
elas
ticity
est
imat
ed a
t 0.
15 in
abs
olut
e va
lue.
Sp
atia
l and
tem
pora
l aut
ocor
rela
tion
adju
stm
ents
cha
nge
the
mag
nitu
de b
ut
not
the
dire
ctio
n of
the
eff
ect

Anne
x 6
to C
OM
PETE
Fin
al R
epor
t: - 8
9 -
Impa
ct o
f tra
nspo
rt in
frast
ruct
ure
on e
cono
mic
gro
wth
Aut
hor
Title
So
urce
Re
gion
M
etho
dolo
gy
Spec
ifica
tion
Sam
ple
Perio
d Sa
mpl
e ty
pe
Infr
astr
uctu
re V
aria
ble
Resu
lts
Dug
gal,
V.,
Saltz
man
, C.,
and
Kle
in, L
.
Infr
astr
uctu
re
and
prod
uctiv
ity:
a no
nlin
ear
appr
oach
.
Jour
nal o
f Ec
ono-
met
rics,
199
9 U
S: N
atio
nal
Two
Stag
e N
on L
iner
Squ
are:
OLS
in
the
firs
t st
age
and
for
the
seco
nd s
tate
Lev
enbe
rg-M
arqu
ardt
no
nlin
ear
met
hod.
A n
eocl
assi
cal S
-sha
pe
prod
uctio
n fu
nctio
n es
timat
ed f
or a
bsol
ute
leve
ls. P
ublic
Cap
ital i
s m
odel
led
as a
con
-st
rain
t of
the
tec
hno-
logi
cal i
ndex
.
Ann
ual
1960
-198
9 Ti
me
Serie
s M
onet
ary
valu
e of
pu
blic
infr
astr
uctu
re
stoc
k, d
efin
ed a
s m
otor
way
s an
d st
reet
s, o
ther
bui
ld-
ings
incl
udin
g po
lice,
fir
e st
atio
ns, c
ourt
ho
uses
, aud
itoriu
ms,
an
d pa
ssen
ger
term
i-na
ls, a
s w
ell a
s ot
her
stru
ctur
es in
clud
ing
elec
tric
and
gas
fa
cilit
ies,
tra
nsit
syst
ems
and
airf
ield
s
Elas
ticity
est
imat
ed a
t 0.
27.
The
spec
ifica
tion
finds
pos
itive
evi
denc
e of
non
-line
ariti
es in
pub
lic c
apita
l eff
ects
.
Evan
s, P
. and
K
arra
s, G
. A
re g
over
nmen
t ac
tiviti
es p
rodu
c-tiv
e? E
vide
nce
from
a p
anel
of
U.S
. sta
tes.
The
Revi
ew o
f Ec
onom
ics
and
Stat
istic
s, 1
994
US:
48
Con
tigu-
ous
Stat
es
Mod
ified
OLS
Bet
wee
n-G
roup
s. A
co
mpl
emen
tary
Inst
rum
enta
l V
aria
bles
(IV
) reg
ress
ion
is r
un t
o te
st e
ndog
enei
ty o
f pu
blic
cap
ital.
Cob
b-D
ougl
ass
pro-
duct
ion-
func
tion
with
fix
ed s
tate
leve
l eff
ects
es
timat
ed f
or b
oth
abso
lute
leve
ls a
nd
diff
eren
ces.
It c
ontr
ols
for
time
auto
corr
ela-
tion.
Ann
ual
1970
-198
6 Pa
nel
Dat
a M
onet
ary
valu
e of
pu
blic
infr
astr
uctu
re
defin
ed a
s m
otor
-w
ays,
wat
er a
nd
sew
er s
yste
ms,
and
ot
her
infr
astr
uctu
re
capi
tal.
Publ
ic c
apita
l has
neg
ativ
e pr
oduc
tivity
. Th
is m
ay b
e ca
used
by
an o
vers
uppl
y of
pu
blic
infr
astr
uctu
re in
the
US.
G
over
nmen
t se
rvic
es h
ave
a po
sitiv
e im
pact
, in
part
icul
ar c
urre
nt s
pend
ing
in
educ
atio
n is
pro
duct
ive.
Fern
ald,
J.
Road
s to
pro
s-pe
rity?
Ass
essi
ng
the
link
betw
een
publ
ic c
apita
l and
pr
oduc
tivity
?
The
Am
eric
an
Econ
omic
Rev
iew
. 19
99
US
Sect
ors:
N
atio
nal
Seem
ingl
y U
nrel
ated
Reg
ress
ions
(S
UR)
met
hodo
logy
C
obb-
Dou
glas
s pr
o-du
ctio
n-fu
nctio
n de
pend
ing
on t
rans
-po
rt s
ervi
ces.
Tra
nspo
rt
serv
ices
dep
end
upon
th
e ag
greg
ate
stoc
k of
go
vern
men
t ro
ads
as
wel
l as
the
stoc
k of
ve
hicl
es in
the
sec
tor
of
aggr
egat
e st
ock
of
gove
rnm
ent.
Ann
ual
1953
-198
9 Ti
me-
Serie
s
Mon
etar
y va
lue
of
aggr
egat
e st
ock
of
gove
rnm
ent
road
s.
Ther
e is
a p
ositi
ve r
elat
ions
hip
betw
een
grow
th r
ate
of a
ggre
gate
sto
ck o
f go
v-er
nmen
t ro
ads
and
prod
uctiv
ity. T
he
estim
ated
ela
stic
ity is
0.3
5 Th
e av
erag
e co
ntrib
utio
n of
roa
ds t
o G
DP
in t
he U
S w
as 1
.4 p
erce
nt p
er y
ear
befo
re
1973
, and
0.4
per
cent
aft
er 1
973.
Aft
er
this
yea
r th
e m
argi
nal e
ffec
t of
roa
ds o
n pr
oduc
tivity
dec
reas
ed.
Road
s pr
oduc
tivity
is s
mal
ler
in n
on-
vehi
cle
inte
nsiv
e in
dust
ries.
G
arci
a-M
ila,
T., M
cGui
re,
T., a
nd P
orte
r,
R.
The
effe
ct o
f pu
blic
cap
ital i
n st
ate-
leve
l pro
-du
ctio
n fu
nctio
ns
reco
nsid
ered
.
The
Revi
ew o
f Ec
onom
ics
and
Stat
istic
s, 1
996
US:
48
Con
tigu-
ous
Stat
es
OLS
for
the
fix
ed e
ffec
t sp
ecifi
ca-
tion.
G
ener
alis
ed L
east
Squ
ares
(GLS
) fo
r th
e ra
ndom
eff
ect
spec
ifica
tion
Cob
b-D
ougl
ass
pro-
duct
ion-
func
tion
estim
ated
bot
h un
der
fixed
and
ran
dom
sta
te
effe
cts.
The
spe
cific
a-tio
n is
est
imat
ed f
or
both
abs
olut
e le
vels
an
d di
ffer
ence
s.
Ann
ual
1970
-198
3 Pa
nel
Dat
a M
onet
ary
valu
e of
m
otor
way
s an
d m
onet
ary
valu
e of
w
ater
and
sew
er
syst
em.
Publ
ic c
apita
l has
neg
ligib
le e
ffec
ts o
n th
e ag
greg
ate
prod
uctio
n fu
nctio
n.

- 90
- An
nex
06 to
CO
MPE
TE F
inal
Rep
ort:
Im
pact
of t
rans
port
infra
stru
ctur
e on
eco
nom
ic g
row
th
Aut
hor
Title
So
urce
Re
gion
M
etho
dolo
gy
Spec
ifica
tion
Sam
ple
Perio
d Sa
mpl
e ty
pe
Infr
astr
uctu
re V
aria
ble
Resu
lts
Hau
ghw
out,
A
. Pu
blic
infr
astr
uc-
ture
inve
stm
ent,
pr
oduc
tivity
, and
w
elfa
re in
fix
ed
geog
raph
ic
area
s.
Jour
nal o
f Pu
blic
Ec
onom
ics,
200
2 U
S: H
ouse
-ho
lds
A t
wo
stag
e es
timat
ion
proc
edur
e us
ing
OLS
and
Gen
eral
ised
Lea
st
Squa
res
(GLS
).
Two
mod
ified
Min
cer-
ian-
earn
ing
equa
tions
re
pres
entin
g an
em
-pi
rical
impl
emen
tatio
n of
a s
patia
l equ
ilibr
ium
m
odel
: wag
es a
nd la
nd
rent
s in
ter
ms
of
wor
kers
’, ho
useh
olds
’, an
d sp
ecifi
c sp
atia
l ch
arac
teris
tics.
Bot
h eq
uatio
ns in
clud
e lo
cal
publ
ic c
apita
l sto
ck.
Ann
ual d
ata
but
with
no
regu
lar
perio
dici
ty
1974
-199
1
Pool
ed
cros
s-se
ctio
n.
Mon
etar
y va
lue
of
publ
ic c
apita
l sto
ck in
m
etro
polit
an a
reas
.
The
mar
gina
l pro
duct
ivity
of
infr
astr
uc-
ture
is e
stim
ated
to
be n
on-n
egat
ive
but
smal
l. D
epen
ding
on
the
spec
ifica
tion
it ra
nges
bet
wee
n 0
and
0.02
7 Th
e el
astic
-ity
of
land
val
ue w
ith r
espe
ct t
o in
fra-
stru
ctur
e st
ock,
con
ditio
nal o
n fis
cal
varia
bles
, is
estim
ated
bet
wee
n 0.
11 a
nd
0.22
. H
ouse
hold
ben
efits
are
con
sist
ently
es
timat
ed a
s po
sitiv
e an
d re
lativ
ely
larg
e.
Hol
tz-E
akin
, D
. Pu
blic
-sec
tor
capi
tal a
nd t
he
prod
uctiv
ity
puzz
le.
The
Revi
ew o
f Ec
onom
ics
and
Stat
istic
s, 1
994
US:
48
Con
tigu-
ous
Stat
es
OLS
Fix
Eff
ects
. G
ener
alis
ed L
east
Squ
ares
(GLS
) Ra
ndom
Eff
ects
. In
stru
men
tal V
aria
bles
(IV
) and
H
oltz
-Eak
in-N
ewey
-Ros
en (H
NR)
to
test
end
ogen
eity
and
sim
ulta
neity
re
spec
tivel
y.
Cob
b-D
ougl
ass
pro-
duct
ion-
func
tion
estim
ated
bot
h un
der
fixed
and
ran
dom
sta
te
effe
cts.
The
spe
cific
a-tio
n is
est
imat
ed f
or
both
abs
olut
e le
vels
an
d di
ffer
ence
s.
Ann
ual
1969
-198
6 Pa
nel
Dat
a M
onet
ary
valu
e of
pu
blic
cap
ital s
tock
in
clud
ing
mot
orw
ays,
w
ater
and
sew
er
syst
ems,
and
oth
er
infr
astr
uctu
re.
Publ
ic c
apita
l has
non
-sig
nific
ant
effe
cts
on p
rodu
ctio
n.
Hol
tz-E
akin
, D
. and
Sh
war
tz A
.E.
Infr
astr
uctu
re in
a
stru
ctur
al
mod
el o
f ec
o-no
mic
gro
wth
.
Regi
onal
Sci
ence
an
d U
rban
Eco
-no
mic
s, 1
995
US:
48
Con
tigu-
ous
Stat
es
Con
stra
ined
OLS
and
See
min
gly
Unr
elat
ed R
egre
ssio
n (S
UR)
m
etho
d.
Publ
ic C
apita
l and
Pr
oduc
tion
in la
bour
in
tens
ive
form
in lo
g le
vels
. The
sys
tem
is
deriv
ed f
rom
an
IRS
Cob
b-D
ougl
as f
unc-
tion,
with
labo
ur,
priv
ate
capi
tal,
and
publ
ic c
apita
l as
inpu
t fa
ctor
s.
Ann
ual
1971
-198
6 Pa
nel
Dat
a
Mon
etar
y va
lue
of
infr
astr
uctu
re d
efin
ed
as s
tree
ts, m
otor
way
s,
sani
tatio
n an
d se
wer
sy
stem
, ele
ctric
and
ga
s fa
cilit
ies,
and
w
ater
dis
trib
utio
n sy
stem
. A
n al
tern
ativ
e de
fini-
tion
whe
re in
fras
truc
-tu
re in
clud
es a
ll ca
pita
l ow
ned
by s
tate
an
d lo
cal g
over
nmen
t in
eac
h st
ate
is c
on-
side
red.
Elas
ticity
is n
egat
ive
and
sign
ifica
nt.
Publ
ic c
apita
l inv
estm
ent
rate
can
exp
lain
st
ate
varia
tions
of
publ
ic c
apita
l sto
ck b
ut
fails
to
expl
ain
cros
s-st
ate
diff
eren
ces
in
prod
uctiv
ity in
the
long
run
(cro
ss-s
ectio
n re
gres
sion
s)
Kel
ejia
n, H
. an
d Ro
bin-
son,
D.
Infr
astr
uctu
re
prod
uctiv
ity
estim
atio
n an
d its
und
erly
ing
econ
omet
ric
spec
ifica
tions
: a
sens
itivi
ty a
naly
-si
s.
Regi
onal
Sci
ence
, 19
97
US:
48
Con
tigu-
ous
Stat
es
OLS
; Non
Lin
ear
Leas
t Sq
uare
s (N
LLS)
; Non
Lin
ear
2-St
age
Leas
Sq
uare
s (N
L2SL
S); a
nd
Gen
eral
ised
Met
hods
of
Mom
ents
(G
MM
).
Cob
b-D
ougl
ass
pro-
duct
ion-
func
tion
with
fix
ed s
tate
eff
ects
. The
sp
ecifi
catio
n is
est
i-m
ated
for
abs
olut
e le
vels
con
side
ring
time
and
spat
ial a
utoc
orre
-la
tion.
Ann
ual
1969
-198
6 Pa
nel
Dat
a
Mon
etar
y va
lue
of
publ
ic c
apita
l sto
ck
defin
ed a
s m
otor
-w
ays,
wat
er a
nd
sew
er s
yste
m a
nd
othe
r st
ruct
ures
.
Prod
uctio
n fu
nctio
n es
timat
es a
re n
ot
robu
st t
o th
e ec
onom
etric
spe
cific
atio
n or
es
timat
ion
met
hod.
Th
e on
ly r
obus
t re
sult
is t
hat
the
elas
ticity
of
labo
ur in
put
and
prod
uctiv
ity s
pillo
vers
ar
e si
gnifi
cant
, pos
itive
, and
rea
sona
bly
stab
le.

Anne
x 6
to C
OM
PETE
Fin
al R
epor
t: - 9
1 -
Impa
ct o
f tra
nspo
rt in
frast
ruct
ure
on e
cono
mic
gro
wth
Aut
hor
Title
So
urce
Re
gion
M
etho
dolo
gy
Spec
ifica
tion
Sam
ple
Perio
d Sa
mpl
e ty
pe
Infr
astr
uctu
re V
aria
ble
Resu
lts
Mor
rison
C.
and
Schw
artz
, A
.E.
Stat
e in
fras
truc
-tu
re a
nd p
rodu
c-tiv
e pe
rfor
man
ce.
The
Am
eric
an
Econ
omic
Rev
iew
, 19
96
Man
uf. U
S:
48 C
ontig
u-ou
s St
ates
Seem
ingl
y U
nrel
ated
Reg
ress
ion
(SU
R) m
etho
d.
Gen
eral
ised
Leo
ntie
f co
st-f
unct
ion
esti-
mat
ed f
or a
bsol
ute
leve
ls.
Ann
ual
1970
-198
7 Pa
nel
Dat
a
Mon
etar
y va
lue
of
publ
ic c
apita
l sto
ck
defin
ed a
s m
otor
-w
ays,
wat
er s
yste
ms,
an
d se
wer
s.
Shad
ow v
alue
s fo
r pu
blic
and
priv
ate
capi
tal a
re p
ositi
ve a
nd s
igni
fican
t, e
sti-
mat
ed b
etw
een
0.05
and
0.3
4 de
pend
ing
on t
he r
egio
n an
d ye
ar.
Publ
ic in
fras
truc
ture
has
a d
irect
impa
ct
on p
rodu
ctiv
ity g
row
th, d
ue t
o a
dire
ct
cost
-sav
ing
effe
ct. T
his
is e
stim
ated
be
twee
n 0.
19 a
nd 0
.62
depe
ndin
g on
th
e re
gion
. Th
e po
sitiv
e in
put
cost
sav
ing
bene
fit t
o m
anuf
actu
ring
firm
s fr
om in
fras
truc
ture
in
vest
men
t de
clin
es in
all
US
regi
ons
from
19
70 o
nwar
d.
Nad
iri, M
.I.,
and
Ma-
mun
eas,
T.
The
effe
cts
of
publ
ic in
fras
truc
-tu
re a
nd R
&D
ca
pita
l on
the
cost
str
uctu
re
and
perf
orm
ance
of
the
U.S
. m
anuf
actu
ring
indu
strie
s.
The
Revi
ew o
f Ec
onom
ic a
nd
Stat
istic
s, 1
994
Man
uf. U
S:
Nat
iona
l
Con
stra
ined
OLS
on
pool
ed t
ime-
serie
s cr
oss-
sect
ion
data
.
Tran
slog
cos
t-fu
nctio
n es
timat
ed f
or a
bsol
ute
leve
ls. P
ublic
cap
ital i
s de
fined
as
publ
ic
infr
astr
uctu
re a
nd
publ
icly
fin
ance
d R&
D
inve
stm
ent.
Ann
ual
1956
-198
6 Po
oled
Pa
nel
Mon
etar
y va
lue
of n
et
gove
rnm
ent
phys
ical
ca
pita
l sto
ck o
f ci
vilia
n st
ruct
ures
and
equ
ip-
men
t. It
als
o in
clud
es
a es
timat
ed m
onet
ary
valu
e of
“R&
D s
tock
”.
Infr
astr
uctu
re h
as a
dire
ct c
ost
redu
ctio
n ef
fect
fro
m 0
to
0.21
dep
endi
ng o
n th
e in
dust
ry.
Publ
ic in
fras
truc
ture
and
R&
D in
duce
pr
oduc
tivity
gro
wth
.
Nad
iri, M
.I.,
and
Ma-
mun
eas,
T.
Con
trib
utio
n of
hi
ghw
ay c
apita
l to
out
put
and
prod
uctiv
ity
grow
th in
the
U
.S. e
cono
my
and
indu
strie
s.
US
D
epar
tmen
t of
Tr
ansp
orta
tion,
19
98
US
Sect
ors:
N
atio
nal
OLS
Tr
ansl
og c
ost-
func
tion
estim
ated
for
abs
olut
e le
vels
.
1947
-199
1 Ti
me-
Serie
s
Mon
etar
y va
lue
of
mot
orw
ay c
apita
l st
ock.
In m
ost
man
ufac
turin
g in
dust
ries,
cos
t el
astic
ities
ran
ge b
etw
een
0.04
and
0.0
5 in
abs
olut
e va
lue.
T
he c
ontr
ibut
ion
of h
ighw
ay c
apita
l to
prod
uctiv
ity g
row
th is
pos
itive
in a
ll in
dust
ries.
At
aggr
egat
e le
vel h
ighw
ay
capi
tal a
ccou
nts
for
abou
t 50
% o
f TF
P gr
owth
ove
r th
e pe
riod
of s
tudy
. Th
e ec
onom
ic im
pact
of
high
way
cap
ital
on p
rodu
cer
cost
dec
lined
dur
ing
the
1980
s.
Pere
ira, A
. O
n th
e ef
fect
s of
pu
blic
inve
stm
ent
on p
rivat
e in
-ve
stm
ent:
Wha
t cr
owds
in w
hat?
Publ
ic F
inan
ce
Revi
ew, 2
001
US
Sect
ors:
N
atio
nal
Vec
tor
Aut
oreg
ress
ive
Erro
r C
or-
rect
ion
Met
hod
(VA
R/EC
M)
A V
AR
mod
el e
sti-
mat
ed in
log
diff
er-
ence
s fo
r ea
ch in
dus-
tria
l sec
tor
in t
he U
S in
clud
ing
GD
P, P
ublic
In
vest
men
t, P
rivat
e In
vest
men
t, a
nd E
m-
ploy
men
t.
1956
-199
7 Pa
nel
Dat
a Pu
blic
inve
stm
ent
in
mot
orw
ays,
and
st
reet
s, e
lect
ric a
nd
gas
faci
litie
s, s
ewag
e an
d w
ater
sup
ply
syst
ems,
edu
catio
n bu
ildin
gs, h
ospi
tals
, po
lice
and
fire
sta-
tions
, and
con
serv
a-tio
n an
d de
velo
pmen
t st
ruct
ures
.
Publ
ic in
vest
men
t cr
owds
-in p
rivat
e in
vest
men
t.
Its e
ffec
ts o
n em
ploy
men
t ar
e al
mos
t ne
glig
ible
. It
has
a po
sitiv
e ef
fect
on
priv
ate
outp
ut
with
an
estim
ated
ela
stic
ity o
f 0.
042.

- 92
- An
nex
06 to
CO
MPE
TE F
inal
Rep
ort:
Im
pact
of t
rans
port
infra
stru
ctur
e on
eco
nom
ic g
row
th
Aut
hor
Title
So
urce
Re
gion
M
etho
dolo
gy
Spec
ifica
tion
Sam
ple
Perio
d Sa
mpl
e ty
pe
Infr
astr
uctu
re V
aria
ble
Resu
lts
Pere
ira, A
. an
d A
ndra
z J.
O
n th
e im
pact
of
publ
ic in
vest
men
t on
the
per
form
-an
ce o
f U
.S.
indu
strie
s.
Publ
ic F
inan
ce
Revi
ew, 2
001
US:
Nat
iona
l V
ecto
r A
utor
egre
ssiv
e Er
ror
Cor
-re
ctio
n M
etho
d (V
AR/
ECM
) A
VA
R m
odel
est
i-m
ated
in lo
g le
vels
for
ea
ch in
dust
rial s
ecto
r in
the
US
incl
udin
g G
DP,
Pub
lic In
vest
men
t di
sagg
rega
ted
in 7
ca
tego
ries,
Priv
ate
Inve
stm
ent
disa
ggre
-ga
ted
in 5
cla
sses
, and
Em
ploy
men
t.
1956
-199
7 Pa
nel
Dat
a A
ggre
gate
pub
lic
inve
stm
ent
in c
ivili
an
stru
ctur
es a
nd e
quip
-m
ent.
Elas
ticity
of
priv
ate
empl
oym
ent
with
re
spec
t to
pub
lic in
vest
men
t is
0.0
13.
Elas
ticity
of
priv
ate
inve
stm
ent
with
re
spec
t to
pub
lic in
vest
men
t is
039
7. A
t in
dust
rial l
evel
, the
re is
evi
denc
e of
cr
owdi
ng-o
ut in
5 o
ut o
f 12
sec
tors
. El
astic
ity o
f pr
ivat
e ou
tput
with
res
pect
to
publ
ic in
vest
men
t is
0.0
47. H
owev
er, i
n 8
out
of 1
2 se
ctor
s, t
he e
ffec
t of
pub
lic
inve
stm
ent
is n
egat
ive.
Rudd
, J.
Ass
essi
ng t
he
prod
uctiv
ity o
f pu
blic
cap
ital
with
a lo
catio
n eq
uilib
rium
m
odel
.
FED
S
WP.
200
0-23
U
S: U
rban
A
reas
H
uber
adj
uste
d O
LS.
Two
mod
ified
Min
cer-
ian-
earn
ing
equa
tions
re
pres
entin
g an
em
-pi
rical
impl
emen
tatio
n of
a s
patia
l equ
ilibr
ium
m
odel
: wag
es a
nd la
nd
rent
s in
ter
ms
of
wor
ker’
s, h
ouse
hold
’s,
and
spec
ific
spat
ial
char
acte
ristic
s. B
oth
equa
tions
incl
ude
loca
l pu
blic
cap
ital s
tock
and
ta
x co
ntro
ls.
1980
C
ross
-Se
ctio
n M
onet
ary
valu
e of
pu
blic
infr
astr
uctu
re
stoc
k de
fined
as
mot
orw
ays,
str
eets
, w
ater
sys
tem
, and
se
wer
s.
The
estim
ated
out
put-
publ
ic c
apita
l el
astic
ity is
0.0
8. T
he e
last
icity
for
infr
a-st
ruct
ure
capi
tal i
s 0.
12, a
nd t
he e
last
icity
fo
r hi
ghw
ays
is 0
.07.
El
astic
ity o
f w
ages
with
res
pect
to
publ
ic
capi
tal s
tock
is 0
.07.
W
hen
no t
ax c
ontr
ols
are
pres
ent,
the
ef
fect
of
publ
ic s
tock
on
land
ren
t is
po
sitiv
e an
d si
gnifi
cant
, est
imat
ed a
t 0.
21.
Shio
ji, E
. Pu
blic
cap
ital a
nd
econ
omic
gr
owth
: A c
on-
verg
ence
ap-
proa
ch.
Jour
nal o
f Ec
o-no
mic
Gro
wth
, 20
01
US:
48
Con
tigu-
ous
Stat
es
Japa
n : 4
7 Pr
efec
ture
s
OLS
, Lea
st S
quar
es D
umm
y V
ari-
able
(LSD
V),
and
Gen
eral
ised
m
etho
ds o
f M
omen
ts (G
MM
).
Gen
eral
ised
neo
clas
si-
cal p
rodu
ctio
n fu
nctio
n ex
pres
sed
out-
of-
stea
dy s
tate
US
19
63-1
978
Japa
n 19
75-1
995
Tim
e-Se
ries
US.
Mon
etar
y va
lue
of
publ
ic c
apita
l sto
ck
defin
ed a
s in
fras
truc
-tu
re a
nd s
truc
ture
s an
d eq
uipm
ent
re-
late
d to
edu
catio
n se
ctor
. Ja
pan.
Mon
etar
y va
lue
of p
ublic
cap
ital s
tock
de
fined
as
infr
astr
uc-
ture
, and
pub
lic
capi
tal r
elat
ed t
o ed
ucat
ion,
con
serv
a-tio
n of
land
, and
ag
ricul
ture
.
The
long
run
equ
ilibr
ium
ela
stic
ity o
f in
fras
truc
ture
is e
stim
ated
in a
ran
ge o
f 0.
09 t
o 0.
143
for
the
US,
and
0.1
0 to
0.
169
for
Japa
n. T
his
estim
ate
cont
rast
s w
ith t
he s
hort
run
eff
ect
sinc
e bo
th
coun
trie
s pr
esen
t si
mila
r nu
mbe
rs.


![Recent Development To Compete or Not to Compete: Illinois ... · 2017] To Compete or Not to Compete 1237 invalidate agreements that preclude employees from working for competitors](https://img.pdfslide.us/doc/110x75/6098987e936214473479030d/recent-development-to-compete-or-not-to-compete-illinois-2017-to-compete-or.jpg)