Embed Size (px)
Citation preview
Filed: 2010-05-26 EB-2010-0008
Exhibit F4 Tab 3
Schedule 1 Page 1 of 37
COMPENSATION, WAGES AND BENEFITS 1
2 1.0 PURPOSE 3 This evidence presents the compensation and benefits framework associated with OPG’s 4 regulated facilities. It provides context for other parts of the Application which address 5 operating costs that factor into the revenue requirement sought by OPG. 6 7 2.0 OVERVIEW 8 The compensation and benefits framework associated with OPG’s regulated facilities has not 9 changed significantly from that reviewed in EB-2007-0905. OPG manages its compensation 10 and benefits costs within a complex context. OPG requires highly skilled employees and 11 these employees have high ongoing training needs. It also has a high degree of unionization 12 (90 per cent), operates in an evolving external environment in the electricity industry, and is 13 subject to a high level of transparency. 14 15 OPG will be facing significant demographic challenges in the next five to ten years that will 16 increase compensation cost pressures. OPG is committed to maintaining a competitive, 17 equitable and cost effective compensation and benefits program which will enable OPG to 18 attract, retain and engage employees required to fulfil OPG’s goals and objectives. 19 20 Section 3.0 discusses OPG’s current employee demographics and human resources 21 environment. Section 4.0 identifies the labour agreements in effect at OPG and section 5.0 22 discusses compensation levels for its major categories of employees. Section 6.0 describes 23 OPG’s pension and benefits programs. Section 7.0 addresses the standard labour rate 24 developed for each functional group by job category, and section 8.0 addresses 25 benchmarking with respect to compensation and support for labour negotiations. 26 27 3.0 CURRENT DEMOGRAPHICS AND HUMAN RESOURCES ENVIRONMENT 28 At the end of 2009 there were approximately 12,000 regular staff at OPG, and approximately 29 10,000 in the regulated businesses. These staff work in a predominantly unionized 30 environment, with approximately 90 per cent of staff belonging to either the Power Workers’ 31
Filed: 2010-05-26 EB-2010-0008 Exhibit F4 Tab 3 Schedule 1 Page 2 of 37
Union (“PWU”) or the Society of Energy Professionals (“Society”). Of this 90 per cent, 1 approximately 60 per cent belong to the PWU and approximately 30 per cent belong to the 2 Society. This extent of unionization and the mix of PWU, Society and non-represented staff 3 have generally remained constant over the years. 4 5 For the regulated operations, the proportion of staff in Management, the PWU and the 6 Society is essentially the same as for the company as a whole. The PWU and Society 7 collective agreements have been in place since the time of demerger from Ontario Hydro, 8 albeit with some modifications as outlined below. Since items such as wages, pension, and 9 benefits form part of the collective agreements, any changes to these can only be made 10 through the collective bargaining process. 11
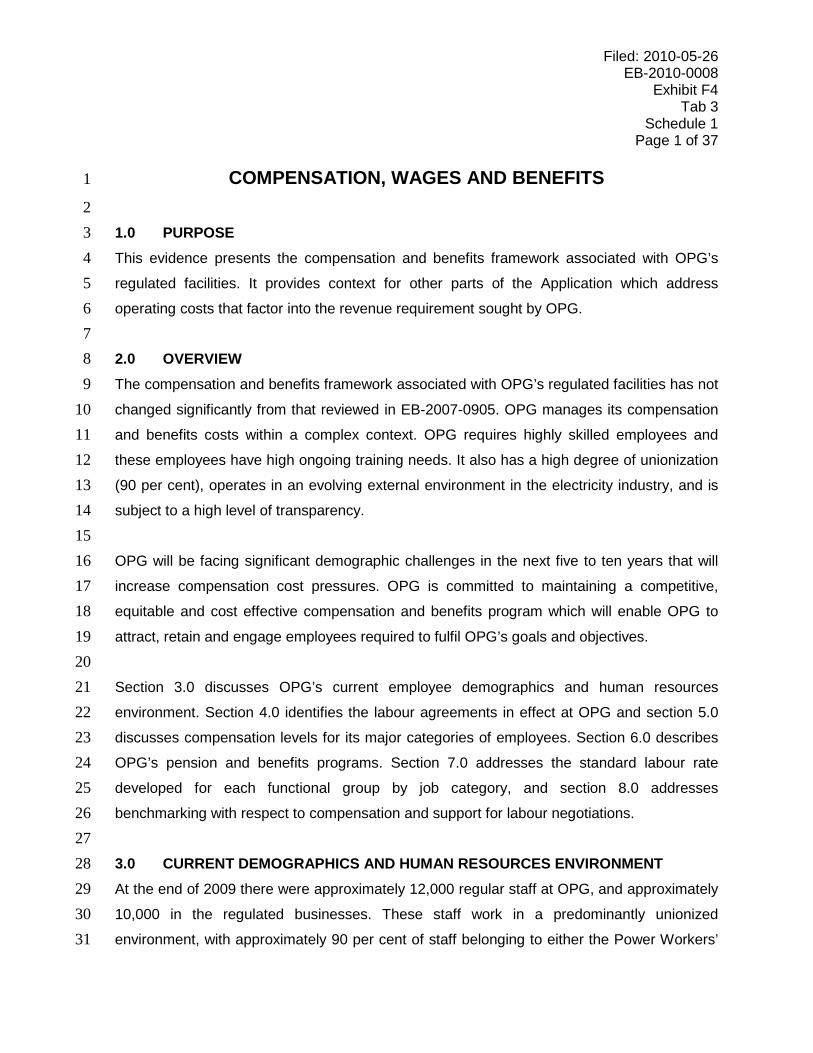
12 Within the regulated business the staff headcount for each jurisdiction is as follows: 13 14
Chart 1 15 16
Staff Headcount1 by Representation - Regulated Business - Year End 2009
Representation Nuclear2 Regulated Hydroelectric2 Totals
Regular Non-Regular3 Regular Non-
Regular3
Management Group
936 12 60 1 1,008
Power Workers’ Union
4,972 504 306 15 5,795
Society of Energy Professionals
3,028 45 124 2 3,199
Totals 8,936 560 490 18 10,003 1. Based on 2009 year end payroll data for active employees with a base salary payment in their home base 17
positions. 18 2. Includes an allocation of 61.0 per cent to the nuclear facilities and 5.2 per cent to the regulated hydroelectric 19
facilities of corporate support functions staff as well as an allocation of 29 per cent of Hydroelectric Central 20 Support staff to the regulated hydroelectric facilities. 21
3. Non-Regular includes external service contractors assigned to appropriate representations. 22 23

Filed: 2010-05-26 EB-2010-0008
Exhibit F4 Tab 3
Schedule 1 Page 3 of 37
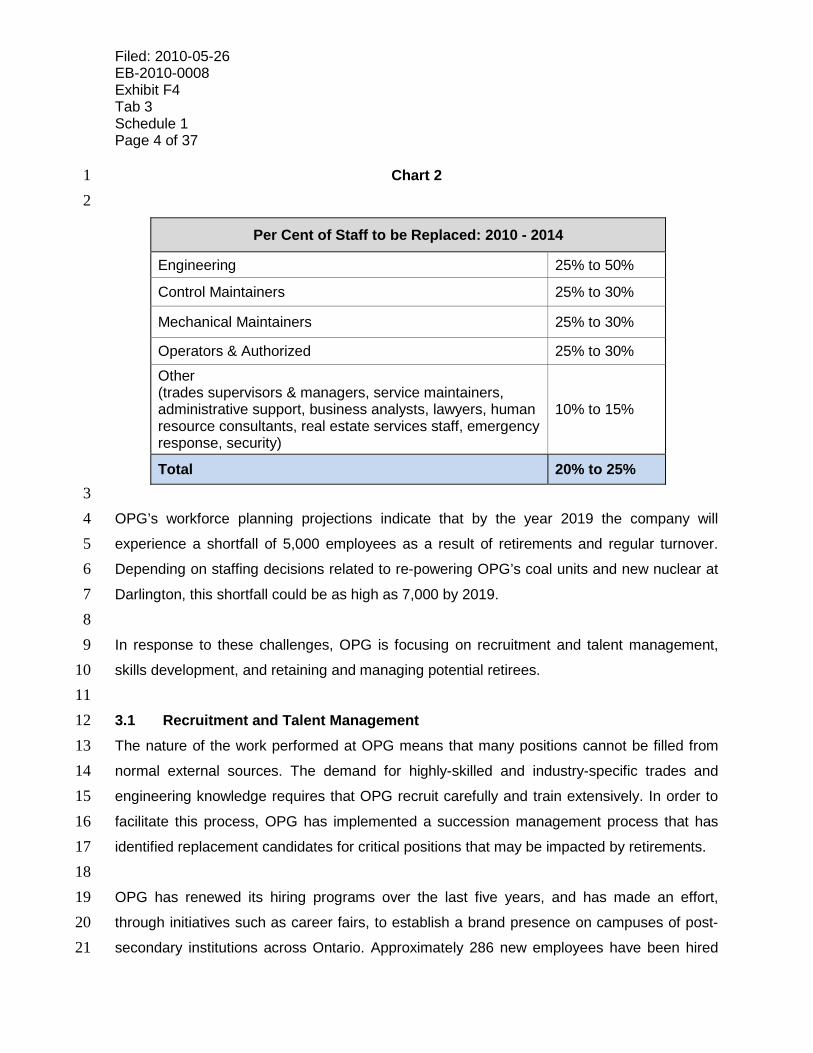
In order to support the diverse mix of generation technologies within OPG, staff must be 1 highly skilled, and must possess a wider array of skills than employees in many other utilities. 2 OPG’s workforce is comprised of engineers, scientists, other professional staff, and skilled 3 trades people. Approximately 8,760 employees (73 per cent of the OPG population) require 4 post secondary education to perform their jobs. For the majority of these, two or more years 5 of community college or a university degree is required, and this education ranges from 6 skilled technician or technologist training, to advanced university degrees in fields such as 7 engineering and finance. The highly skilled staff are in demand across the country, and OPG 8 must compete for these employees with Bruce Power and other private generators and 9 energy service organizations as well as the general marketplace. 10 11 OPG has a mature and experienced workforce. Half of the employees are over the age of 47 12 and over half have greater than 17 years of service. With an aging and experienced 13 workforce, a significant portion of employees are currently eligible to retire. Most of the 14 employees eligible to retire work in Thermal, Hydro and Nuclear, and on a relative basis, are 15 more likely to be supervisory staff than non-supervisory staff. As a result, OPG’s planning 16 assumptions indicate that the company will be facing significant resourcing gaps over the 17 next five years. For OPG as a whole, between 2010 and 2014, it is estimated that 20 per 18 cent to 25 per cent of staff will need to be replaced due to retirements and terminations. 19 Replacement details by job family are captured below in Chart 2. For the regulated 20 businesses, the replacement percentages by job family are similar to those for OPG as a 21 whole. 22 23
Filed: 2010-05-26 EB-2010-0008 Exhibit F4 Tab 3 Schedule 1 Page 4 of 37
Chart 2 1 2
Per Cent of Staff to be Replaced: 2010 - 2014
Engineering 25% to 50%
Control Maintainers 25% to 30%
Mechanical Maintainers 25% to 30%
Operators & Authorized 25% to 30% Other (trades supervisors & managers, service maintainers, administrative support, business analysts, lawyers, human resource consultants, real estate services staff, emergency response, security)
10% to 15%
Total 20% to 25% 3 OPG’s workforce planning projections indicate that by the year 2019 the company will 4 experience a shortfall of 5,000 employees as a result of retirements and regular turnover. 5 Depending on staffing decisions related to re-powering OPG’s coal units and new nuclear at 6 Darlington, this shortfall could be as high as 7,000 by 2019. 7 8 In response to these challenges, OPG is focusing on recruitment and talent management, 9 skills development, and retaining and managing potential retirees. 10 11 3.1 Recruitment and Talent Management 12 The nature of the work performed at OPG means that many positions cannot be filled from 13 normal external sources. The demand for highly-skilled and industry-specific trades and 14 engineering knowledge requires that OPG recruit carefully and train extensively. In order to 15 facilitate this process, OPG has implemented a succession management process that has 16 identified replacement candidates for critical positions that may be impacted by retirements. 17 18 OPG has renewed its hiring programs over the last five years, and has made an effort, 19 through initiatives such as career fairs, to establish a brand presence on campuses of post-20 secondary institutions across Ontario. Approximately 286 new employees have been hired 21
Filed: 2010-05-26 EB-2010-0008
Exhibit F4 Tab 3
Schedule 1 Page 5 of 37
through this program over the last five years. A substantial increase to this number is 1 required over the next five years. In order to facilitate future hiring and to further strengthen 2 its relationships with colleges and universities, OPG has actively partnered with selected 3 institutions to offer specialized training. One such strategic partner is the University of 4 Ontario Institute of Technology which is offering specific training programs from which OPG 5 will draw future employees. 6 7 In support of research and development in nuclear engineering, OPG has worked with other 8 organizations in the industry to establish and fund industrial research chairs. OPG also 9 provides more than 250 youth student awards and scholarships. 10 11 OPG has begun to partner with companies who are in the process of downsizing in order to 12 redeploy their mid-career employees who have skills that can be used at OPG. As well, OPG 13 has renewed its apprenticeship program to bring in a regular stream of entry-level skilled 14 tradespersons to address the demographics issue with its skilled trades workforce. 15 16 3.2 Skills Development 17 OPG invests considerable resources to provide technical training to its employees ensuring 18 that they are prepared to take on the roles essential to the organization. In addition, OPG has 19 focused on development initiatives to prepare employees for promotion to supervisory and 20 management positions as incumbents retire. Examples of development initiatives are the 21 training programs for new supervisors and for middle managers. 22 23 3.3 Retaining and Managing Potential Retirees 24 In addition to the succession management process outlined above, OPG is also making use 25 of retirees as a source of contingent labour for project-related work. 26 27 4.0 LABOUR AGREEMENTS 28 Pursuant to the Ontario Labour Relations Act, OPG was required, as a successor employer 29 to Ontario Hydro, to adopt collective agreements covering the employees transferred to OPG 30 from Ontario Hydro on April 1, 1999. For the majority of employees within OPG that are 31 unionized, items such as wages, pensions, and benefits can only be changed through the 32
Filed: 2010-05-26 EB-2010-0008 Exhibit F4 Tab 3 Schedule 1 Page 6 of 37
collective bargaining process. In this environment, it is necessary to balance the business 1 requirements and long-term company interests related to maintaining a positive relationship 2 with its unions, while recognizing that the unions, in most cases, have the right to strike. 3 Since OPG was created, new collective agreements have been negotiated by OPG with both 4 the PWU and the Society. The following are the agreements currently in place: 5 • Collective agreement between OPG and the PWU respecting general working conditions, 6
wages and pension for nuclear employees (April 1, 2009 - March 31, 2012). 7 • Collective agreement between OPG and the PWU respecting general working conditions, 8
wages and pension for non-nuclear employees (April 1, 2009 - March 31, 2012). 9 • Collective agreement between OPG and the Society respecting general working 10
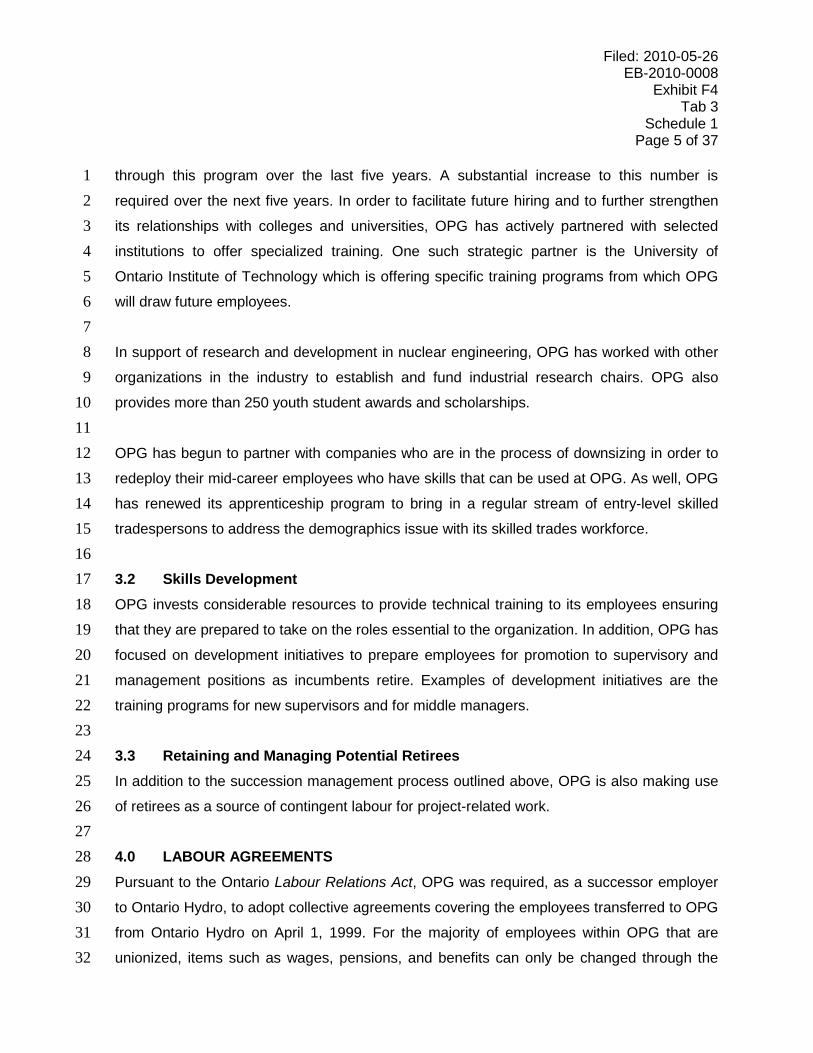
conditions, wages, and pensions (January 1, 2006 - December 31, 2010). 11 12 A comparison of labour rates between OPG and other successors to Ontario Hydro and 13 major competitors is found in section 8.0 – Benchmarking, which shows that OPG compares 14 favourably on labour rates. 15 16 5.0 CURRENT COMPENSATION 17 The highly skilled nature of the work, coupled with the aging workforce, means that OPG 18 needs to compensate its employees appropriately in order to retain and attract a consistent 19 supply of employees with the high standards of skills required by OPG. Chart 3 provides the 20 2009 average compensation and benefits levels for the major categories of OPG employees 21 in the regulated businesses. 22 23
Filed: 2010-05-26 EB-2010-0008
Exhibit F4 Tab 3
Schedule 1 Page 7 of 37
Chart 3
Average Employee costs ($K) for Regulated Business – Year-End 2009
PWU Society Management Group
Regular Non-
Regular 2 Regular Non-
Regular 2 Regular Non-
Regular 2 Nuclear Total Wages 108.6 62.7 122.3 79.9 156.8 89.2 Base Salary 81.4 42.8 100.4 56.2 127.3 77.1 Overtime 18.0 11.8 15.7 10.5 0.9 0.0 Incentives 2.4 0.1 3.3 1.9 18.1 7.4 Other 6.8 8.0 2.8 11.3 10.6 4.8 Benefits 4 4.5 0 5.5 0 7.1 0 Pension/OPEB 5 12.1 0.0 14.7 0.0 19.1 0
Regulated Hydro Total Wages 98.1 40.7 104.6 71.6 157.0 0.0 Base Salary 84.5 35.7 95.5 68.4 126.6 0.0 Overtime 8.3 3.4 4.9 1.7 0.7 0.0 Incentives 1.0 0.0 2.1 0.0 18.9 0.0 Other 4.3 1.6 2.1 1.6 10.8 0.0 Benefits 4 3.8 0 4.4 0 6.1 0 Pension/OPEB 5 10.2 0 11.8 0 16.6 0
Corporate Support Functions
Total Wages 70.5 19.6 108.5 65.8 139.3 56.4 Base Salary 65.5 18.3 101.3 61.1 115.7 55.6
Overtime 2.1 0.7 2.3 2.0 0.0 0.0 Incentives 1.1 0.0 2.4 0.0 17.9 0.0
Other 1.8 0.6 2.4 2.7 5.7 0.8 Benefits 4 3.8 0 5.9 0 7.1 0 Pension/OPEB 5 10.3 0 15.9 0 19.1 0
1 Based on 2009 year end payroll data for active employees with a base salary payment in their home base positions. 2 Non-regular includes external service contractors assigned to appropriate representations. 3 Includes an allocation of 29.5 per cent of Hydroelectric Central Support staff to the regulated hydroelectric facilities. 4 Benefits include group life insurance, dental, health, maternity and the Employee Family Assistance Program. 5 Represents the current service cost component of total pension/OPEB costs. Current service cost is the only component of the pension/OPEB costs (discussed in section 6.3.1 Ex. F4-T3-S1) that relates solely to current employees. Current service cost represents the cost of the Pension/OPEB benefit deemed to be accrued by current employees in the year.
Filed: 2010-05-26 EB-2010-0008 Exhibit F4 Tab 3 Schedule 1 Page 8 of 37
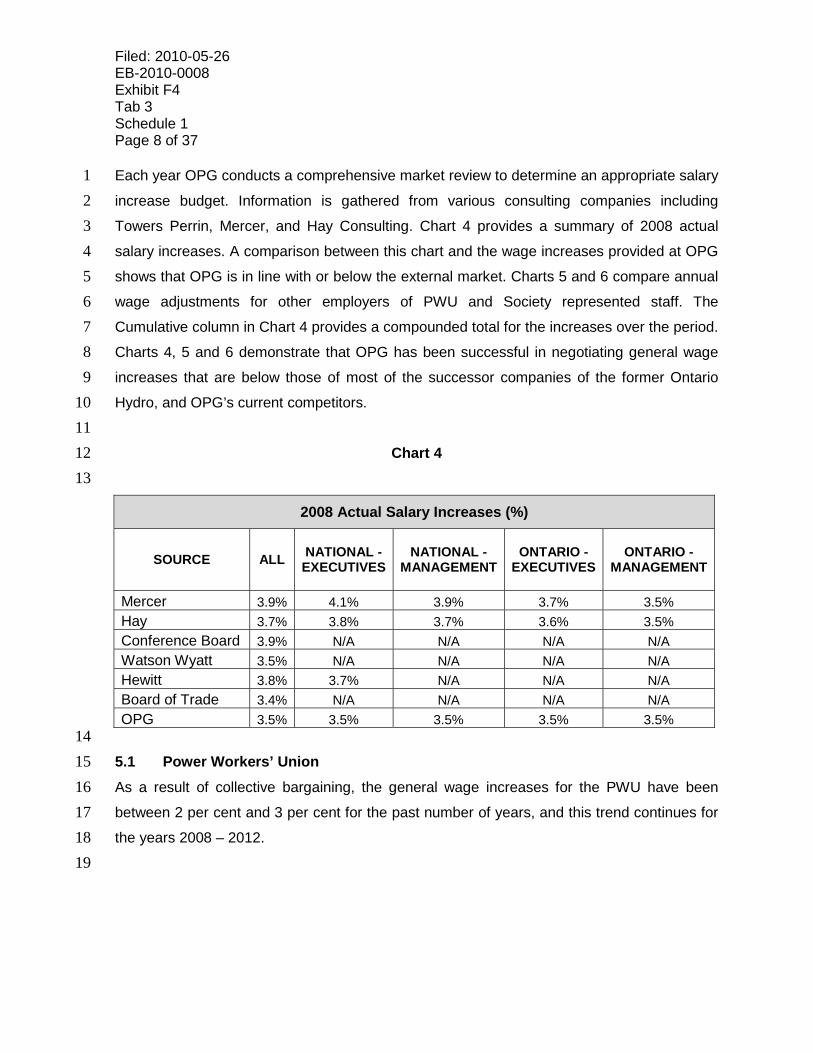
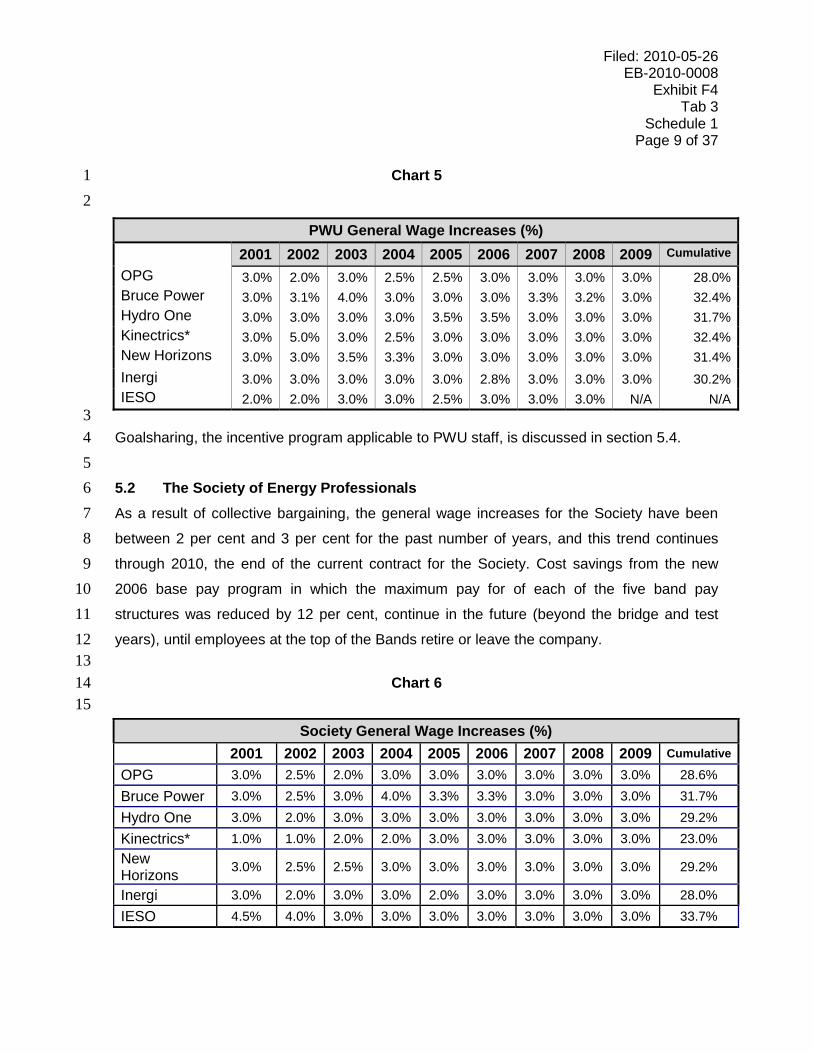
Each year OPG conducts a comprehensive market review to determine an appropriate salary 1 increase budget. Information is gathered from various consulting companies including 2 Towers Perrin, Mercer, and Hay Consulting. Chart 4 provides a summary of 2008 actual 3 salary increases. A comparison between this chart and the wage increases provided at OPG 4 shows that OPG is in line with or below the external market. Charts 5 and 6 compare annual 5 wage adjustments for other employers of PWU and Society represented staff. The 6 Cumulative column in Chart 4 provides a compounded total for the increases over the period. 7 Charts 4, 5 and 6 demonstrate that OPG has been successful in negotiating general wage 8 increases that are below those of most of the successor companies of the former Ontario 9 Hydro, and OPG’s current competitors. 10
11 Chart 4 12
13
2008 Actual Salary Increases (%)
SOURCE ALL NATIONAL - EXECUTIVES
NATIONAL - MANAGEMENT
ONTARIO - EXECUTIVES
ONTARIO - MANAGEMENT
Mercer 3.9% 4.1% 3.9% 3.7% 3.5% Hay 3.7% 3.8% 3.7% 3.6% 3.5% Conference Board 3.9% N/A N/A N/A N/A Watson Wyatt 3.5% N/A N/A N/A N/A Hewitt 3.8% 3.7% N/A N/A N/A Board of Trade 3.4% N/A N/A N/A N/A OPG 3.5% 3.5% 3.5% 3.5% 3.5%
14 5.1 Power Workers’ Union 15 As a result of collective bargaining, the general wage increases for the PWU have been 16 between 2 per cent and 3 per cent for the past number of years, and this trend continues for 17 the years 2008 – 2012. 18 19
Filed: 2010-05-26 EB-2010-0008
Exhibit F4 Tab 3
Schedule 1 Page 9 of 37
Chart 5 1 2
PWU General Wage Increases (%) 2001 2002 2003 2004 2005 2006 2007 2008 2009 Cumulative
OPG 3.0% 2.0% 3.0% 2.5% 2.5% 3.0% 3.0% 3.0% 3.0% 28.0%Bruce Power 3.0% 3.1% 4.0% 3.0% 3.0% 3.0% 3.3% 3.2% 3.0% 32.4%Hydro One 3.0% 3.0% 3.0% 3.0% 3.5% 3.5% 3.0% 3.0% 3.0% 31.7%Kinectrics* 3.0% 5.0% 3.0% 2.5% 3.0% 3.0% 3.0% 3.0% 3.0% 32.4%New Horizons 3.0% 3.0% 3.5% 3.3% 3.0% 3.0% 3.0% 3.0% 3.0% 31.4%Inergi 3.0% 3.0% 3.0% 3.0% 3.0% 2.8% 3.0% 3.0% 3.0% 30.2%IESO 2.0% 2.0% 3.0% 3.0% 2.5% 3.0% 3.0% 3.0% N/A N/A
3 Goalsharing, the incentive program applicable to PWU staff, is discussed in section 5.4. 4 5 5.2 The Society of Energy Professionals 6 As a result of collective bargaining, the general wage increases for the Society have been 7 between 2 per cent and 3 per cent for the past number of years, and this trend continues 8 through 2010, the end of the current contract for the Society. Cost savings from the new 9 2006 base pay program in which the maximum pay for of each of the five band pay 10 structures was reduced by 12 per cent, continue in the future (beyond the bridge and test 11 years), until employees at the top of the Bands retire or leave the company. 12
13 Chart 6 14
15
Society General Wage Increases (%) 2001 2002 2003 2004 2005 2006 2007 2008 2009 Cumulative
OPG 3.0% 2.5% 2.0% 3.0% 3.0% 3.0% 3.0% 3.0% 3.0% 28.6% Bruce Power 3.0% 2.5% 3.0% 4.0% 3.3% 3.3% 3.0% 3.0% 3.0% 31.7% Hydro One 3.0% 2.0% 3.0% 3.0% 3.0% 3.0% 3.0% 3.0% 3.0% 29.2% Kinectrics* 1.0% 1.0% 2.0% 2.0% 3.0% 3.0% 3.0% 3.0% 3.0% 23.0% New Horizons 3.0% 2.5% 2.5% 3.0% 3.0% 3.0% 3.0% 3.0% 3.0% 29.2%
Inergi 3.0% 2.0% 3.0% 3.0% 2.0% 3.0% 3.0% 3.0% 3.0% 28.0% IESO 4.5% 4.0% 3.0% 3.0% 3.0% 3.0% 3.0% 3.0% 3.0% 33.7%
Filed: 2010-05-26 EB-2010-0008 Exhibit F4 Tab 3 Schedule 1 Page 10 of 37
In an effort to contain and simplify administrative systems and costs, the existing Society 1 bonus programs - Goalsharing and Performance Recognition Program - were consolidated 2 into one program in 2008. The new program called, “Award for Performance” simplified pay 3 administration for the employees represented by the Society and continued focus on 4 performance. The level of the award varies based on an annual individual performance score 5 and the relative ranking of employee performance within a given business unit. 6 7 5.3 Management Group 8 Each year OPG conducts a comprehensive market review using a comparator group of 9 companies to determine the competitiveness of its compensation and benefits program. 10 11 The results of the 2007 market review indicated that OPG’s Management Group’ base pay 12 program had fallen significantly below market. The base pay program had not been adjusted 13 since 2002. As a result, the salary ranges were adjusted to align with the external market. 14 There were few changes to individual salaries and the associated cost was approximately 15 $50,000. This cost was absorbed as part of the annual salary increase budget. 16 17 In 2008, the salary increase budget for all Management Group employees was 3.5 per cent, 18 which was consistent with the market range of 3.4 per cent to 3.9 per cent. 19 20 In 2009, more stringent base pay budgets of 1.5 per cent for employees earning greater than 21 $150,000 and 2 per cent for remaining employees were established. These types of 22 increases are below market value and more aligned with recent provincial government 23 practices. 24 25 In 2010 the base pay budget was limited to 1.5 per cent and was distributed according to 26 competency and performance levels. There were no across the board increases given. 27 28 Management Group Compensation Philosophy 29 OPG follows best practices when dealing with Management Group compensation. There is a 30 Compensation and Human Resources Committee of the Board of Directors, which is 31 comprised of independent directors. The Committee meets at least four times per year, has 32

Filed: 2010-05-26 EB-2010-0008
Exhibit F4 Tab 3
Schedule 1 Page 11 of 37
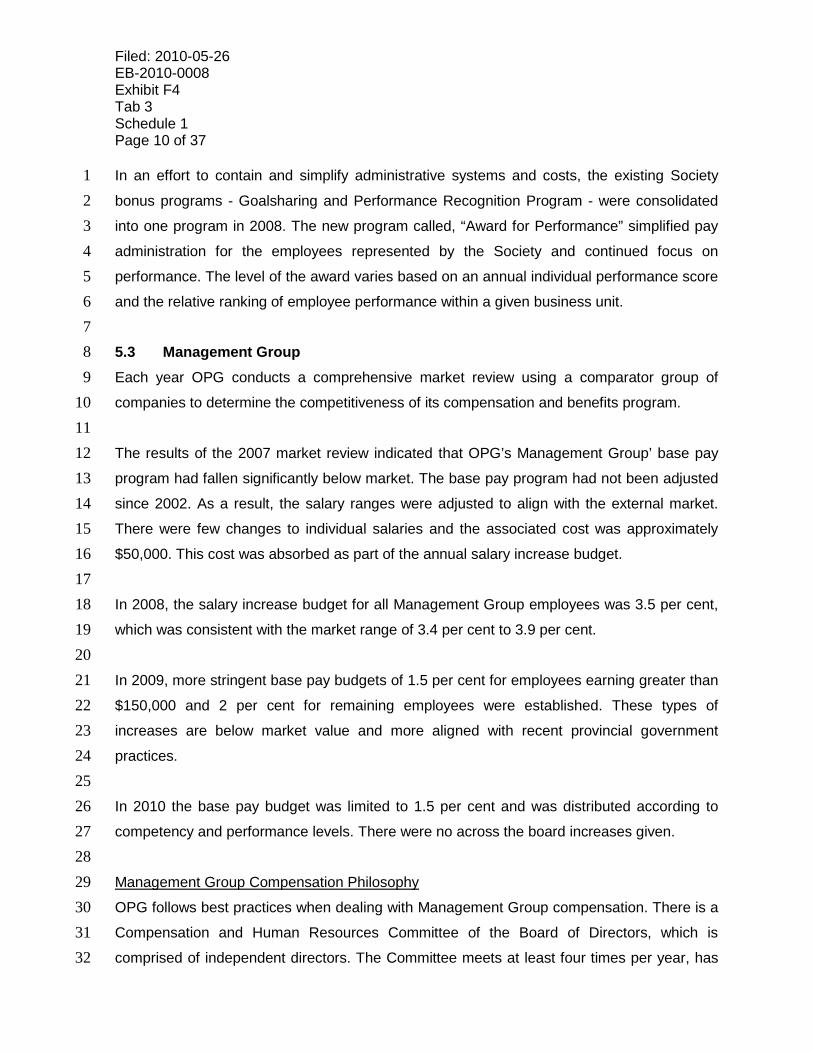
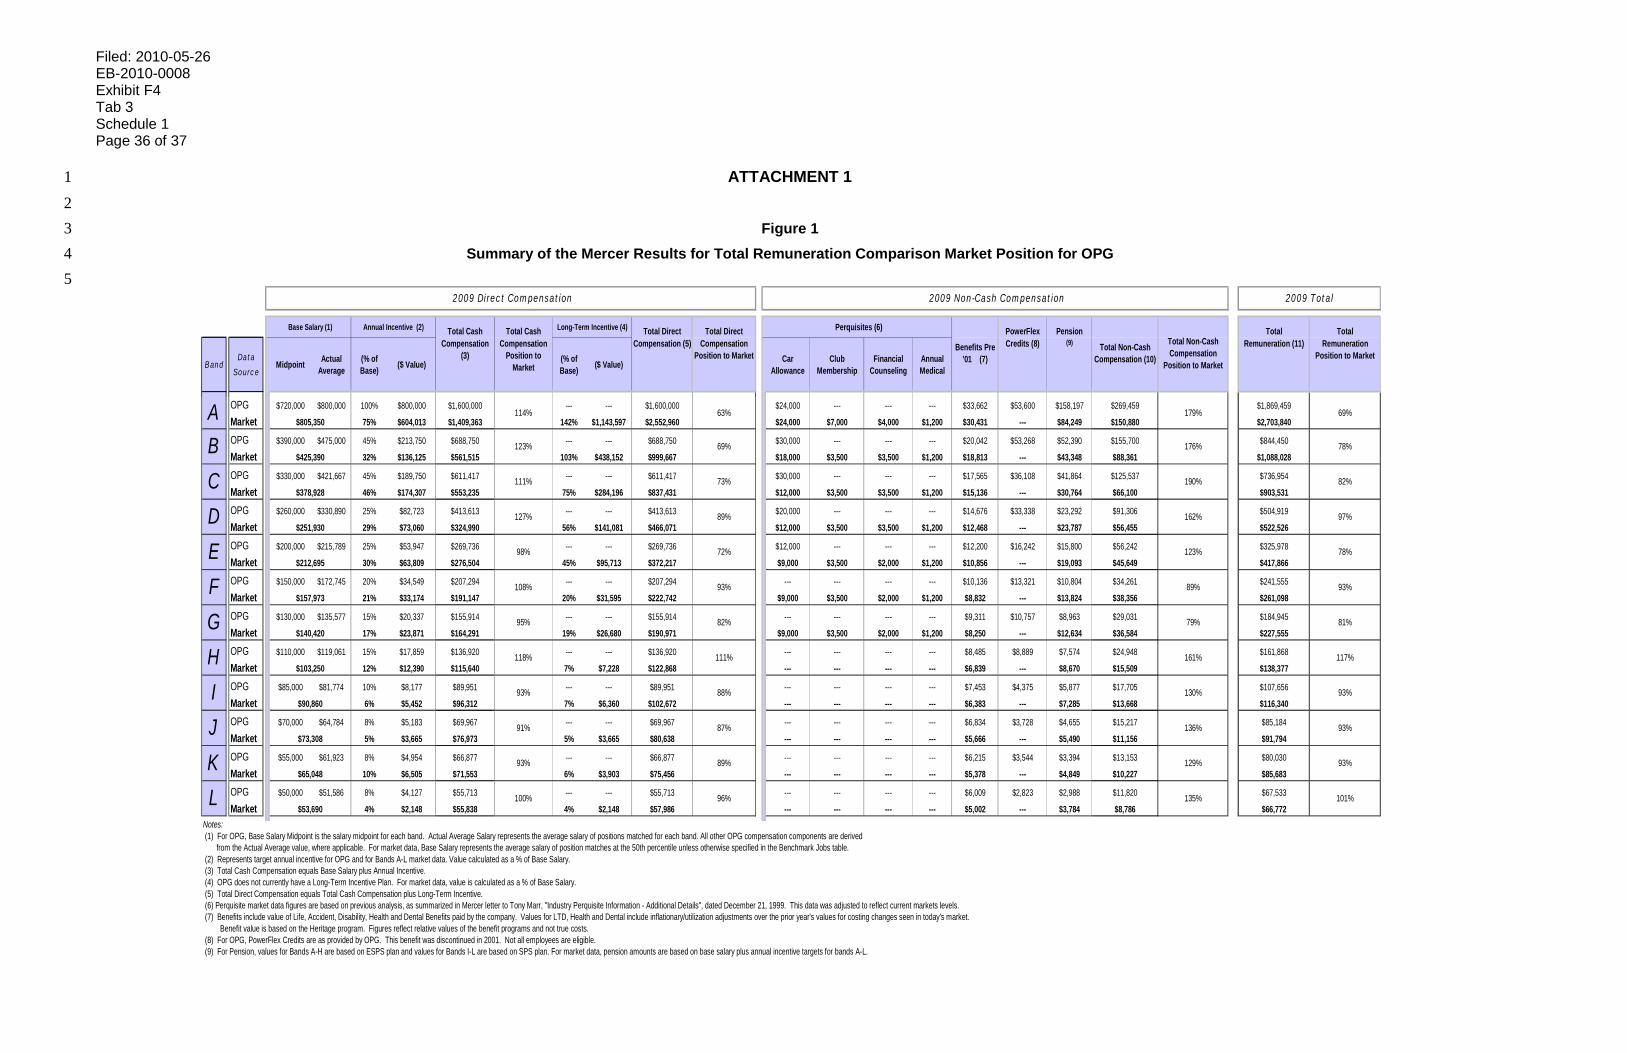
full access to management and company data, and has hired an advisor from Towers 1 Watson to provide independent advice. The Compensation and Human Resources 2 Committee is responsible for overseeing all significant compensation matters and making 3 recommendations to the full Board of Directors for approval. 4 5 When reviewing management and executive compensation, OPG gathers information from a 6 listing of 24 companies that represent Canadian industries in both the public and private 7 sector. In 2008 and 2009, OPG compared its compensation and benefits program to the 50th 8 percentile of this market. Overall, the compensation and benefits program and employees 9 actual pay are competitive with the external market. Figure 1 in Attachment 1 presents 10 OPG’s current market position. In practice, when recruiting and retaining quality executives 11 OPG often finds that the salary norms for the general industrial sector drive the levels of 12 compensation. This has been the case when recruiting senior nuclear operating executives. 13 OPG has needed to look to the United States because an executive market for the nuclear 14 industry is limited in Canada. 15 16 The OPG Management Group salary structure is detailed and rigorously maintained, with 17 base salaries defined by job responsibilities and salary ranges defined for each job level. The 18 base salary and Annual Incentive Plan (“AIP”) award structure (discussed in the next section 19 – Variable Pay Programs) is found in Chart 7. 20 21
Filed: 2010-05-26 EB-2010-0008 Exhibit F4 Tab 3 Schedule 1 Page 12 of 37
Chart 7 1 2
2009/10 Management Group Base Salary Ranges and AIP Award Program
Band Level Organization Structure Min. Mid. Max. AIP
Target A
Senior Executive $580,000 $720,000 $860,000 100%
B $315,000 $390,000 $465,000 45%C $265,000 $330,000 $395,000 45%D Executive $195,000 $260,000 $325,000 25%E $160,000 $200,000 $240,000 25%F
Management $120,000 $150,000 $180,000 20%
G $95,000 $130,000 $160,000 15%H $85,000 $110,000 $140,000 15%I Professional $65,000 $85,000 $105,000 10%J $55,000 $70,000 $90,000 8%K Administrative $45,000 $55,000 $65,000 8%L $40,000 $50,000 $60,000 8%
3 5.4 Variable Pay Programs 4 Changes to the variable pay programs for 2008 are indicated below. For 2009, the awards 5 under all of the variable pay programs were reduced by 5 per cent. For 2010, the awards 6 were reduced by ten per cent for all employees. 7 8 5.4.1 Goalsharing 9 Goalsharing is an annual incentive plan for unionized staff to share in the gains realized 10 when OPG meets or exceeds its business targets. This program does not operate like a 11 profit sharing plan but rather is based on achieving business unit objectives such as 12 decreased costs, increased productivity and reliability and environmental and safety targets. 13 14 The objectives of the goalsharing program are to: 15
• Contribute to OPG’s business success. 16 • Share OPG’s business success with all represented employees. 17 • Engage employees in OPG’s business. 18
Filed: 2010-05-26 EB-2010-0008
Exhibit F4 Tab 3
Schedule 1 Page 13 of 37
• Enhance employees’ understanding of OPG’s business. 1
• Foster a productive relationship and sense of partnership between OPG Management, 2 the Society and the PWU. 3
4 Awards are distributed following the end of the calendar year (typically within the first quarter 5 of the following year). Goalsharing payments are considered to be income and are subject to 6 statutory deductions; however, they are non-pensionable and do not form part of base salary 7 for any other purpose. Management establishes the mandatory performance measures and 8 target performance levels for the site scorecards, and determines the year-end results and 9 performance score. Measures and targets may be adjusted by OPG during the year if there 10 are significant changes to the business direction or priorities. Goalsharing results and awards 11 are audited internally and are approved by the Board of Directors. Refer to Chart 3 for 12 information on recent award levels. 13 14 5.4.2 Award for Performance 15 In an effort to contain costs and simplify administrative systems the existing bonus programs 16 - Goalsharing and Performance Recognition Program - were consolidated into one program 17 in 2008 for Society-represented employees. The new program called, Award for 18 Performance, simplified pay administration for the employees represented by the Society and 19 continued focus on performance. The level of the award varies based on an annual individual 20 performance score and the relative ranking of employee performance within a given business 21 unit. 22 The amount of award depends on the level of individual performance relative to that of peers 23 within a given business area. 24 25 5.4.3 Management Group Annual Incentive Plan (“AIP”) 26 Incentives are a key and normal component of the compensation payable to executives and 27 non-union employees. The AIP was adopted in 1999 to encourage and reward performance, 28 based on the achievement of defined objectives. The plan has evolved over the years and 29 has been adapted in response to changing business requirements. In 2007, the plan was 30 revised to improve the alignment of the production units and the corporate support functions 31 as well as to simplify the plan. The intent of the plan is to deliver a portion of total 32

Filed: 2010-05-26 EB-2010-0008 Exhibit F4 Tab 3 Schedule 1 Page 14 of 37
compensation paid to Management Group employees on a pay-at-risk basis. Under the plan, 1 eligible employees can earn annual cash awards if key cost control and operational 2 objectives of the corporation, business unit and individual are met during the plan year. Refer 3 to Chart 3 for information on recent award levels. 4 5 The plan was revised for 2010 to provide for a cap on the total funds available to be 6 distributed to individuals. The budget for AIP is now based on corporate OPG performance 7 and is further influenced by Fleet (Nuclear, Thermal, Hydro, and Corporate Functions) 8 performance. 9 10 As with other aspects of Management Group compensation previously discussed, the AIP 11 continues to undergo a rigorous review process. After the CEO approves the Corporate 12 targets, the scorecards are reviewed and approved by the Compensation and Human 13 Resources Committee of the OPG Board. AIP is made up of three components: a Corporate 14 scorecard, Fleet scorecards, and personal objectives for individual performance. For each 15 performance objective, there are threshold, target, and maximum levels of performance. 16 Individual awards vary depending on Corporate performance, Fleet performance, and the 17 employee’s level of performance and salary band level. Refer to Chart 7 for information on 18 target award percentages for each salary band. Once performance levels are assessed, the 19 CEO and the Compensation and Human Resources Committee complete a final review and 20 approval of the award for AIP. Results and awards undergo an internal audit each year. 21 22 5.4.4 Authorization Bonuses and Leadership Allowances 23 Employees in nuclear who are authorized by the Canadian Nuclear Safety Commission, such 24 as authorized nuclear operators, control room shift supervisors and control room shift 25 operating supervisors, and who are required to maintain their licenses as a requirement of 26 their job, receive a licence retention bonus of between 15 - 28 per cent of their base salary. 27 The bonus is pensionable. In addition, Authorized Training Supervisors are eligible to receive 28 75 per cent of the Control Room Shift Supervisors and Control Room Shift Operating 29 Supervisors authorization bonus. 30 31

Filed: 2010-05-26 EB-2010-0008
Exhibit F4 Tab 3
Schedule 1 Page 15 of 37
Management Group employees who are required to work shifts are paid a leadership 1 allowance. This allowance is in lieu of provisions such as shift premiums and on-call 2 payments which are paid to represented employees who work shifts. The leadership 3 allowance provides an additional 30 - 40 per cent of base salary, of which 10 per cent is 4 pensionable. Management Group employees who are on call 24 hours a day, seven days a 5 week, who are licensed and hold the licence authority for plant operations also receive the 6 same license retention bonus. 7 8 These allowances and bonuses are necessary to attract and retain staff for the applicable 9 positions and to provide appropriate incentives to staff to keep their licences current. The 10 staff licensing process is set out by the Canadian Nuclear Safety Commission and 11 represents a challenging and time-consuming task. Not every employee is prepared to 12 devote personal time and effort necessary to obtain and maintain a licence. In addition, first 13 line Management Group employees in these organizational units are significantly more likely 14 to have salaries that are similar to or lower than their union subordinates and the allowance 15 or bonus retains the appropriate relativity of compensation. 16 17 5.5 Compensation Summary 18 Operating within a unionized environment can pose challenges in terms of labour cost 19 containment. This challenge becomes even greater when coupled with the requirement for 20 highly skilled workers and an anticipated staff shortfall. Despite all of the above, OPG has 21 made progress towards containing labour costs through the implementation of a number of 22 initiatives including: skill broadening, a new Society compensation plan, and maintaining 23 management salaries at the 50th percentile of their comparator market. Details on 24 compensation benchmarking and wage competitiveness are found in section 8.0. 25 26 6.0 PENSION AND BENEFITS 27 OPG’s pension and benefit programs consist of post employment benefits as well as health, 28 dental, and other benefits for current employees and their dependants. Post employment 29 benefits programs consist of a registered pension plan (“RPP”) and supplementary pension 30 plans, and other post employment benefits (“OPEB”), which include post-retirement benefits, 31
Filed: 2010-05-26 EB-2010-0008 Exhibit F4 Tab 3 Schedule 1 Page 16 of 37
such as group life insurance and health and dental care for pensioners and their dependants, 1 as well as long-term disability benefits for current employees. 2 3 Pension and benefits levels at OPG are determined in two ways. Approximately 90 per cent 4 of the employee population is covered by collective agreements that contain pension and 5 benefits clauses. Pension and benefits levels for Management Group employees are 6 determined by OPG’s Board of Directors. OPG views pension and benefits as part of the 7 total compensation package that should vary according to the overall compensation for each 8 employee group. As a result, there are differences between the pension and benefits levels 9 for PWU and Society-represented staff and those for the Management Group. These 10 differences also contribute to the ability of OPG to attract, retain, and motivate employees. 11 12 As a successor of Ontario Hydro, OPG has a contributory, defined benefit registered pension 13 plan (“RPP”), which follows closely the model used by most public sector pension plans. All 14 OPG employees earn and contribute towards their pension package, although the benefit 15 levels are slightly less for non-unionized employees than for union members. In addition, all 16 employees are eligible to receive benefits from the defined benefit supplementary pension 17 plans should their pension promise exceed the limits under the Income Tax Act for payment 18 from the RPP. The health and dental benefits have also moved away from a “one size fits all” 19 approach and there are now differences between the unionized and non-unionized groups of 20 employees. OPG monitors benefit payments associated with both pension and health and 21 dental benefits plans closely to ensure that the plans are being administered appropriately. 22 23 6.1 Pension 24 The RPP is funded. The fund assets include equity securities and corporate and government 25 debt securities, real estate, and other investments which are managed by professional 26 investment managers. The fund does not invest in securities issued by OPG. Independent 27 actuarial valuations are performed routinely to determine the funded status of the RPP and, 28 in turn, OPG's contributions. The valuation is filed with the Financial Services Commission of 29 Ontario, as required by the Pension Benefits Act (Ontario). Deficits are funded over a period 30 of time in accordance with the Pension Benefits Act (Ontario) (5 - 15 years depending on the 31 nature of the deficit). If the plan is in a surplus position, OPG may reduce or suspend its 32

Corrected: 2010-09-16 EB-2010-0008
Exhibit F4 Tab 3
Schedule 1 Page 17 of 37
contributions to the extent permitted under the Pension Benefits Act (Ontario). The most 1 recently filed actuarial valuation was as at January 1, 2008 and showed that the pension fund 2 was in a deficit position. The next funding valuation will be performed as at January 1, 2011 3 and will be carried out during 2011. 4 5 The supplementary pension plans are not funded but are secured by letters of credit. A 6 number of changes have been made to the pension plans over the past few years. These 7 include: 8 • In 2001, all new employees hired into manager positions or higher received a different set 9
of pension benefits including reduced indexing levels, inclusion of incentive amounts in 10 pensionable earnings and undiscounted retirement at age 60. 11
• In 2003, employee contribution rates increased for all groups from 4 per cent of base 12 earnings up to the year’s maximum pensionable earnings and 6 per cent of base 13 earnings in excess of year’s maximum pensionable earnings to 4.5 per cent and 6.5 per 14 cent respectively. 15
• In 2006, employee contribution rates further increased to 7 per cent of base earnings for 16 the Society and Management Group members. 17
• In 2009 employee contribution rates increased to 5 per cent of base earnings up to the 18 year’s maximum pensionable earnings and 7 per cent of base earnings in excess of 19 year’s maximum pensionable earnings for PWU represented members. 20
21 A defined benefit RPP has long been a part of the public service compensation package. It is 22 designed to be retentive and to reward long service. In an industry where skills are generally 23 developed and not bought on the outside market, this type of pension plan is desirable. 24 Historical and planned pension costs for the regulated businesses are presented in Chart 9. 25 26 6.2 Benefits 27 All employees and pensioners at OPG have health and dental benefits designed to protect 28 them from undue costs associated with illness and to encourage them to take steps to 29 maintain good health. The benefits plan has experienced some pressure recently as fewer 30 services are covered by the provincial government. OPG has been taking steps to both 31 monitor and control benefits and has implemented a number of changes to stabilize costs 32
Filed: 2010-05-26 EB-2010-0008 Exhibit F4 Tab 3 Schedule 1 Page 18 of 37
and to better align benefit provisions with those of the external market. Changes for the 1 employees represented by the Society and the PWU are achieved only through the collective 2 bargaining process and are, therefore, tied to the timelines of the agreements. OPG 3 outsources its claims management to Great West Life and, in addition, has put in place a 4 number of mechanisms to control benefits costs. These include the mandatory use of generic 5 drugs, the use of a drug card at pharmacies, and a requirement for prior approval for 6 uncommon and expensive drug and treatment therapies. 7 8 Recent benefits changes for each employee group include the following: 9 10 Management Group (2008) 11 Pension: 12 • Eliminated 90-day waiting period for new hires (Controls administrative costs since, 13
historically, all new hires did buy-back the additional 90 days pensionable service). 14 15 The Society (2008) 16 Pension: 17 • Eliminated 90-day waiting period for new hires. 18 Health and dental benefits: 19 • Effective January 1, 2008, vision care increased to $600 per person every two years from 20
$550 per person every two years. 21 22 PWU (2008) 23 Pension: 24 • Effective January 4, 2009, increased employee contribution rates from 4.5 per cent of 25
base annual earnings up to Year’s Maximum Pensionable Earnings (“YMPE”) and 6 per 26 cent for base annual earnings greater than YMPE to 5 per cent and 7 per cent 27 respectively. 28
• Eliminated 90-day waiting period for new hires (effective January 3, 2008). 29 Health and dental benefits: 30 31
Filed: 2010-05-26 EB-2010-0008
Exhibit F4 Tab 3
Schedule 1 Page 19 of 37
• Increases in coverage to paramedical services from $500 per person per year at 50 per 1 cent co-insurance to $600 per person per calendar year, effective April 1, 2010 and $650 2 per person per calendar year, effective April 1, 2011 at 50 per cent co-insurance. 3
• Increases in coverage for vision care from $500 per person every two years to $550 per 4 person every two years effective April 1, 2010 and $600 per person every two years 5 effective April 1, 2011. The current two year period commenced January 1, 2010 and 6 ends December 31, 2011. 7
• A commitment to pay directly to a carrier $35 per year per PWU employee in each of the 8 next three years for an out-of-country personal travel insurance program and $35 per 9 year per PWU pensioner who opt to purchase out-of-country personal travel insurance 10 provided by the same carrier. 11
12 As a result of some of these changes, OPG is experiencing less escalation in the cost of its 13 health and dental benefits than other employers. In 2009, OPG’s benefit payments rose an 14 average of 2.9 per cent against an industry average figure of approximately 17 per cent 15 based on information provided by Great West Life. Great West Life, like all other group 16 insurance carriers, keeps track of changes taking place in the healthcare industry, 17 specifically with respect to trends in overall utilization, inflation, and cost shifting between the 18 public and private sectors through changes to Government health programs. 19 20 One area in which OPG incurred additional costs relates to the Ontario health premium. OPG 21 was directed, through an arbitration award, to pay the Ontario health premium for all PWU-22 represented employees and pensioners. This resulted in an additional payment of 23 approximately $6M annually, plus one-time expenditures incurred for a pay system change to 24 allow tracking and payment of these amounts. 25 26 The payment amount of claims processed in 2009 associated with health and dental benefits 27 and life insurance for both current employees and pensioners across the Company was 28 approximately $109M. 29 30 Historical and forecasted OPEB costs for the regulated businesses are presented in Chart 9.31
32
Corrected: 2010-09-16 EB-2010-0008 Exhibit F4 Tab 3 Schedule 1 Page 20 of 37
6.3 Pension and Benefits Costs 1 OPG is seeking recovery of pension and benefits costs associated with the regulated 2 operations based on the amount of pension and benefits costs determined in accordance 3 with GAAP. 4 5 6.3.1 Accounting Treatment of Pension and OPEB Plans 6 In accordance with GAAP, pension and OPEB costs for the current year are based on the 7 measurement of benefit obligations and RPP fund assets at the end of the previous year. 8 The full impact of events arising during a year is not immediately charged to pension and 9 OPEB costs. Certain amounts are accumulated and amortized over future periods and 10 therefore generally affect pension and OPEB costs in future years. 11 12 The obligations for pension and other post retirement benefit costs are determined using the 13 projected benefit method pro-rated on service. Under this method, an equal portion of the 14 total estimated future benefit is attributed to each year of service until the date the plan 15 participant would be entitled to the full benefit. The obligation at a particular date is the 16 actuarial present value of the benefits attributed to service rendered up to that date. 17 18 The obligation for long-term disability benefits is determined using the projected benefit 19 method on a terminal basis. Under this method, the total estimated future benefit is attributed 20 to the year of service in which a disability actually occurs. 21 22 Pension and OPEB costs and obligations are determined annually by independent actuaries 23 using management’s best estimate assumptions, both economic (inflation, salary escalation, 24 health care cost trends, etc.) and demographic (mortality, termination rates, retirement rates, 25 etc). The discount rates used in determining projected benefit obligations and the costs for 26 pension and OPEB are based on AA corporate bond yields for the appropriate duration of the 27 benefit obligation in accordance with GAAP. 28
29 30 For purposes of determining pension costs, RPP fund assets are valued using a market-31 related value of assets. The market-related value used by OPG recognizes gains and losses 32 on equity assets relative to a 6 per cent assumed real return over a five-year period. 33
Filed: 2010-05-26 EB-2010-0008
Exhibit F4 Tab 3
Schedule 1 Page 21 of 37
1 Pension and OPEB costs are made up of a number of components, including current service 2 costs, interest costs on the obligations at the appropriate discount rate, the expected return 3 on RPP fund assets using an estimated long-term rate of return, amortization of past service 4 costs arising from plan amendments and amortization of actuarial gains or losses. Actuarial 5 gains and losses consist of experience gains and losses, which arise because actual 6 experience differs from that assumed (e.g., investment experience different than expected, 7 fewer deaths or higher inflation), and adjustments for changes in assumptions (e.g., discount 8 rate or a new mortality table). 9 10 Actuarial gains and losses are generally amortized over future periods and, therefore, affect 11 recognized costs and the recorded obligation over a period of time. In accordance with 12 GAAP, OPG’s policy for accounting for pension and OPEB is to amortize the net cumulative 13 unamortized gain or loss in excess of 10 per cent of the greater of the benefit obligation and 14 the market-related value of the plan assets over the expected remaining service life of the 15 employees. This is known as the “corridor approach”. Past service costs for pension and 16 OPEB are amortized over the remaining service period to full eligibility, and therefore also 17 affect recognized costs and the recorded obligation over a period of time. 18 19 As a result of the use of a market-related asset value, the corridor approach, and the 20 amortization of actuarial gains and losses and past service costs, certain components of the 21 actuarial gains and losses and past service costs are not being immediately charged to 22 pension and OPEB costs. 23 24 6.3.2 Assumptions and Budget Setting for Pension and OPEB Costs 25 To project OPG’s total pension and OPEB costs for business planning purposes, it is 26 necessary to estimate the value of the obligations and the pension fund assets at the end of 27 each year preceding each of the years in the forecast period. This requires making 28 projections of the actual pension fund performance and of the assumptions that will be used 29 to determine the costs. 30 31

Filed: 2010-05-26 EB-2010-0008 Exhibit F4 Tab 3 Schedule 1 Page 22 of 37
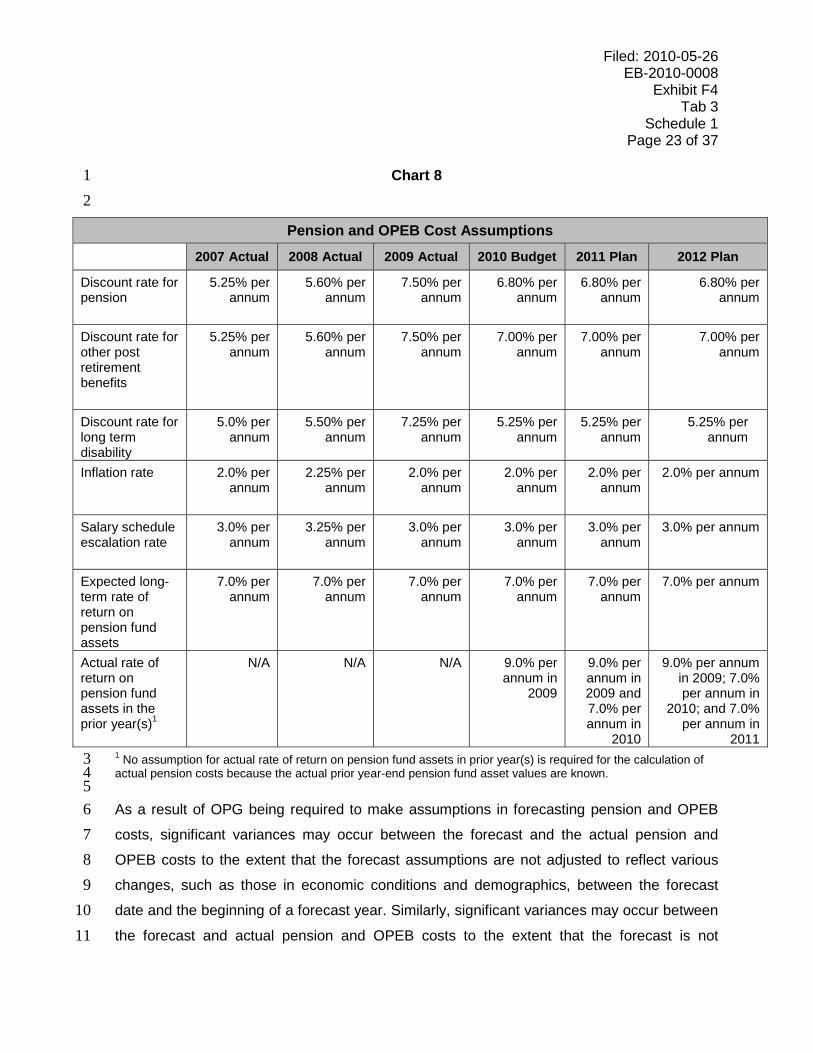
The discount rates for projections are determined by the actuary based on the most recent 1 AA corporate bond yields for the appropriate duration of the benefit obligation available at the 2 time that the projection is being prepared. The discount rates used for projections may be 3 adjusted by a maximum of 25 basis points if the AA corporate bond yields provided by the 4 actuary are not indicative of historical trends or during a period of volatility in those yields. 5 6 The long term inflation assumption used for projections is based on the Ontario consumer 7 price index for the final year in the most recent forecast from a publicly available economic 8 report, subject to an adjustment if the rate is outside of the Bank of Canada's target range for 9 inflation. The salary schedule escalation rate is equal to the long term inflation assumption 10 plus 1 per cent. 11 12 The expected long term pension fund rate of return is calculated and updated as required by 13 the actuary. It is based on the current and expected asset allocation and the long-term 14 historical risks and returns associated with each of the asset classes, and includes a 15 provision for additional return as a result of active fund management and a provision for 16 administrative expenses. 17 18 The projected actual return on pension fund assets in the current year is based on the actual 19 return up to the end of the month prior to the date on which the projection is being prepared. 20 If the assumptions for the projection are selected during the first half of the year, the return 21 on assets in the current year is based on the actual return up to the end of the month prior to 22 the date the assumptions are determined, and the assumed annualized return for the 23 remainder of the year is equal to the expected long term rate of return on pension fund 24 assets. The projected actual return on pension fund assets in subsequent years is equal to 25 the expected long term rate of return on these assets. Chart 8 presents the projected 26 assumptions used to determine the forecasted pension and OPEB costs for 2010 to 2012 27 and the actual assumptions used for 2007 to 2009: 28 29
Filed: 2010-05-26 EB-2010-0008
Exhibit F4 Tab 3
Schedule 1 Page 23 of 37
Chart 8 1 2
Pension and OPEB Cost Assumptions
2007 Actual 2008 Actual 2009 Actual 2010 Budget 2011 Plan 2012 Plan
Discount rate for pension
5.25% per annum
5.60% per annum
7.50% per annum
6.80% per annum
6.80% per annum
6.80% per annum
Discount rate for other post retirement benefits
5.25% per annum
5.60% per annum
7.50% per annum
7.00% per annum
7.00% per annum
7.00% per annum
Discount rate for long term disability
5.0% per annum
5.50% per annum
7.25% per annum
5.25% per annum
5.25% per annum
5.25% per annum
Inflation rate 2.0% per annum
2.25% per annum
2.0% per annum
2.0% per annum
2.0% per annum
2.0% per annum
Salary schedule escalation rate
3.0% per annum
3.25% per annum
3.0% per annum
3.0% per annum
3.0% per annum
3.0% per annum
Expected long-term rate of return on pension fund assets
7.0% per annum
7.0% per annum
7.0% per annum
7.0% per annum
7.0% per annum
7.0% per annum
Actual rate of return on pension fund assets in the prior year(s)1
N/A N/A N/A 9.0% per annum in
2009
9.0% per annum in 2009 and 7.0% per annum in
2010
9.0% per annum in 2009; 7.0% per annum in
2010; and 7.0% per annum in
20111 No assumption for actual rate of return on pension fund assets in prior year(s) is required for the calculation of 3 actual pension costs because the actual prior year-end pension fund asset values are known. 4 5 As a result of OPG being required to make assumptions in forecasting pension and OPEB 6 costs, significant variances may occur between the forecast and the actual pension and 7 OPEB costs to the extent that the forecast assumptions are not adjusted to reflect various 8 changes, such as those in economic conditions and demographics, between the forecast 9 date and the beginning of a forecast year. Similarly, significant variances may occur between 10 the forecast and actual pension and OPEB costs to the extent that the forecast is not 11

Filed: 2010-05-26 EB-2010-0008 Exhibit F4 Tab 3 Schedule 1 Page 24 of 37
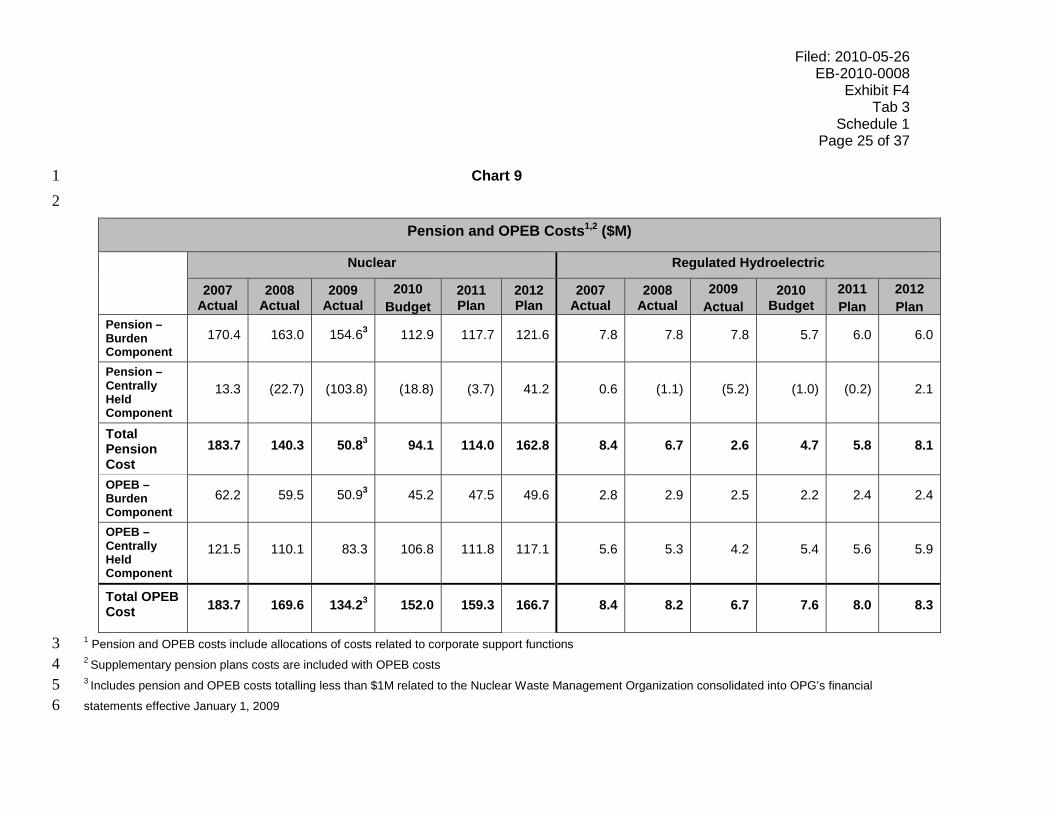
adjusted to reflect the actual experience, such as the return on pension funds assets, to the 1 beginning of the forecast year. 2 3 6.3.3 Pension and OPEB Cost Distribution 4 A portion of OPG’s total pension and OPEB costs is charged directly to the business units via 5 a payroll burden included as part of the standard labour rate (see section 7). The portion of 6 pension and OPEB costs included in the standard labour rate is based on the budgeted 7 current service cost. The remainder of pension and OPEB costs, which includes interest 8 costs on the obligations, the expected return on pension plan assets, amortization of 9 applicable past service costs, amortization of actuarial gains and losses, and any current 10 service cost variance from budget, is recorded as a centrally-held cost (presented in Ex. F4-11 T4-S1 section 3). 12 13 The payroll burden component that is reflected in the regulated business units’ OM&A is 14 largely presented as part of labour costs in Ex. F2-T2-S1 and Ex. F2-T4-S1 for Nuclear and 15 Ex. F1-T2-S1 for Regulated Hydroelectric. The payroll burden for corporate support groups is 16 embedded in the costs of those groups. Corporate support groups’ OM&A costs are directly 17 assigned and allocated to the regulated business units in accordance with OPG’s cost 18 allocation methodology, as described in Ex. F3-T1-S1. 19 20 The centrally-held costs for pension and OPEB are directly assigned and allocated to the 21 regulated business units in proportion to the pension and OPEB costs that are charged to the 22 regulated business units based on direct charges via payroll burden plus the costs assigned 23 and allocated from the corporate support groups. This methodology was reviewed as part of 24 OPG’s external cost allocation study presented in Ex. F5-T2-S1 and discussed in Ex. F3-T1-25 S1. The centrally-held costs for pension and OPEB attributed to the regulated businesses 26 are recorded as OM&A costs. 27 28 6.3.4 Comparison of Pension and OPEB Costs 29 Chart 9 presents pension and OPEB costs attributed to regulated operations for the period 30 2007 – 2012.31
Filed: 2010-05-26 EB-2010-0008
Exhibit F4 Tab 3
Schedule 1 Page 25 of 37
Chart 9 1 2
Pension and OPEB Costs1,2 ($M)
Nuclear Regulated Hydroelectric
2007 Actual
2008 Actual
2009 Actual
2010 Budget
2011 Plan
2012 Plan
2007 Actual
2008 Actual
2009 Actual
2010 Budget
2011 Plan
2012 Plan
Pension – Burden Component
170.4 163.0 154.63 112.9 117.7 121.6 7.8 7.8 7.8 5.7 6.0 6.0
Pension – Centrally Held Component
13.3 (22.7) (103.8) (18.8) (3.7) 41.2 0.6 (1.1) (5.2) (1.0) (0.2) 2.1
Total Pension Cost
183.7 140.3 50.83 94.1 114.0 162.8 8.4 6.7 2.6 4.7 5.8 8.1
OPEB – Burden Component
62.2 59.5 50.93 45.2 47.5 49.6 2.8 2.9 2.5 2.2 2.4 2.4
OPEB – Centrally Held Component
121.5 110.1 83.3 106.8 111.8 117.1 5.6 5.3 4.2 5.4 5.6 5.9
Total OPEB Cost 183.7 169.6 134.23 152.0 159.3 166.7 8.4 8.2 6.7 7.6 8.0 8.3
1 Pension and OPEB costs include allocations of costs related to corporate support functions 3 2 Supplementary pension plans costs are included with OPEB costs 4 3 Includes pension and OPEB costs totalling less than $1M related to the Nuclear Waste Management Organization consolidated into OPG’s financial 5 statements effective January 1, 2009 6
Filed: 2010-05-26 EB-2010-0008 Exhibit F4 Tab 3 Schedule 1 Page 26 of 37
1 Pension and OPEB costs charged directly to regulated business units via payroll burden 2 decrease significantly over the 2007 to 2010 period. The decreases are due mainly to the net 3 impact of: successive increases in the discount rate assumption from 5 per cent in 2007 for 4 both pension and other post retirement benefits to 6.80 per cent for pension and 7 per cent 5 for other post retirement benefits in 2010, updated membership and claims data, and a 6 change in the demographic and health care cost trend assumptions in 2009. The payroll 7 burden amounts are expected to remain relatively stable over the 2011 to 2012 period as 8 compared to 2010. 9 10 Pension and OPEB costs recorded as centrally-held costs directly assigned and allocated to 11 the regulated business units decreased significantly over the 2007 - 2009 period. The main 12 drivers of the net decrease are: the change in assumptions in the discount rates and the 13 expected net growth in the cost components during the period, as well as a change in the 14 demographic and health care cost trend assumptions, the loss on the RPP fund assets in 15 2008 and lower amounts of pension and OPEB costs being charged to the business units via 16 payroll burden. The expected net growth in the cost components includes an increase in 17 current service costs, higher interest costs on a higher benefit obligation, and a change in the 18 expected return on the RPP fund assets due to the impact of certain gains and losses being 19 reflected in the asset value as a result of using market-related values. 20 21 Centrally-held pension and OPEB costs are expected to increase in 2010 mainly due to the 22 change in assumptions in the discount rates, the expected net growth in the cost 23 components, and the lower amounts of pension and OPEB costs being charged to the 24 business units via payroll burden. Centrally-held pension costs are expected to increase 25 further in 2011 and 2012 mainly due to the expected net growth in the cost components. 26 Centrally-held OPEB costs are expected to remain relatively stable over the 2010 to 2012 27 period. Specific period-over-period and budget-to-actual comparison of the centrally-held 28 pension and OPEB costs is presented as part of the analysis of centrally-held costs in Ex. 29 F4-T4-S2. 30 31
Corrected: 2010-09-16 EB-2010-0008
Exhibit F4 Tab 3
Schedule 1 Page 27 of 37
6.3.5 Accounting Treatment of Benefit Plans for Employees During Employment 1 The discussion above considers cost of benefits for employees post-employment with OPG. 2 This section considers cost of benefits for OPG employees during employment. 3 4 Costs associated with plans that provide benefits, such as health and dental coverage, for 5 current employees during employment are recorded for accounting purposes on the basis of 6 actual benefit payments made by OPG to, or on behalf of, the employees. The costs are 7 charged to regulated business units via the burden component of the standard labour rate 8 (see section 7). The component of these costs reflected in the regulated business units’ 9 OM&A is largely presented as part of labour costs in Ex. F2-T2-S2 and Ex. F2-T4-S1 for 10 Nuclear and F1-T2-S1 for Regulated Hydroelectric. Costs are also charged via payroll 11 burden to corporate support groups and are embedded in the costs of these groups. 12 Corporate support group’s OM&A costs are directly assigned and allocated to the regulated 13 business units in accordance with OPG’s cost allocation methodology, as described in Ex. 14 F3-T1-S1. 15 16 6.4 Pension and Benefits Summary 17 OPG has taken a number of steps to control pension and benefits costs. A less generous 18 benefits plan now exists for newly hired Management Group employees and some of the 19 previous benefits enjoyed by existing Management band employees are no longer available. 20 In bargaining with both the PWU and the Society, OPG has been successful in placing 21 maximums on a variety of benefits items and in eliminating coverage for others. 22 23 7.0 STANDARD LABOUR RATE 24 As part of its business planning process, OPG develops a standard hourly labour rate for 25 each functional group within the company by job family (e.g., one labour rate is established 26 for all nuclear operators). This rate is uploaded into the time reporting systems and is used to 27 track and record costs for accounting and cost management purposes during the year. 28 Separate standard labour rates are developed for job families within Nuclear, the Niagara 29 Plant Group and R.H. Saunders. Separate labour rates are also developed for job families 30 within each corporate support group. 31 32
Filed: 2010-05-26 EB-2010-0008 Exhibit F4 Tab 3 Schedule 1 Page 28 of 37
1 The labour rate is based on actual historical base salary information for each job category, 2 adjusted for escalation rates and increased by the burden component, with the largest 3 component being pension and benefits costs, and other entitlements. A standard overtime 4 hourly labour rate is also developed for represented staff by including an overtime premium, 5 as a percentage of base salary, based on actual historical information. Regular and overtime 6 (where applicable) standard labour rates are determined separately for each of the 7 representations: PWU, the Society, and Management Group. 8 9 The escalation rates used in developing labour rates for PWU and the Society represented 10 staff are based on the general wage increases under applicable collective agreements (see 11 sections 5.1 and 5.2) and the anticipated staff movement, progressions and promotions. The 12 escalation rates are approximately 3 per cent to 4 per cent annually for PWU and 13 approximately 4 per cent annually for the Society during the 2005 - 2009 period. The 14 escalation rates for Management Group are 3 per cent for each of the years during 2007 - 15 2009. Escalation rates used in the calculation of standard labour rates are consistent across 16 all functional groups within OPG. 17 18 The burden component of the labour rate primarily reflects an estimate of the costs of 19 pension and OPEB as well as costs for health, dental and other benefits for employees while 20 they are employed. The rate is applied as a percentage of base salary in calculating the 21 standard labour rates. The burden component of total pension and OPEB costs decreases 22 over the 2007 - 2010 period. The reasons for the decrease in the burden component of the 23 total pension and OPEB costs over the 2007 – 2010 period are discussed in section 6.3.4 of 24 this exhibit. For 2011 – 2012 period, the burden component of the labour rate is expected to 25 be relatively stable compared to 2010. The burden percentages used for developing 26 standard labour rates are the same across all functional groups within OPG. 27 28 8.0 BENCHMARKING 29 OPG conducts a comprehensive market review each year to ensure that data is available to 30 make decisions about the management salary structure and to support the negotiation 31 processes with the unions. The challenge with finding appropriate benchmarks for OPG 32
Filed: 2010-05-26 EB-2010-0008
Exhibit F4 Tab 3
Schedule 1 Page 29 of 37
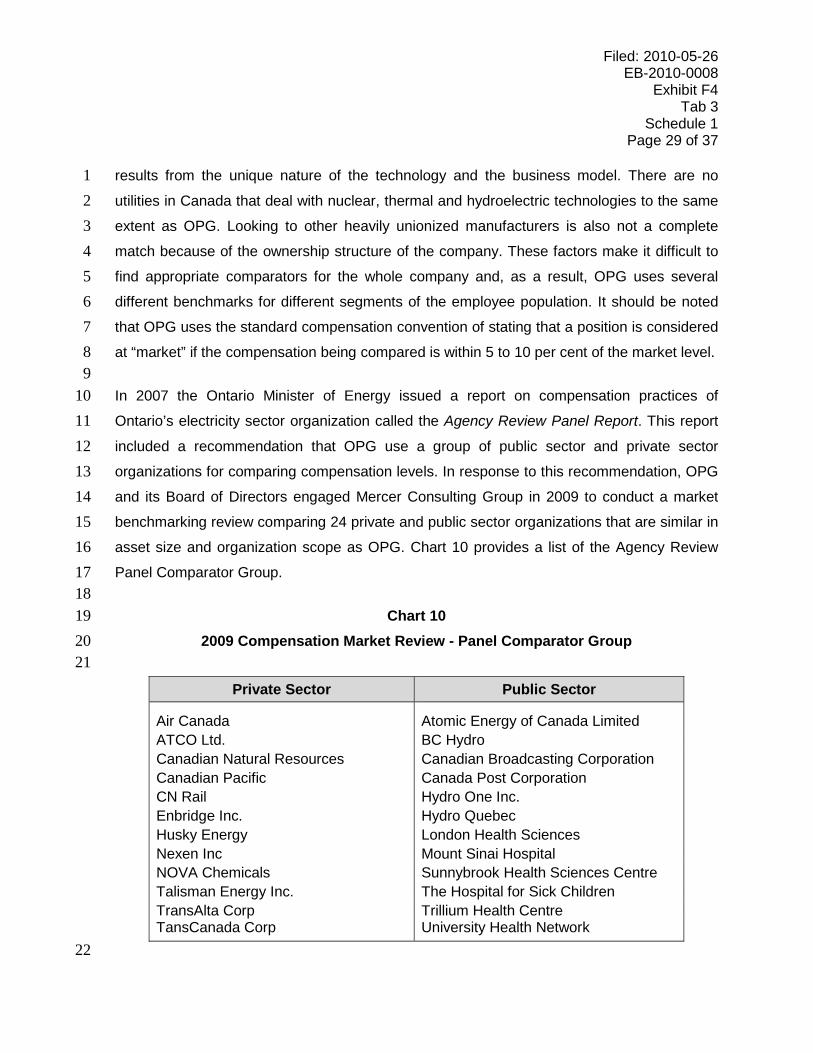
results from the unique nature of the technology and the business model. There are no 1 utilities in Canada that deal with nuclear, thermal and hydroelectric technologies to the same 2 extent as OPG. Looking to other heavily unionized manufacturers is also not a complete 3 match because of the ownership structure of the company. These factors make it difficult to 4 find appropriate comparators for the whole company and, as a result, OPG uses several 5 different benchmarks for different segments of the employee population. It should be noted 6 that OPG uses the standard compensation convention of stating that a position is considered 7 at “market” if the compensation being compared is within 5 to 10 per cent of the market level. 8 9 In 2007 the Ontario Minister of Energy issued a report on compensation practices of 10 Ontario’s electricity sector organization called the Agency Review Panel Report. This report 11 included a recommendation that OPG use a group of public sector and private sector 12 organizations for comparing compensation levels. In response to this recommendation, OPG 13 and its Board of Directors engaged Mercer Consulting Group in 2009 to conduct a market 14 benchmarking review comparing 24 private and public sector organizations that are similar in 15 asset size and organization scope as OPG. Chart 10 provides a list of the Agency Review 16 Panel Comparator Group. 17 18
Chart 10 19 2009 Compensation Market Review - Panel Comparator Group 20
21
Private Sector Public Sector
Air Canada Atomic Energy of Canada Limited ATCO Ltd. BC HydroCanadian Natural Resources Canadian Broadcasting CorporationCanadian Pacific Canada Post Corporation CN Rail Hydro One Inc.Enbridge Inc. Hydro QuebecHusky Energy London Health Sciences Nexen Inc Mount Sinai HospitalNOVA Chemicals Sunnybrook Health Sciences CentreTalisman Energy Inc. The Hospital for Sick Children TransAlta Corp Trillium Health CentreTansCanada Corp University Health Network
22
Filed: 2010-05-26 EB-2010-0008 Exhibit F4 Tab 3 Schedule 1 Page 30 of 37
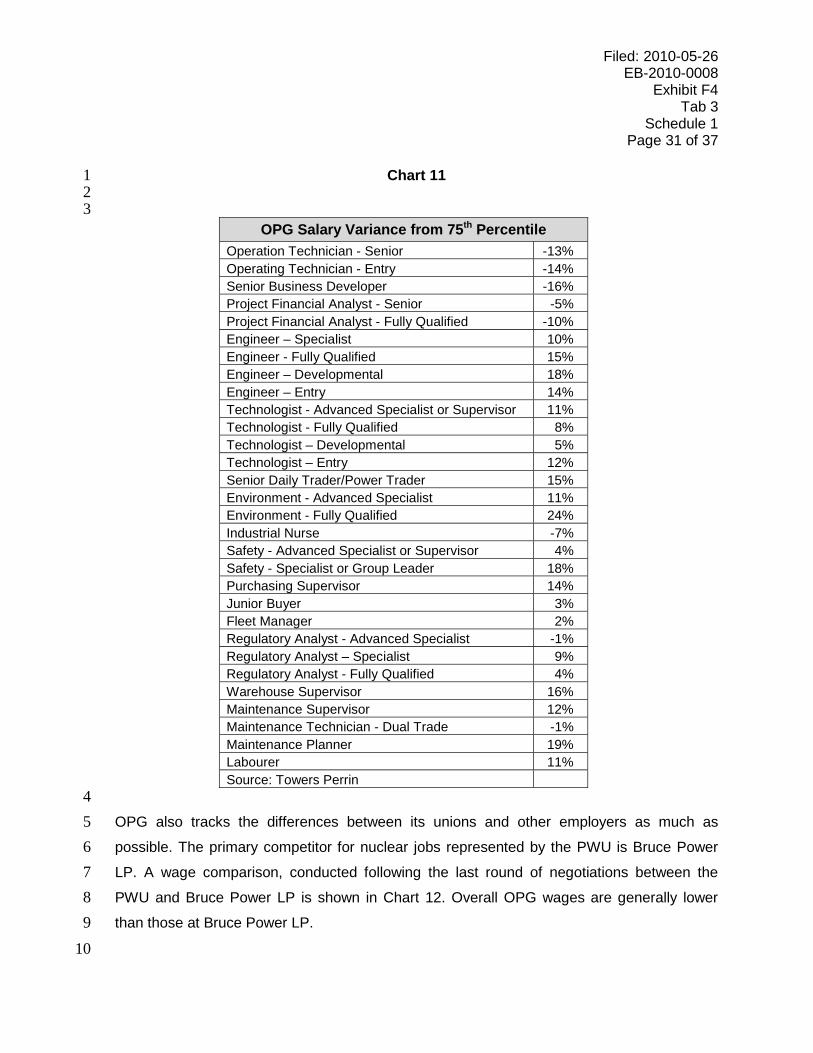
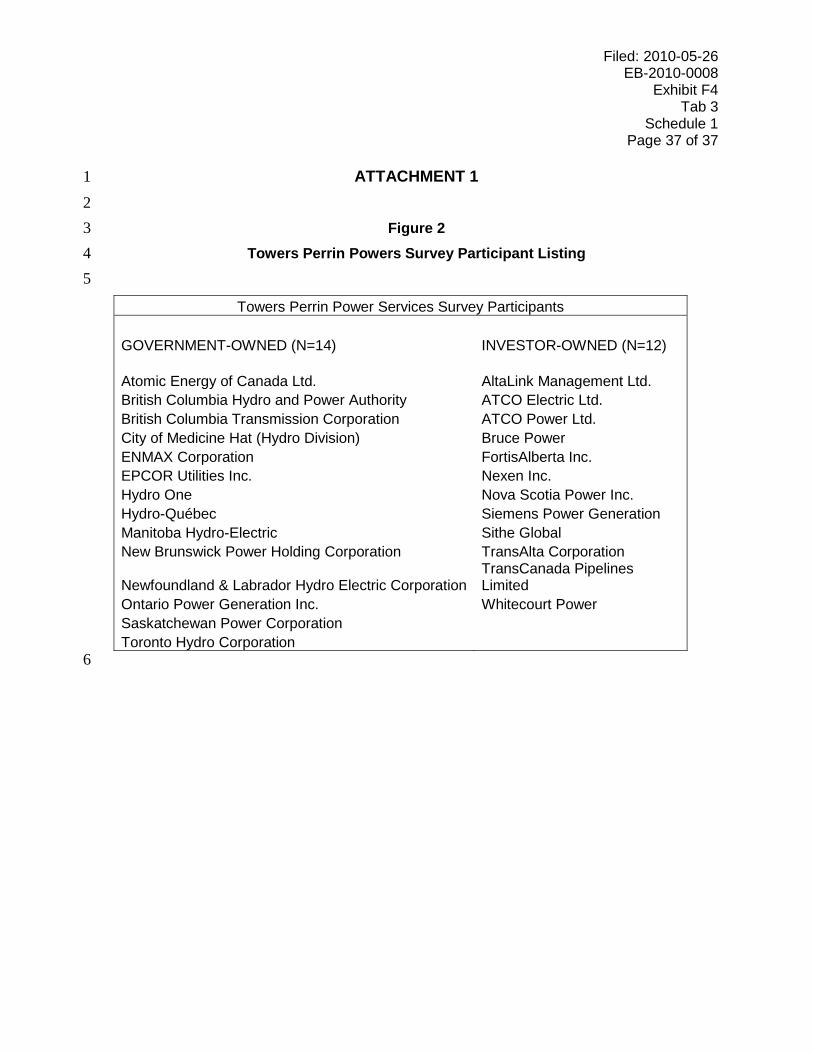
Attachment 1 Figure 1 shows the market compensation analysis for this review. The findings 1 from this analysis indicate that, when compared with the 50th percentile of the Agency 2 Review Panel market, senior executives at OPG are paid below market, and middle 3 management and administration positions are generally paid at market. 4 5 In addition, OPG participates in a study of the Power Services Industry conducted by Towers 6 Perrin. This study compares data across Canada where job matches are sufficiently strong. 7 Attachment 1 Figure 2 provides a list of comparator organizations. Chart 11 provides a range 8 of positions throughout OPG and compares them to the 75th percentile of market data. This 9 chart indicates that while some positions are paid above market and some are below market, 10 OPG is slightly above the 75th percentile of market on an overall basis. 11 12
Filed: 2010-05-26 EB-2010-0008
Exhibit F4 Tab 3
Schedule 1 Page 31 of 37
Chart 11 1 2
3 OPG Salary Variance from 75th Percentile
Operation Technician - Senior -13% Operating Technician - Entry -14% Senior Business Developer -16% Project Financial Analyst - Senior -5% Project Financial Analyst - Fully Qualified -10% Engineer – Specialist 10% Engineer - Fully Qualified 15% Engineer – Developmental 18% Engineer – Entry 14% Technologist - Advanced Specialist or Supervisor 11% Technologist - Fully Qualified 8% Technologist – Developmental 5% Technologist – Entry 12% Senior Daily Trader/Power Trader 15% Environment - Advanced Specialist 11% Environment - Fully Qualified 24% Industrial Nurse -7% Safety - Advanced Specialist or Supervisor 4% Safety - Specialist or Group Leader 18% Purchasing Supervisor 14% Junior Buyer 3% Fleet Manager 2% Regulatory Analyst - Advanced Specialist -1% Regulatory Analyst – Specialist 9% Regulatory Analyst - Fully Qualified 4% Warehouse Supervisor 16% Maintenance Supervisor 12% Maintenance Technician - Dual Trade -1% Maintenance Planner 19% Labourer 11% Source: Towers Perrin
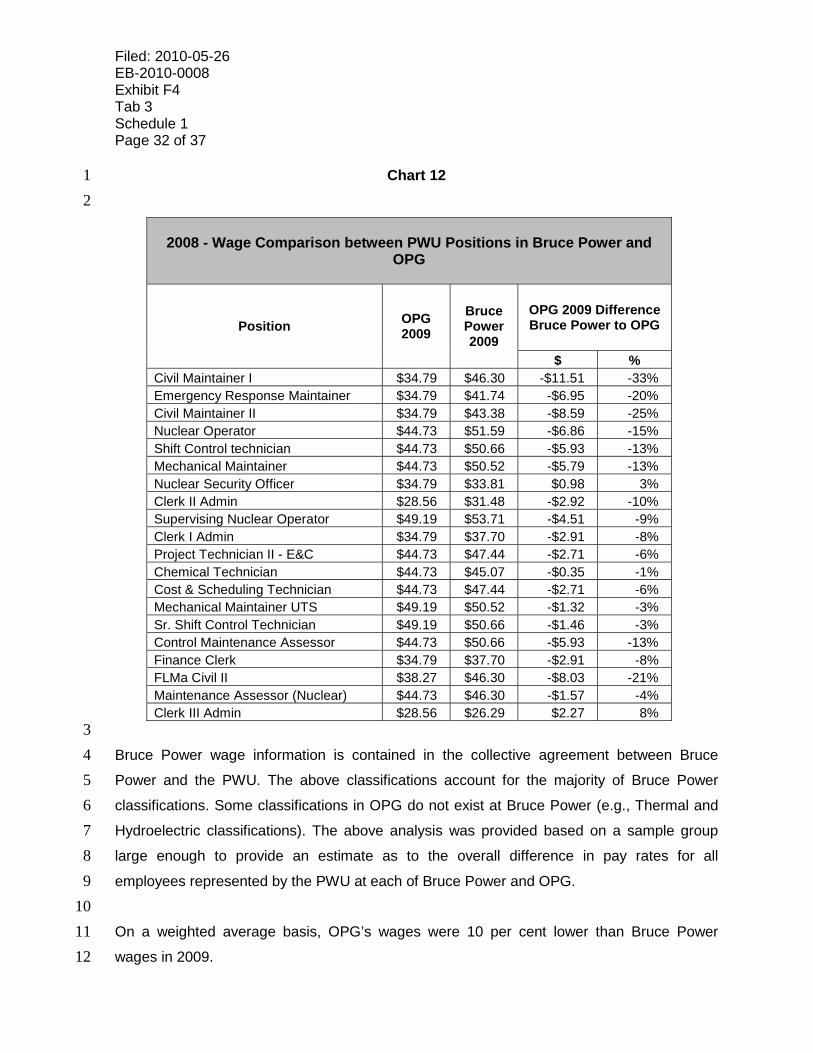
4 OPG also tracks the differences between its unions and other employers as much as 5 possible. The primary competitor for nuclear jobs represented by the PWU is Bruce Power 6 LP. A wage comparison, conducted following the last round of negotiations between the 7 PWU and Bruce Power LP is shown in Chart 12. Overall OPG wages are generally lower 8 than those at Bruce Power LP. 9
10
Filed: 2010-05-26 EB-2010-0008 Exhibit F4 Tab 3 Schedule 1 Page 32 of 37
Chart 12 1 2
2008 - Wage Comparison between PWU Positions in Bruce Power and OPG
Position OPG 2009
Bruce Power 2009
OPG 2009 Difference Bruce Power to OPG
$ % Civil Maintainer I $34.79 $46.30 -$11.51 -33% Emergency Response Maintainer $34.79 $41.74 -$6.95 -20% Civil Maintainer II $34.79 $43.38 -$8.59 -25% Nuclear Operator $44.73 $51.59 -$6.86 -15% Shift Control technician $44.73 $50.66 -$5.93 -13% Mechanical Maintainer $44.73 $50.52 -$5.79 -13% Nuclear Security Officer $34.79 $33.81 $0.98 3% Clerk II Admin $28.56 $31.48 -$2.92 -10% Supervising Nuclear Operator $49.19 $53.71 -$4.51 -9% Clerk I Admin $34.79 $37.70 -$2.91 -8% Project Technician II - E&C $44.73 $47.44 -$2.71 -6% Chemical Technician $44.73 $45.07 -$0.35 -1% Cost & Scheduling Technician $44.73 $47.44 -$2.71 -6% Mechanical Maintainer UTS $49.19 $50.52 -$1.32 -3% Sr. Shift Control Technician $49.19 $50.66 -$1.46 -3% Control Maintenance Assessor $44.73 $50.66 -$5.93 -13% Finance Clerk $34.79 $37.70 -$2.91 -8% FLMa Civil II $38.27 $46.30 -$8.03 -21% Maintenance Assessor (Nuclear) $44.73 $46.30 -$1.57 -4% Clerk III Admin $28.56 $26.29 $2.27 8%
3 Bruce Power wage information is contained in the collective agreement between Bruce 4 Power and the PWU. The above classifications account for the majority of Bruce Power 5 classifications. Some classifications in OPG do not exist at Bruce Power (e.g., Thermal and 6 Hydroelectric classifications). The above analysis was provided based on a sample group 7 large enough to provide an estimate as to the overall difference in pay rates for all 8 employees represented by the PWU at each of Bruce Power and OPG. 9 10 On a weighted average basis, OPG’s wages were 10 per cent lower than Bruce Power 11 wages in 2009. 12
Filed: 2010-05-26 EB-2010-0008
Exhibit F4 Tab 3
Schedule 1 Page 33 of 37
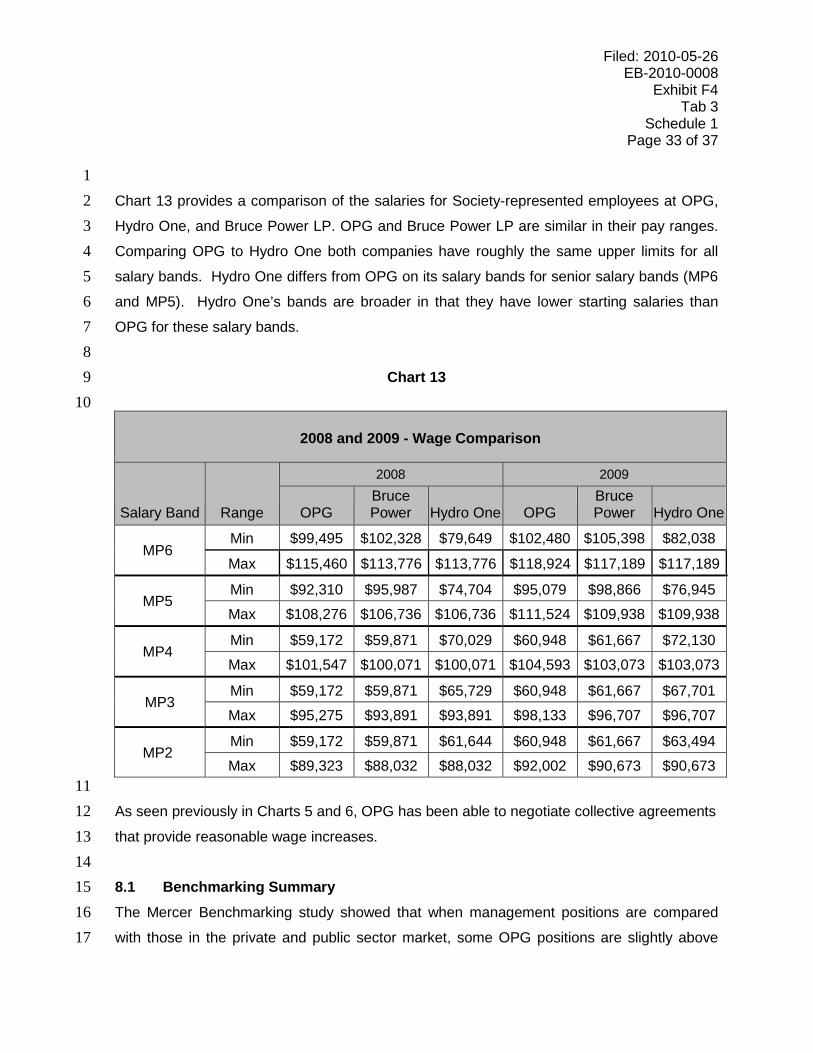
1 Chart 13 provides a comparison of the salaries for Society-represented employees at OPG, 2 Hydro One, and Bruce Power LP. OPG and Bruce Power LP are similar in their pay ranges. 3 Comparing OPG to Hydro One both companies have roughly the same upper limits for all 4 salary bands. Hydro One differs from OPG on its salary bands for senior salary bands (MP6 5 and MP5). Hydro One’s bands are broader in that they have lower starting salaries than 6 OPG for these salary bands. 7 8
Chart 13 9 10
2008 and 2009 - Wage Comparison
Salary Band Range
2008 2009
OPG Bruce Power Hydro One OPG
Bruce Power Hydro One
MP6 Min $99,495 $102,328 $79,649 $102,480 $105,398 $82,038 Max $115,460 $113,776 $113,776 $118,924 $117,189 $117,189
MP5 Min $92,310 $95,987 $74,704 $95,079 $98,866 $76,945 Max $108,276 $106,736 $106,736 $111,524 $109,938 $109,938
MP4 Min $59,172 $59,871 $70,029 $60,948 $61,667 $72,130 Max $101,547 $100,071 $100,071 $104,593 $103,073 $103,073
MP3 Min $59,172 $59,871 $65,729 $60,948 $61,667 $67,701 Max $95,275 $93,891 $93,891 $98,133 $96,707 $96,707
MP2 Min $59,172 $59,871 $61,644 $60,948 $61,667 $63,494 Max $89,323 $88,032 $88,032 $92,002 $90,673 $90,673
11 As seen previously in Charts 5 and 6, OPG has been able to negotiate collective agreements 12 that provide reasonable wage increases. 13 14 8.1 Benchmarking Summary 15 The Mercer Benchmarking study showed that when management positions are compared 16 with those in the private and public sector market, some OPG positions are slightly above 17

Filed: 2010-05-26 EB-2010-0008 Exhibit F4 Tab 3 Schedule 1 Page 34 of 37
market and some are at or below market. The recent comparisons have used the 50th 1 percentile as the market comparison. 2 3 When comparing OPG positions with those in Bruce Power, the Bruce Power PWU-4 represented positions are paid significantly more than similar positions within OPG, while 5 OPG Society-represented positions are paid similarly to Bruce Power and Hydro One. 6
7

Filed: 2010-05-26 EB-2010-0008
Exhibit F4 Tab 3
Schedule 1 Page 35 of 37
LIST OF ATTACHMENTS 1
2
Attachment 1: Figure 1 Summary of the Mercer Results for Total Remuneration 3 Comparison Market Position for OPG 4
5 Figure 2 Towers Perrin Market Comparator Group 6
Filed: 2010-05-26 EB-2010-0008 Exhibit F4 Tab 3 Schedule 1 Page 36 of 37
ATTACHMENT 1 1 2
Figure 1 3 Summary of the Mercer Results for Total Remuneration Comparison Market Position for OPG 4
5 2009 Direct Compensation 2009 Non-Cash Compensation 2009 Total
Base Salary (1) Annual Incentive (2) Total Cash Total Cash Long-Term Incentive (4) Total Direct Total Direct Perquisites (6) PowerFlex Pension Total Total
BandData
SourceMidpoint Actual
Average(% of Base) ($ Value)
Compensation (3)
Compensation Position to
Market(% of Base) ($ Value)
Compensation (5) Compensation Position to Market Car
AllowanceClub
MembershipFinancial
CounselingAnnual Medical
Credits (8) (9) Remuneration (11) Remuneration Position to Market
OPG $720,000 $800,000 100% $800,000 $1,600,000 --- --- $1,600,000 $24,000 --- --- --- $33,662 $53,600 $158,197 $269,459 $1,869,459
Market $805,350 75% $604,013 $1,409,363 142% $1,143,597 $2,552,960 $24,000 $7,000 $4,000 $1,200 $30,431 --- $84,249 $150,880 $2,703,840
OPG $390,000 $475,000 45% $213,750 $688,750 --- --- $688,750 $30,000 --- --- --- $20,042 $53,268 $52,390 $155,700 $844,450
Market $425,390 32% $136,125 $561,515 103% $438,152 $999,667 $18,000 $3,500 $3,500 $1,200 $18,813 --- $43,348 $88,361 $1,088,028
OPG $330,000 $421,667 45% $189,750 $611,417 --- --- $611,417 $30,000 --- --- --- $17,565 $36,108 $41,864 $125,537 $736,954
Market $378,928 46% $174,307 $553,235 75% $284,196 $837,431 $12,000 $3,500 $3,500 $1,200 $15,136 --- $30,764 $66,100 $903,531
OPG $260,000 $330,890 25% $82,723 $413,613 --- --- $413,613 $20,000 --- --- --- $14,676 $33,338 $23,292 $91,306 $504,919
Market $251,930 29% $73,060 $324,990 56% $141,081 $466,071 $12,000 $3,500 $3,500 $1,200 $12,468 --- $23,787 $56,455 $522,526
OPG $200,000 $215,789 25% $53,947 $269,736 --- --- $269,736 $12,000 --- --- --- $12,200 $16,242 $15,800 $56,242 $325,978
Market $212,695 30% $63,809 $276,504 45% $95,713 $372,217 $9,000 $3,500 $2,000 $1,200 $10,856 --- $19,093 $45,649 $417,866
OPG $150,000 $172,745 20% $34,549 $207,294 --- --- $207,294 --- --- --- --- $10,136 $13,321 $10,804 $34,261 $241,555
Market $157,973 21% $33,174 $191,147 20% $31,595 $222,742 $9,000 $3,500 $2,000 $1,200 $8,832 --- $13,824 $38,356 $261,098
OPG $130,000 $135,577 15% $20,337 $155,914 --- --- $155,914 --- --- --- --- $9,311 $10,757 $8,963 $29,031 $184,945
Market $140,420 17% $23,871 $164,291 19% $26,680 $190,971 $9,000 $3,500 $2,000 $1,200 $8,250 --- $12,634 $36,584 $227,555
OPG $110,000 $119,061 15% $17,859 $136,920 --- --- $136,920 --- --- --- --- $8,485 $8,889 $7,574 $24,948 $161,868
Market $103,250 12% $12,390 $115,640 7% $7,228 $122,868 --- --- --- --- $6,839 --- $8,670 $15,509 $138,377
OPG $85,000 $81,774 10% $8,177 $89,951 --- --- $89,951 --- --- --- --- $7,453 $4,375 $5,877 $17,705 $107,656
Market $90,860 6% $5,452 $96,312 7% $6,360 $102,672 --- --- --- --- $6,383 --- $7,285 $13,668 $116,340
OPG $70,000 $64,784 8% $5,183 $69,967 --- --- $69,967 --- --- --- --- $6,834 $3,728 $4,655 $15,217 $85,184
Market $73,308 5% $3,665 $76,973 5% $3,665 $80,638 --- --- --- --- $5,666 --- $5,490 $11,156 $91,794
OPG $55,000 $61,923 8% $4,954 $66,877 --- --- $66,877 --- --- --- --- $6,215 $3,544 $3,394 $13,153 $80,030
Market $65,048 10% $6,505 $71,553 6% $3,903 $75,456 --- --- --- --- $5,378 --- $4,849 $10,227 $85,683
OPG $50,000 $51,586 8% $4,127 $55,713 --- --- $55,713 --- --- --- --- $6,009 $2,823 $2,988 $11,820 $67,533
Market $53,690 4% $2,148 $55,838 4% $2,148 $57,986 --- --- --- --- $5,002 --- $3,784 $8,786 $66,772Notes: (1) For OPG, Base Salary Midpoint is the salary midpoint for each band. Actual Average Salary represents the average salary of positions matched for each band. All other OPG compensation components are derived from the Actual Average value, where applicable. For market data, Base Salary represents the average salary of position matches at the 50th percentile unless otherwise specified in the Benchmark Jobs table. (2) Represents target annual incentive for OPG and for Bands A-L market data. Value calculated as a % of Base Salary. (3) Total Cash Compensation equals Base Salary plus Annual Incentive. (4) OPG does not currently have a Long-Term Incentive Plan. For market data, value is calculated as a % of Base Salary. (5) Total Direct Compensation equals Total Cash Compensation plus Long-Term Incentive. (6) Perquisite market data figures are based on previous analysis, as summarized in Mercer letter to Tony Marr, "Industry Perquisite Information - Additional Details", dated December 21, 1999. This data was adjusted to reflect current markets levels. (7) Benefits include value of Life, Accident, Disability, Health and Dental Benefits paid by the company. Values for LTD, Health and Dental include inflationary/utilization adjustments over the prior year's values for costing changes seen in today's market. Benefit value is based on the Heritage program. Figures reflect relative values of the benefit programs and not true costs. (8) For OPG, PowerFlex Credits are as provided by OPG. This benefit was discontinued in 2001. Not all employees are eligible. (9) For Pension, values for Bands A-H are based on ESPS plan and values for Bands I-L are based on SPS plan. For market data, pension amounts are based on base salary plus annual incentive targets for bands A-L.
Benefits Pre '01 (7)
Total Non-Cash Compensation (10)
Total Non-Cash Compensation
Position to Market
69%
B 123% 69% 176% 78%
A 114% 63% 179%
82%
D 127% 89% 162% 97%
C 111% 73% 190%
78%
F 108% 93% 89% 93%
E 98% 72% 123%
81%
H 118% 111% 161% 117%
G 95% 82% 79%
93%
J 91% 87% 136% 93%
I 93% 88% 130%
93%
L 100% 96% 135% 101%
K 93% 89% 129%
Filed: 2010-05-26 EB-2010-0008
Exhibit F4 Tab 3
Schedule 1 Page 37 of 37
ATTACHMENT 1 1
2 Figure 2 3
Towers Perrin Powers Survey Participant Listing 4 5
Towers Perrin Power Services Survey Participants GOVERNMENT-OWNED (N=14) INVESTOR-OWNED (N=12) Atomic Energy of Canada Ltd. AltaLink Management Ltd. British Columbia Hydro and Power Authority ATCO Electric Ltd. British Columbia Transmission Corporation ATCO Power Ltd. City of Medicine Hat (Hydro Division) Bruce PowerENMAX Corporation FortisAlberta Inc. EPCOR Utilities Inc. Nexen Inc.Hydro One Nova Scotia Power Inc. Hydro-Québec Siemens Power GenerationManitoba Hydro-Electric Sithe GlobalNew Brunswick Power Holding Corporation TransAlta Corporation
Newfoundland & Labrador Hydro Electric CorporationTransCanada Pipelines Limited
Ontario Power Generation Inc. Whitecourt Power Saskatchewan Power Corporation Toronto Hydro Corporation
6