Embed Size (px)
Citation preview

Compensation System in Japan, United
States and European Countries
Chen Yuping
Institute for International Labor Studies Ministry of Labor and Social Security, P.R.China
2003 – 2004

With the development of market economy, in China the problem for compensation
system becomes an important issue that have to be dealt with. While a great progress
has been achieved in recent years, for instance, collective bargaining system has been
introduced initially, we are still facing many challenges. Major tasks include setting up
a sound payment distribution mechanism, which is full of motivation. The purpose of
this report is to analyze the compensation system in Japan and other developed
countries, and then absorb useful experiences.
1. Composition of compensation (1)Compensation structure in Japan
Compensation structure refers to a series of payment items that composes the total
compensation paid to an employee. Normally, compensation consists of wages, bonus,
legal welfare and non-legal welfare as shown in figure 1.
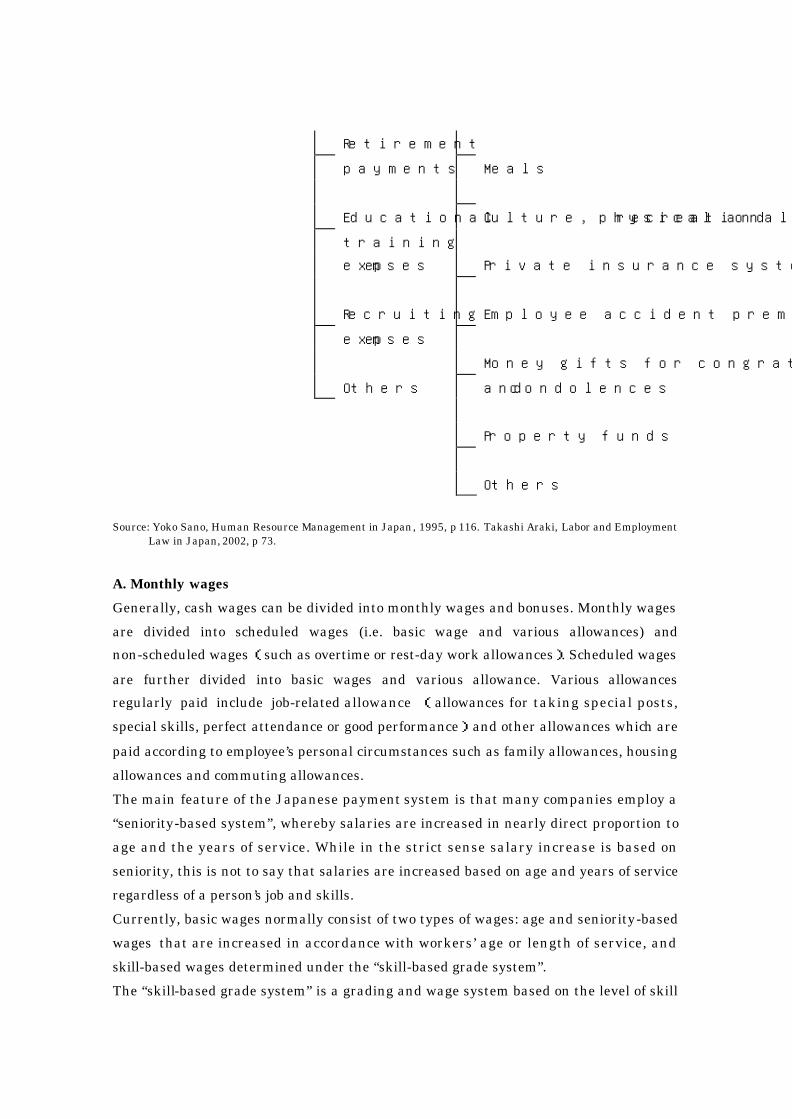
Figure1. Composition of labor costs
Non-scheduled
wages
Monthly
wages
Various
allowances
Cash wage Scheduled wages
Labor cost Annual bonus Basic
wages
Health insurance
Labor cost Legal welfare
Besides expenses Employee pension
Cash
Wages Unemployment insurance
Others
Cost of non-
legal welfare Housing
expenses
Health insurance
Retirement
payments Meals
Educational Culture, physical and recreational
training
expenses Private insurance systems
Recruiting Employee accident premiums
expenses
Money gifts for congratulations
Others and condolences
Property funds
Others
Source: Yoko Sano, Human Resource Management in Japan, 1995, p 116. Takashi Araki, Labor and Employment
Law in Japan, 2002, p 73.
A. Monthly wages
Generally, cash wages can be divided into monthly wages and bonuses. Monthly wages
are divided into scheduled wages (i.e. basic wage and various allowances) and
non-scheduled wages (such as overtime or rest-day work allowances). Scheduled wages
are further divided into basic wages and various allowance. Various allowances
regularly paid include job-related allowance (allowances for taking special posts,
special skills, perfect attendance or good performance)and other allowances which are
paid according to employee’s personal circumstances such as family allowances, housing
allowances and commuting allowances.
The main feature of the Japanese payment system is that many companies employ a
“seniority-based system”, whereby salaries are increased in nearly direct proportion to
age and the years of service. While in the strict sense salary increase is based on
seniority, this is not to say that salaries are increased based on age and years of service
regardless of a person’s job and skills.
Currently, basic wages normally consist of two types of wages: age and seniority-based
wages that are increased in accordance with workers’ age or length of service, and
skill-based wages determined under the “skill-based grade system”.
The “skill-based grade system” is a grading and wage system based on the level of skill
and competence development. This wage system has been adopted in many Japanese
companies to attempt to coordinate lifetime employment practices with the need to
remunerate workers in accordance with their performance and skills. Under this plan,
there are a certain number of grades (e.g. A-G), which are further divided into
subgrades (A1-A5, B1-B5, etc.). A high school graduate may start at A1, and a
university graduate at B1. Although one can be promoted to a higher subgrade after
certain years of service in a particular subgrade, a worker whose performance is
excellent will be promoted in a shorter period and may sometimes skip subgrades. In
order to move to a higher grade, workers must fulfill certain prerequisites, undergo
evaluation, and complete the required training. Promotion to higher grades or
subgrades is decided on the basis of job-performance evaluations conducted by the
employer as well as the worker’s length of service.
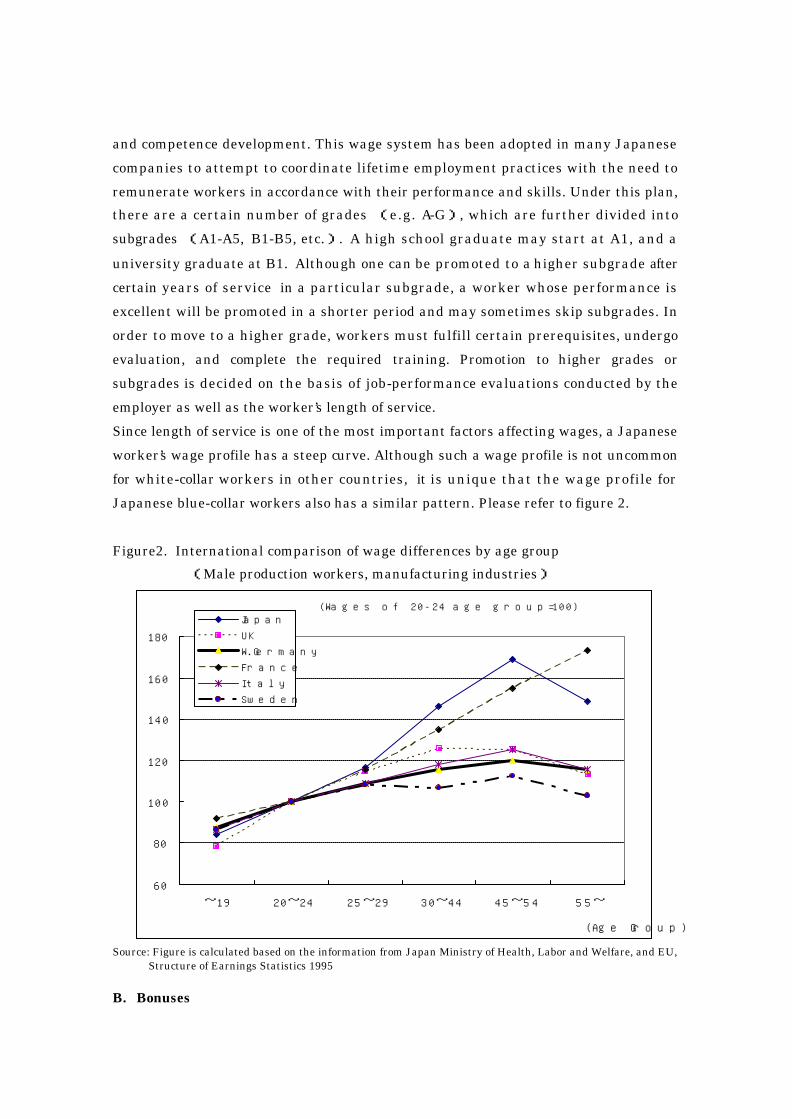
Since length of service is one of the most important factors affecting wages, a Japanese
worker’s wage profile has a steep curve. Although such a wage profile is not uncommon
for white-collar workers in other countries, it is unique that the wage profile for
Japanese blue-collar workers also has a similar pattern. Please refer to figure 2.
Figure2. International comparison of wage differences by age group
(Male production workers, manufacturing industries)
(Wages of 20-24 age group=100)
60
80
100
120
140
160
180
~19 20~24 25~29 30~44 45~54 55~
(Age Group)
Japan
UK
W.Germany
France
Italy
Sweden
Source: Figure is calculated based on the information from Japan Ministry of Health, Labor and Welfare, and EU,
Structure of Earnings Statistics 1995
B. Bonuses
Bonuses, which are typically paid twice a year( in June and December), are one of the
most important features of the Japanese wage practice. They amount to more than 20%
of the annual wages of an average Japanese worker. Just like wages, the amount of the
bonus at unionized companies is determined by the annual collective bargaining
agreements. The decisive factor in the collective bargaining to determine the amount of
bonuses is the company’s economic performance. Almost all Japanese companies pay
bonuses, and certain portion of the bonus is assessed in accordance with the employee’s
evaluation during the period in which it is applied, and even employees receive the
same wage, the amount of their bonuses are generally different.
C. Welfare
According to the Results of Welfare Expense Survey in 2002, conducted by Japan
Business Federation, when a company employs someone, besides salary and bonus, it
pays about 17% of them as additional personnel expenses. The benefit cost (the average
in all industries) per employee in 2001 is 95,883 yen, 2.9% increase from the previous
year. The amount of the benefit cost that is stipulated in laws was 68,482 yen, showing
4.7% increase from the previous year, while the amount of the benefit cost that is not
mandatory was 27,401 yen.
A company’s welfare expenses consist of “legal welfare” and “non-legal welfare”. Legal
welfare mainly includes health insurance, employee pension insurance, nursing care
insurance, unemployment insurance and workman’s compensation insurance for
job-related accidents. In 2001, health insurance premiums are 32.8%, and employee’s
pension insurance premiums are 52.7%, so that those two compose about 85.5% of the
compulsory benefit costs that organizations are paying out for employees. Labor
insurance premium occupies 11.8%, broken down as 8.2% for unemployment insurance
and 3.6% for employee’s compensation insurance.
In recent years, the mandatory benefit cost has shown more increasing tendencies than
the actual increase in the annual salaries. The total annual salary in this survey – the
average amount including bonuses, and allowance – was 562,098 yen, 2.1% increase
from the previous year, while the mandatory benefit cost shows 4.7% increase. The ratio
of the mandatory benefit cost to the total amount of the annual salaries became 12.2%
(11.9% for the previous year ).
Non-legal welfare includes support for housing, medical insurance, gifts of family
celebration and condolence, mutual aid and so on. The non-mandatory benefit cost per
employee for a month is 27,401 yen in 2001, 1.4% decrease from the previous year. This
decrease seems to reflect employers’ efforts to review their benefit systems. The ratio of
this benefit cost to the amount of the annual salary became 4.9%, the lowest since the
start of the survey. While the non-mandatory benefit cost shows a decreasing tendency
in recent years, employers have been struggling to review their system to reallocate the
limited amount of the benefit cost.
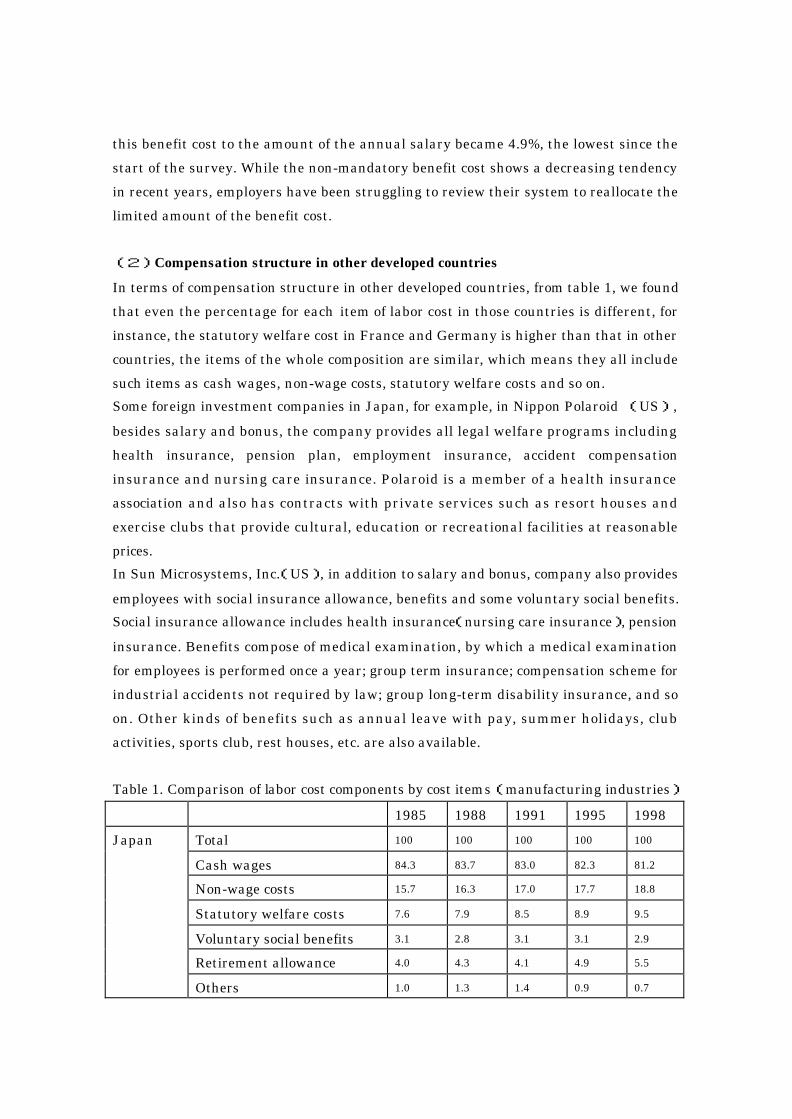
(2)Compensation structure in other developed countries
In terms of compensation structure in other developed countries, from table 1, we found
that even the percentage for each item of labor cost in those countries is different, for
instance, the statutory welfare cost in France and Germany is higher than that in other
countries, the items of the whole composition are similar, which means they all include
such items as cash wages, non-wage costs, statutory welfare costs and so on.
Some foreign investment companies in Japan, for example, in Nippon Polaroid (US),
besides salary and bonus, the company provides all legal welfare programs including
health insurance, pension plan, employment insurance, accident compensation
insurance and nursing care insurance. Polaroid is a member of a health insurance
association and also has contracts with private services such as resort houses and
exercise clubs that provide cultural, education or recreational facilities at reasonable
prices.
In Sun Microsystems, Inc.(US), in addition to salary and bonus, company also provides
employees with social insurance allowance, benefits and some voluntary social benefits.
Social insurance allowance includes health insurance(nursing care insurance), pension
insurance. Benefits compose of medical examination, by which a medical examination
for employees is performed once a year; group term insurance; compensation scheme for
industrial accidents not required by law; group long-term disability insurance, and so
on. Other kinds of benefits such as annual leave with pay, summer holidays, club
activities, sports club, rest houses, etc. are also available.
Table 1. Comparison of labor cost components by cost items (manufacturing industries)
1985 1988 1991 1995 1998
Total 100 100 100 100 100
Cash wages 84.3 83.7 83.0 82.3 81.2
Non-wage costs 15.7 16.3 17.0 17.7 18.8
Statutory welfare costs 7.6 7.9 8.5 8.9 9.5
Voluntary social benefits 3.1 2.8 3.1 3.1 2.9
Retirement allowance 4.0 4.3 4.1 4.9 5.5
Japan
Others 1.0 1.3 1.4 0.9 0.7
Total 100 100 100 100 100
Cash wages 82.6 80.7 71.8 71.6 81.9
Non-wage costs 17.4 19.4 28.2 28.4 18.1
Statutory welfare costs 6.6 8.5 9.1 8.5 7.8
Voluntary social benefits 5.7 10.6 16.1 15.8
Retirement allowance 4.9 -- 2.9 4.0 10.2
United
States
Others -- 0.3 0.1 0.1
Total 100 100 100 100 100
Cash wages 82.3 81.6 86.0 85.1 83.8
Non-wage costs 17.7 18.4 14.0 15.0 16.2
Statutory welfare costs 8.9 9.4 7.3 7.5 8.5
Voluntary social benefits 6.0 6.3 4.2 4.7 5.0
Retirement allowance 0.0
United
Kingdom
Others 2.7 2.7 2.5 2.9 2.8
Total 100 100 100 100 100
Cash wages 70.0 69.9 69.0 68.1 65.2
Non-wage costs 30.0 30.1 31.0 32.0 35.0
Statutory welfare costs 19.0 18.9 19.2 21.8 21.8
Voluntary social benefits 2.8 3.1 4.5 7.0 7.4
Retirement allowance 3.7 3.7 4.0 1.8
France
Others 4.5 4.4 3.5 3.3 4.2
Total 100 100 100 100 100
Cash wages 78.5 78.2 77.0 78.8 73.8
Non-wage costs 21.5 21.9 23.0 21.6 26.3
Statutory welfare costs 16.2 16.1 16.5 15.3 15.9
Voluntary social benefits 0.2 0.2 0.1 3.1 0.6
Germany
Retirement allowance 3.2 3.4 4.2 3.1 0.6
Others 2.0 2.2 2.2 3.2 2.2
Source: Japanese Working Life Profile, 2003 – Labor Statistics, p 57. Eurostat, Labor Cost 1992. Japan: Ministry of Health, Labor and Welfare, General survey on Wages and
Working Hours System. United States: Bureau of Labor Statistics 2000: trial calculation, Department of Labor.
Notes: (1) In the U.K., Germany, and France, this includes allowances paid in kind. However, in Japan, allowances paid in kind are included under others.
(2) Includes pension and savings, e tc. (3) Training costs, taxes, subsidies, etc.
(4) Derived from March surveys by an index based on 1980. (5) Germany figures for 1988 and earlier are for former West Germany.
2. The amount of compensation for technical staff and middle level
managers (1) The amount of compensation for technical staff and middle level managers in
Japan
In Japan, employees of the same company like, for example, white-collar and blue-collar
worker, are managed under the same system of human resource management,
regardless of job type. In other words, the characteristic of the Japanese wage profile is
the phenomenon called “the white-collarization of blue-collar workers”. The
phenomenon of the white-collar workers’ wage rising with age is observable not only in
Japan, but in Europe and the United States as well. While the situation for blue-collar
workers are different. In other nations, the wages of blue-collar workers rise a little
with age, and these wage increases are invisible after age 30. In Japan, However, even
though the wage profile for blue-collar workers does not rise as sharply as that of
white-collar workers, the two curves are similarly shaped, indicating that wages
increase as worker’s age.
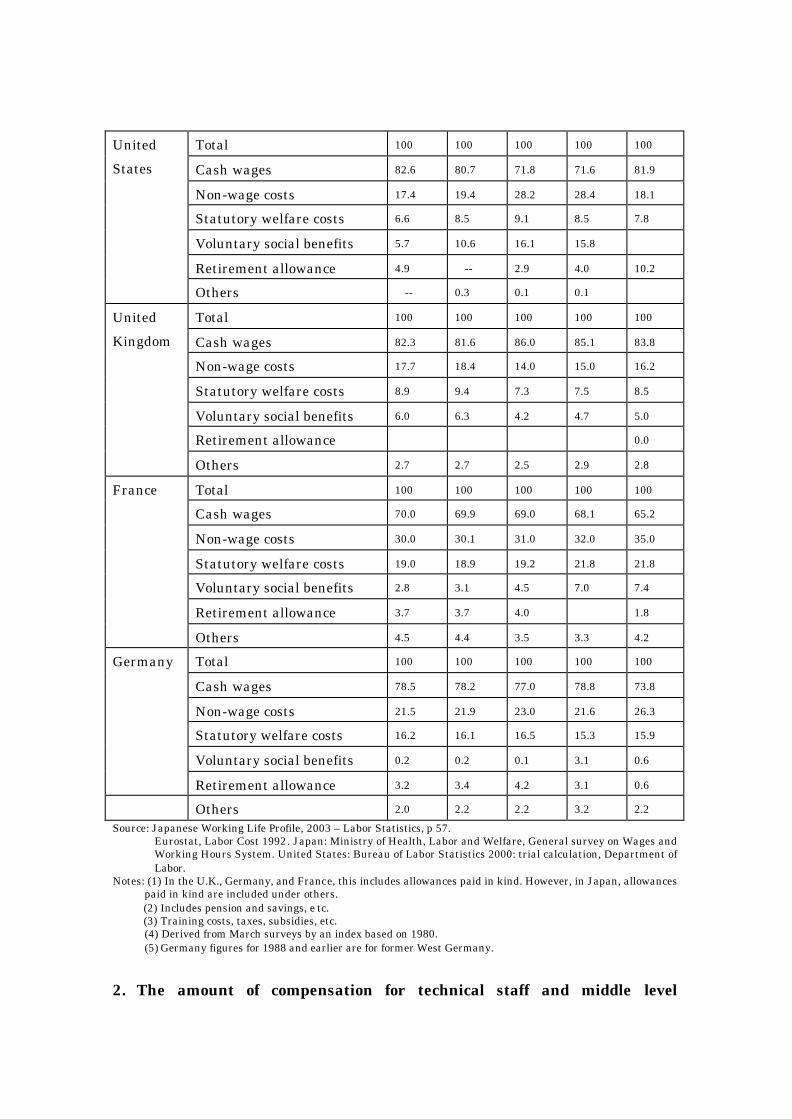
Therefore there are not evident wage differences based on educational background
among white-collar and blue- collar employees. For example, the average starting salary
in all industries in fiscal 2000(monthly salary) for male university graduates was
195,100 yen, while that figure was 154,000 yen for male high school graduates. The
salary for male high school graduates in their fourth year working at the company
would be very close to the starting salary for a male university graduate.1
Table 2. Wage indices by education and age
Graduates of university
(Male)
Graduates of junior
colleges (Male)
Graduates of senior
high schools (Male)
Wages(thousand yen) Wages(thousand yen) Wage(thousand yen)
1975 2001 1975 2001 1975 2001
Total 169.9
177
404.4
186
178.2
196
306.8
155
133.0
145
313.8
159
20-24 95.8
100.0
217.1
100.0
90.7
100
198.1
100
92.4
100
196.8
100
25-29 121.4
127
257.5
119
115.8
128
239.0
121
115.0
125
236.8
120
35-39 203.1 405.6 171.8 338.6 157.8 311.1
1 Ministry of Health, Labor and Welfare: Basic Survey on Wage Structure in Fiscal 2001.
212 187 189 171 171 158
45-49 267.4
279
516.8
238
234.8
259
415.5
210
178.4
193
373.2
190
50-54 285.3
298
569.8
262
252.3
278
441.9
223
190.6
206
392.8
200
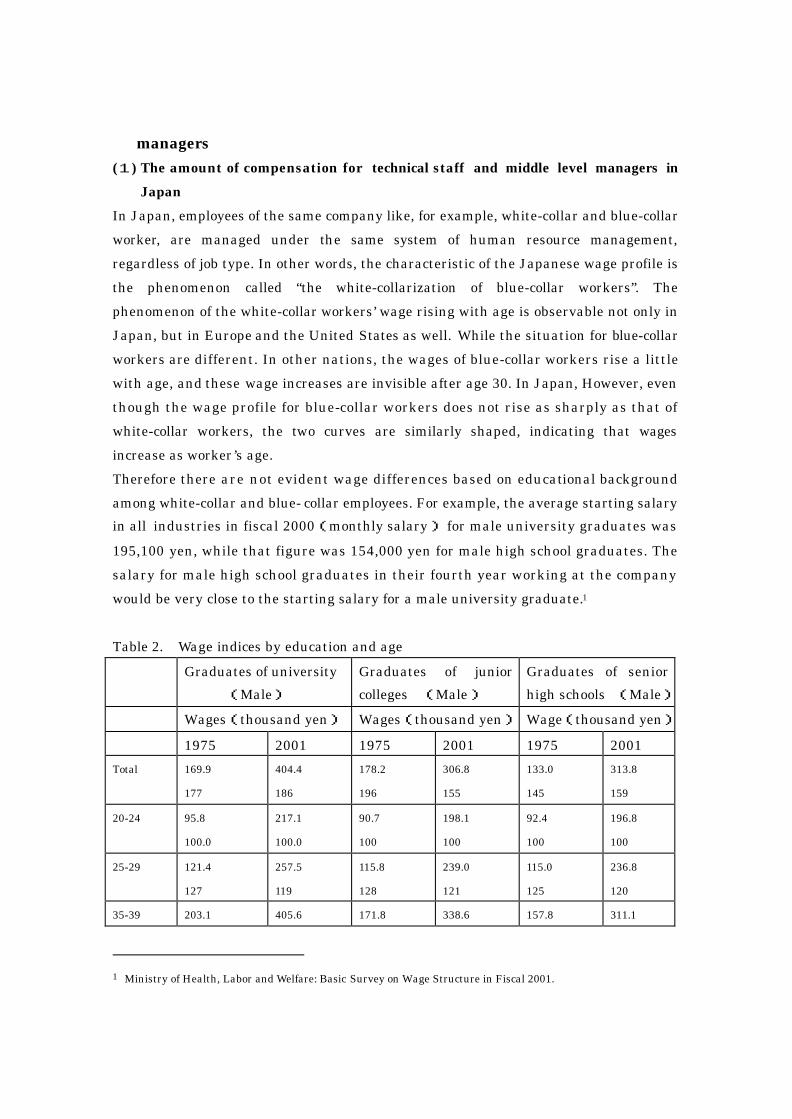
Source: Ministry of Health, Labor and Welfare, Basic Survey on Wage Structure, 2001. Japan
From table 2 we found that by reading rows, which reflect educational background for
same age span, the statistics show little difference. By contrast, when reading columns,
which reflect the different age groups of same educational background, we see evident
gap. It indicates that age is important than educational background in the respect of
wage level determination. The other conclusion drawn from table 2 is that the older the
employees become, the bigger the wage gap between them caused by educational
background. For example, for employees who are in their 45-49, wage differences are
more evident than that in their young age. It is also true in terms of company scale,
which means bigger enterprises bring higher level of wage. Please refer to table 3.
Table 3. Trends in enterprises wages differentials by enterprise size (industry total)
(1,000 or more=100)
1980(Male) 1990(Male) 1997(Male) 2001(Male)
Contractual
Cash
earnings
Scheduled
Cash
earnings
Contractual
Cash
earnings
Scheduled
Cash
earnings
Contractual
Cash
earnings
Scheduled
Cash
earnings
Contractual
Cash
earnings
Scheduled
Cash
earnings
1,000
or more
100 100 100 100 100 100 100 100
100-999 83.5 86.3 82.6 84.6 83.0 83.8 82.0 82.8
10-99 76.4 81.2 75.0 79.3 75.4 77.9 73.0 75.2
Source: Ministry of Health, Labor and Welfare, Basic Survey on Wage Structure. Note: (1) For 1996 and earlier, differential of scheduled cash earnings as of June for each year.
(2) From 1980 and thereafter, results are for private enterprises.
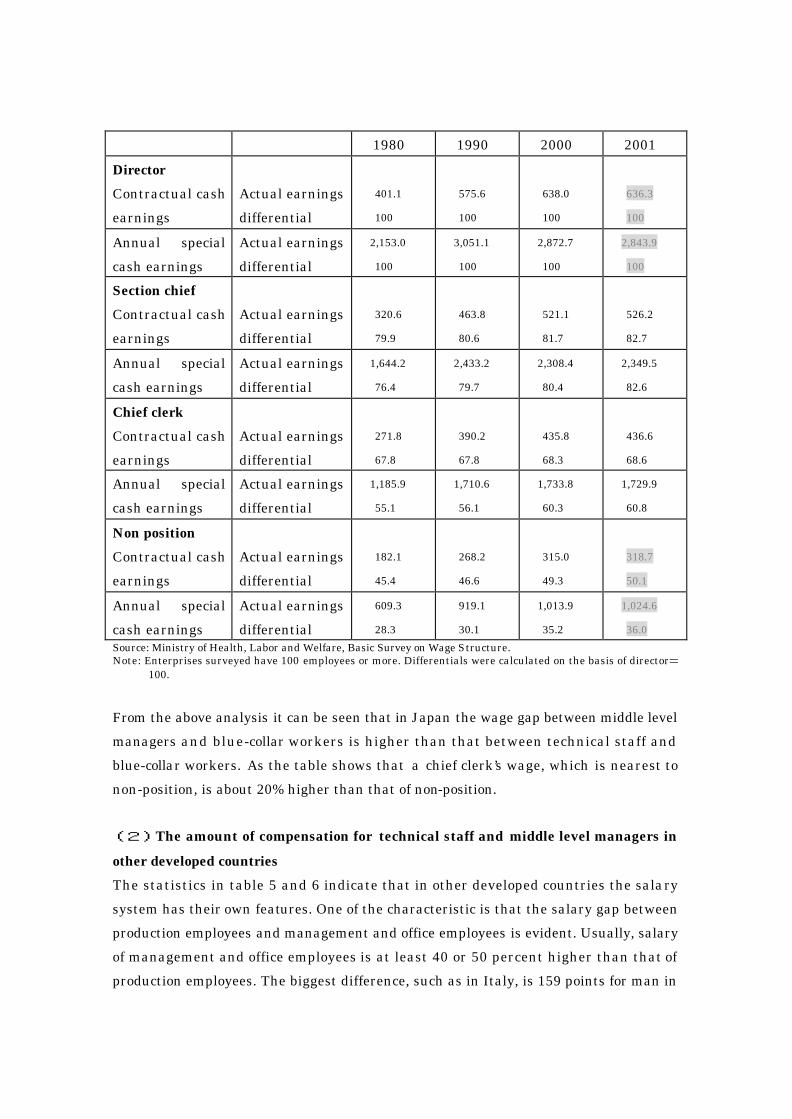
Compare with education background, class of position is more important in wage level
determination. From table 4 it can be seen that for each class, from director to
non-position, the actual earnings differential is between 20%-30%, and the amount of
actual earnings of director is about two times higher than that of non-position.
Table 4. Wage differentials by class of position (1000 yen)
1980 1990 2000 2001
Director
Contractual cash
earnings
Actual earnings
differential
401.1
100
575.6
100
638.0
100
636.3
100
Annual special
cash earnings
Actual earnings
differential
2,153.0
100
3,051.1
100
2,872.7
100
2,843.9
100
Section chief
Contractual cash
earnings
Actual earnings
differential
320.6
79.9
463.8
80.6
521.1
81.7
526.2
82.7
Annual special
cash earnings
Actual earnings
differential
1,644.2
76.4
2,433.2
79.7
2,308.4
80.4
2,349.5
82.6
Chief clerk
Contractual cash
earnings
Actual earnings
differential
271.8
67.8
390.2
67.8
435.8
68.3
436.6
68.6
Annual special
cash earnings
Actual earnings
differential
1,185.9
55.1
1,710.6
56.1
1,733.8
60.3
1,729.9
60.8
Non position
Contractual cash
earnings
Actual earnings
differential
182.1
45.4
268.2
46.6
315.0
49.3
318.7
50.1
Annual special
cash earnings
Actual earnings
differential
609.3
28.3
919.1
30.1
1,013.9
35.2
1,024.6
36.0
Source: Ministry of Health, Labor and Welfare, Basic Survey on Wage Structure. Note: Enterprises surveyed have 100 employees or more. Differentials were calculated on the basis of director=
100.
From the above analysis it can be seen that in Japan the wage gap between middle level
managers and blue-collar workers is higher than that between technical staff and
blue-collar workers. As the table shows that a chief clerk’s wage, which is nearest to
non-position, is about 20% higher than that of non-position.
(2)The amount of compensation for technical staff and middle level managers in
other developed countries
The statistics in table 5 and 6 indicate that in other developed countries the salary
system has their own features. One of the characteristic is that the salary gap between
production employees and management and office employees is evident. Usually, salary
of management and office employees is at least 40 or 50 percent higher than that of
production employees. The biggest difference, such as in Italy, is 159 points for man in
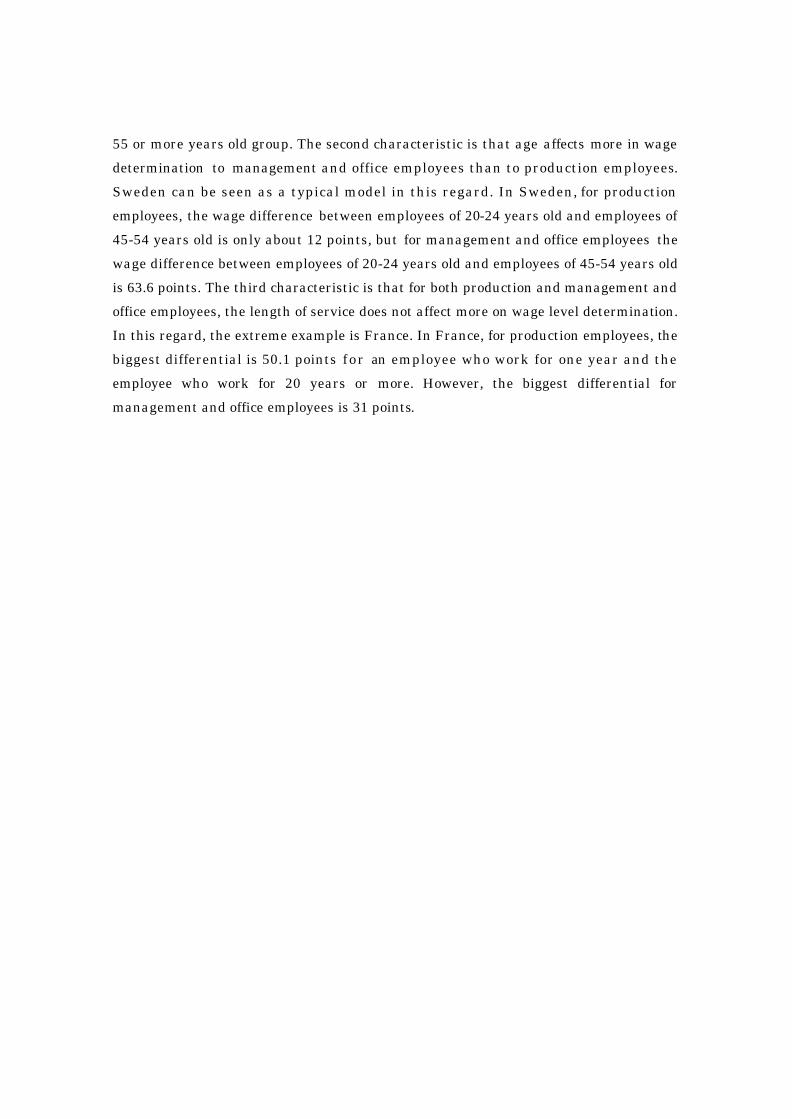
55 or more years old group. The second characteristic is that age affects more in wage
determination to management and office employees than to production employees.
Sweden can be seen as a typical model in this regard. In Sweden, for production
employees, the wage difference between employees of 20-24 years old and employees of
45-54 years old is only about 12 points, but for management and office employees the
wage difference between employees of 20-24 years old and employees of 45-54 years old
is 63.6 points. The third characteristic is that for both production and management and
office employees, the length of service does not affect more on wage level determination.
In this regard, the extreme example is France. In France, for production employees, the
biggest differential is 50.1 points for an employee who work for one year and the
employee who work for 20 years or more. However, the biggest differential for
management and office employees is 31 points.
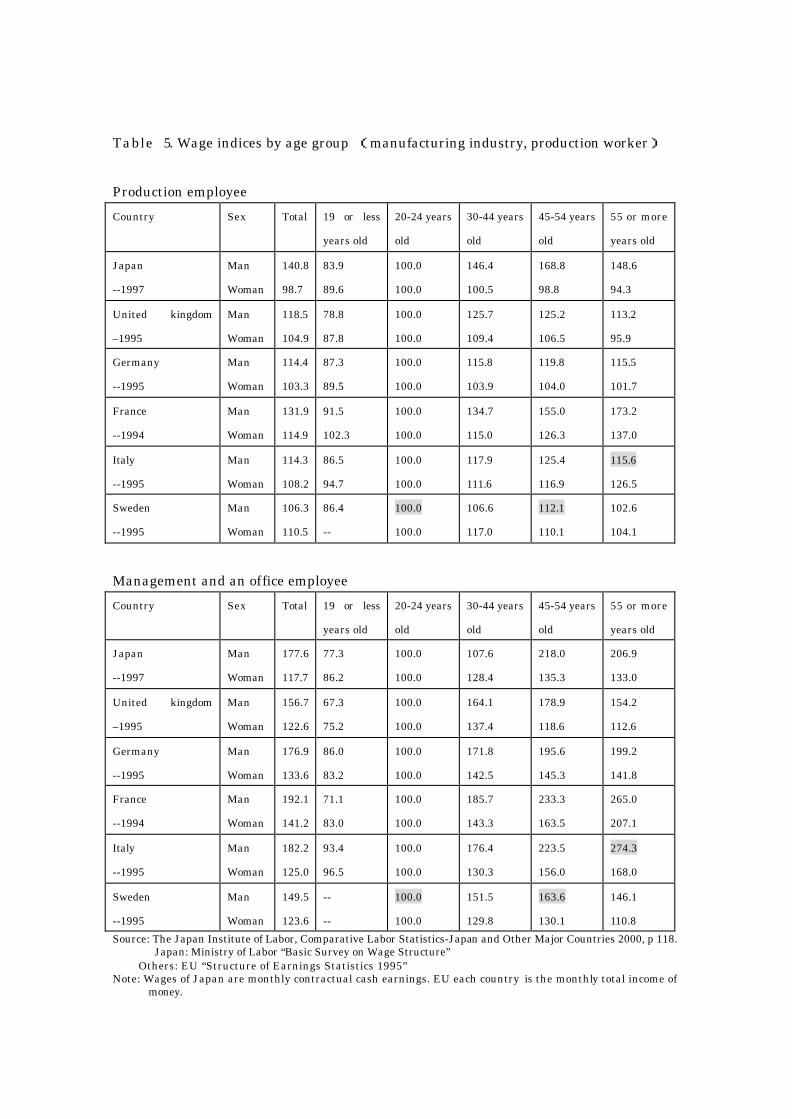
Table 5. Wage indices by age group (manufacturing industry, production worker)
Production employee
Country Sex Total 19 or less
years old
20-24 years
old
30-44 years
old
45-54 years
old
55 or more
years old
Japan
--1997
Man
Woman
140.8
98.7
83.9
89.6
100.0
100.0
146.4
100.5
168.8
98.8
148.6
94.3
United kingdom
–1995
Man
Woman
118.5
104.9
78.8
87.8
100.0
100.0
125.7
109.4
125.2
106.5
113.2
95.9
Germany
--1995
Man
Woman
114.4
103.3
87.3
89.5
100.0
100.0
115.8
103.9
119.8
104.0
115.5
101.7
France
--1994
Man
Woman
131.9
114.9
91.5
102.3
100.0
100.0
134.7
115.0
155.0
126.3
173.2
137.0
Italy
--1995
Man
Woman
114.3
108.2
86.5
94.7
100.0
100.0
117.9
111.6
125.4
116.9
115.6
126.5
Sweden
--1995
Man
Woman
106.3
110.5
86.4
--
100.0
100.0
106.6
117.0
112.1
110.1
102.6
104.1
Management and an office employee
Country Sex Total 19 or less
years old
20-24 years
old
30-44 years
old
45-54 years
old
55 or more
years old
Japan
--1997
Man
Woman
177.6
117.7
77.3
86.2
100.0
100.0
107.6
128.4
218.0
135.3
206.9
133.0
United kingdom
–1995
Man
Woman
156.7
122.6
67.3
75.2
100.0
100.0
164.1
137.4
178.9
118.6
154.2
112.6
Germany
--1995
Man
Woman
176.9
133.6
86.0
83.2
100.0
100.0
171.8
142.5
195.6
145.3
199.2
141.8
France
--1994
Man
Woman
192.1
141.2
71.1
83.0
100.0
100.0
185.7
143.3
233.3
163.5
265.0
207.1
Italy
--1995
Man
Woman
182.2
125.0
93.4
96.5
100.0
100.0
176.4
130.3
223.5
156.0
274.3
168.0
Sweden
--1995
Man
Woman
149.5
123.6
--
--
100.0
100.0
151.5
129.8
163.6
130.1
146.1
110.8
Source: The Japan Institute of Labor, Comparative Labor Statistics-Japan and Other Major Countries 2000, p 118. Japan: Ministry of Labor “Basic Survey on Wage Structure” Others: EU “Structure of Earnings Statistics 1995” Note: Wages of Japan are monthly contractual cash earnings. EU each country is the monthly total income of
money.
Table 6. Wage indices by the length of service(manufacturing industry, production
worker)
Production employee
Country Sex 0-1 years
(0-2years)
2-4 years
(3-4 years)
5-9 years 10-19 years 20 years
or more
Japan
--1997
Man
Woman
100.0
100.0
106.5
105.3
117.0
110.1
137.8
115.4
172.0
138.6
United kingdom
–1995
Man
Woman
100.0
100.0
107.7
106.7
112.9
110.8
118.0
112.8
119.6
105.0
Germany
--1995
Man
Woman
100.0
100.0
105.8
103.6
111.7
109.9
119.8
114.5
123.9
116.3
France
--1994
Man
Woman
100.0
100.0
116.1
104.9
122.9
108.9
133.5
119.2
150.1
123.1
Italy
--1995
Man
Woman
100.0
100.0
104.2
102.9
110.1
103.7
117.1
111.1
122.7
118.5
Sweden
--1995
Man
Woman
100.0
100.0
111.6
106.4
110.6
115.1
109.5
105.9
112.4
109.7
Management and an office employee
Country Sex 0-1 years
(0-2years)
2-4 years
(3-4 years)
5-9 years 10-19 years 20 years
or more
Japan
--1997
Man
Woman
100.0
100.0
105.8
106.2
116.9
114.5
146.4
131.4
194.2
162.6
United kingdom
–1995
Man
Woman
100.0
100.0
107.0
97.8
112.0
101.9
113.5
100.9
101.9
115.1
Germany
--1995
Man
Woman
100.0
100.0
105.9
104.2
111.3
110.7
119.2
123.9
126.9
131.5
France
--1994
Man
Woman
100.0
100.0
110.8
114.4
124.9
119.8
126.1
115.9
131.0
121.7
Italy
--1995
Man
Woman
100.0
100.0
105.7
106.0
110.1
112.0
118.2
121.4
133.6
128.6
Sweden
--1995
Man
Woman
100.0
100.0
110.0
97.6
112.3
96.5
127.5
103.1
112.9
97.0
Source: The Japan Institute of Labor, Comparative Labor Statistics-Japan and Other Major Countries 2000, p 119. Japan: Ministry of Labor “Basic Survey on Wage Structure” Others: EU “Structure of Earnings Statistics 1995” Note: ( )is Japan. Wages of Japan are monthly contractual cash earnings. EU each country is the monthly
total income of money.
3. The mechanism for compensation standards determination (1)The mechanism for compensation standards determination in Japan
In Japanese companies the amounts of pay increases are determined by collective
bargaining, in which some factors, like performance of the company and the increase
rate of consumer prices will be taken into consideration. Since companies in the same
industry or in the same type of business decide pay increase amounts around the same
time through collective bargaining, while differences do occur between industries and
business types, a “public market” has been formed in the same industry and the same
type of business so that there are few occurrences of large differences in salary increase
amounts. For companies without trade unions, the wage negotiation results from the
industries and business types similar to them will be their benchmark. According to the
statistics from the Ministry of Health, Labor and Welfare, the wage hike rate for this
year’s spring labor negotiations is 1.63%. The data was compiled by 189 companies
listed on section 1 of either the Tokyo or the Osaka Stock Exchange, with paid-in capital
of two billion yen or more, with 1000 or more employees, and with labor unions.2
Once the wage increase rate has been set up, the following task is to distribute it among
employees. Salary increases generally take place once a year, which is called “periodic
salary increase”. As mentioned above, in Japan technical staff and blue-collar workers
are managed under the same system of human resource management. Currently, their
basic wages normally consist of two types of wages: age and seniority-based wages that
are increased in accordance with worker’s age or length of service; and skill-based
wages determined under the “skill-based grade system”. Basically, employees in the
same company receive similar salary increases for the first several years of work. Then,
when they have reached the age for rank promotion for their job skills, their skill rank
is determined according to the appraisal by their immediate senior and the results of
rank promotion examinations.
The amount of bonuses is also determined through negotiation between labor and
employers. Bonuses are paid twice a year, in summer and winter. It is possible to adopt
the sliding scale of the amounts and conditions of these bonuses in connection with
performance at the company. The amount of bonus is generally calculated by
multiplying the calculated basic amount(base pay)by the coefficient determined by the
situation at the company(e.g., this is often calculated as × number of month of the
calculated basic amount), and adding the rate of attendance at the company during the
2 www.jil.go.jp/emm/vol.50
period to which the bonus is applied and the evaluation coefficient ( according to the
results of the personnel appraisal).
As for the mechanism of compensation standards determination for middle level
managers, usually they are not covered by collective bargaining, so the rate of salary
increase for them is not determined by negotiation between managers and labor.
However the result of the collective bargaining in their companies could be a benchmark.
The rate of salary increase for them is little bit higher than the result of collective
bargaining, sometimes in the same level. We can also find some characteristics from the
survey conducted by the Japan Institute of Labor in 2002, which covers large
manufacturing companies with employees between 5000–20000 and trading/physical
distribution companies with employees between 1500-10000.
With the heightening of competition due to globalization and predictions of the further
aging of Japanese society, companies have become concerned about the burden imposed
by the high salaries paid to the growing ranks of middle-aged and older employees. To
create a better balance between those employees’ salaries and their productivity, and to
further motivate workers, many companies began to adopt a salary system based on
annual performance for managers. In some companies the broadband-type of salary on
job evaluation(broadband-type job-based pay)has been adopted for the basic pay for
managers(compensation is determined based on job title). For each job, job points are
determined on job value+degree of responsibility. A grade is therefore determined.
Unlike the employees who are not in management positions, there is no concept of
periodic salary increases for managers because of the introduction of the job-based pay
system. In some companies, a division chief or a person in an equivalent receives an
annual salary based on job performance assessment (basic annual salary + annual
salary based on job performance). A department chief or a person in an equivalent
position receives a salary based only on performance. A Section chief or a person in an
equivalent position receives basic salary (40%)and salary based on job performance
(60%)3.
Therefore we may say that in Japan at present, basically, pay system for non-position
employees is based on age+skill rank system. For middle level managers, new
mechanism has been introduced initially, which means that job-based pay(based on
roles )and function-based pay(based on function the company expects employees to
fulfill)are added.(e.g., roles of a department chief are managing staff, making sales
plans, and improving business performance.). In other words the mechanism of salary
3 The Japan Institute of Labor, Reference guide to Japan Human Resource Management-Manufacturing, p 7.
determination for middle level managers is changing gradually, while the portion of
seniority declines the portion of perforce-based increases.
(2)The mechanism for compensation standards determination in foreign-affiliated
companies
The principles of salary system in Hewlett-packard Japan Ltd., (US), expressed below,
are typical for many companies in other developed countries. They are:
l Market Driven:
Salary is determined by market valuation of the job.
l Pay for Performance:
Individuals who achieved higher performance will be paid more than others.
l Fairness:
Treat everyone fairly as much as possible. Therefore, the system is disclosed as
much as possible.4
These principles summarized the ideas that are currently prevalent in many
foreign-affiliated companies. A set of management methods and procedures, such as job
design, market survey, and assessment system are supportive in achieving the above
mentioned goals.
A. Job design
In other developed countries, job-based wage system is widely adopted in many
companies. Under this system, every employee belongs to a specific job level according
to his/her position and salary is determined within the respective salary range based on
individual evaluation.
In United States, blue-collar workers usually receive hourly wages and are paid by
week. The actual wages paid are determined based on the job performance and skills
within the job-based wage range. Companies must pay overtime allowance of 50% over
their normal pay for the time exceeded 40 hours per week. For white-collar workers to
which the system of annual salary applies basically has the same concept of “job-based
salary”. The range of the annual salary amount for the worker engaged in the job is
determined based on the evaluation by each workplace. A worker’s annual achievement
objective is decided through discussion with the worker’s senior, and that worker is
evaluated based on the degree by which the objective has been achieved.
In regarding to job design, actual methods can be different from company to company.
4 The Japan Institute of Labor, The Personnel Management Cases of Foreign-affiliated Companies, 2, p9.
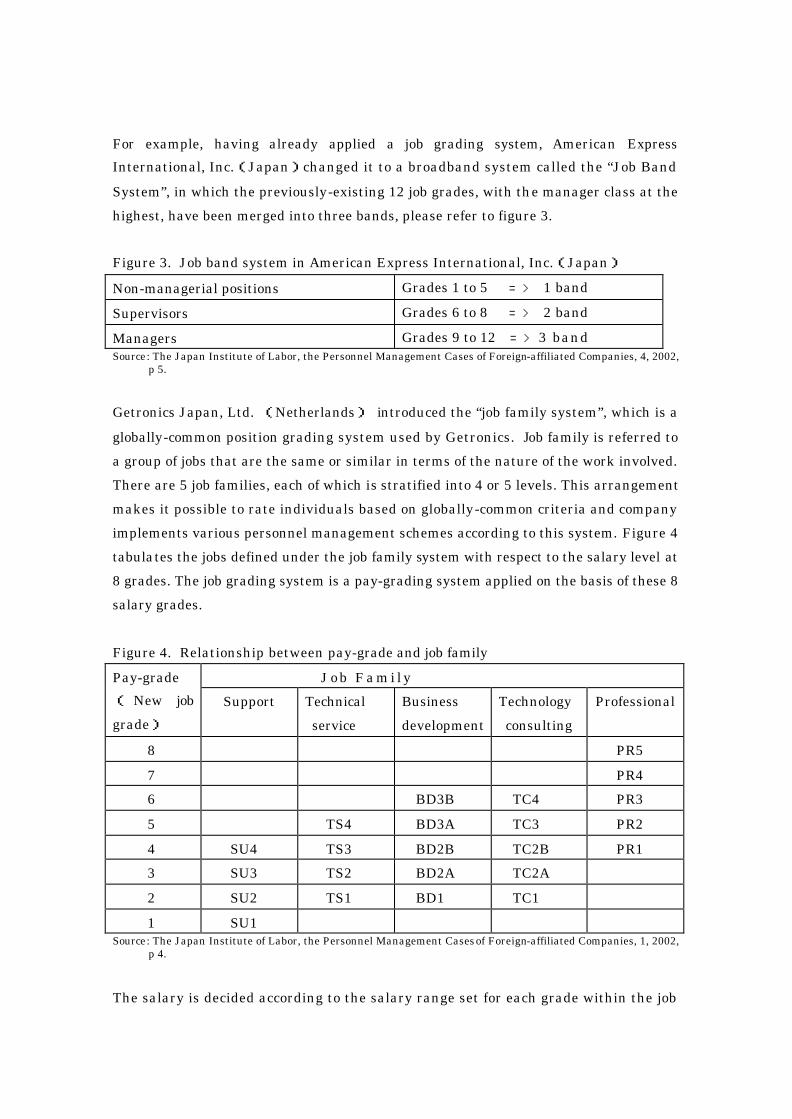
For example, having already applied a job grading system, American Express
International, Inc.(Japan)changed it to a broadband system called the “Job Band
System”, in which the previously-existing 12 job grades, with the manager class at the
highest, have been merged into three bands, please refer to figure 3.
Figure 3. Job band system in American Express International, Inc.(Japan)
Non-managerial positions Grades 1 to 5 => 1 band
Supervisors Grades 6 to 8 => 2 band
Managers Grades 9 to 12 => 3 band Source: The Japan Institute of Labor, the Personnel Management Cases of Foreign-affiliated Companies, 4, 2002,
p 5.
Getronics Japan, Ltd. (Netherlands) introduced the “job family system”, which is a
globally-common position grading system used by Getronics. Job family is referred to
a group of jobs that are the same or similar in terms of the nature of the work involved.
There are 5 job families, each of which is stratified into 4 or 5 levels. This arrangement
makes it possible to rate individuals based on globally-common criteria and company
implements various personnel management schemes according to this system. Figure 4
tabulates the jobs defined under the job family system with respect to the salary level at
8 grades. The job grading system is a pay-grading system applied on the basis of these 8
salary grades.
Figure 4. Relationship between pay-grade and job family
J o b F a m i l y Pay-grade
( New job
grade)
Support Technical
service
Business
development
Technology
consulting
Professional
8 PR5
7 PR4
6 BD3B TC4 PR3
5 TS4 BD3A TC3 PR2
4 SU4 TS3 BD2B TC2B PR1
3 SU3 TS2 BD2A TC2A
2 SU2 TS1 BD1 TC1
1 SU1 Source: The Japan Institute of Labor, the Personnel Management Cases of Foreign-affiliated Companies, 1, 2002,
p 4.
The salary is decided according to the salary range set for each grade within the job

grading system. The characteristics of the company’s salary system are: to treat
employees based on their accomplishments and contributions; to launch a
performance-linked bonus that reflect the company’s performance, the division’s
performance and the individual’s performance.
Getronics Japan, Ltd. applies two salary systems on the base of job family ratings. The
company introduced the annual salary system, together with the discretionary work
system, which is applicable to BD2A, BD2B, BD3A, BD3B, TC2A, TC2B, TC3, TC4, PR1,
PR2, and PR3. The other system, pay for work system, is applicable to SU1, SU2, SU3,
SU4, TS1, TS2, TS3, TS4, BD1, and TC1.
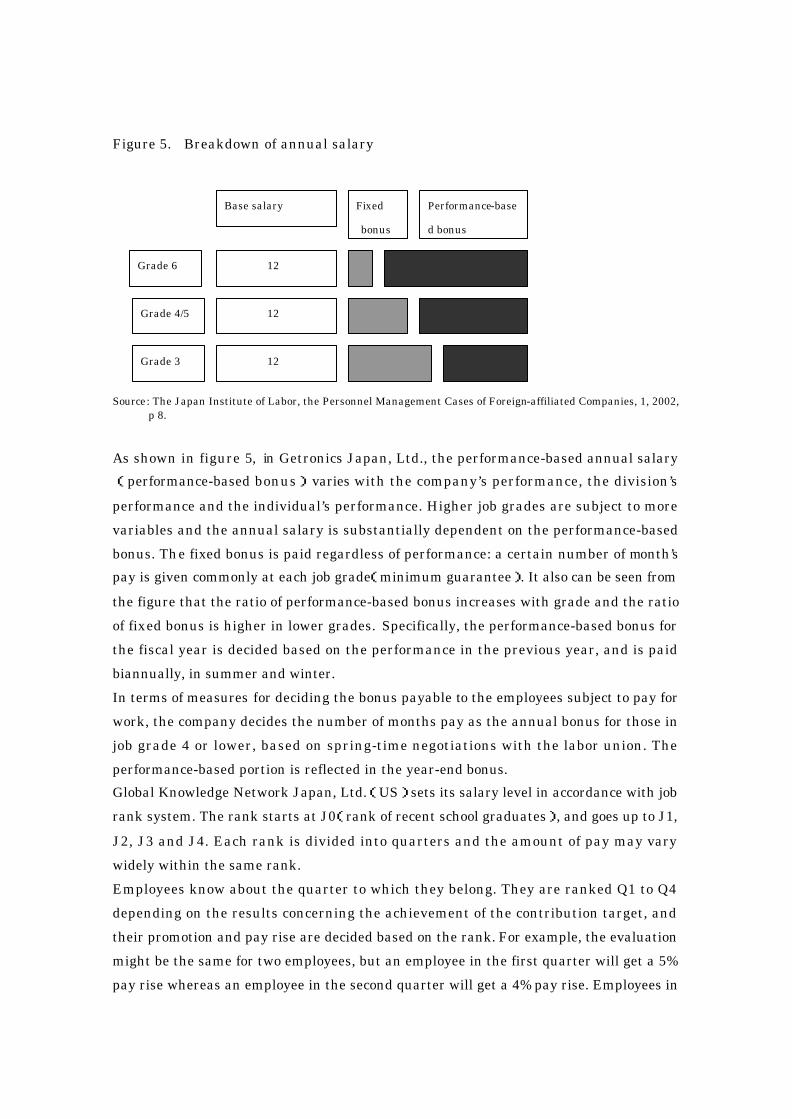
Figure 5. Breakdown of annual salary
Source: The Japan Institute of Labor, the Personnel Management Cases of Foreign-affiliated Companies, 1, 2002,
p 8.
As shown in figure 5, in Getronics Japan, Ltd., the performance-based annual salary
(performance-based bonus)varies with the company’s performance, the division’s
performance and the individual’s performance. Higher job grades are subject to more
variables and the annual salary is substantially dependent on the performance-based
bonus. The fixed bonus is paid regardless of performance: a certain number of month’s
pay is given commonly at each job grade(minimum guarantee). It also can be seen from
the figure that the ratio of performance-based bonus increases with grade and the ratio
of fixed bonus is higher in lower grades. Specifically, the performance-based bonus for
the fiscal year is decided based on the performance in the previous year, and is paid
biannually, in summer and winter.
In terms of measures for deciding the bonus payable to the employees subject to pay for
work, the company decides the number of months pay as the annual bonus for those in
job grade 4 or lower, based on spring-time negotiations with the labor union. The
performance-based portion is reflected in the year-end bonus.
Global Knowledge Network Japan, Ltd.(US)sets its salary level in accordance with job
rank system. The rank starts at J0(rank of recent school graduates), and goes up to J1,
J2, J3 and J4. Each rank is divided into quarters and the amount of pay may vary
widely within the same rank.
Employees know about the quarter to which they belong. They are ranked Q1 to Q4
depending on the results concerning the achievement of the contribution target, and
their promotion and pay rise are decided based on the rank. For example, the evaluation
might be the same for two employees, but an employee in the first quarter will get a 5%
pay rise whereas an employee in the second quarter will get a 4% pay rise. Employees in
Base salary
12
12
12
Grade 6
Grade 4/5
Grade 3
Fixed
bonus
Performance-base
d bonus
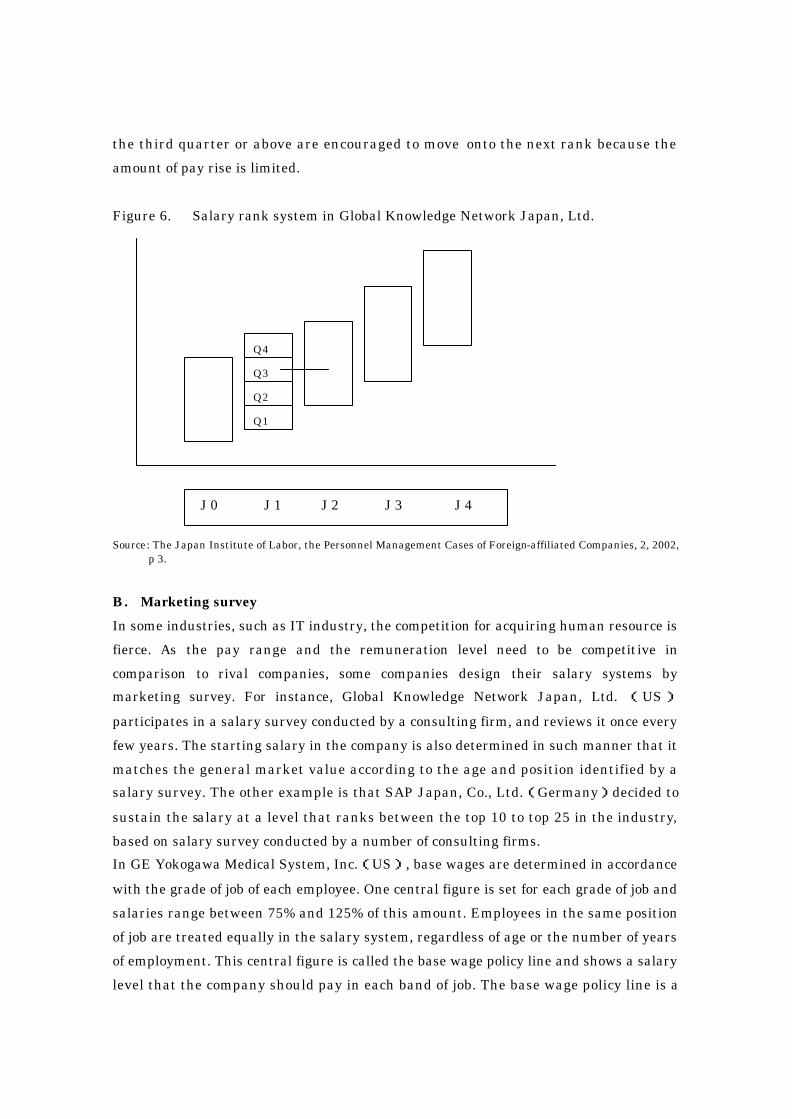
the third quarter or above are encouraged to move onto the next rank because the
amount of pay rise is limited.
Figure 6. Salary rank system in Global Knowledge Network Japan, Ltd.
Source: The Japan Institute of Labor, the Personnel Management Cases of Foreign-affiliated Companies, 2, 2002, p 3.
B. Marketing survey
In some industries, such as IT industry, the competition for acquiring human resource is
fierce. As the pay range and the remuneration level need to be competitive in
comparison to rival companies, some companies design their salary systems by
marketing survey. For instance, Global Knowledge Network Japan, Ltd. (US)
participates in a salary survey conducted by a consulting firm, and reviews it once every
few years. The starting salary in the company is also determined in such manner that it
matches the general market value according to the age and position identified by a
salary survey. The other example is that SAP Japan, Co., Ltd.(Germany)decided to
sustain the salary at a level that ranks between the top 10 to top 25 in the industry,
based on salary survey conducted by a number of consulting firms.
In GE Yokogawa Medical System, Inc.(US), base wages are determined in accordance
with the grade of job of each employee. One central figure is set for each grade of job and
salaries range between 75% and 125% of this amount. Employees in the same position
of job are treated equally in the salary system, regardless of age or the number of years
of employment. This central figure is called the base wage policy line and shows a salary
level that the company should pay in each band of job. The base wage policy line is a
Q4
Q3
Q2
Q1
J 0 J 1 J 2 J 3 J 4

market standard of salary calculated on the basis of various research on salaries,
representing the current salary range existing at GEYMS and its external
competitiveness.
C. Evaluation system
In other developed countries, there are some kinds of evaluation system that currently
used. They are Management by Objective(MBO), Management by Result(MBR) and
Management by Behaviors, Process and Results. Most companies use MBO system to
conduct performance appraisal. In American Express International, Inc.(Japan), the
objective achievement evaluation is conducted at the end of every business year, in
which the degree of achievement by each employee is measured against his/her own
goal that has been set at the beginning of the year in such a manner that it should
match the three categories of “what to do for employees”, “what to do for customers” and
“what to do for shareholders”. The percentages allocated to these three categories differ
depending on the job or position, they are generally 25:25:50. The evaluation process
takes a two-tier form in which the direct supervisor of an employee first conducts the
evaluation and subsequently a more senior supervisor further scrutinizes the
evaluation results and gives an approval. Prior to such evaluations by their supervisors,
each employee is required to submit his/her self-evaluation. It is an established practice
that, after final evaluation results are determined, the employee and his/her supervisor
have a meeting to discuss the grounds for such evaluation or the gap between that and
his/her self-evaluation, and a development plan etc.
In some companies, for instance, in Global Knowledge Network Japan, Ltd.,(US)
evaluation linked to the salary system is based on management by result (MBR). It is
not on management by objective,(MBO) as they believe that results are subject to
evaluation rather than the process. MBR involves the evaluation of two areas: the
business performance during the year(i.e. business target), and the contribution made
towards building the organization(i.e. contribution target). The evaluation is performed
by the manager and the employee on a one-to-one basis and the evaluation results must
be signed by the evaluated employee, which means the results must be acceptable to the
evaluated employee as well.
In Nihon Ericsson company(Sweden), performance evaluation is conducted on the basis
of three elements, i.e., “behaviors”, “process” and “results”. “Behaviors” refer to
attitudes towards work, including strict punctuality in keeping promises and appointed
times, prompt transfer of all messages taken from customers. “Process” refers to a
process taken b y an employee until a result is attained. As it is known that the

existence of an adequate “process” is essential for an employee to continuously show
good performance, Nihon Ericsson has made the observation of a “process” one of the
significant points in performance appraisal. “Results” means sales and/or profits,
customer satisfaction, final quantitative and qualitative results attained, such as
completion of a project etc.
D. Measures to ensure fairly evaluation
In order to gain fair evaluation results, two main methods have been adopted in many
companies. The first one is to offer training courses to managers. For example, in Nihon
Ericsson (Sweden), recognizing that appraisal skills on the part of managers are
important, the company had all its managers go through a special training program
focused on appraisal issues when it introduced the new personnel system, and they also
plan to offer such programs on a regular basis. The other measure is to conduct
360-Degree Survey. As a tool for employees to learn “how people see me in the
workplace” and improve and develop themselves, a “360-Degree Survey” is conducted
once a year in many companies, although its results do not directly affect their
evaluations.
In General Electric International Inc.(US), an employee is evaluated by 8 to 15 people in
three different relationship categories, i.e., supervisors, colleagues and customers, that
the employee chooses himself/herself under the advice of his/her supervisor, who are
asked to answer 5 to 60 questions on the web. Customers as referred to here are not
necessarily restricted to external people and may also be employees in other
department. As the 360-degree survey is first and foremost a tool designed for the
purpose of giving feedback to employees, no one else can access its results. Employees
are encouraged to prepare an “Action Plan” in response to the results of the 360-degree
survey and submit it to the respondents of the survey in return.
In Nippon Becton Dickinson Company, Ltd., 360-degree feedback is conducted by more
than 6 members, direct supervisor, subordinates and peers. It is not a process for others
to evaluate an individual. The findings are used to improve performance in the
following year.
In Johnson&Johnson(US) , each employee is subject to a 360-degree survey in which
his/her supervisor, workers working under him/her and his/her colleagues answer a
questionnaire. Survey results thus obtained are fed back to the employee so that he /she
can identify room for improvement to become an ideal employee, draw up an
improvement plan and achieve growth on his/her own.

E. Methods of salary and bonus distribution
Job design, marketing survey and performance evaluation system provide a foundation
for payment distribution. Just like the different job design and performance evaluation
systems adopted in many companies, the salary distribution system in many companies
are also different in terms of implementing methods even they are all
performance-based system.
The pay structure in Nihon Ericsson (Sweden) is composed of base pay and variable
pay. The amount of base pay is reviewed every year on the basis of performance
appraisal results with reference to the market standards of salaries. Company
determines a pay range by first classifying all the work positions existing in the
company into 11 job categories and subsequently combining the job category with the 6
role grades. Variable pay can be divided into two portions, namely, a guaranteed portion
and a variable portion. Unless there are any problems with the number of working days
or some other work-related circumstances, employees can receive the guaranteed
portion for sure. On the other hand, the variable portion is determined on the basis of
annual performance evaluation: in principle, the higher the role grade, the larger the
amount of pay variation will be. See table 7.
Table 7. Variable pay guideline
Maximum months Minimum months
Grade 4 6 2
Grade 3 5 3
Grade 2 4.5 3.5
Grade 1 4.25 3.75 Source: The Japan Institute of Labor, the Personnel Management Cases of Foreign-affiliated Companies, 1, 2002,
p 24.
The pay structure for employees with the role grade of 5 or higher(senior manager level
or higher)is not based on the combination of a base pay and a variable pay. Instead of a
variable pay, they are paid a short-term-incentive. The STI is an incentive program
commonly applied to all Ericsson group companies worldwide and its recipients are
given separate notice regarding their compensations.
Sun’s (Sun Microststems, Inc)wage system consists of base salary, allowances,
seasonal bonus and performance-based bonus. The base salary in each job rank may go
down to 80% or go up to 120%. For ordinary employees, performance-based bonus is
calculated by multiplying the basic salary by a certain type of coefficient, which is
determined on the basis of company’s performance and the individual’s performance.
The coefficient accounting for the company’s performance is set at 0 if no more than 80%
of the target of sales, profits, etc. has been achieved and at 2 if at least 140% of such
target has been achieved. The coefficient accounting for the individual’s performance is
set between 0 and 22% depending on the extent to which the job target has been
accomplished. In other words, if the company achieves at least 140% of the target and
the individual’s performance earns the highest rating, assuming that an employee’s
basic salary is 5 million yen, the employee will be paid a performance-based bonus of 2.2
million yen.
5 million yen×2(company’s performance)× 22%(individual’s performance)= 2.2
million yen.
On the other hand, if the company can not fulfill 80% of the target, or if the individual’s
performance rating is 0, he/she will not be paid bonus.
For management-level employees when account for their performance-based bonus, the
individual’s performance is set at between 0 and 24%, which is 2 percent higher than
that of ordinary employees.
In some companies, such as Nippon Polaroid (US), pay system is a more demanding one
for senior managers because of two reasons. One reason is that the heavier the
responsibility becomes, the greater the change in the compensation according to
business performance becomes. The other reason is that there are no upper or lower
limits for performance-based portion in the compensation for directors and managers.
The system is strongly linked to business performance for senior managers since
division manager and above are on annual salary system, indicating that a large portion
of their compensation is based on performance. Section managers and below receive
monthly salaries, performance-based compensation, bonus and allowance. A maximum
of 25% compensation is linked to business performance. Bonus for section managers and
below also varies according to business performance and differences may be about four
times of the total monthly salary at the maximum. Factors such as the level of difficulty
in achieving the objective are considered for evaluation of salaries, but bonuses are
based solely on actual achievement.
4. Compensation system comparison between Japan and other developed countries Through payment system studies we find that there are some differences between
Japan and other countries. The main differences are as follow:
(1)Bonus
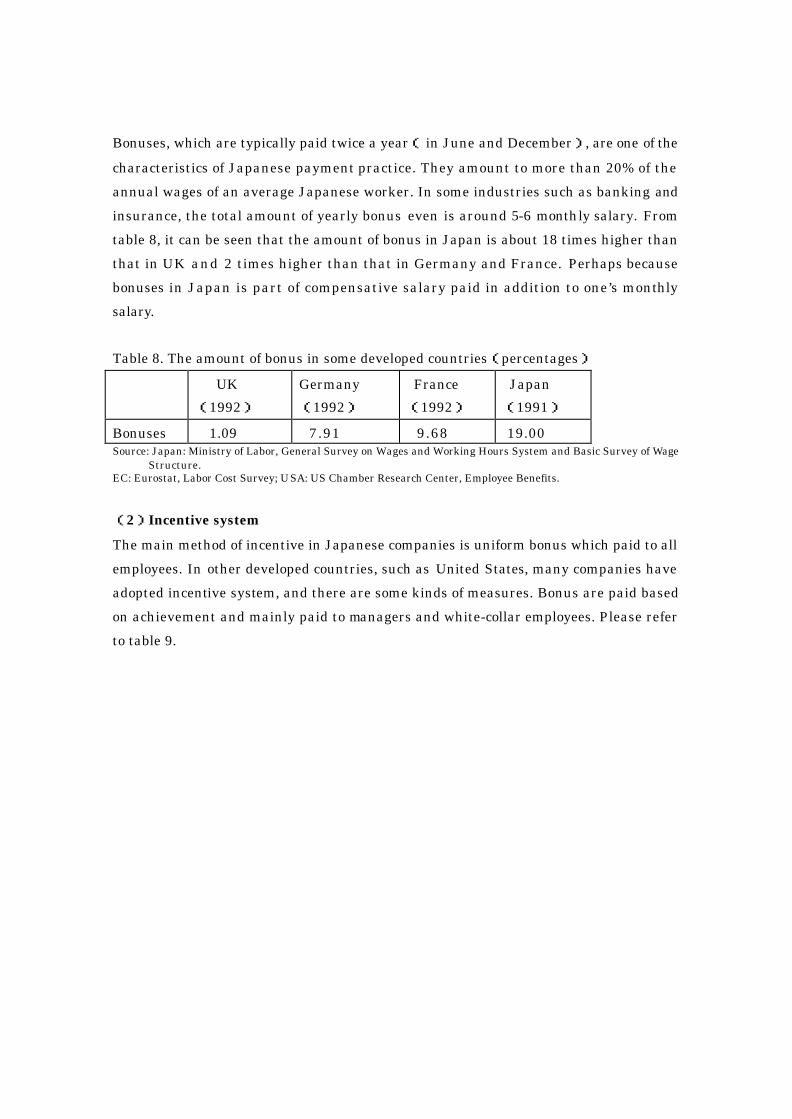
Bonuses, which are typically paid twice a year( in June and December), are one of the
characteristics of Japanese payment practice. They amount to more than 20% of the
annual wages of an average Japanese worker. In some industries such as banking and
insurance, the total amount of yearly bonus even is around 5-6 monthly salary. From
table 8, it can be seen that the amount of bonus in Japan is about 18 times higher than
that in UK and 2 times higher than that in Germany and France. Perhaps because
bonuses in Japan is part of compensative salary paid in addition to one’s monthly
salary.
Table 8. The amount of bonus in some developed countries(percentages)
UK
(1992)
Germany
(1992)
France
(1992)
Japan
(1991)
Bonuses 1.09 7.91 9.68 19.00 Source: Japan: Ministry of Labor, General Survey on Wages and Working Hours System and Basic Survey of Wage
Structure. EC: Eurostat, Labor Cost Survey; USA: US Chamber Research Center, Employee Benefits.
(2)Incentive system
The main method of incentive in Japanese companies is uniform bonus which paid to all
employees. In other developed countries, such as United States, many companies have
adopted incentive system, and there are some kinds of measures. Bonus are paid based
on achievement and mainly paid to managers and white-collar employees. Please refer
to table 9.
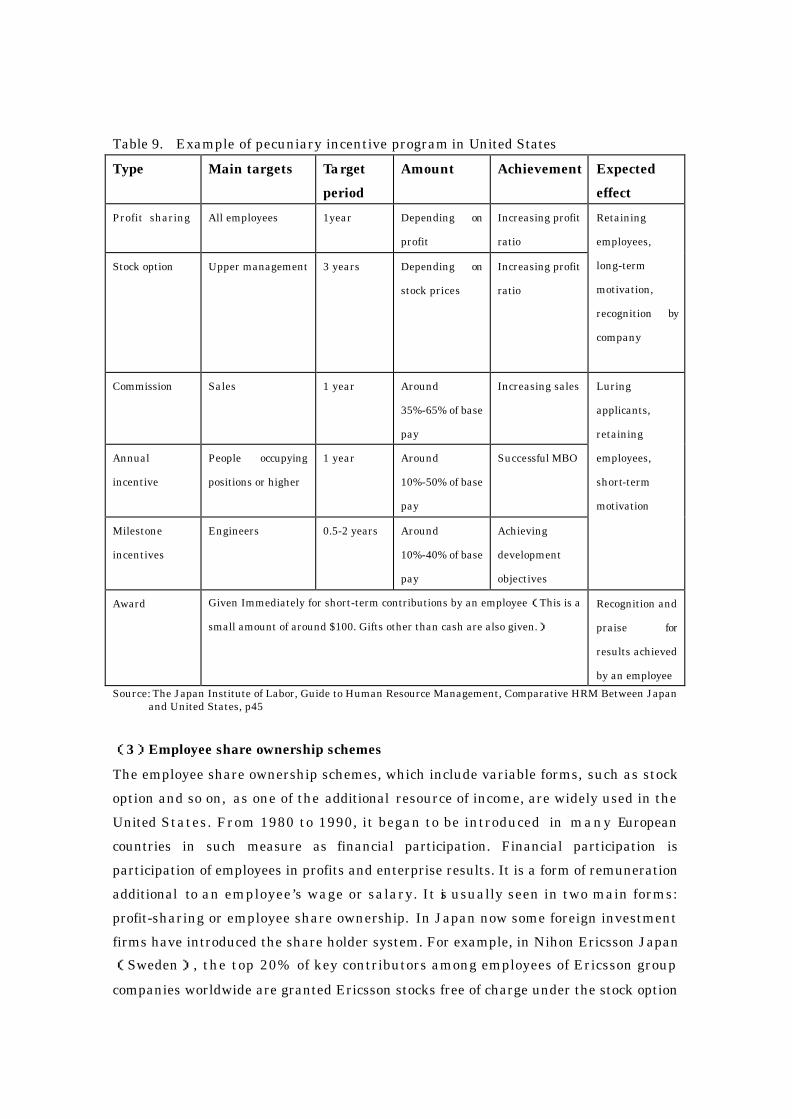
Table 9. Example of pecuniary incentive program in United States
Type Main targets Target
period
Amount Achievement Expected
effect
Profit sharing All employees 1year Depending on
profit
Increasing profit
ratio
Stock option Upper management 3 years Depending on
stock prices
Increasing profit
ratio
Retaining
employees,
long-term
motivation,
recognition by
company
Commission Sales 1 year Around
35%-65% of base
pay
Increasing sales
Annual
incentive
People occupying
positions or higher
1 year Around
10%-50% of base
pay
Successful MBO
Milestone
incentives
Engineers 0.5-2 years Around
10%-40% of base
pay
Achieving
development
objectives
Luring
applicants,
retaining
employees,
short-term
motivation
Award Given Immediately for short-term contributions by an employee(This is a
small amount of around $100. Gifts other than cash are also given.)
Recognition and
praise for
results achieved
by an employee
Source: The Japan Institute of Labor, Guide to Human Resource Management, Comparative HRM Between Japan and United States, p45
(3)Employee share ownership schemes
The employee share ownership schemes, which include variable forms, such as stock
option and so on, as one of the additional resource of income, are widely used in the
United States. From 1980 to 1990, it began to be introduced in many European
countries in such measure as financial participation. Financial participation is
participation of employees in profits and enterprise results. It is a form of remuneration
additional to an employee’s wage or salary. It is usually seen in two main forms:
profit-sharing or employee share ownership. In Japan now some foreign investment
firms have introduced the share holder system. For example, in Nihon Ericsson Japan
(Sweden), the top 20% of key contributors among employees of Ericsson group
companies worldwide are granted Ericsson stocks free of charge under the stock option

system. In GE Yokogawa Medical System, Inc.,(US),about 5% of the highest performing
employees are assigned GE stock. This privilege used to be offered to employees in
management position only, but the system has been utilized as a means to increase the
degree of job achievement of employees in recent years and beneficiaries have therefore
been selected regardless of whether they are in management or clerical position. Table
10 shows the current situation in this regard in Europe.
Table 10. Business unites with financial participation schemes in European countries %
Country Percentage
Austria 9
Belgium 29
Denmark 21
Finland 30
France 41
Germany 20
Greece 23
Ireland 34
Italy 15
Netherlands 45
Portugal 5
Spain 19
Sweden 26
United Kingdom 45
Source: Employee Share Ownership and Profit-Sharing in the European Union, Luxembourg: Office for official publications of the European Communities, 2001, p31
Compare to the statistics from European countries, share ownership system in Japan is
not as prevalent as that in Europe. According to the 1999 General Survey of Wages and
Working Hours System by the former Ministry of Labor, in Japan 4% of companies with
1000 or more employees have introduced stock options, allowing workers the choice of
purchasing stock in their companies at a price fixed in advance. According to the survey,
it can be expected that the introduction of this system will continue in the future,
focused on large-scale enterprises. 5 Actually in Japan now, some newly founded firms,
5 The Japan Institute of Labor, the Labor Situation in Japan 2002/2003, p 38.

which have special technology and are targeted at new investment, are introducing the
stock option system. There are also such so many firms in Japan.
5. Experiences from Japan and other developed countries Above all we have examined the compensation system in Japan and other developed
countries, and maybe some conclusions can be drawn from the research as follow:
(1)Compensation system should be suitable to the circumstance of a country
In the process of study we found that with Japanese characteristic, seniority-based
wage system is a very successful practice and has been playing a very important role in
the development of Japan’s economy. When explained the phenomenon Mr. Haruhiko
Hori wrote: Under this system, “by staying at one firm, workers acquired skill with
their employer’s proprietary technology. Employers, in return, used promotions to
reward employees for their skill development. Additionally, the tendency of the cost of
living to increase as employees aged further justified linking wages to seniority. Thus,
promotions following skill improvement and increases in cost of living were connected to
longer years of service, and the seniority-based wage system was established to raise
wages with advancing age and years of service.”6 Therefore, both employers and
employees benefit from the system and it might be the reason for the success of this
system because it fits the situation in Japan. Furthermore the experience in Japan
indicates that for a country, a good compensation system is a system that suits the
situation of the country as each country has its own social background such as different
history, culture and so on. From this point of view we may say that the new
compensation system satisfied with the demands of market economy, which is expected
to be established in the process of economic reform in China, should reflect its own
characteristics. In other words, we should absorb experiences from other countries in
accordance with the specific circumstance in China.
(2)Compensation system should be adjusted according to the changing situation
Compensation system should be founded in accordance with the circumstance of a
country; on the other hand, it also should be changed with changing situation. Due to
the changing condition there are going to be some adjustments, by which some new
measures will be introduced and some obsolete practices and regulations have to be
abolished or replaced with alternative methods. For instance in Japan the portion of
6 The Japan Institute of Labor, the Labor Situation in Japan 2002/2003, p 31.

allowance and welfare in salary has decreased in recent years because company’s
burden of legal welfare expenses and retirement allowance is expected to increase, so
they have to make an effort to curtail the non-legal welfare expenses as much as
possible. In addition, there is a growing trend of abolishing personal allowances that are
not related to job, such as allowance for family and allowance for housing. The other
example is that some major banks, such as Bank of Tokyo-Mitsubishi, The Resona Bank
Group and Mizuho Financial Group plan to cut the pension benefits they provide to
employees retired by 7-20%, 48% and 40% respectively. 7 The Analysis of the Labor
Economy 2003, shows that more than 70% of the companies plan to change their wage
system, and more than 30% of the companies have increased the weighting of
achievements and performance as wage determination factors. 8 The experiences from
Japan told us that adjustment of payment system based on the changes in the field of
social and economy is necessary, or the development of economy will be hampered.
(3) Evaluation system is essential for the implementing of performance-based wage
system
As discussed above, many companies intend to expand the portion of performance-based
in their wage system, but the main problem for them is that while employees approve
the introduction of a performance-based wage system and wage differences based on
evaluation, they feel some concern as to whether such evaluations would be fair.
According to the information from Ministry of Health, Labor and Welfare, there is a risk
that depending on how objectives are set and implemented, the performance-based
wage system may have a negative impact on employees’ desire to work and human
resources development. For this system to function effectively, it is important to gain
the agreement of employees by setting proper objectives, maintaining transparency and
fairness.9 The analysis from Japanese government introduced the current situation in
Japan, it also might be a challenge for us because we also plan to adopt
performance-based wage system in China. Therefore it is important to pay attention to
and enhance research work on this issue.
(4)Incentive mechanism should be combined with enterprise’s culture
In China, before economic reform, the major problem in terms of payment system in
enterprises is that there were no effective incentive measures. Under this system wage
7 The Japan Institute of Labor, The JIL Labor Flash/vol. 38, E-mail Journal, 03,17,2003. 8 Ministry of Health, Labor and Welfare, Summary of the Analysis of the Labor Economy 2003, p22. 9 Ministry of Health, Labor and Welfare, Summary of the Analysis of the Labor Economy 2003, p23.
standards for all employees were set and regulated by government, so employees were
paid same amount of wages regardless of contributions to their enterprises. This
situation has changed gradually with the development of economic reform and the
introduction of experiences from other countries in regard of payment system. While
motivation system has been adopted in some enterprises, the importance of enterprise’s
culture should also be emphasized. The enterprise’s culture refers to the loyalty and the
feeling of identification to the companies employees serve for. For employees, in most
cases, their satisfactions can’t be fulfilled only by the amount of wages or salaries. What
they desire, except for economic rewards, should include the feeling of success from
career development. Therefore one of the important tasks for companies is to provide
their employees with harmonious working environment, as well as payment system
that is full of motivation to keep labor force stable.
References
The Japan Institute of Labor, Main Labor Economic Indicators, September 2003.
The Japan Institute of Labor, The labor situation in Japan 2002 / 2003.
The Japan Institute of Labor, Japanese working life profile, 2003 – Labor statistics
The Japan Institute of Labor, Comparative labor statistics Japan and other major
countries, 2000.
Yoko Sano (1995 ), Human resource management in Japan, Keio University Press,
Inc.
Akira Takanashi( 2002 ), Shunto wage offensive, The Japan Institute of Labor
Takashi Araki ( 2002 ), Labor and employment law in Japan, The Japan Institute of
Labor.
Robert A. Hart and Seiichi Kawasaki ( 1999 ), Work and pay in Japan, Cambridge
University Press.
The Japan Institute of Labor, ( 2002 ), Guide to human resource Management –
Comparative HRM between Japan and US.
The Japan Institute of Labor, ( 2002 ), The personnel management cases of foreign –
affiliated companies.
The Japan Institute of Labor, ( 2002 ), Analysis of the Labor Economy 2003.


![[XLS] · Web viewBridge Room & Board Social Workers MH Coun-Phd MH Coun-Msw MH Coun-Inst MH Inst-Non-Coun Phys-Visits Phys-Surgery Language Interpreter/Translation Service Phys-Lab](https://img.pdfslide.us/doc/110x75/5afe6f9f7f8b9a434e8f130e/xls-viewbridge-room-board-social-workers-mh-coun-phd-mh-coun-msw-mh-coun-inst.jpg)