Embed Size (px)
Citation preview
Compensation Models that Support Team-Based Care
Fredrick T Horton, MHA, CMPE
Vice President AMGA Consulting Services
1
Presentation Overview
• Transition Planning
• APP Survey Data (with select physician comparisons)
– How NP/PAs are paid
– What NP/PAs are paid
• APP Compensation Models
• Physician Team-based Models
• Questions and Comments
2

Transition Planning
3
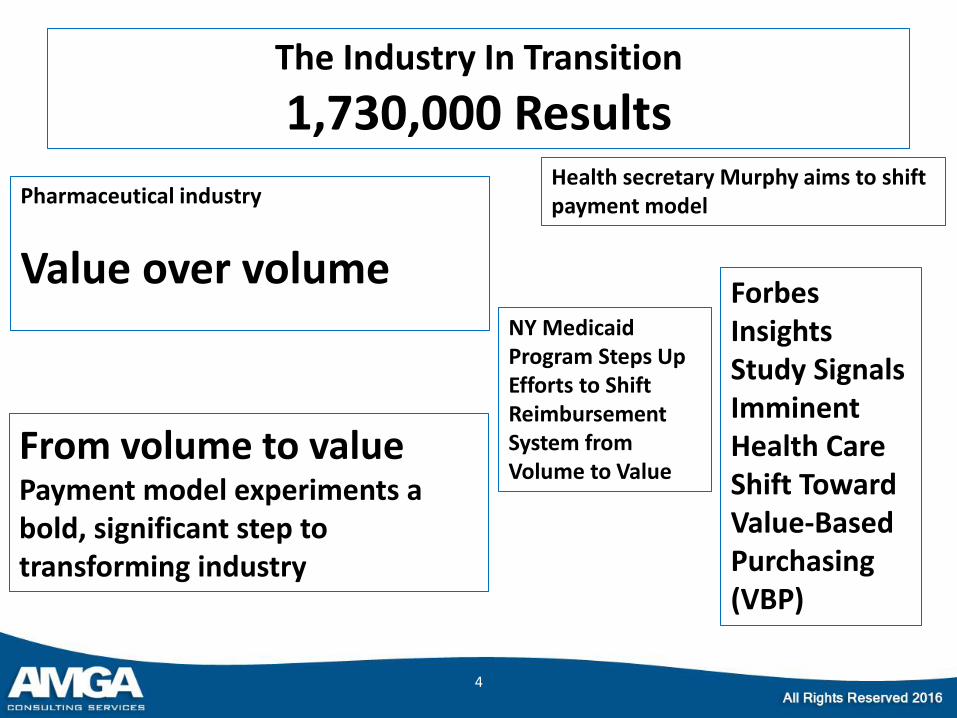
The Industry In Transition
1,730,000 Results
4
Pharmaceutical industry
Value over volume
Health secretary Murphy aims to shift payment model
From volume to value Payment model experiments a bold, significant step to transforming industry
NY Medicaid Program Steps Up Efforts to Shift Reimbursement System from Volume to Value
Forbes Insights Study Signals Imminent Health Care Shift Toward Value-Based Purchasing (VBP)
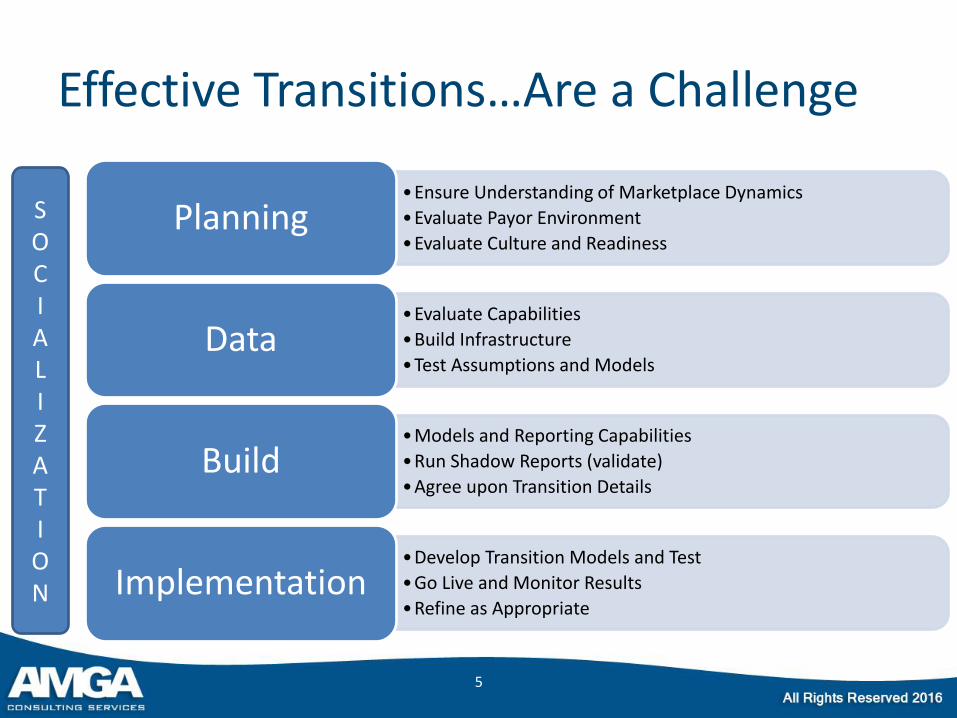
Effective Transitions…Are a Challenge
•Ensure Understanding of Marketplace Dynamics
•Evaluate Payor Environment
•Evaluate Culture and Readiness Planning
•Evaluate Capabilities
•Build Infrastructure
•Test Assumptions and Models Data
•Models and Reporting Capabilities
•Run Shadow Reports (validate)
•Agree upon Transition Details Build
•Develop Transition Models and Test
•Go Live and Monitor Results
•Refine as Appropriate Implementation
5
S O C I A L I Z A T I O N
APP Survey Data (with Select Physician Comparisons)
6
Survey Overview
• 29th Annual AMGA Provider Compensation Survey
• Data on clinical compensation, work RVUs, net collections, gross productivity, comp-to-productivity ratios, visits, and benefits
• 134 Physician Specialties
• 27 Other Provider Specialties
• NP and PA breakdowns
7
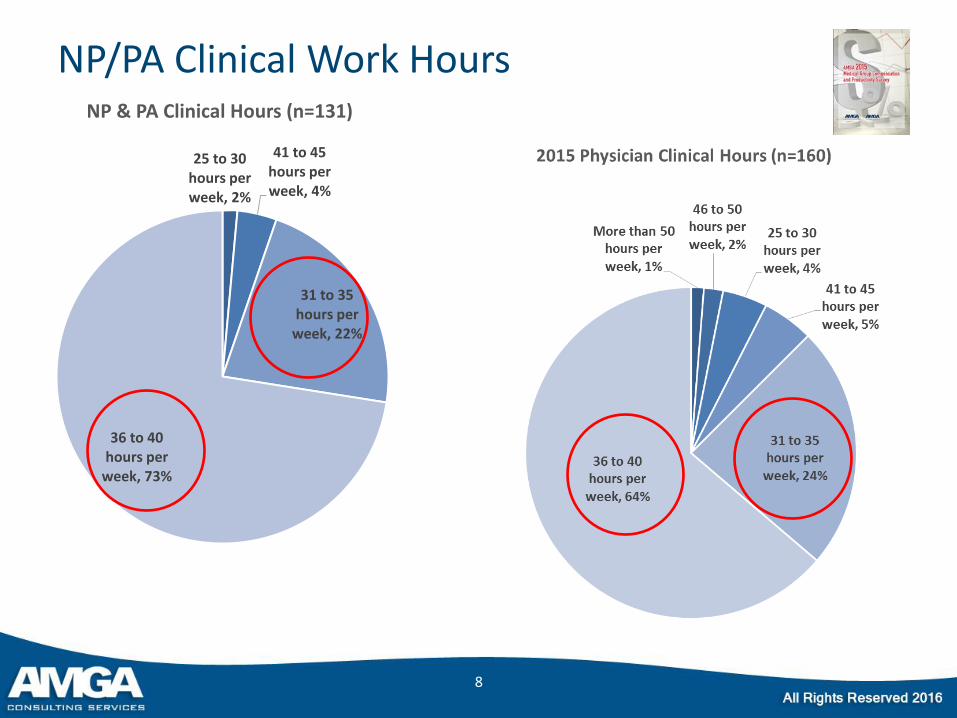
NP/PA Clinical Work Hours
8
25 to 30 hours per week, 2%
41 to 45 hours per week, 4%
31 to 35 hours per
week, 22%
36 to 40 hours per
week, 73%
NP & PA Clinical Hours (n=131)
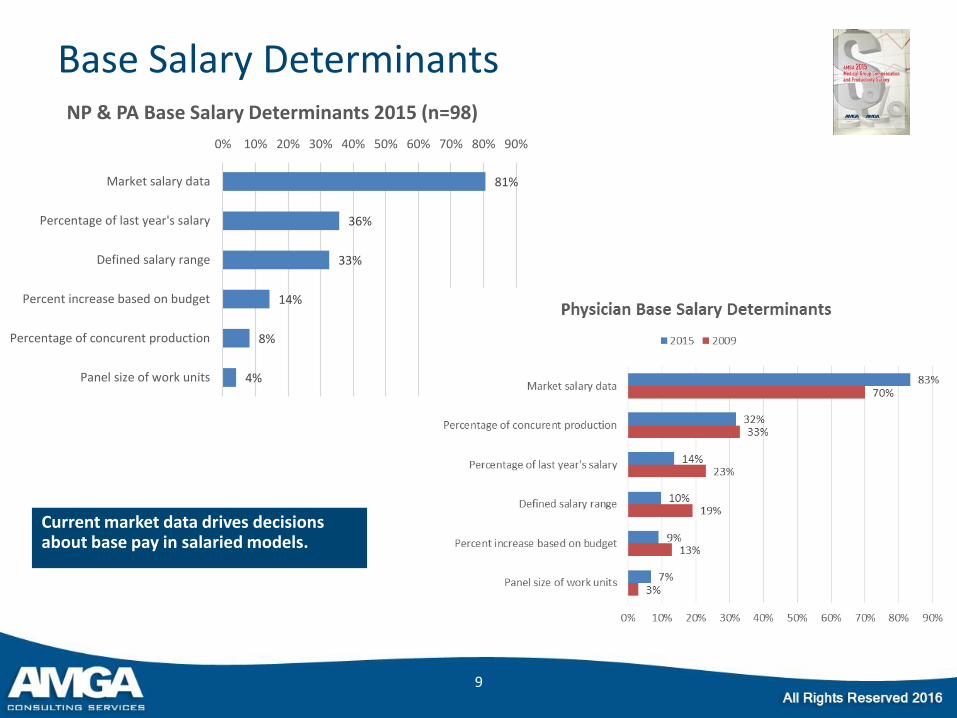
Base Salary Determinants
9
81%
36%
33%
14%
8%
4%
0% 10% 20% 30% 40% 50% 60% 70% 80% 90%
Market salary data
Percentage of last year's salary
Defined salary range
Percent increase based on budget
Percentage of concurent production
Panel size of work units
NP & PA Base Salary Determinants 2015 (n=98)
Current market data drives decisions about base pay in salaried models.
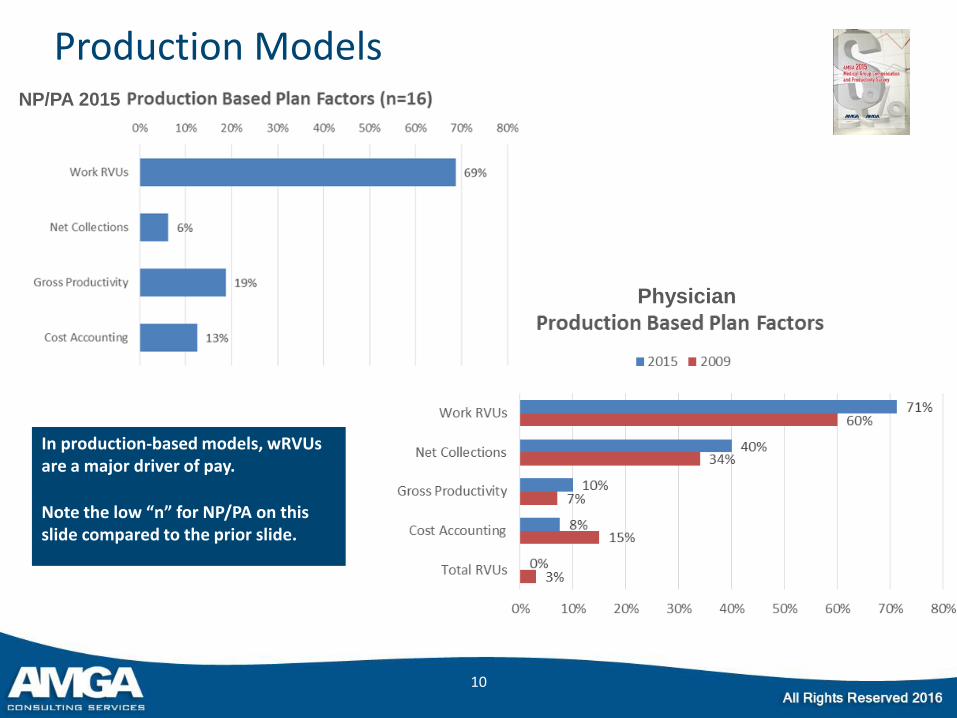
Production Models
10
Physician
NP/PA 2015
In production-based models, wRVUs are a major driver of pay.
Note the low “n” for NP/PA on this slide compared to the prior slide.
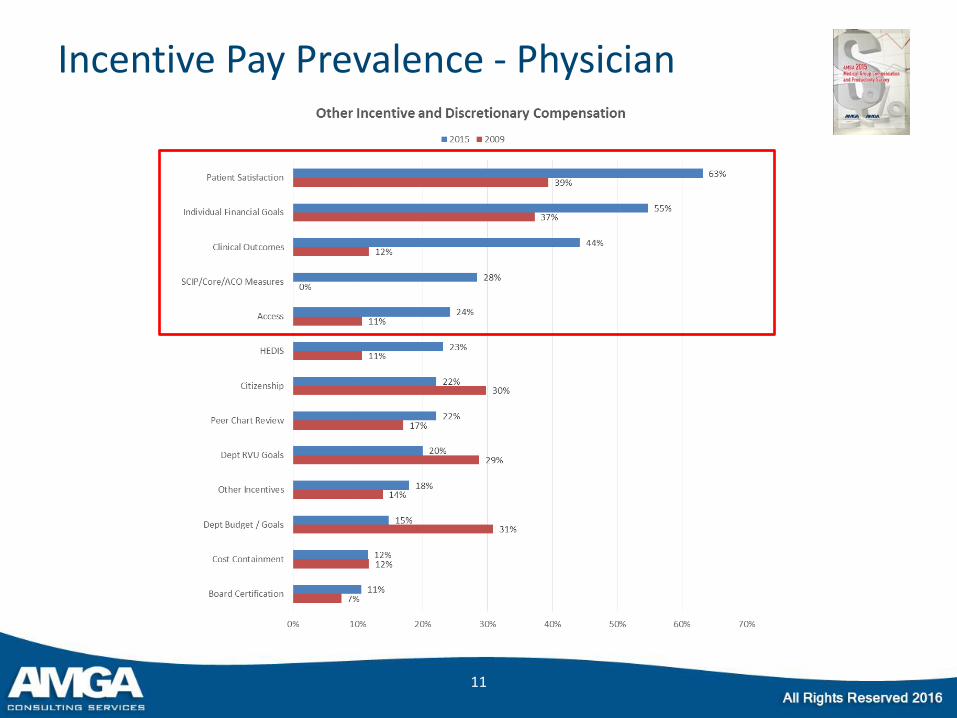
Incentive Pay Prevalence - Physician
11
45%
45%
23%
16%
14%
11%
11%
9%
9%
7%
5%
5%
5%
5%
5%
2%
2%
0% 5% 10% 15% 20% 25% 30% 35% 40% 45% 50%
Patient Satisfaction
Individual Financial Goals
SCIP/Core/ACO Measures
Access
Other Incentives
HEDIS
Peer Chart Review
Citizenship
Dept RVU Goals
Market Adjustments
Dept Budget / Goals
Cost Containment
Controlling Outside Referrals
Accessibility/Availability
Other Discretionary
Seniority
Ancillary
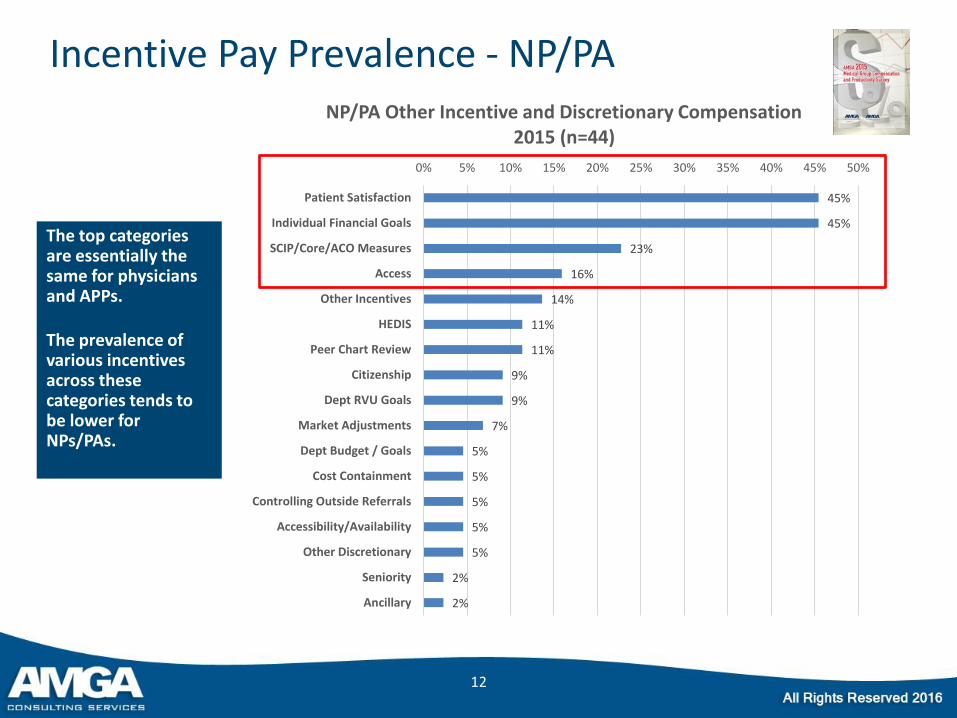
NP/PA Other Incentive and Discretionary Compensation 2015 (n=44)
Incentive Pay Prevalence - NP/PA
12
The top categories are essentially the same for physicians and APPs.
The prevalence of various incentives across these categories tends to be lower for NPs/PAs.
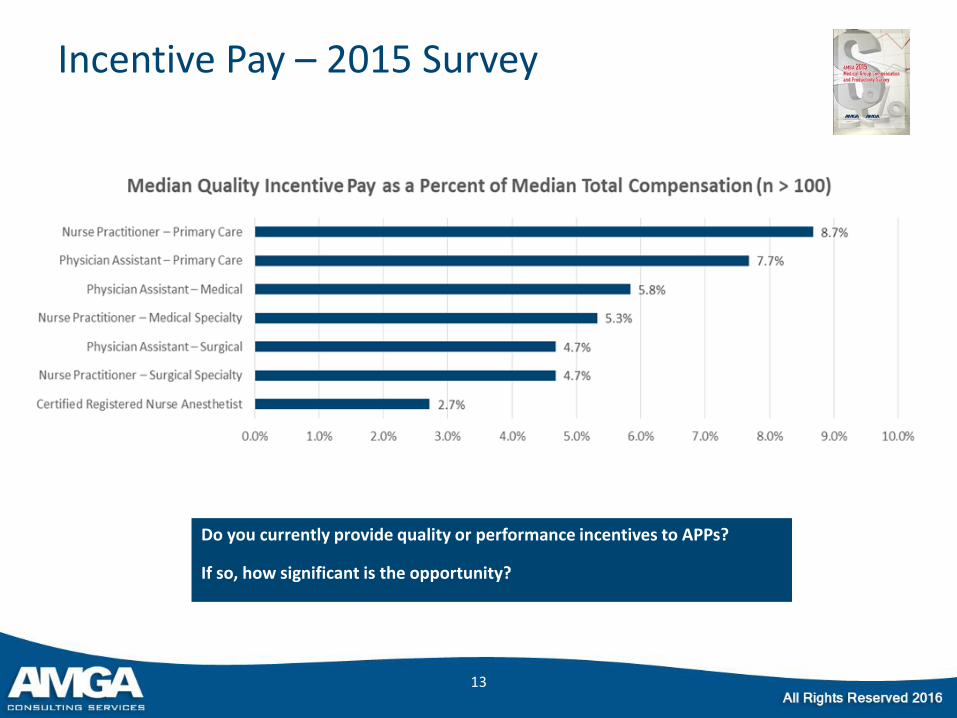
Incentive Pay – 2015 Survey
13
Do you currently provide quality or performance incentives to APPs?
If so, how significant is the opportunity?
14
Number of Number of
Group Physician 90th 80th 20th Standard
Specialty Responses Responses Percentile Percentile Median Percentile Mean Deviation
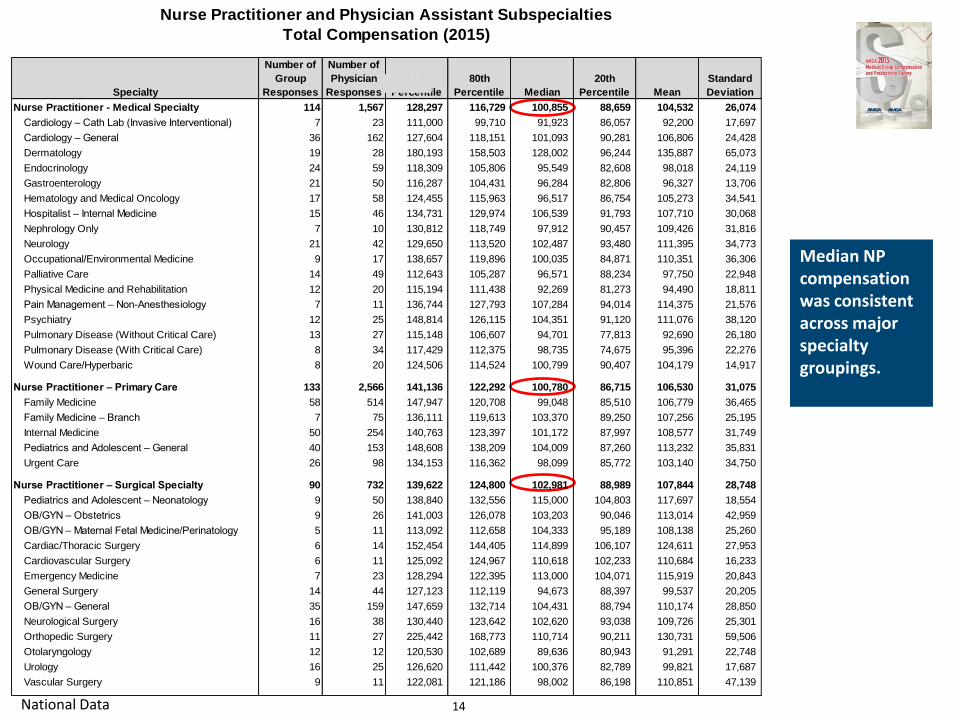
Nurse Practitioner - Medical Specialty 114 1,567 128,297 116,729 100,855 88,659 104,532 26,074
Cardiology – Cath Lab (Invasive Interventional) 7 23 111,000 99,710 91,923 86,057 92,200 17,697
Cardiology – General 36 162 127,604 118,151 101,093 90,281 106,806 24,428
Dermatology 19 28 180,193 158,503 128,002 96,244 135,887 65,073
Endocrinology 24 59 118,309 105,806 95,549 82,608 98,018 24,119
Gastroenterology 21 50 116,287 104,431 96,284 82,806 96,327 13,706
Hematology and Medical Oncology 17 58 124,455 115,963 96,517 86,754 105,273 34,541
Hospitalist – Internal Medicine 15 46 134,731 129,974 106,539 91,793 107,710 30,068
Nephrology Only 7 10 130,812 118,749 97,912 90,457 109,426 31,816
Neurology 21 42 129,650 113,520 102,487 93,480 111,395 34,773
Occupational/Environmental Medicine 9 17 138,657 119,896 100,035 84,871 110,351 36,306
Palliative Care 14 49 112,643 105,287 96,571 88,234 97,750 22,948
Physical Medicine and Rehabilitation 12 20 115,194 111,438 92,269 81,273 94,490 18,811
Pain Management – Non-Anesthesiology 7 11 136,744 127,793 107,284 94,014 114,375 21,576
Psychiatry 12 25 148,814 126,115 104,351 91,120 111,076 38,120
Pulmonary Disease (Without Critical Care) 13 27 115,148 106,607 94,701 77,813 92,690 26,180
Pulmonary Disease (With Critical Care) 8 34 117,429 112,375 98,735 74,675 95,396 22,276
Wound Care/Hyperbaric 8 20 124,506 114,524 100,799 90,407 104,179 14,917
Nurse Practitioner – Primary Care 133 2,566 141,136 122,292 100,780 86,715 106,530 31,075
Family Medicine 58 514 147,947 120,708 99,048 85,510 106,779 36,465
Family Medicine – Branch 7 75 136,111 119,613 103,370 89,250 107,256 25,195
Internal Medicine 50 254 140,763 123,397 101,172 87,997 108,577 31,749
Pediatrics and Adolescent – General 40 153 148,608 138,209 104,009 87,260 113,232 35,831
Urgent Care 26 98 134,153 116,362 98,099 85,772 103,140 34,750
Nurse Practitioner – Surgical Specialty 90 732 139,622 124,800 102,981 88,989 107,844 28,748
Pediatrics and Adolescent – Neonatology 9 50 138,840 132,556 115,000 104,803 117,697 18,554
OB/GYN – Obstetrics 9 26 141,003 126,078 103,203 90,046 113,014 42,959
OB/GYN – Maternal Fetal Medicine/Perinatology 5 11 113,092 112,658 104,333 95,189 108,138 25,260
Cardiac/Thoracic Surgery 6 14 152,454 144,405 114,899 106,107 124,611 27,953
Cardiovascular Surgery 6 11 125,092 124,967 110,618 102,233 110,684 16,233
Emergency Medicine 7 23 128,294 122,395 113,000 104,071 115,919 20,843
General Surgery 14 44 127,123 112,119 94,673 88,397 99,537 20,205
OB/GYN – General 35 159 147,659 132,714 104,431 88,794 110,174 28,850
Neurological Surgery 16 38 130,440 123,642 102,620 93,038 109,726 25,301
Orthopedic Surgery 11 27 225,442 168,773 110,714 90,211 130,731 59,506
Otolaryngology 12 12 120,530 102,689 89,636 80,943 91,291 22,748
Urology 16 25 126,620 111,442 100,376 82,789 99,821 17,687
Vascular Surgery 9 11 122,081 121,186 98,002 86,198 110,851 47,139
Nurse Practitioner and Physician Assistant Subspecialties
Total Compensation (2015)
National Data
Median NP compensation was consistent across major specialty groupings.
14
15
Number of Number of
Group Physician 90th 80th 20th Standard
Specialty Responses Responses Percentile Percentile Median Percentile Mean Deviation
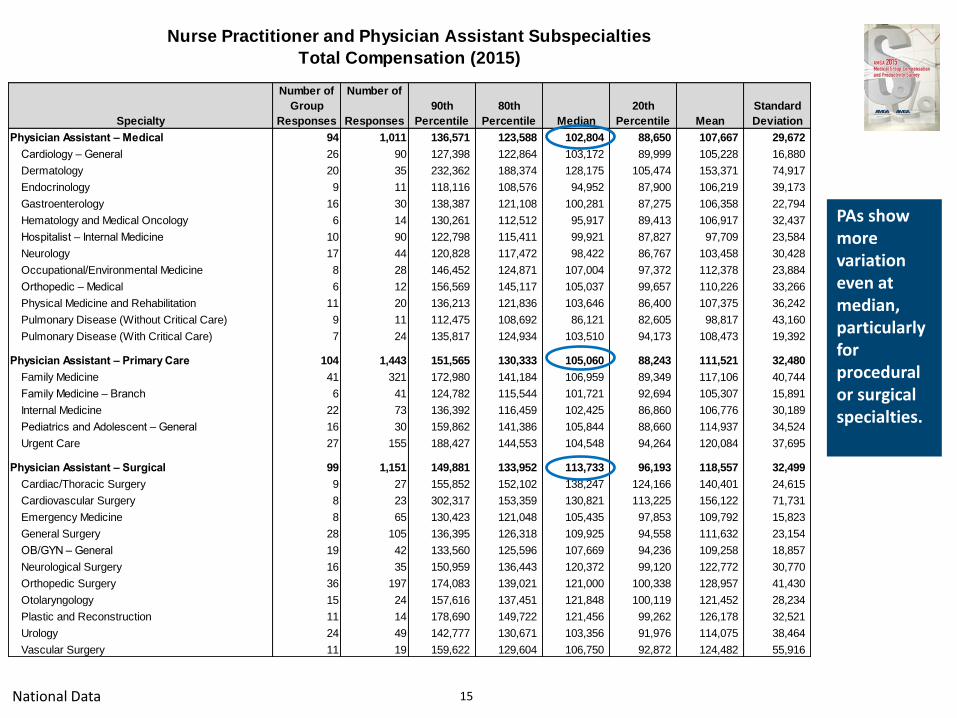
Physician Assistant – Medical 94 1,011 136,571 123,588 102,804 88,650 107,667 29,672
Cardiology – General 26 90 127,398 122,864 103,172 89,999 105,228 16,880
Dermatology 20 35 232,362 188,374 128,175 105,474 153,371 74,917
Endocrinology 9 11 118,116 108,576 94,952 87,900 106,219 39,173
Gastroenterology 16 30 138,387 121,108 100,281 87,275 106,358 22,794
Hematology and Medical Oncology 6 14 130,261 112,512 95,917 89,413 106,917 32,437
Hospitalist – Internal Medicine 10 90 122,798 115,411 99,921 87,827 97,709 23,584
Neurology 17 44 120,828 117,472 98,422 86,767 103,458 30,428
Occupational/Environmental Medicine 8 28 146,452 124,871 107,004 97,372 112,378 23,884
Orthopedic – Medical 6 12 156,569 145,117 105,037 99,657 110,226 33,266
Physical Medicine and Rehabilitation 11 20 136,213 121,836 103,646 86,400 107,375 36,242
Pulmonary Disease (Without Critical Care) 9 11 112,475 108,692 86,121 82,605 98,817 43,160
Pulmonary Disease (With Critical Care) 7 24 135,817 124,934 103,510 94,173 108,473 19,392
Physician Assistant – Primary Care 104 1,443 151,565 130,333 105,060 88,243 111,521 32,480
Family Medicine 41 321 172,980 141,184 106,959 89,349 117,106 40,744
Family Medicine – Branch 6 41 124,782 115,544 101,721 92,694 105,307 15,891
Internal Medicine 22 73 136,392 116,459 102,425 86,860 106,776 30,189
Pediatrics and Adolescent – General 16 30 159,862 141,386 105,844 88,660 114,937 34,524
Urgent Care 27 155 188,427 144,553 104,548 94,264 120,084 37,695
Physician Assistant – Surgical 99 1,151 149,881 133,952 113,733 96,193 118,557 32,499
Cardiac/Thoracic Surgery 9 27 155,852 152,102 138,247 124,166 140,401 24,615
Cardiovascular Surgery 8 23 302,317 153,359 130,821 113,225 156,122 71,731
Emergency Medicine 8 65 130,423 121,048 105,435 97,853 109,792 15,823
General Surgery 28 105 136,395 126,318 109,925 94,558 111,632 23,154
OB/GYN – General 19 42 133,560 125,596 107,669 94,236 109,258 18,857
Neurological Surgery 16 35 150,959 136,443 120,372 99,120 122,772 30,770
Orthopedic Surgery 36 197 174,083 139,021 121,000 100,338 128,957 41,430
Otolaryngology 15 24 157,616 137,451 121,848 100,119 121,452 28,234
Plastic and Reconstruction 11 14 178,690 149,722 121,456 99,262 126,178 32,521
Urology 24 49 142,777 130,671 103,356 91,976 114,075 38,464
Vascular Surgery 11 19 159,622 129,604 106,750 92,872 124,482 55,916
Nurse Practitioner and Physician Assistant Subspecialties
Total Compensation (2015)
National Data
PAs show more variation even at median, particularly for procedural or surgical specialties.
15
16
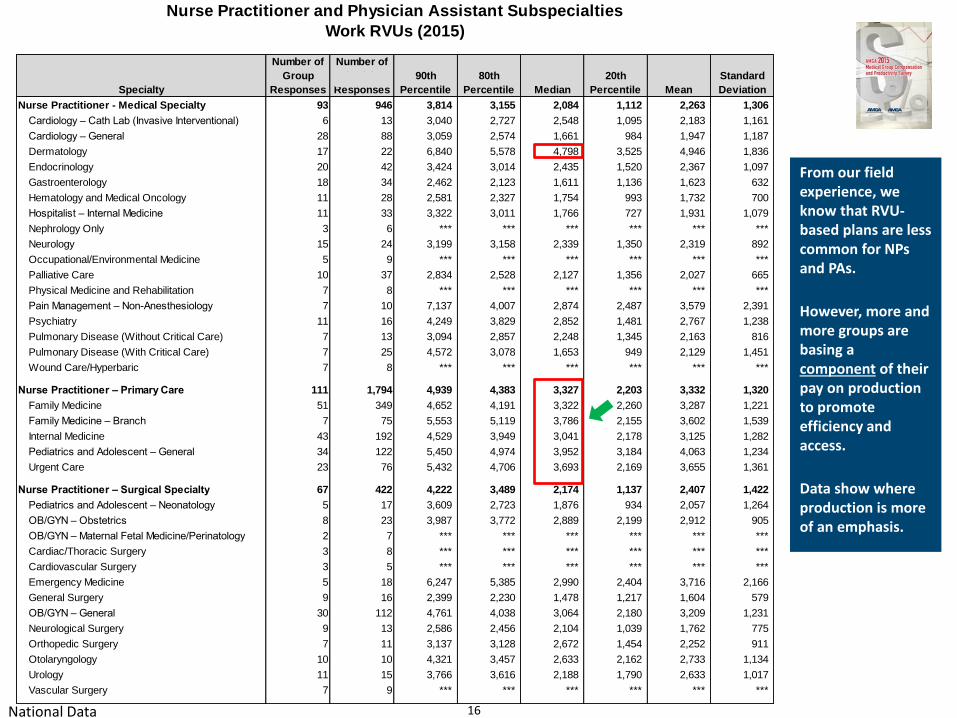
From our field experience, we know that RVU-based plans are less common for NPs and PAs.
However, more and more groups are basing a component of their pay on production to promote efficiency and access.
Data show where production is more of an emphasis.
Number of Number of
Group Physician 90th 80th 20th Standard
Specialty Responses Responses Percentile Percentile Median Percentile Mean Deviation
Nurse Practitioner - Medical Specialty 93 946 3,814 3,155 2,084 1,112 2,263 1,306
Cardiology – Cath Lab (Invasive Interventional) 6 13 3,040 2,727 2,548 1,095 2,183 1,161
Cardiology – General 28 88 3,059 2,574 1,661 984 1,947 1,187
Dermatology 17 22 6,840 5,578 4,798 3,525 4,946 1,836
Endocrinology 20 42 3,424 3,014 2,435 1,520 2,367 1,097
Gastroenterology 18 34 2,462 2,123 1,611 1,136 1,623 632
Hematology and Medical Oncology 11 28 2,581 2,327 1,754 993 1,732 700
Hospitalist – Internal Medicine 11 33 3,322 3,011 1,766 727 1,931 1,079
Nephrology Only 3 6 *** *** *** *** *** ***
Neurology 15 24 3,199 3,158 2,339 1,350 2,319 892
Occupational/Environmental Medicine 5 9 *** *** *** *** *** ***
Palliative Care 10 37 2,834 2,528 2,127 1,356 2,027 665
Physical Medicine and Rehabilitation 7 8 *** *** *** *** *** ***
Pain Management – Non-Anesthesiology 7 10 7,137 4,007 2,874 2,487 3,579 2,391
Psychiatry 11 16 4,249 3,829 2,852 1,481 2,767 1,238
Pulmonary Disease (Without Critical Care) 7 13 3,094 2,857 2,248 1,345 2,163 816
Pulmonary Disease (With Critical Care) 7 25 4,572 3,078 1,653 949 2,129 1,451
Wound Care/Hyperbaric 7 8 *** *** *** *** *** ***
Nurse Practitioner – Primary Care 111 1,794 4,939 4,383 3,327 2,203 3,332 1,320
Family Medicine 51 349 4,652 4,191 3,322 2,260 3,287 1,221
Family Medicine – Branch 7 75 5,553 5,119 3,786 2,155 3,602 1,539
Internal Medicine 43 192 4,529 3,949 3,041 2,178 3,125 1,282
Pediatrics and Adolescent – General 34 122 5,450 4,974 3,952 3,184 4,063 1,234
Urgent Care 23 76 5,432 4,706 3,693 2,169 3,655 1,361
Nurse Practitioner – Surgical Specialty 67 422 4,222 3,489 2,174 1,137 2,407 1,422
Pediatrics and Adolescent – Neonatology 5 17 3,609 2,723 1,876 934 2,057 1,264
OB/GYN – Obstetrics 8 23 3,987 3,772 2,889 2,199 2,912 905
OB/GYN – Maternal Fetal Medicine/Perinatology 2 7 *** *** *** *** *** ***
Cardiac/Thoracic Surgery 3 8 *** *** *** *** *** ***
Cardiovascular Surgery 3 5 *** *** *** *** *** ***
Emergency Medicine 5 18 6,247 5,385 2,990 2,404 3,716 2,166
General Surgery 9 16 2,399 2,230 1,478 1,217 1,604 579
OB/GYN – General 30 112 4,761 4,038 3,064 2,180 3,209 1,231
Neurological Surgery 9 13 2,586 2,456 2,104 1,039 1,762 775
Orthopedic Surgery 7 11 3,137 3,128 2,672 1,454 2,252 911
Otolaryngology 10 10 4,321 3,457 2,633 2,162 2,733 1,134
Urology 11 15 3,766 3,616 2,188 1,790 2,633 1,017
Vascular Surgery 7 9 *** *** *** *** *** ***
Nurse Practitioner and Physician Assistant Subspecialties
Work RVUs (2015)
National Data 16
17
Number of Number of
Group Physician 90th 80th 20th Standard
Specialty Responses Responses Percentile Percentile Median Percentile Mean Deviation
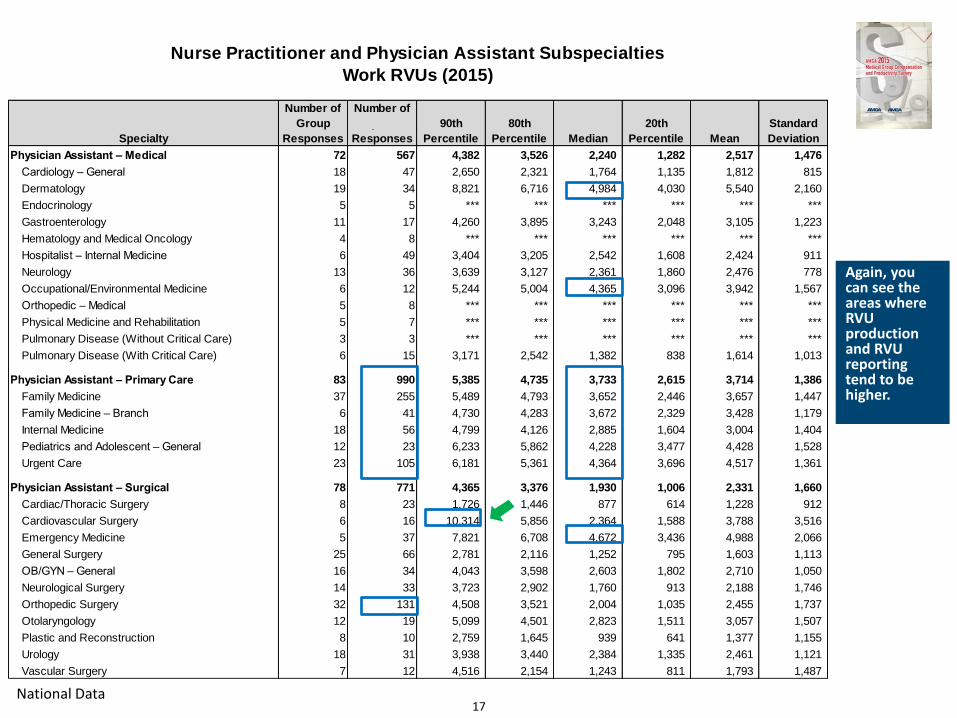
Physician Assistant – Medical 72 567 4,382 3,526 2,240 1,282 2,517 1,476
Cardiology – General 18 47 2,650 2,321 1,764 1,135 1,812 815
Dermatology 19 34 8,821 6,716 4,984 4,030 5,540 2,160
Endocrinology 5 5 *** *** *** *** *** ***
Gastroenterology 11 17 4,260 3,895 3,243 2,048 3,105 1,223
Hematology and Medical Oncology 4 8 *** *** *** *** *** ***
Hospitalist – Internal Medicine 6 49 3,404 3,205 2,542 1,608 2,424 911
Neurology 13 36 3,639 3,127 2,361 1,860 2,476 778
Occupational/Environmental Medicine 6 12 5,244 5,004 4,365 3,096 3,942 1,567
Orthopedic – Medical 5 8 *** *** *** *** *** ***
Physical Medicine and Rehabilitation 5 7 *** *** *** *** *** ***
Pulmonary Disease (Without Critical Care) 3 3 *** *** *** *** *** ***
Pulmonary Disease (With Critical Care) 6 15 3,171 2,542 1,382 838 1,614 1,013
Physician Assistant – Primary Care 83 990 5,385 4,735 3,733 2,615 3,714 1,386
Family Medicine 37 255 5,489 4,793 3,652 2,446 3,657 1,447
Family Medicine – Branch 6 41 4,730 4,283 3,672 2,329 3,428 1,179
Internal Medicine 18 56 4,799 4,126 2,885 1,604 3,004 1,404
Pediatrics and Adolescent – General 12 23 6,233 5,862 4,228 3,477 4,428 1,528
Urgent Care 23 105 6,181 5,361 4,364 3,696 4,517 1,361
Physician Assistant – Surgical 78 771 4,365 3,376 1,930 1,006 2,331 1,660
Cardiac/Thoracic Surgery 8 23 1,726 1,446 877 614 1,228 912
Cardiovascular Surgery 6 16 10,314 5,856 2,364 1,588 3,788 3,516
Emergency Medicine 5 37 7,821 6,708 4,672 3,436 4,988 2,066
General Surgery 25 66 2,781 2,116 1,252 795 1,603 1,113
OB/GYN – General 16 34 4,043 3,598 2,603 1,802 2,710 1,050
Neurological Surgery 14 33 3,723 2,902 1,760 913 2,188 1,746
Orthopedic Surgery 32 131 4,508 3,521 2,004 1,035 2,455 1,737
Otolaryngology 12 19 5,099 4,501 2,823 1,511 3,057 1,507
Plastic and Reconstruction 8 10 2,759 1,645 939 641 1,377 1,155
Urology 18 31 3,938 3,440 2,384 1,335 2,461 1,121
Vascular Surgery 7 12 4,516 2,154 1,243 811 1,793 1,487
Nurse Practitioner and Physician Assistant Subspecialties
Work RVUs (2015)
Again, you can see the areas where RVU production and RVU reporting tend to be higher.
National Data 17
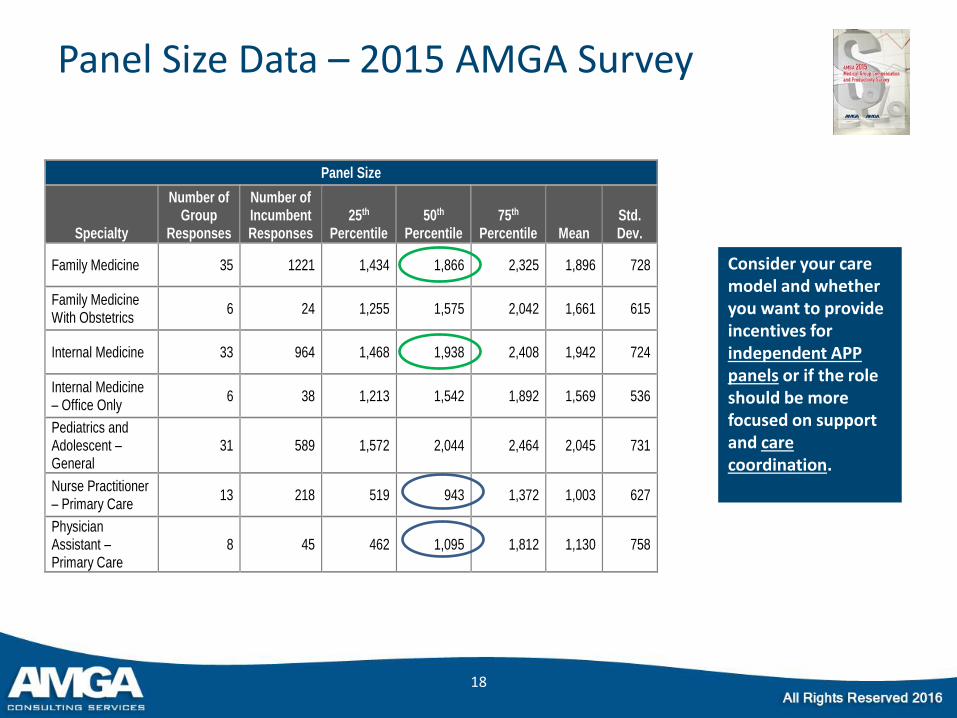
Panel Size Data – 2015 AMGA Survey
18
Panel Size
Specialty
Number of Group
Responses
Number of Incumbent Responses
25th Percentile
50th Percentile
75th Percentile Mean
Std. Dev.
Family Medicine 35 1221 1,434 1,866 2,325 1,896 728
Family Medicine With Obstetrics
6 24 1,255 1,575 2,042 1,661 615
Internal Medicine 33 964 1,468 1,938 2,408 1,942 724
Internal Medicine – Office Only
6 38 1,213 1,542 1,892 1,569 536
Pediatrics and Adolescent – General
31 589 1,572 2,044 2,464 2,045 731
Nurse Practitioner – Primary Care
13 218 519 943 1,372 1,003 627
Physician Assistant – Primary Care
8 45 462 1,095 1,812 1,130 758
Consider your care model and whether you want to provide incentives for independent APP panels or if the role should be more focused on support and care coordination.
APP Compensation Models
19
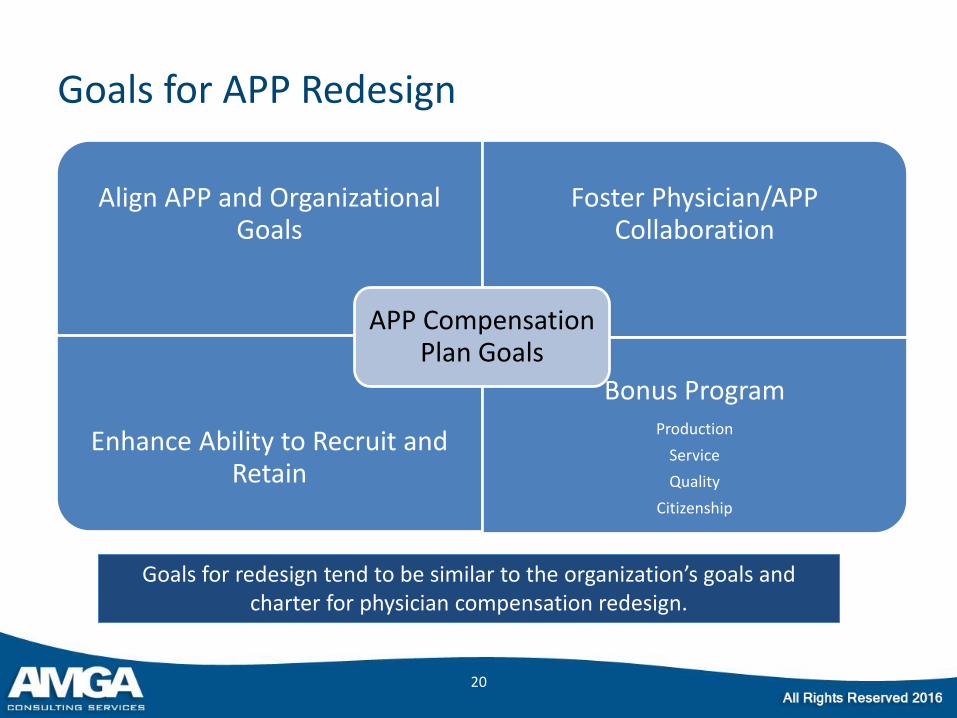
Goals for APP Redesign
Align APP and Organizational Goals
Foster Physician/APP Collaboration
Enhance Ability to Recruit and Retain
Bonus Program Production
Service
Quality
Citizenship
APP Compensation Plan Goals
20
Goals for redesign tend to be similar to the organization’s goals and charter for physician compensation redesign.
APP Compensation Models
• Even though there is great emphasis on value-based models and increased use of APPs, their compensation models have evolved slowly and differently from physicians.
• Creates a more acute need to manage transitions and implement multi-year plans that are typically not a one-size fits all.
21
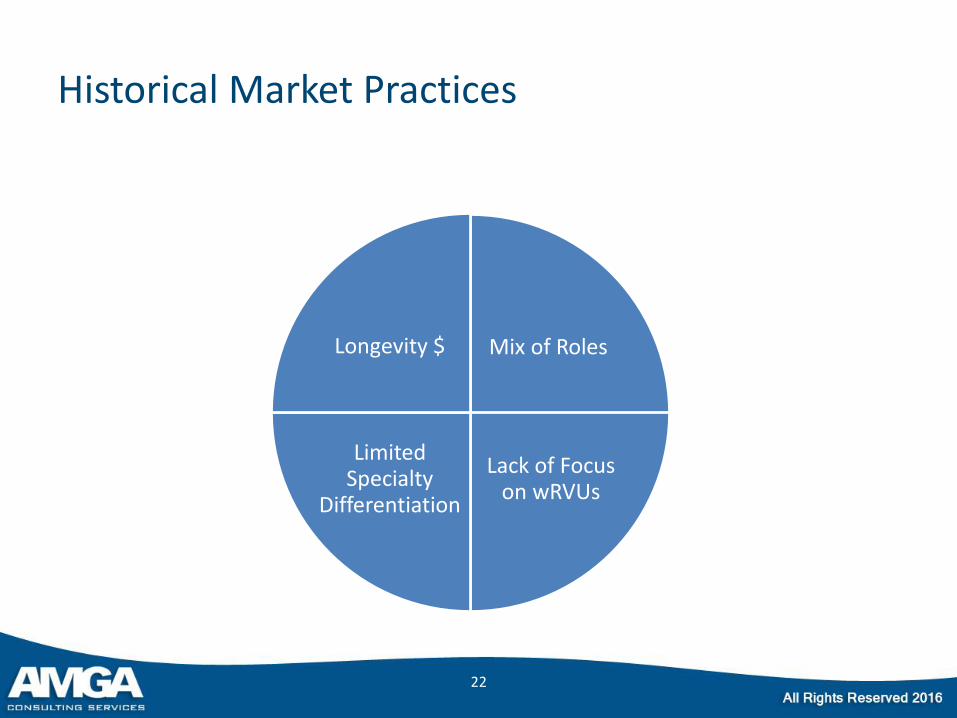
Historical Market Practices
Mix of Roles
Lack of Focus on wRVUs
Limited Specialty
Differentiation
Longevity $
22
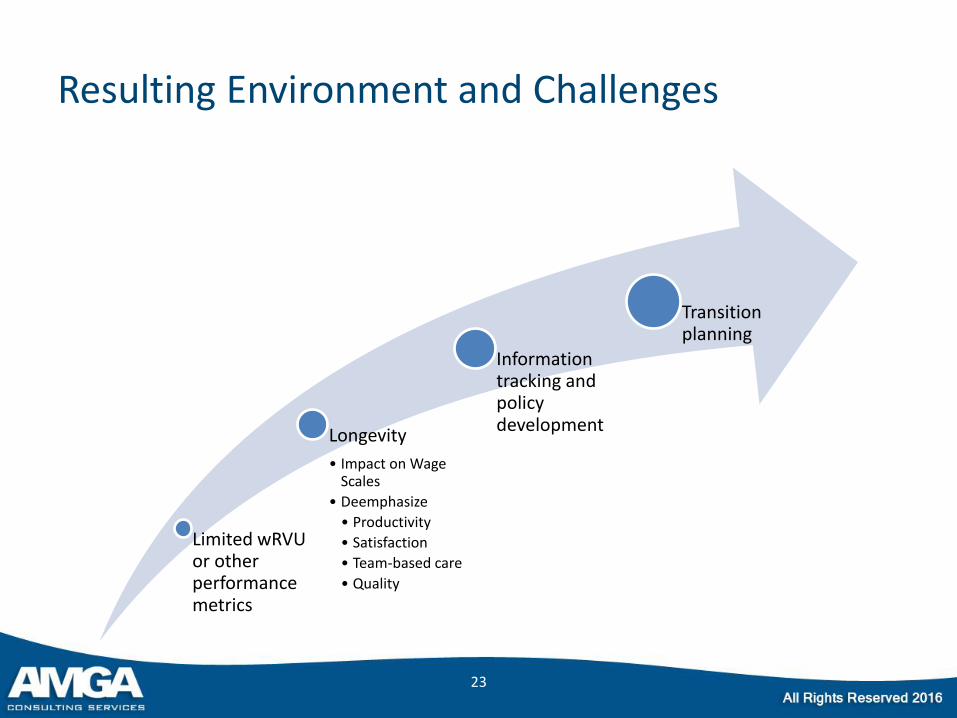
Resulting Environment and Challenges
Limited wRVU or other performance metrics
Longevity
• Impact on Wage Scales
• Deemphasize
• Productivity
• Satisfaction
• Team-based care
• Quality
Information tracking and policy development
Transition planning
23
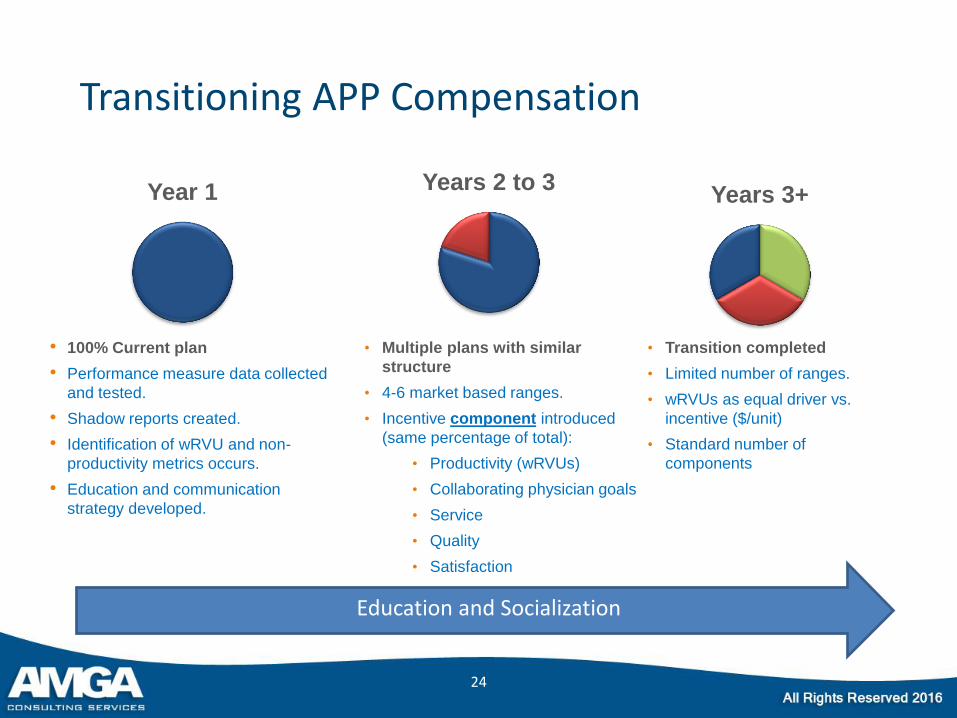
Year 1 Years 2 to 3 Years 3+
• 100% Current plan
• Performance measure data collected
and tested.
• Shadow reports created.
• Identification of wRVU and non-
productivity metrics occurs.
• Education and communication
strategy developed.
• Multiple plans with similar
structure
• 4-6 market based ranges.
• Incentive component introduced
(same percentage of total):
• Productivity (wRVUs)
• Collaborating physician goals
• Service
• Quality
• Satisfaction
• Transition completed
• Limited number of ranges.
• wRVUs as equal driver vs.
incentive ($/unit)
• Standard number of
components
24
Transitioning APP Compensation
Education and Socialization
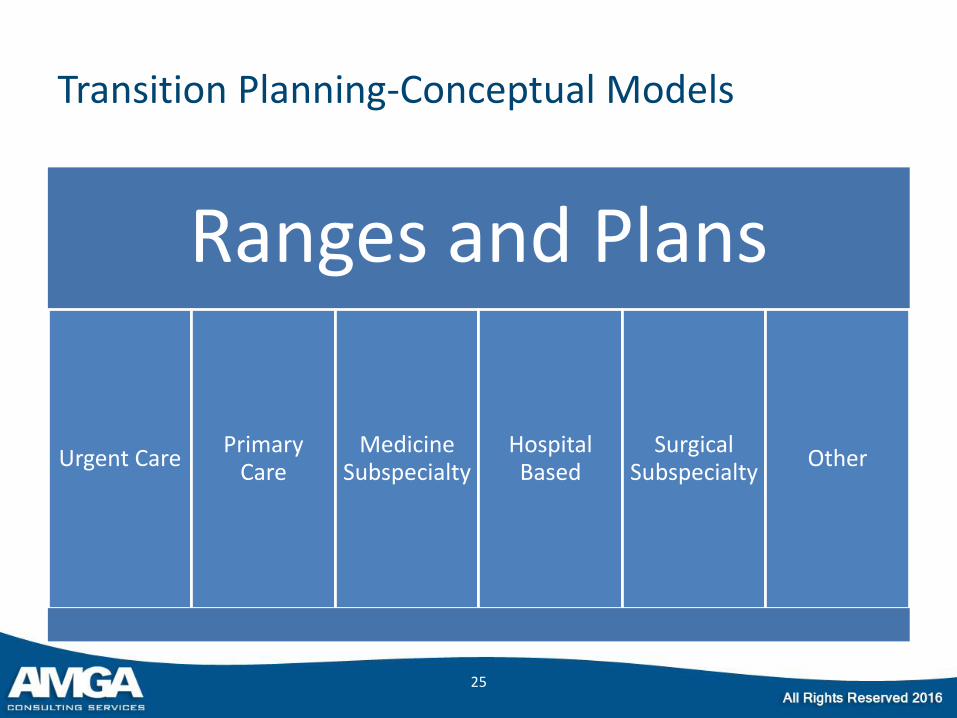
Transition Planning-Conceptual Models
Ranges and Plans
Urgent Care Primary
Care Medicine
Subspecialty Hospital Based
Surgical Subspecialty
Other
25
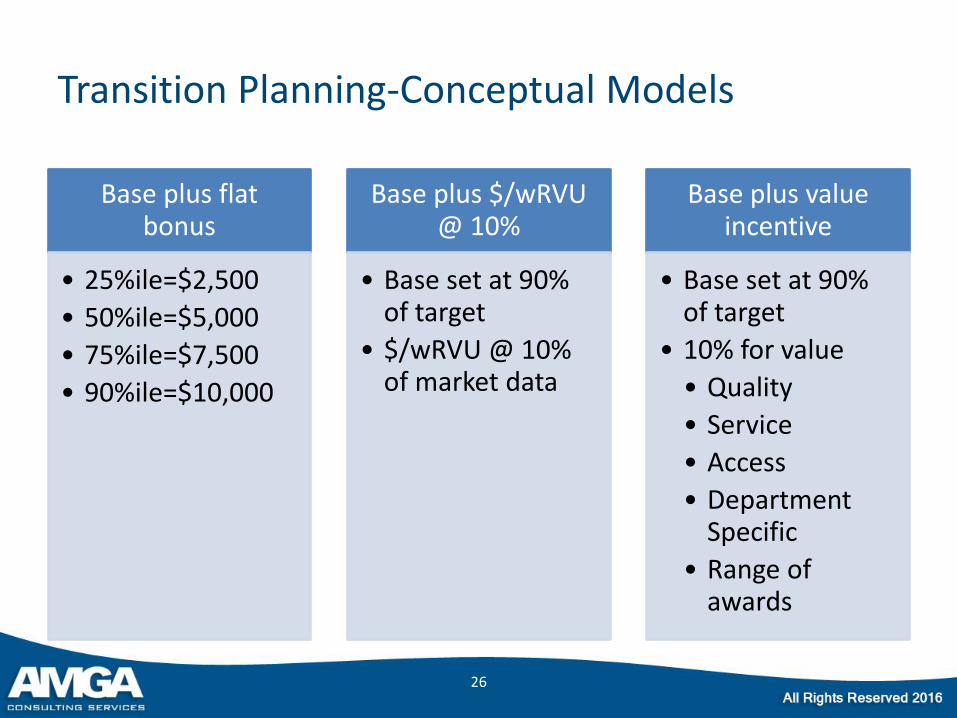
Transition Planning-Conceptual Models
Base plus flat bonus
• 25%ile=$2,500
• 50%ile=$5,000
• 75%ile=$7,500
• 90%ile=$10,000
Base plus $/wRVU @ 10%
• Base set at 90% of target
• $/wRVU @ 10% of market data
Base plus value incentive
• Base set at 90% of target
• 10% for value
• Quality
• Service
• Access
• Department Specific
• Range of awards
26
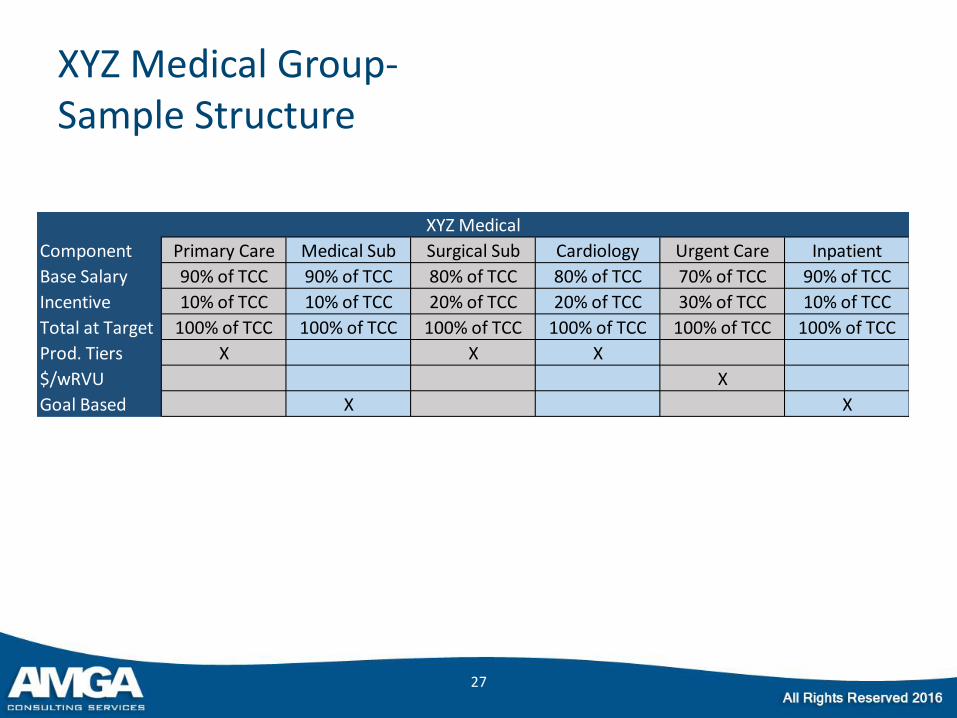
XYZ Medical Group- Sample Structure
27
Component Primary Care Medical Sub Surgical Sub Cardiology Urgent Care Inpatient
Base Salary 90% of TCC 90% of TCC 80% of TCC 80% of TCC 70% of TCC 90% of TCC
Incentive 10% of TCC 10% of TCC 20% of TCC 20% of TCC 30% of TCC 10% of TCC
Total at Target 100% of TCC 100% of TCC 100% of TCC 100% of TCC 100% of TCC 100% of TCC
Prod. Tiers X X X
$/wRVU X
Goal Based X X
XYZ Medical
Salary Plus Production Tiers
• If your intent is to provide some incentive for increased productivity or access but to prevent competition with other providers (physicians), this approach may be helpful
• Consider three or four tiers and work with market data (for example):
– Tier 1 (P25 production): Base plus $3,000
– Tier 2 (P50 production): Base plus $6,000
– Tier 3 (P75 production): Base plus $9,000
– Tier 4 (P90 production): Base plus $12,000
• Consider total market compensation; base salary needs to be a reasonable starting point
• Incentive linked to performance to create aligned Total Cash Compensation
28
These tiers may vary by specialty and by your base salary starting point (compensation philosophy).
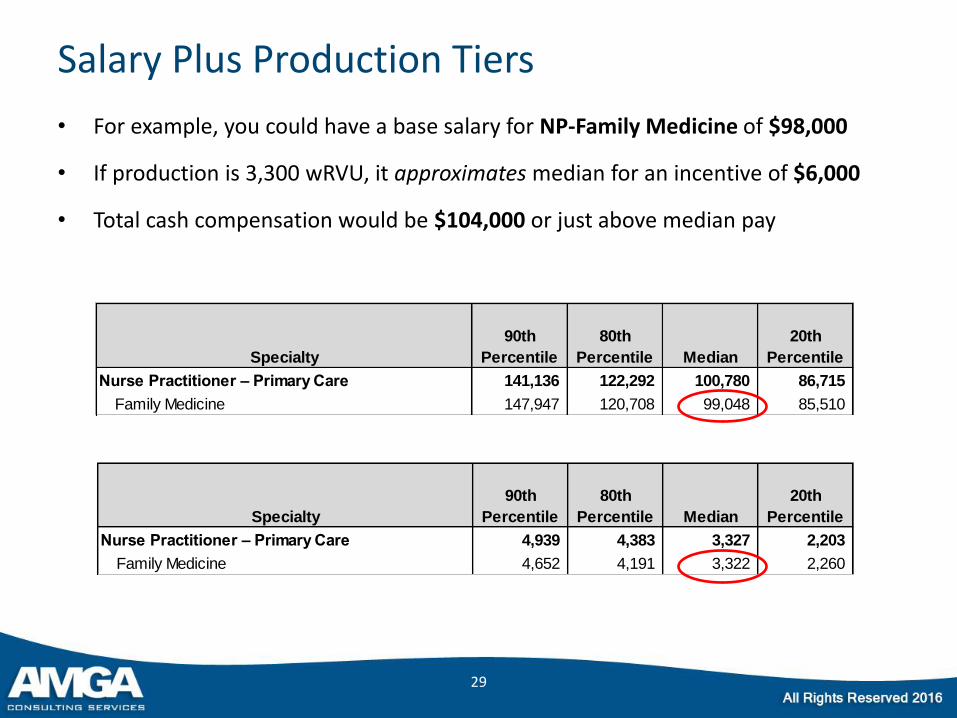
Salary Plus Production Tiers
• For example, you could have a base salary for NP-Family Medicine of $98,000
• If production is 3,300 wRVU, it approximates median for an incentive of $6,000
• Total cash compensation would be $104,000 or just above median pay
29
90th 80th 20th
Specialty Percentile Percentile Median Percentile
Nurse Practitioner – Primary Care 141,136 122,292 100,780 86,715
Family Medicine 147,947 120,708 99,048 85,510
90th 80th 20th
Specialty Percentile Percentile Median Percentile
Nurse Practitioner – Primary Care 4,939 4,383 3,327 2,203
Family Medicine 4,652 4,191 3,322 2,260
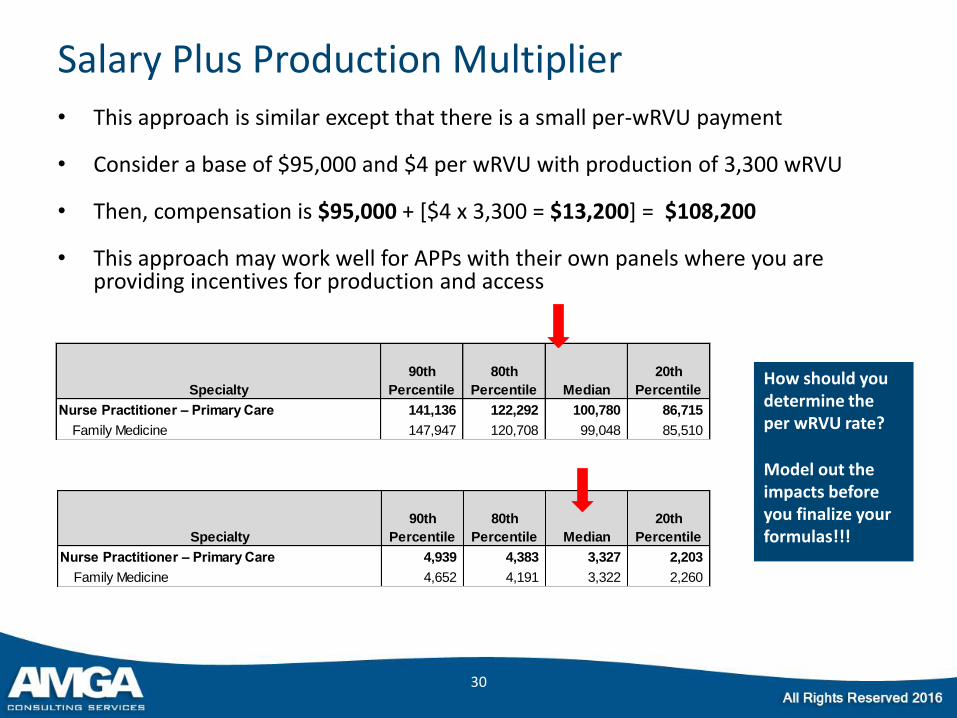
Salary Plus Production Multiplier • This approach is similar except that there is a small per-wRVU payment
• Consider a base of $95,000 and $4 per wRVU with production of 3,300 wRVU
• Then, compensation is $95,000 + [$4 x 3,300 = $13,200] = $108,200
• This approach may work well for APPs with their own panels where you are providing incentives for production and access
30
90th 80th 20th
Specialty Percentile Percentile Median Percentile
Nurse Practitioner – Primary Care 141,136 122,292 100,780 86,715
Family Medicine 147,947 120,708 99,048 85,510
90th 80th 20th
Specialty Percentile Percentile Median Percentile
Nurse Practitioner – Primary Care 4,939 4,383 3,327 2,203
Family Medicine 4,652 4,191 3,322 2,260
How should you determine the per wRVU rate?
Model out the impacts before you finalize your formulas!!!
Salary Plus Production and Quality Incentive
• In team-based care settings, you may wish to evolve to models more similar to physician pay formulas
• Again, think about what you are trying to accomplish with the model
• Consider, for example, the continuum of care for chronic populations like heart failure and cardiology NP/PA roles where you want to promote:
– Quality care provision
– Patient education
– Coordination of inpatient/outpatient/home-based care
– [Notice that wRVU productivity hasn’t been mentioned yet ]
31
Salary Plus Production and Quality Incentive
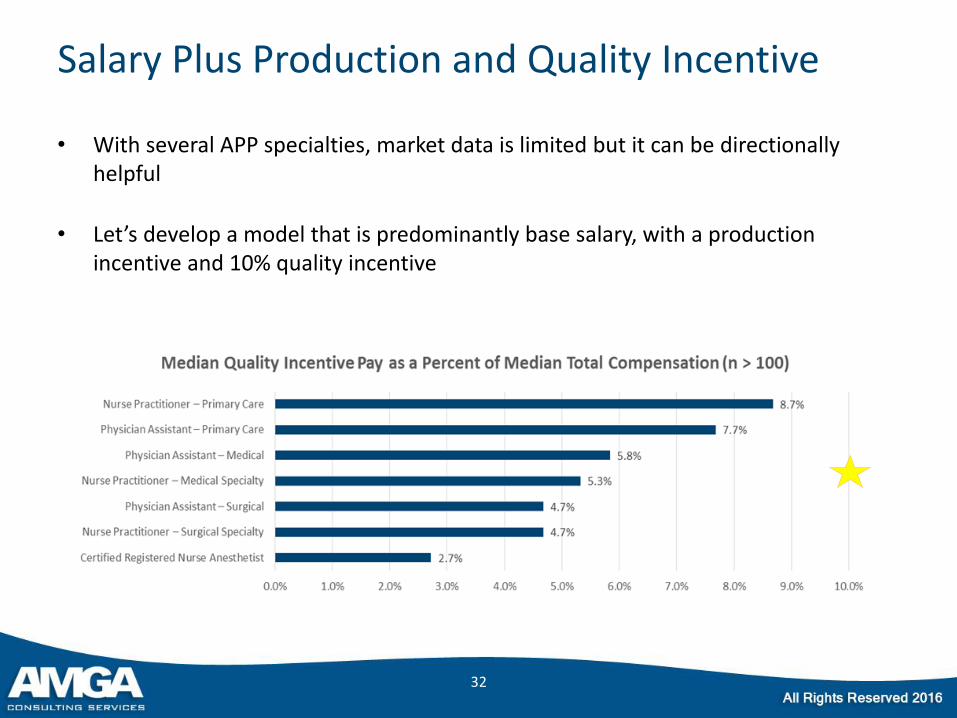
• With several APP specialties, market data is limited but it can be directionally helpful
• Let’s develop a model that is predominantly base salary, with a production incentive and 10% quality incentive
32
Salary Plus Production and Quality Incentive
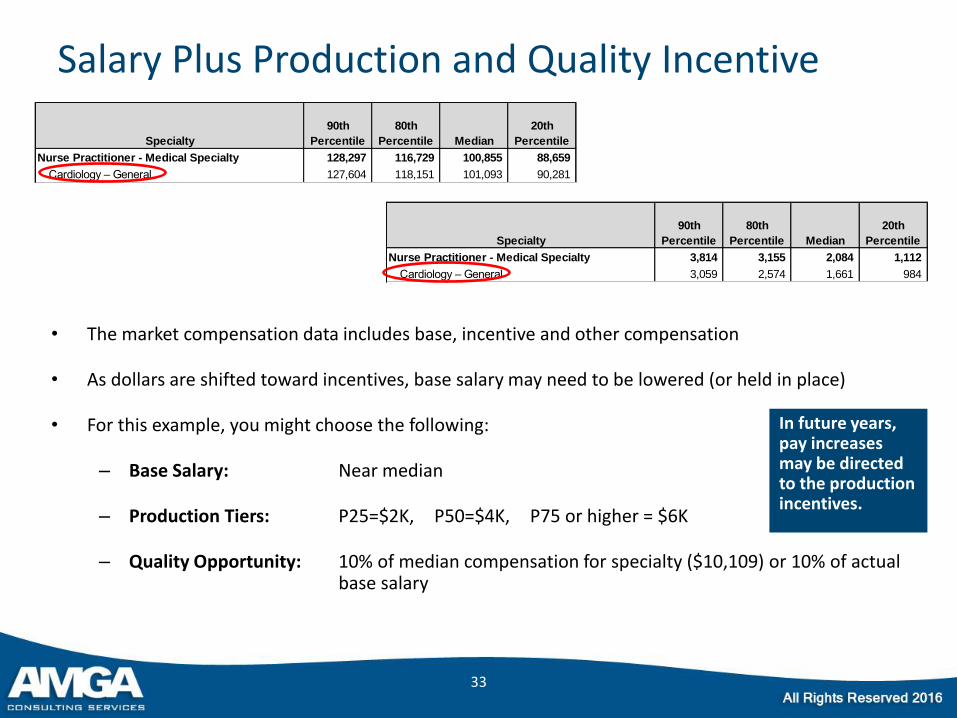
• The market compensation data includes base, incentive and other compensation
• As dollars are shifted toward incentives, base salary may need to be lowered (or held in place)
• For this example, you might choose the following:
– Base Salary: Near median
– Production Tiers: P25=$2K, P50=$4K, P75 or higher = $6K
– Quality Opportunity: 10% of median compensation for specialty ($10,109) or 10% of actual base salary
33
90th 80th 20th
Specialty Percentile Percentile Median Percentile
Nurse Practitioner - Medical Specialty 3,814 3,155 2,084 1,112
Cardiology – General 3,059 2,574 1,661 984
90th 80th 20th
Specialty Percentile Percentile Median Percentile
Nurse Practitioner - Medical Specialty 128,297 116,729 100,855 88,659
Cardiology – General 127,604 118,151 101,093 90,281
In future years, pay increases may be directed to the production incentives.
Salary Plus Production and Quality Incentive
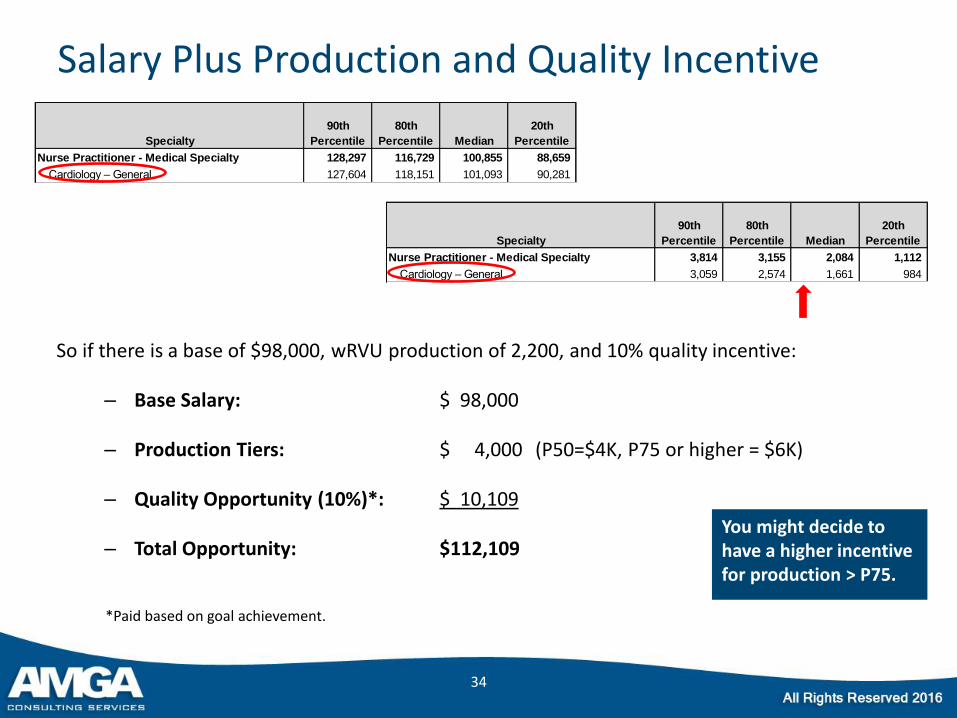
So if there is a base of $98,000, wRVU production of 2,200, and 10% quality incentive:
– Base Salary: $ 98,000
– Production Tiers: $ 4,000 (P50=$4K, P75 or higher = $6K)
– Quality Opportunity (10%)*: $ 10,109
– Total Opportunity: $112,109
34
90th 80th 20th
Specialty Percentile Percentile Median Percentile
Nurse Practitioner - Medical Specialty 3,814 3,155 2,084 1,112
Cardiology – General 3,059 2,574 1,661 984
90th 80th 20th
Specialty Percentile Percentile Median Percentile
Nurse Practitioner - Medical Specialty 128,297 116,729 100,855 88,659
Cardiology – General 127,604 118,151 101,093 90,281
You might decide to have a higher incentive for production > P75.
*Paid based on goal achievement.
APP Compensation Models
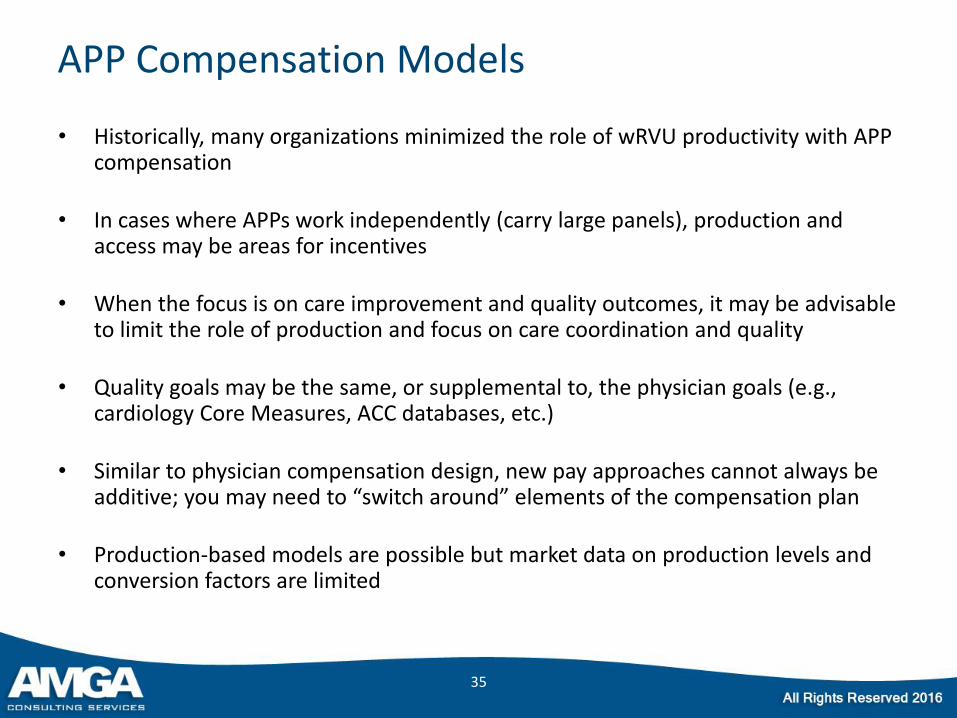
• Historically, many organizations minimized the role of wRVU productivity with APP compensation
• In cases where APPs work independently (carry large panels), production and access may be areas for incentives
• When the focus is on care improvement and quality outcomes, it may be advisable to limit the role of production and focus on care coordination and quality
• Quality goals may be the same, or supplemental to, the physician goals (e.g., cardiology Core Measures, ACC databases, etc.)
• Similar to physician compensation design, new pay approaches cannot always be additive; you may need to “switch around” elements of the compensation plan
• Production-based models are possible but market data on production levels and conversion factors are limited
35
Physician Compensation to Support Team-based Care
36
APP Supervisory Compensation
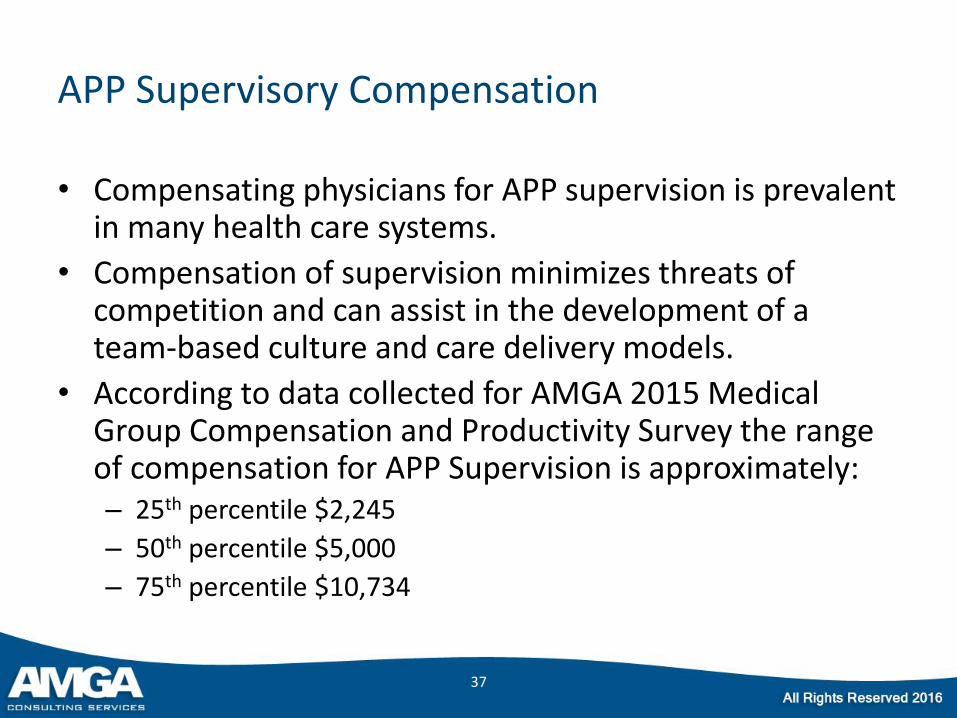
• Compensating physicians for APP supervision is prevalent in many health care systems.
• Compensation of supervision minimizes threats of competition and can assist in the development of a team-based culture and care delivery models.
• According to data collected for AMGA 2015 Medical Group Compensation and Productivity Survey the range of compensation for APP Supervision is approximately: – 25th percentile $2,245
– 50th percentile $5,000
– 75th percentile $10,734
37
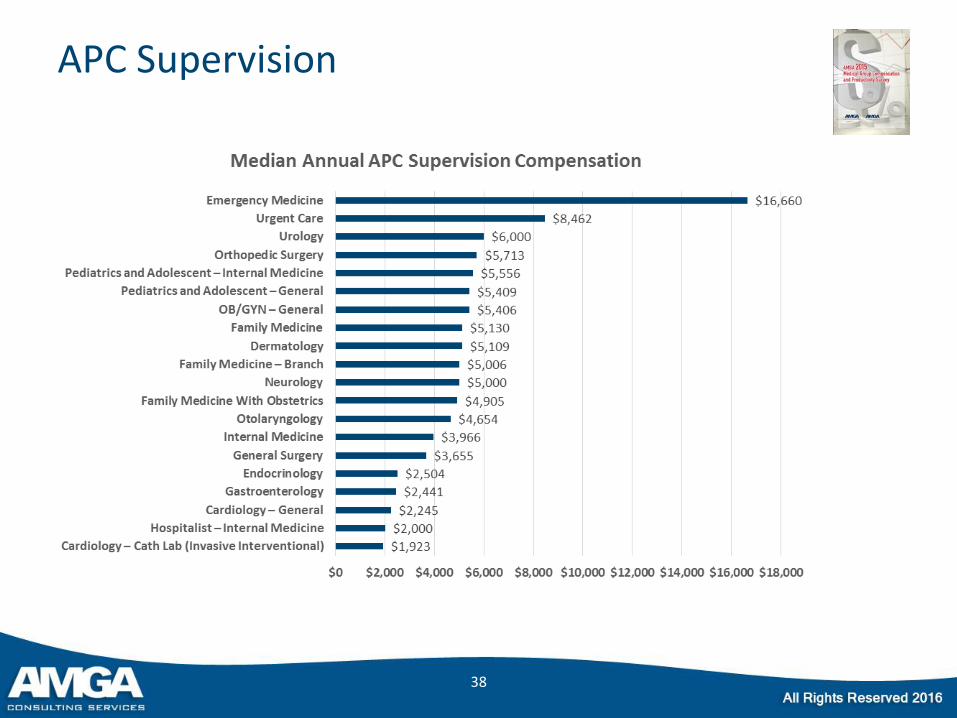
APC Supervision
38
Team-based Models
• Stipend for supervision
• Tiered bonus based upon “team” panel
• Tiered bonus based upon “team” goals
– Quality
– Satisfaction
– Access
39
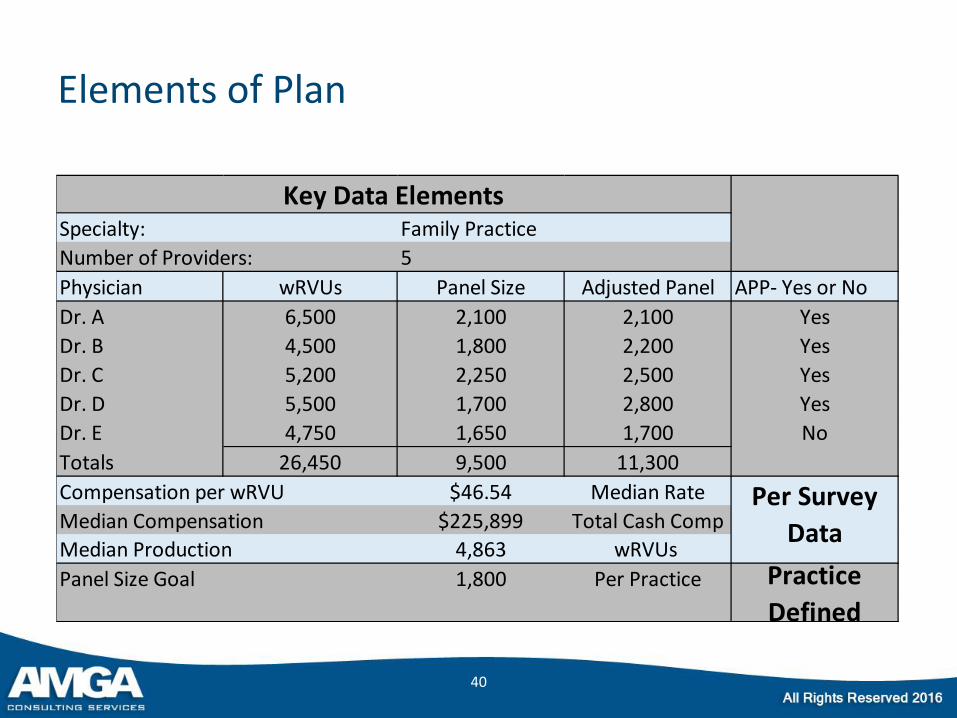
Elements of Plan
40
Specialty: Family Practice
Number of Providers: 5
Physician wRVUs Panel Size Adjusted Panel APP- Yes or No
Dr. A 6,500 2,100 2,100 Yes
Dr. B 4,500 1,800 2,200 Yes
Dr. C 5,200 2,250 2,500 Yes
Dr. D 5,500 1,700 2,800 Yes
Dr. E 4,750 1,650 1,700 No
Totals 26,450 9,500 11,300
Compensation per wRVU $46.54 Median Rate
Median Compensation $225,899 Total Cash Comp
Median Production 4,863 wRVUs
Panel Size Goal 1,800 Per Practice
Per Survey
Data
Practice
Defined
Key Data Elements
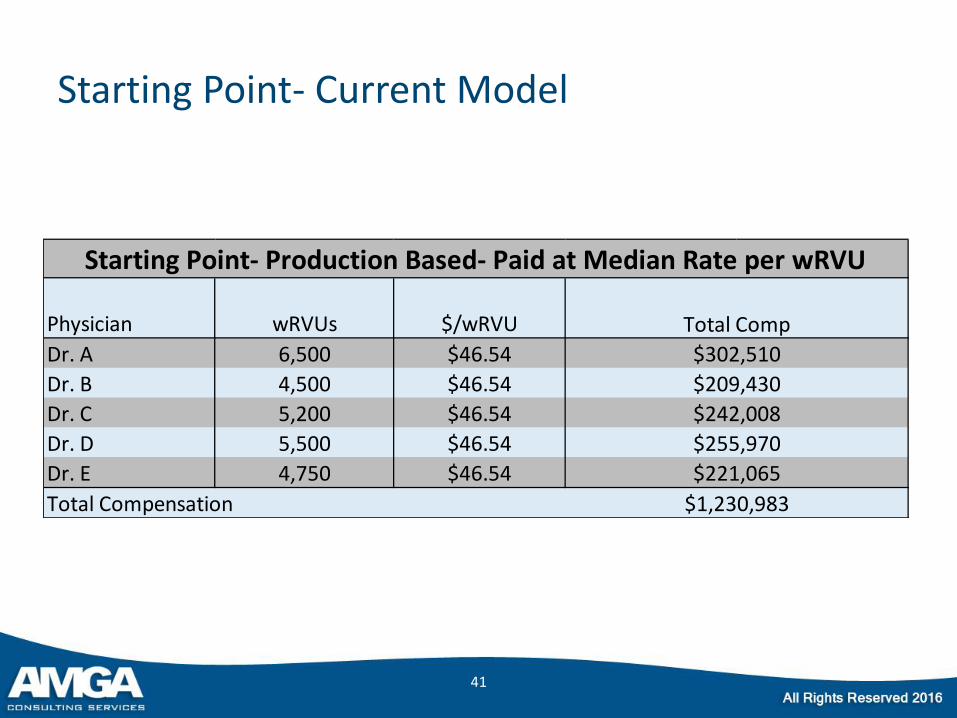
Starting Point- Current Model
41
Physician wRVUs $/wRVU
Dr. A 6,500 $46.54
Dr. B 4,500 $46.54
Dr. C 5,200 $46.54
Dr. D 5,500 $46.54
Dr. E 4,750 $46.54
Total Compensation
Starting Point- Production Based- Paid at Median Rate per wRVU
Total Comp
$302,510
$209,430
$242,008
$255,970
$221,065
$1,230,983
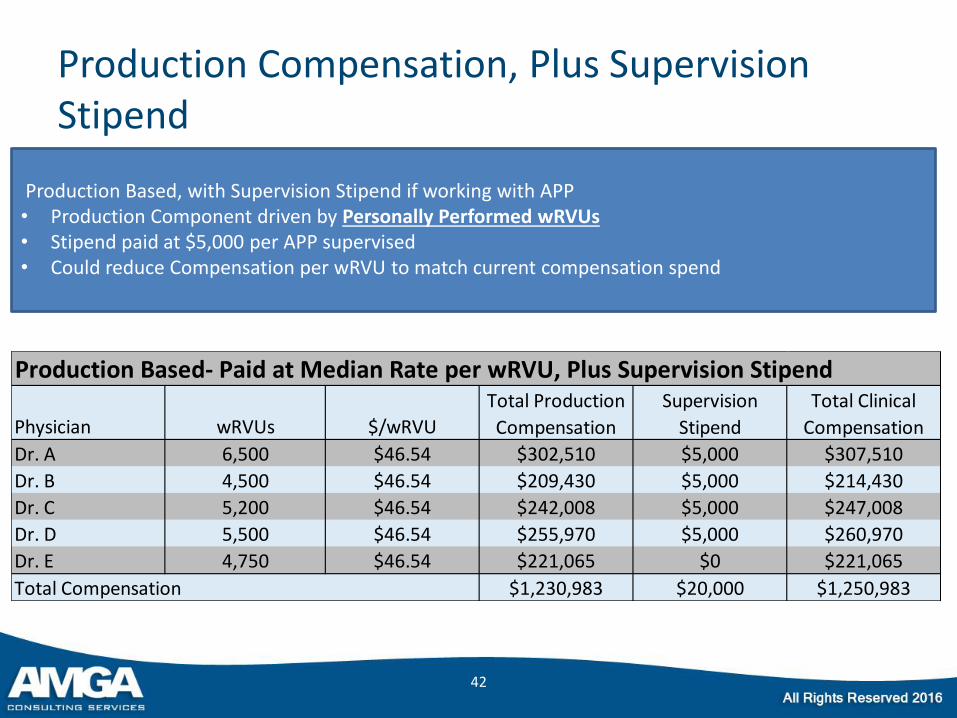
Production Compensation, Plus Supervision Stipend
42
Production Based, with Supervision Stipend if working with APP • Production Component driven by Personally Performed wRVUs • Stipend paid at $5,000 per APP supervised • Could reduce Compensation per wRVU to match current compensation spend
Production Based- Paid at Median Rate per wRVU, Plus Supervision Stipend
Physician wRVUs $/wRVU
Dr. A 6,500 $46.54 $302,510 $5,000 $307,510
Dr. B 4,500 $46.54 $209,430 $5,000 $214,430
Dr. C 5,200 $46.54 $242,008 $5,000 $247,008
Dr. D 5,500 $46.54 $255,970 $5,000 $260,970
Dr. E 4,750 $46.54 $221,065 $0 $221,065
Total Compensation $1,230,983 $20,000 $1,250,983
Total Clinical
Compensation
Total Production
Compensation
Supervision
Stipend

Production, with Team Panel Size
43
Production Based, with Panel Size bonus opportunity • Production Component driven by Personally Performed wRVUs • Panel bonus is based upon Physician and APP shared panel • May wish to align APP incentives with similar bonus opportunity (with reduced bonus level)
Bonus Panel Size Award
Level 1 <2,500 $0
Level 2 2,500 to 2,750 $5,000
Level 3 2,751 to 3,000 $10,000
Level 4 3,001 and over $15,000
Physician Panel NP Panel Team Panel wRVUs $/wRVU Prod $ Bonus Total $ wRVU Model $ Difference
Dr. A 2,100 NP A 1,200 3,300 6,500 $46.54 $302,510 $15,000 $317,510 $302,510 $15,000
Dr. B 1,800 NP B 1,400 3,200 4,500 $46.54 $209,430 $15,000 $224,430 $209,430 $15,000
Dr. C 2,250 NP C 900 3,150 5,200 $46.54 $242,008 $15,000 $257,008 $242,008 $15,000
Dr. D 1,700 NP D 800 2,500 5,500 $46.54 $255,970 $5,000 $260,970 $255,970 $5,000
Dr. E 1,650 None 0 1,650 4,750 $46.54 $221,065 $0 $221,065 $221,065 $0
Total Compensation $1,280,983 $1,230,983 $50,000
Model Impact
Team Based Care Model- Physician Paid Median Per wRVU, Plus bonus for Team-based Panel Size
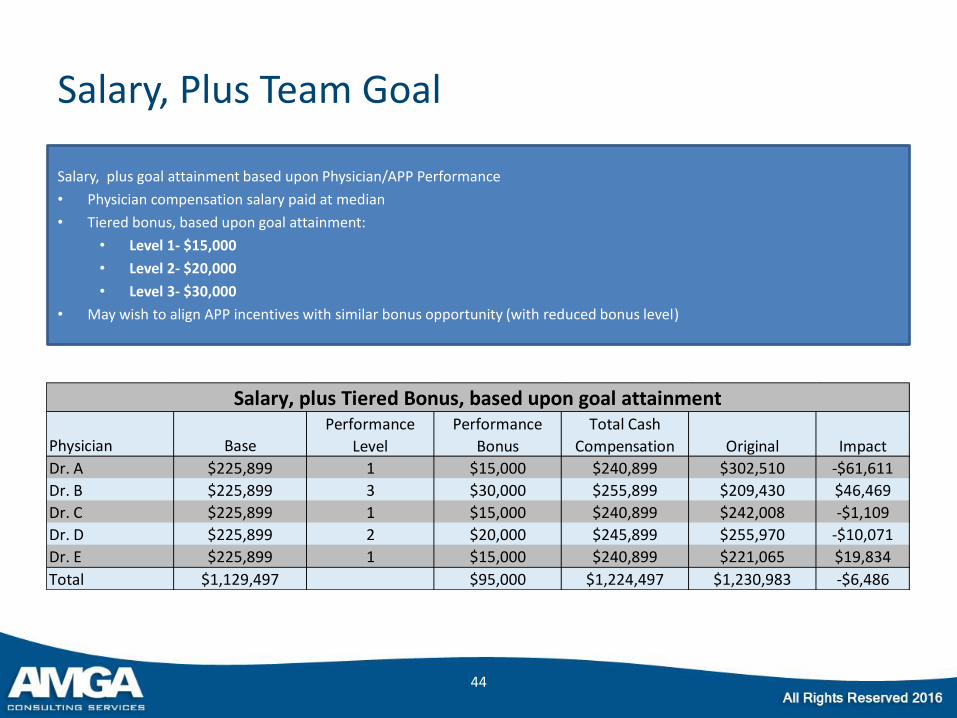
Salary, Plus Team Goal
44
Salary, plus goal attainment based upon Physician/APP Performance
• Physician compensation salary paid at median
• Tiered bonus, based upon goal attainment:
• Level 1- $15,000
• Level 2- $20,000
• Level 3- $30,000
• May wish to align APP incentives with similar bonus opportunity (with reduced bonus level)
Physician Base
Dr. A $225,899 1 $15,000 $240,899 $302,510 -$61,611
Dr. B $225,899 3 $30,000 $255,899 $209,430 $46,469
Dr. C $225,899 1 $15,000 $240,899 $242,008 -$1,109
Dr. D $225,899 2 $20,000 $245,899 $255,970 -$10,071
Dr. E $225,899 1 $15,000 $240,899 $221,065 $19,834
Total $1,129,497 $95,000 $1,224,497 $1,230,983 -$6,486
Performance
Bonus
Total Cash
Compensation Original Impact
Performance
Level
Salary, plus Tiered Bonus, based upon goal attainment
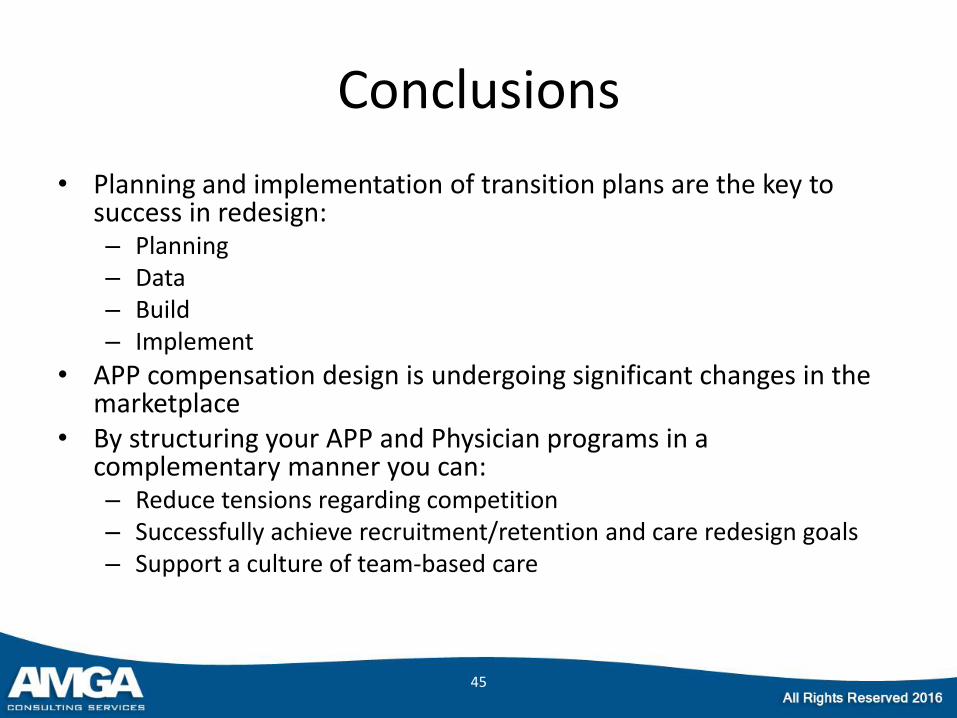
Conclusions
• Planning and implementation of transition plans are the key to success in redesign: – Planning – Data – Build – Implement
• APP compensation design is undergoing significant changes in the marketplace
• By structuring your APP and Physician programs in a complementary manner you can: – Reduce tensions regarding competition – Successfully achieve recruitment/retention and care redesign goals – Support a culture of team-based care
45


![3 AMGA Manager AMGA Hands-on 20110916 v2.ppt [호환 모드] · 09/06/2011 The Plan of AMGA Manager for Belle II 1.User Friendly Interface 2.Fast AMGA Connections 3.Powerful Schema](https://img.pdfslide.us/doc/110x75/5ed328981270b562de153f3c/3-amga-manager-amga-hands-on-20110916-v2ppt-eeoe-09062011-the-plan.jpg)