Embed Size (px)
Citation preview
COMPENSATION DISCUSSION & ANALYSISEXTRACT FROM THE BCE 2016 MANAGEMENT PROXY CIRCULAR DATED MARCH 3, 2016
BCE Inc. 2016 PROXY CIRCULAR 45
9 Compensation Discussion & AnalysisThis section describes our compensation philosophy, policies and programs and discusses the compensation provided in 2015 to our President and CEO, our current CFO, our former CFO, and our three other most highly compensated executive officers. In 2015 these executive officers continued to grow and contribute to the success of Bell. They are referred to in this document as the “NEOs” and are as follows:
• George A. Cope, President and CEO
• Glen LeBlanc, EVP and CFO
• Siim A. Vanaselja, Former EVP and CFO
• Wade Oosterman, Group President Bell Canada and BCE and Chief Brand Officer
• John Watson, EVP Customer Experience
• Stephen Howe, EVP and Chief Technology Officer
Effective June 26, 2015, Mr. Vanaselja retired after serving more than 14 years as Bell’s long-time CFO. At the same time, Mr. LeBlanc was appointed CFO after having the benefit of working very closely within the finance team and with Mr. Vanaselja since the announcement of the CFO transition in late 2014.
9.1 Overall objective of the executive compensation programOur executive compensation is based on a pay-for-performance philosophy. Its overall goal is to create sustainable value for shareholders by:
• attracting, motivating and retaining the executive officers needed to drive the business strategy; and
• rewarding them for financial and operating performance and leadership excellence.
9.2 Setting executive compensationThe roles of management and the Compensation Committee in setting and administering executive compensation are described below.
MANAGEMENT COMPENSATION COMMITTEE
• Proposes the elements of a compensation program that supports a performance culture without undue risk taking
• Implements the processes required to administer the program• Manages the process to establish performance objectives and to measure
individual and corporate performance against set objectives• Provides the Compensation Committee with an assessment of the results
achieved by each of the executive officers, as well as an assessment of the leadership attributes each demonstrates in fulfilling his or her roles and responsibilities
• Recommends to the Compensation Committee the base salary as well as the annual short- and long-term incentive award levels for the officers of the Corporation
• Proposes the succession plan for the officers of the Corporation• Continuously monitors the regulatory environment and market practices
and informs the Compensation Committee about any developments
• Oversees, and recommends for approval by the Board, the Corporation’s executive compensation philosophy, policies, programs and grants of equity-based compensation
• Reviews with the President and CEO any proposed major changes in organization or personnel, including the succession plan
• Reviews any proposed major changes in the Corporation’s benefit plans and recommends for approval any change requiring Board approval
• Reviews annually with the members of the Board the performance of the President and CEO and other executive officers
• Recommends annually to the members of the Board all forms of compensation for the President and CEO and other officers
• Reviews the Corporation’s executive compensation disclosure for inclusion in the Corporation’s public disclosure documents
• Reviews and monitors the Corporation’s exposure to risk associated with its executive compensation and policies and identifies practices and policies to mitigate such risk
• Seeks advice from independent compensation consultants on emerging trends in executive compensation and, when considered advisable by the committee, other professional advice to enable the committee to function independently of management
Benchmarking and comparator groupTo ensure the competitiveness of the compensation provided to our executives, the Compensation Committee regularly reviews the compensation for similar executive positions at other companies with whom we compete for talent (our comparator group).
In 2015, Willis Towers Watson conducted a benchmarking study of all executive positions, including the NEOs, using our comparator group presented below. The results of the assessment showed that our executive pay is well aligned to our executive compensation policy, which targets total compensation to be positioned at the 60th percentile of our comparator group.
Our comparator group is designed to be representative of the Canadian marketplace while avoiding overweighting any particular industry. As a result, we do not include more than three companies from any particular industry. We regularly review the composition of our comparator group to ensure that the companies continue to reflect our context in terms of size, revenues, market capitalization and complexity. The composition of the comparator group was last revised in 2014.
9C
OM
PEN
SATI
ON
DIS
CU
SSIO
N &
AN
ALY
SIS
BCE Inc. 2016 PROXY CIRCULAR46
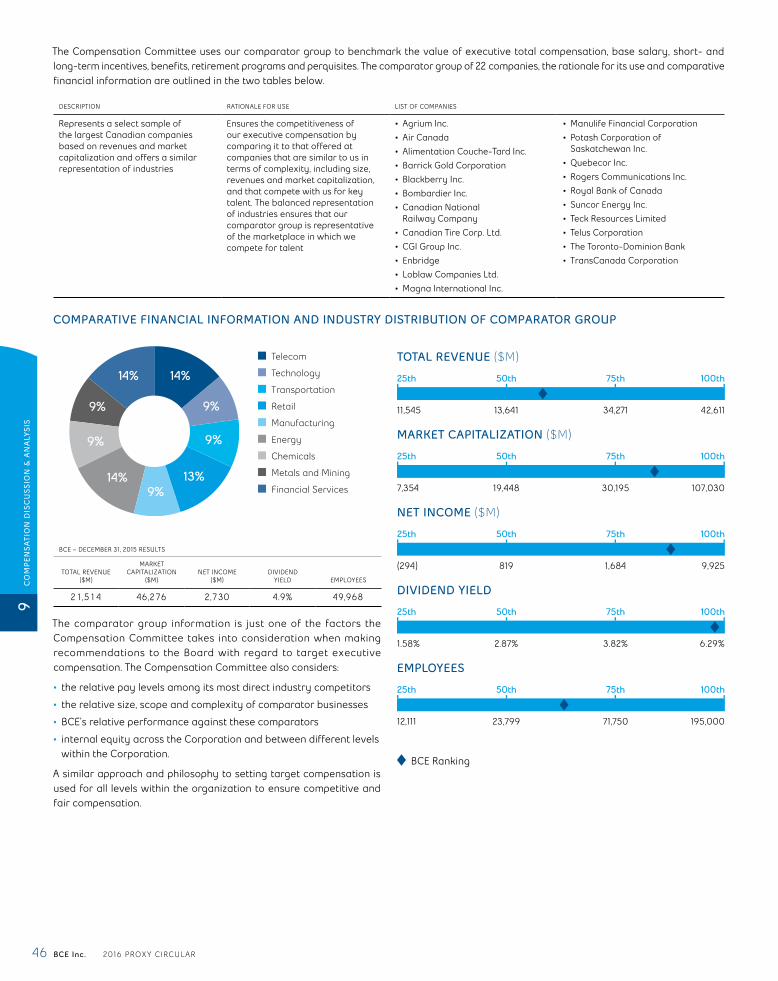
The Compensation Committee uses our comparator group to benchmark the value of executive total compensation, base salary, short- and long-term incentives, benefits, retirement programs and perquisites. The comparator group of 22 companies, the rationale for its use and comparative financial information are outlined in the two tables below.
DESCRIPTION RATIONALE FOR USE LIST OF COMPANIES
Represents a select sample of the largest Canadian companies based on revenues and market capitalization and offers a similar representation of industries
Ensures the competitiveness of our executive compensation by comparing it to that offered at companies that are similar to us in terms of complexity, including size, revenues and market capitalization, and that compete with us for key talent. The balanced representation of industries ensures that our comparator group is representative of the marketplace in which we compete for talent
• Agrium Inc.• Air Canada• Alimentation Couche-Tard Inc.• Barrick Gold Corporation• Blackberry Inc.• Bombardier Inc.• Canadian National
Railway Company• Canadian Tire Corp. Ltd.• CGI Group Inc.• Enbridge• Loblaw Companies Ltd.• Magna International Inc.
• Manulife Financial Corporation• Potash Corporation of
Saskatchewan Inc.• Quebecor Inc.• Rogers Communications Inc.• Royal Bank of Canada• Suncor Energy Inc.• Teck Resources Limited• Telus Corporation• The Toronto-Dominion Bank• TransCanada Corporation
COMPARATIVE FINANCIAL INFORMATION AND INDUSTRY DISTRIBUTION OF COMPARATOR GROUP
Telecom
Technology
Transportation
Retail
Manufacturing
Energy
Chemicals
Metals and Mining
Financial Services
14%
9%
14%
13%
9%
9%
14%
9%
9%
BCE – DECEMBER 31, 2015 RESULTS
TOTAL REVENUE($M)
MARKET CAPITALIZATION
($M)NET INCOME
($M)DIVIDEND
YIELD EMPLOYEES
21,514 46,276 2,730 4.9% 49,968
The comparator group information is just one of the factors the Compensation Committee takes into consideration when making recommendations to the Board with regard to target executive compensation. The Compensation Committee also considers:
• the relative pay levels among its most direct industry competitors
• the relative size, scope and complexity of comparator businesses
• BCE’s relative performance against these comparators
• internal equity across the Corporation and between different levels within the Corporation.
A similar approach and philosophy to setting target compensation is used for all levels within the organization to ensure competitive and fair compensation.
TOTAL REVENUE ($M)
25th 50th 75th 100th
11,545 13,641 34,271 42,611
MARKET CAPITALIZATION ($M)
25th 50th 75th 100th
7,354 19,448 30,195 107,030
NET INCOME ($M)
25th 50th 75th 100th
(294) 819 1,684 9,925
DIVIDEND YIELD
25th 50th 75th 100th
1.58% 2.87% 3.82% 6.29%
EMPLOYEES
25th 50th 75th 100th
12,111 23,799 71,750 195,000
BCE Ranking
CO
MP
ENSA
TIO
N D
ISC
USS
ION
& A
NA
LYSI
S9
BCE Inc. 2016 PROXY CIRCULAR 47
9.3 Compensation policy and componentsTo achieve our objective, we use three key elements of compensation with an aggregate target value positioned at the 60th percentile of what is paid in the competitive market for similar positions, with greater focus on pay for performance and mid- and long-term components. Consideration is also given to pay levels among our most direct competitors within our comparator group and their relative size, scope and complexity.
PRIMARY OBJECTIVE
WHAT DOES THE COMPENSATION ELEMENT REWARD?
HOW IS THE AMOUNT OR TARGET DETERMINED?
HOW DOES THE COMPENSATION ELEMENT FIT INTO THE OVERAL OBJECTIVE?
FORM OF PAYMENT
Annual Base Salary
Provides a market-competitive fixed rate of pay
The scope and responsibilities of the position and the specific skills needed to fulfill them
Set at the 50th percentile of what is paid in the competitive market for similar positions
Provides a vehicle to attract and retain skilled executives who can deliver on our overall goal while keeping the emphasis on rewarding actual performance
Cash
Annual Short-Term Incentive
Encourages performance against our annual corporate and individual objectives
The achievement of our annual objectives
Set at the 75th percentile of what is paid in the competitive market for similar positions. Payouts are capped at 2 times the target award
Provides a vehicle to reward actual performance against objectives that are designed to support our overall corporate targets
Choice of cash and/or DSUs• Payment in DSUs further aligns
the interests of executives and shareholders as DSUs are payable only upon cessation of employment
Equity-Based Long-Term Incentive Plan
Aligns long-term interests of executives and shareholders
The creation of shareholder value
Brings total compensation(1) to the 60th percentile of what is paid in the competitive market for similar positions. Annual grant awards are capped
Provides a vehicle to attract and retain skilled executives while rewarding the achievement of our overall goal of creating sustained shareholder value
RSUs (50%)• Aligns executives’ interests to
share return growthPSUs (25%)• Aligns executives’ interests
to dividend growth and their compensation to the Corporation’s performance
Stock Options (25%)• Aligns executives’ interests
with share price growth and their compensation to the Corporation’s performance
(1) Total compensation comprises base salary and annual short-, medium- and long-term incentives.
We also offer competitive pension, benefits and perquisites to promote the hiring and retention of qualified executives. These components are evaluated regularly as part of our benchmarking study. They are discussed in section 9.5 entitled 2015 Compensation elements under the heading Pension, benefits and perquisites.
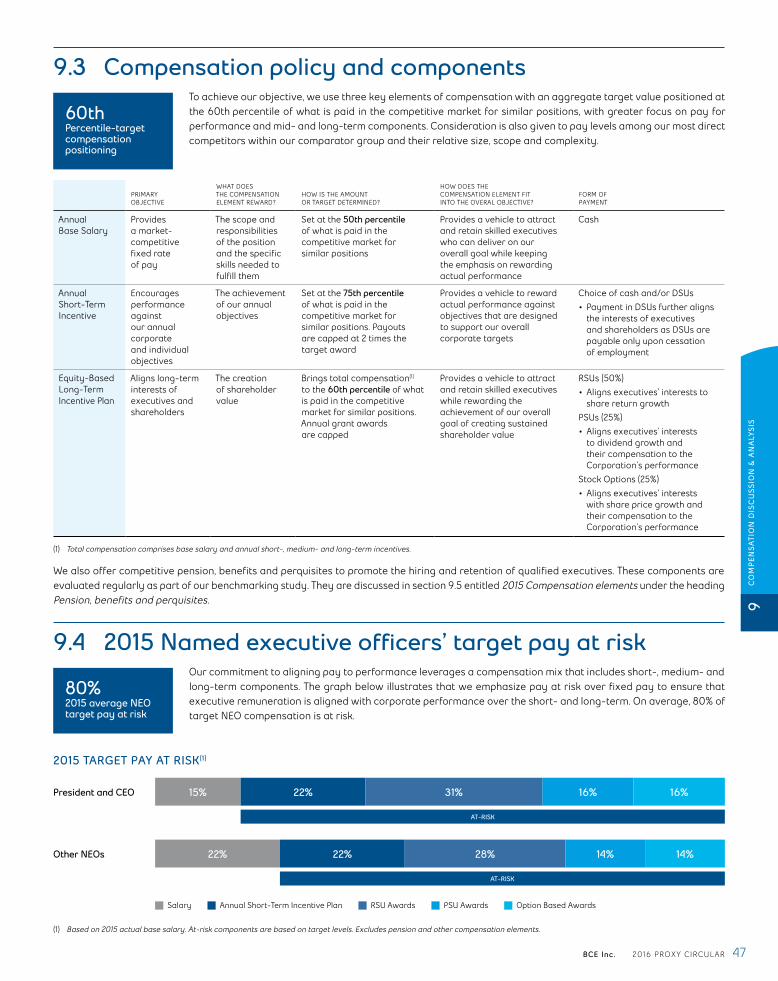
9.4 2015 Named executive officers’ target pay at riskOur commitment to aligning pay to performance leverages a compensation mix that includes short-, medium- and long-term components. The graph below illustrates that we emphasize pay at risk over fixed pay to ensure that executive remuneration is aligned with corporate performance over the short- and long-term. On average, 80% of target NEO compensation is at risk.
2015 TARGET PAY AT RISK(1)
President and CEO 15% 22% 16% 16%
AT-RISK
31%
Other NEOs
AT-RISK
14%22% 22% 28% 14%
Salary RSU Awards PSU Awards Option Based AwardsAnnual Short-Term Incentive Plan
(1) Based on 2015 actual base salary. At-risk components are based on target levels. Excludes pension and other compensation elements.
60thPercentile-target compensation positioning
80%2015 average NEO target pay at risk
9C
OM
PEN
SATI
ON
DIS
CU
SSIO
N &
AN
ALY
SIS
BCE Inc. 2016 PROXY CIRCULAR48
9.5 2015 Compensation elementsBase salariesThe Compensation Committee recommends for Board approval the base salary of each executive officer within a clearly defined salary range that reflects the scope and responsibilities of the position, the executive officer’s experience, the positioning of his or her base salary and total compensation versus the comparator group and internal equity. The mid-point of the salary range corresponds to the median of the salary paid by our comparator group for similar positions. Typically, the salary range is within 20% of the mid-point.
To ensure individual accountability and higher levels of performance, base salaries offered to all executives have been adjusted only to reflect sustained performance levels as well as an increase in responsibilities or job scope.
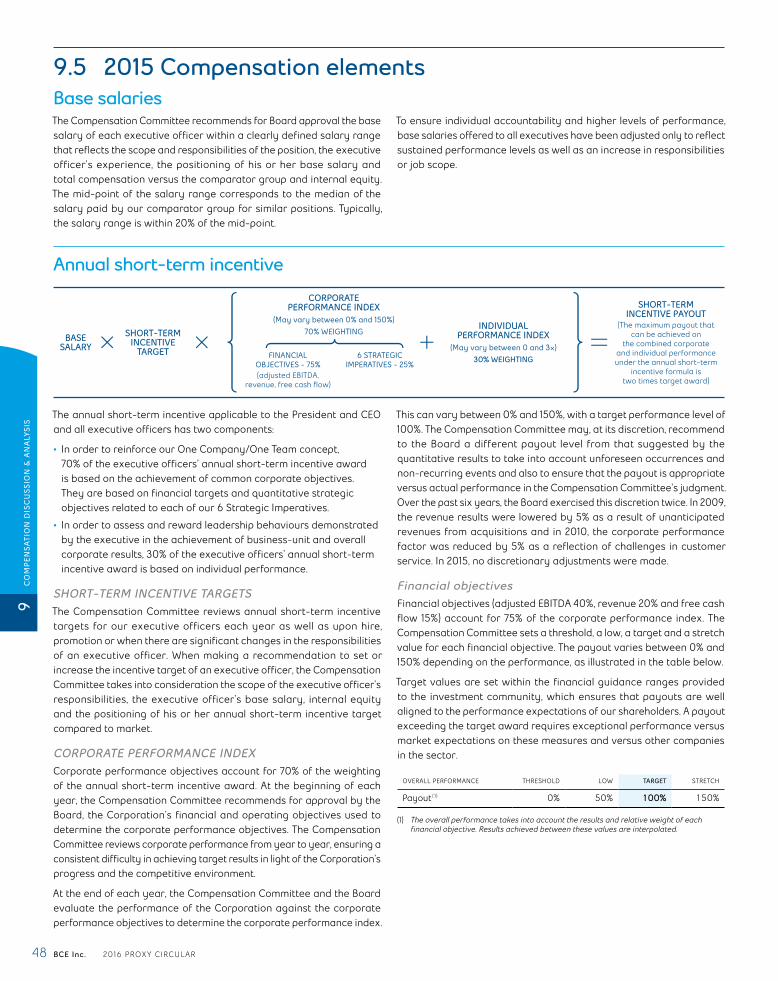
Annual short-term incentive
BASE SALARY
SHORT-TERM INCENTIVE
TARGET
CORPORATE PERFORMANCE INDEX
(May vary between 0% and 150%)70% WEIGHTING
INDIVIDUAL PERFORMANCE INDEX
(May vary between 0 and 3π)30% WEIGHTING
SHORT-TERM INCENTIVE PAYOUT
(The maximum payout that can be achieved on
the combined corporate and individual performance under the annual short-term
incentive formula is two times target award)
FINANCIAL OBJECTIVES - 75%(adjusted EBITDA,
revenue, free cash flow)
6 STRATEGIC IMPERATIVES - 25%
The annual short-term incentive applicable to the President and CEO and all executive officers has two components:
• In order to reinforce our One Company/One Team concept, 70% of the executive officers’ annual short-term incentive award is based on the achievement of common corporate objectives. They are based on financial targets and quantitative strategic objectives related to each of our 6 Strategic Imperatives.
• In order to assess and reward leadership behaviours demonstrated by the executive in the achievement of business-unit and overall corporate results, 30% of the executive officers’ annual short-term incentive award is based on individual performance.
SHORT-TERM INCENTIVE TARGETSThe Compensation Committee reviews annual short-term incentive targets for our executive officers each year as well as upon hire, promotion or when there are significant changes in the responsibilities of an executive officer. When making a recommendation to set or increase the incentive target of an executive officer, the Compensation Committee takes into consideration the scope of the executive officer’s responsibilities, the executive officer’s base salary, internal equity and the positioning of his or her annual short-term incentive target compared to market.
CORPORATE PERFORMANCE INDEXCorporate performance objectives account for 70% of the weighting of the annual short-term incentive award. At the beginning of each year, the Compensation Committee recommends for approval by the Board, the Corporation’s financial and operating objectives used to determine the corporate performance objectives. The Compensation Committee reviews corporate performance from year to year, ensuring a consistent difficulty in achieving target results in light of the Corporation’s progress and the competitive environment.
At the end of each year, the Compensation Committee and the Board evaluate the performance of the Corporation against the corporate performance objectives to determine the corporate performance index.
This can vary between 0% and 150%, with a target performance level of 100%. The Compensation Committee may, at its discretion, recommend to the Board a different payout level from that suggested by the quantitative results to take into account unforeseen occurrences and non-recurring events and also to ensure that the payout is appropriate versus actual performance in the Compensation Committee’s judgment. Over the past six years, the Board exercised this discretion twice. In 2009, the revenue results were lowered by 5% as a result of unanticipated revenues from acquisitions and in 2010, the corporate performance factor was reduced by 5% as a reflection of challenges in customer service. In 2015, no discretionary adjustments were made.
Financial objectivesFinancial objectives (adjusted EBITDA 40%, revenue 20% and free cash flow 15%) account for 75% of the corporate performance index. The Compensation Committee sets a threshold, a low, a target and a stretch value for each financial objective. The payout varies between 0% and 150% depending on the performance, as illustrated in the table below.
Target values are set within the financial guidance ranges provided to the investment community, which ensures that payouts are well aligned to the performance expectations of our shareholders. A payout exceeding the target award requires exceptional performance versus market expectations on these measures and versus other companies in the sector.
OVERALL PERFORMANCE THRESHOLD LOW TARGET STRETCH
Payout (1) 0% 50% 100% 150%
(1) The overall performance takes into account the results and relative weight of each financial objective. Results achieved between these values are interpolated.
CO
MP
ENSA
TIO
N D
ISC
USS
ION
& A
NA
LYSI
S9
BCE Inc. 2016 PROXY CIRCULAR 49
6 Strategic ImperativesThe remaining 25% weighting of the corporate performance index evaluates achievement of the Corporation’s operating objectives, our 6 Strategic Imperatives:
• Improve customer service• Leverage wireline momentum• Achieve a competitive
cost structure
• Accelerate wireless• Invest in broadband, networks
and services• Expand media leadership
Progress on the 6 Strategic Imperatives is evaluated by measuring performance against a set of operating metrics, many of which are commonly used across the industry. Each strategic imperative carries an equal weight. The following ranking scale applies and the total out of 36 possible points is then converted to a result out of 25%:
POINTS 0 1 2 3 4 5 6
Results Failed Significantly Below
Below Slightly Below Met Exceeded Stretched
The cumulative total of points earned for the 6 Strategic Imperatives determines the payout according to the following table:
SUM OF POINTS
THRESHOLD 0 POINTS
(6 X 0 POINTS)
TARGET 30 POINTS
(6 X 5 POINTS)
STRETCH 36 POINTS
(6 X 6 POINTS)
Payout (1) 0% 100% 150%
(1) The results achieved between these values are interpolated.
The Board and the Compensation Committee believe that these operating objectives were set for 2015 at an ambitious level but could be achieved under normal economic and market conditions. Payout at target may only be achieved by exceeding these operating objectives.
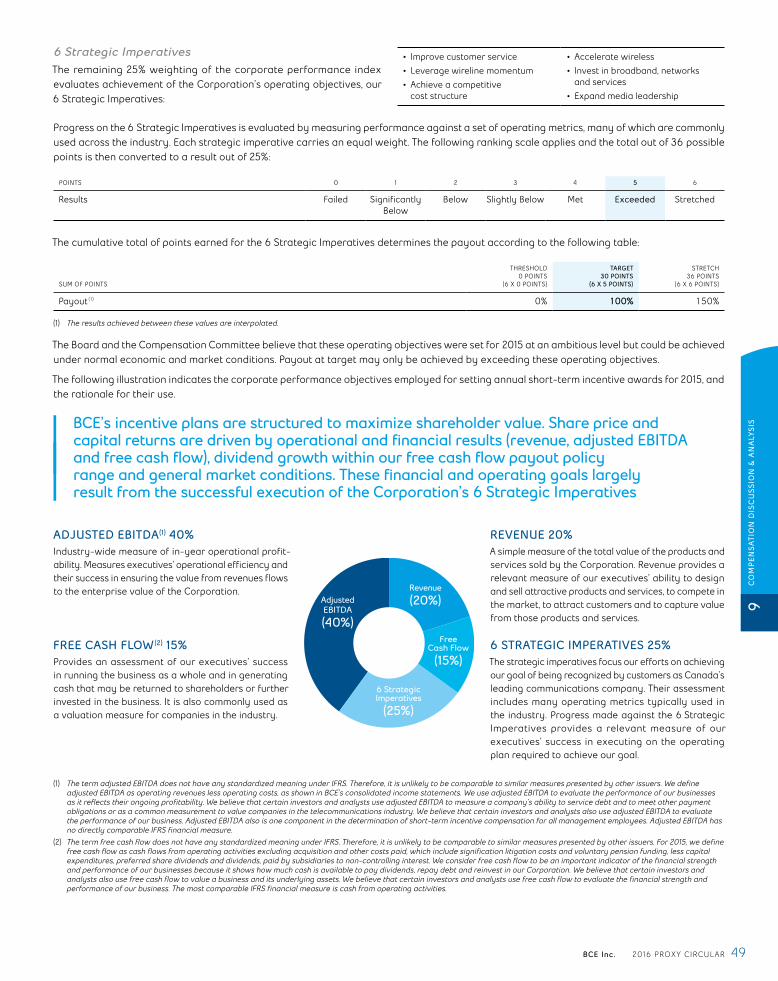
The following illustration indicates the corporate performance objectives employed for setting annual short-term incentive awards for 2015, and the rationale for their use.
BCE’s incentive plans are structured to maximize shareholder value. Share price and capital returns are driven by operational and financial results (revenue, adjusted EBITDA and free cash flow), dividend growth within our free cash flow payout policy range and general market conditions. These financial and operating goals largely result from the successful execution of the Corporation’s 6 Strategic Imperatives
ADJUSTED EBITDA(1) 40%Industry-wide measure of in-year operational profit-ability. Measures executives’ operational efficiency and their success in ensuring the value from revenues flows to the enterprise value of the Corporation.
FREE CASH FLOW (2) 15%Provides an assessment of our executives’ success in running the business as a whole and in generating cash that may be returned to shareholders or further invested in the business. It is also commonly used as a valuation measure for companies in the industry.
REVENUE 20%A simple measure of the total value of the products and services sold by the Corporation. Revenue provides a relevant measure of our executives’ ability to design and sell attractive products and services, to compete in the market, to attract customers and to capture value from those products and services.
6 STRATEGIC IMPERATIVES 25%The strategic imperatives focus our efforts on achieving our goal of being recognized by customers as Canada’s leading communications company. Their assessment includes many operating metrics typically used in the industry. Progress made against the 6 Strategic Imperatives provides a relevant measure of our executives’ success in executing on the operating plan required to achieve our goal.
Free Cash Flow
(15%)
6 StrategicImperatives
(25%)
Adjusted EBITDA
(40%)
Revenue
(20%)
(1) The term adjusted EBITDA does not have any standardized meaning under IFRS. Therefore, it is unlikely to be comparable to similar measures presented by other issuers. We define adjusted EBITDA as operating revenues less operating costs, as shown in BCE’s consolidated income statements. We use adjusted EBITDA to evaluate the performance of our businesses as it reflects their ongoing profitability. We believe that certain investors and analysts use adjusted EBITDA to measure a company’s ability to service debt and to meet other payment obligations or as a common measurement to value companies in the telecommunications industry. We believe that certain investors and analysts also use adjusted EBITDA to evaluate the performance of our business. Adjusted EBITDA also is one component in the determination of short-term incentive compensation for all management employees. Adjusted EBITDA has no directly comparable IFRS financial measure.
(2) The term free cash flow does not have any standardized meaning under IFRS. Therefore, it is unlikely to be comparable to similar measures presented by other issuers. For 2015, we define free cash flow as cash flows from operating activities excluding acquisition and other costs paid, which include signification litigation costs and voluntary pension funding, less capital expenditures, preferred share dividends and dividends, paid by subsidiaries to non-controlling interest. We consider free cash flow to be an important indicator of the financial strength and performance of our businesses because it shows how much cash is available to pay dividends, repay debt and reinvest in our Corporation. We believe that certain investors and analysts also use free cash flow to value a business and its underlying assets. We believe that certain investors and analysts use free cash flow to evaluate the financial strength and performance of our business. The most comparable IFRS financial measure is cash from operating activities.
9C
OM
PEN
SATI
ON
DIS
CU
SSIO
N &
AN
ALY
SIS
BCE Inc. 2016 PROXY CIRCULAR50
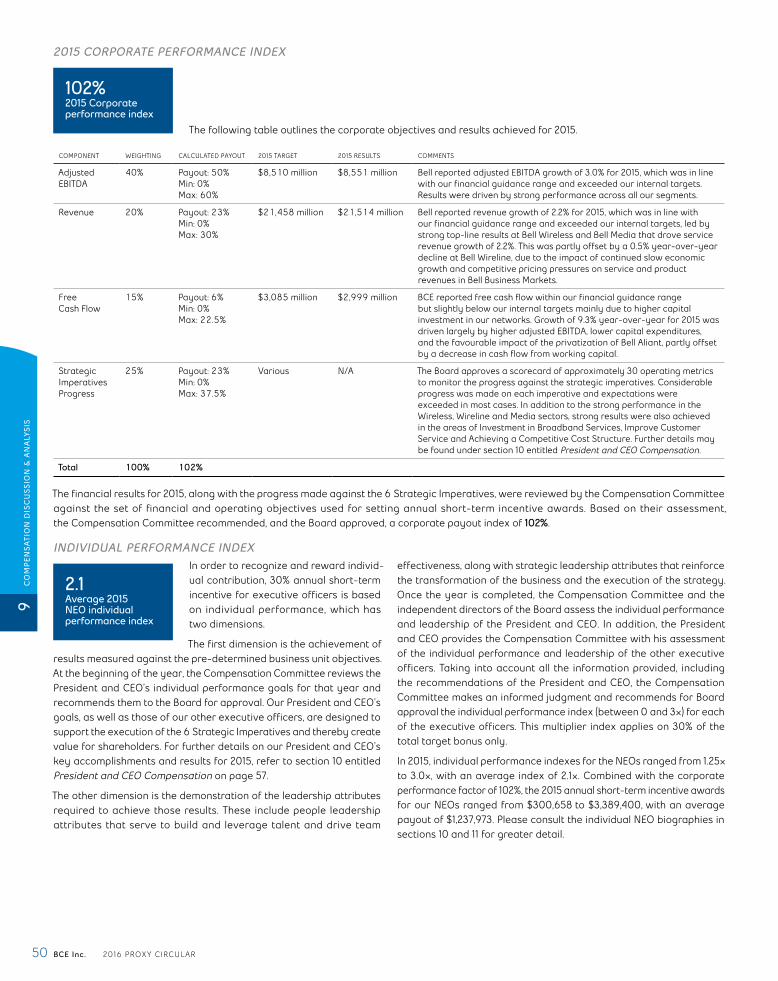
2015 CORPORATE PERFORMANCE INDEX
102%2015 Corporate performance index
The following table outlines the corporate objectives and results achieved for 2015.
COMPONENT WEIGHTING CALCULATED PAYOUT 2015 TARGET 2015 RESULTS COMMENTS
Adjusted EBITDA
40% Payout: 50% Min: 0% Max: 60%
$8,510 million $8,551 million Bell reported adjusted EBITDA growth of 3.0% for 2015, which was in line with our financial guidance range and exceeded our internal targets. Results were driven by strong performance across all our segments.
Revenue 20% Payout: 23% Min: 0% Max: 30%
$21,458 million $21,514 million Bell reported revenue growth of 2.2% for 2015, which was in line with our financial guidance range and exceeded our internal targets, led by strong top-line results at Bell Wireless and Bell Media that drove service revenue growth of 2.2%. This was partly offset by a 0.5% year-over-year decline at Bell Wireline, due to the impact of continued slow economic growth and competitive pricing pressures on service and product revenues in Bell Business Markets.
Free Cash Flow
15% Payout: 6% Min: 0% Max: 22.5%
$3,085 million $2,999 million BCE reported free cash flow within our financial guidance range but slightly below our internal targets mainly due to higher capital investment in our networks. Growth of 9.3% year-over-year for 2015 was driven largely by higher adjusted EBITDA, lower capital expenditures, and the favourable impact of the privatization of Bell Aliant, partly offset by a decrease in cash flow from working capital.
Strategic Imperatives Progress
25% Payout: 23% Min: 0% Max: 37.5%
Various N/A The Board approves a scorecard of approximately 30 operating metrics to monitor the progress against the strategic imperatives. Considerable progress was made on each imperative and expectations were exceeded in most cases. In addition to the strong performance in the Wireless, Wireline and Media sectors, strong results were also achieved in the areas of Investment in Broadband Services, Improve Customer Service and Achieving a Competitive Cost Structure. Further details may be found under section 10 entitled President and CEO Compensation.
Total 100% 102%
The financial results for 2015, along with the progress made against the 6 Strategic Imperatives, were reviewed by the Compensation Committee against the set of financial and operating objectives used for setting annual short-term incentive awards. Based on their assessment, the Compensation Committee recommended, and the Board approved, a corporate payout index of 102%.
INDIVIDUAL PERFORMANCE INDEXIn order to recognize and reward individ-ual contribution, 30% annual short-term incentive for executive officers is based on individual performance, which has two dimensions.
The first dimension is the achievement of results measured against the pre-determined business unit objectives. At the beginning of the year, the Compensation Committee reviews the President and CEO’s individual performance goals for that year and recommends them to the Board for approval. Our President and CEO’s goals, as well as those of our other executive officers, are designed to support the execution of the 6 Strategic Imperatives and thereby create value for shareholders. For further details on our President and CEO’s key accomplishments and results for 2015, refer to section 10 entitled President and CEO Compensation on page 57.
The other dimension is the demonstration of the leadership attributes required to achieve those results. These include people leadership attributes that serve to build and leverage talent and drive team
effectiveness, along with strategic leadership attributes that reinforce the transformation of the business and the execution of the strategy. Once the year is completed, the Compensation Committee and the independent directors of the Board assess the individual performance and leadership of the President and CEO. In addition, the President and CEO provides the Compensation Committee with his assessment of the individual performance and leadership of the other executive officers. Taking into account all the information provided, including the recommendations of the President and CEO, the Compensation Committee makes an informed judgment and recommends for Board approval the individual performance index (between 0 and 3π) for each of the executive officers. This multiplier index applies on 30% of the total target bonus only.
In 2015, individual performance indexes for the NEOs ranged from 1.25π to 3.0π, with an average index of 2.1π. Combined with the corporate performance factor of 102%, the 2015 annual short-term incentive awards for our NEOs ranged from $300,658 to $3,389,400, with an average payout of $1,237,973. Please consult the individual NEO biographies in sections 10 and 11 for greater detail.
2.1Average 2015 NEO individual performance index
CO
MP
ENSA
TIO
N D
ISC
USS
ION
& A
NA
LYSI
S9
BCE Inc. 2016 PROXY CIRCULAR 51
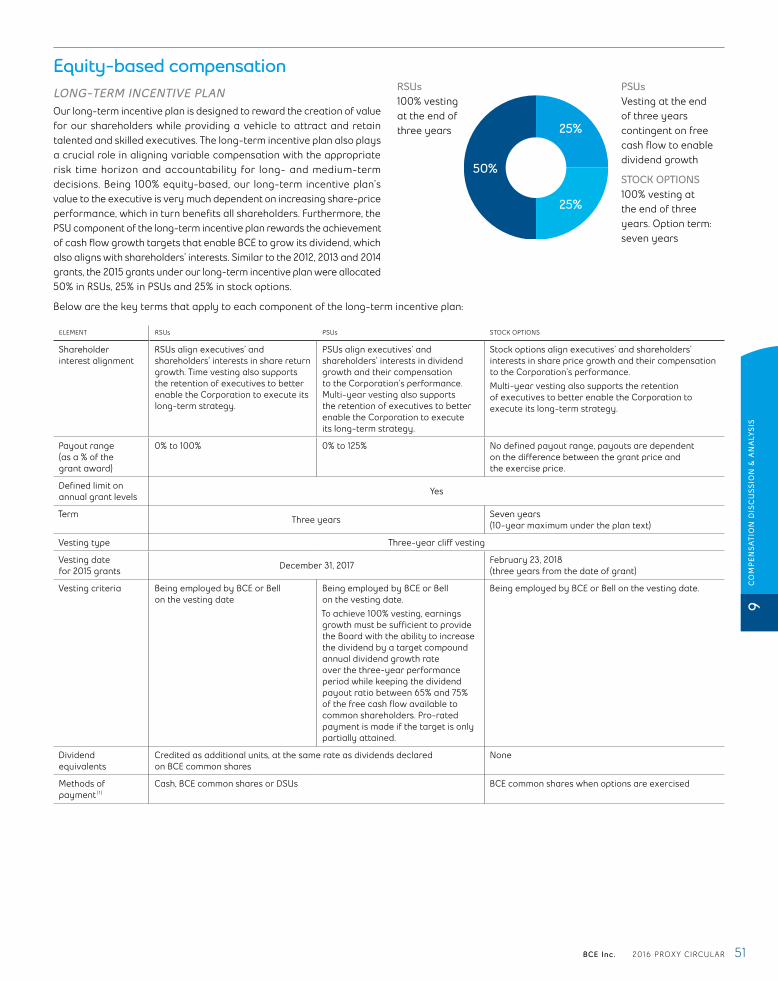
Equity-based compensationLONG-TERM INCENTIVE PLANOur long-term incentive plan is designed to reward the creation of value for our shareholders while providing a vehicle to attract and retain talented and skilled executives. The long-term incentive plan also plays a crucial role in aligning variable compensation with the appropriate risk time horizon and accountability for long- and medium-term decisions. Being 100% equity-based, our long-term incentive plan’s value to the executive is very much dependent on increasing share-price performance, which in turn benefits all shareholders. Furthermore, the PSU component of the long-term incentive plan rewards the achievement of cash flow growth targets that enable BCE to grow its dividend, which also aligns with shareholders’ interests. Similar to the 2012, 2013 and 2014 grants, the 2015 grants under our long-term incentive plan were allocated 50% in RSUs, 25% in PSUs and 25% in stock options.
RSUs100% vesting at the end of three years
PSUsVesting at the end of three years contingent on free cash flow to enable dividend growth
STOCK OPTIONS 100% vesting at the end of three years. Option term: seven years
25%
50%
25%
Below are the key terms that apply to each component of the long-term incentive plan:
ELEMENT RSUs PSUs STOCK OPTIONS
Shareholder interest alignment
RSUs align executives’ and shareholders’ interests in share return growth. Time vesting also supports the retention of executives to better enable the Corporation to execute its long-term strategy.
PSUs align executives’ and shareholders’ interests in dividend growth and their compensation to the Corporation’s performance. Multi-year vesting also supports the retention of executives to better enable the Corporation to execute its long-term strategy.
Stock options align executives’ and shareholders’ interests in share price growth and their compensation to the Corporation’s performance.Multi-year vesting also supports the retention of executives to better enable the Corporation to execute its long-term strategy.
Payout range (as a % of the grant award)
0% to 100% 0% to 125% No defined payout range, payouts are dependent on the difference between the grant price and the exercise price.
Defined limit on annual grant levels
Yes
TermThree years
Seven years (10-year maximum under the plan text)
Vesting type Three-year cliff vesting
Vesting date for 2015 grants
December 31, 2017February 23, 2018 (three years from the date of grant)
Vesting criteria Being employed by BCE or Bell on the vesting date
Being employed by BCE or Bell on the vesting date.To achieve 100% vesting, earnings growth must be sufficient to provide the Board with the ability to increase the dividend by a target compound annual dividend growth rate over the three-year performance period while keeping the dividend payout ratio between 65% and 75% of the free cash flow available to common shareholders. Pro-rated payment is made if the target is only partially attained.
Being employed by BCE or Bell on the vesting date.
Dividend equivalents
Credited as additional units, at the same rate as dividends declared on BCE common shares
None
Methods of payment (1)
Cash, BCE common shares or DSUs BCE common shares when options are exercised
9C
OM
PEN
SATI
ON
DIS
CU
SSIO
N &
AN
ALY
SIS
BCE Inc. 2016 PROXY CIRCULAR52
ELEMENT RSUs PSUs STOCK OPTIONS
Pricing at time of grant
Conversion from dollar value to units made using the volume weighted average of the trading price per common share for the last five consecutive trading days ending immediately on the last trading day prior to the effective date of the grant and rounded up to the nearest unit.
Higher of the volume weighted average of the trading price per common share of a board lot of common shares traded on the Toronto Stock Exchange: 1) on the trading day immediately prior to the effective date of the grant, or if at least one board lot of common shares has not been traded on such day, then the volume weighted average of the trading price per common share of a board lot of common shares for the next preceding day for which at least one board lot was so traded; and 2) for the last five consecutive trading days ending immediately on the trading day prior to the effective date of the grant.
Clawback The President & CEO and all EVPs s are subject to a clawback clause detailed under section 9.6 entitled Compensation risk management.
Option holders will lose all of their unexercised options if they engage in prohibited behaviours after they leave our Corporation. This includes using our confidential information for the benefit of another employer. In addition, the option holder must reimburse the after-tax profit realized on exercising any options during the six-month period preceding the date on which the prohibited behaviour began.
(1) At any time, the Compensation Committee may require that a participant receive a long-term incentive payment in BCE common shares or in DSUs as an interim measure to help the participant reach his/her mandatory share ownership requirement.
The Compensation Committee may also recommend special grants to recognize specific achievements or, in some cases, to retain or motivate executive officers and key employees. There were no special grants in 2015.
Information on change in control and termination provisions applicable to stock options can be found under section 11.5 entitled Termination and change-in-control benefits.
The Corporation uses the fair value method of accounting for equity-based compensation.
PSU PAYOUTS
Since the PSU plan’s inception in 2011, three payout cycles have occurred. The 2011, 2012 and 2013 PSU grants all vested at 100% as the earnings level attained during the performance cycles were more than sufficient to attain the targeted cumulative compound dividend growth rate to maintain the dividend payout ratio within the policy range of 65%-75%.
The PSU grants prior to 2014 had a maximum payout level of 100%. The 2014 and 2015 PSU grants have a maximum payout of 125% to reinforce the incentive to outperform and reflect current market practices in PSU design.
For further details on each NEO’s 2015 PSU award, see section 11.1 entitled Summary compensation table on page 65 or refer to the detailed NEO biographies in sections 10 and 11.
DSU PLAN
The deferred share unit (DSU) plan is designed to further align the interests of the executive officers with those of the shareholders by providing a mechanism for the executive officers to receive incentive compensation in the form of equity that they must hold until they leave the company. Executive officers and other key employees of the Corporation and those of certain subsidiaries may elect to participate in the DSU plan.
Executive officers can choose to have up to 100% of their annual short-term incentive award paid in DSUs instead of cash. The award is converted into DSUs based on the market value of a BCE common share on the day before the award becomes effective. Executives may also elect to receive performance share units (PSUs) and restricted share units (RSUs) in the form of DSUs.
DSUs have the same value as BCE common shares. Dividend equivalents in the form of additional DSUs are equal in value to dividends paid on BCE common shares and credited to the participant’s account on each dividend payment date based on the number of units in the account as of the dividend record date.
The Compensation Committee may also recommend for Board approval special awards of DSUs to recognize outstanding achievements or for reaching certain corporate objectives. There were no such awards made in 2015.
Holders of DSUs cannot settle their DSUs while they are employed by a company within the BCE group of companies. Once they leave the BCE group, the Corporation will buy, through a trustee, a number of BCE common shares on the open market equal to the number of vested DSUs a participant holds in the plan, after withholding taxes and any other deductions. These shares are then delivered to the former employee or to the estate in case of death.
CO
MP
ENSA
TIO
N D
ISC
USS
ION
& A
NA
LYSI
S9
BCE Inc. 2016 PROXY CIRCULAR 53
Share ownership requirementsWe believe in the importance of substantial share ownership, and our compensation programs are designed to encourage share ownership by executive officers. In order to encourage ongoing investment in the Corporation and to ensure continuous alignment of our executive officers’ compensation with our objective of creating value for our shareholders, share ownership requirements were increased for the President and CEO and EVPs in 2013. These milestones are to be reached 10 years from promotion or hire date. The following table outlines the current minimum share ownership levels as a multiple of annual base salary and the associated deadline applicable for each executive level:
MULTIPLE OF BASE SALARY
POSITION 5-YEAR TARGET 10-YEAR TARGET
President and CEO 7.5π 10π
EVPs 3.0π 5π
(1) 50% of five-year target must be reached within three years.
Direct and indirect holdings of common shares of BCE, including shares or DSUs received under the following programs, can be used to reach the minimum share ownership level:
• DSU plan, described under DSU Plan
• Employees’ Savings Plan (ESP), described under Benefits and Perquisites
• shares acquired and held by exercising stock options granted under our stock option plans, described under Long-Term Incentive Plan
• shares received and held upon payment of RSUs and PSUs, described under Long-Term Incentive Plan.
Option grants and unvested equity grants do not count towards the minimum share ownership level.
Share ownership status is calculated using the higher of acquisition cost and the current market value at time of review. The Compensation Committee reviews at least annually the status of compliance with the share ownership requirements. Concrete measures may be taken if the three- five- or 10-year targets are missed. These measures include, but are not limited to, the payment of a portion of the annual short-term incentive award in DSUs and, when stock options are exercised, the requirement to hold BCE common shares having a market value equal to a portion of the after-tax financial gain resulting from the exercise. These measures remain in effect until the target is reached. As shown in the table below, all of our NEOs have exceeded their five-year targets and 10-year targets.
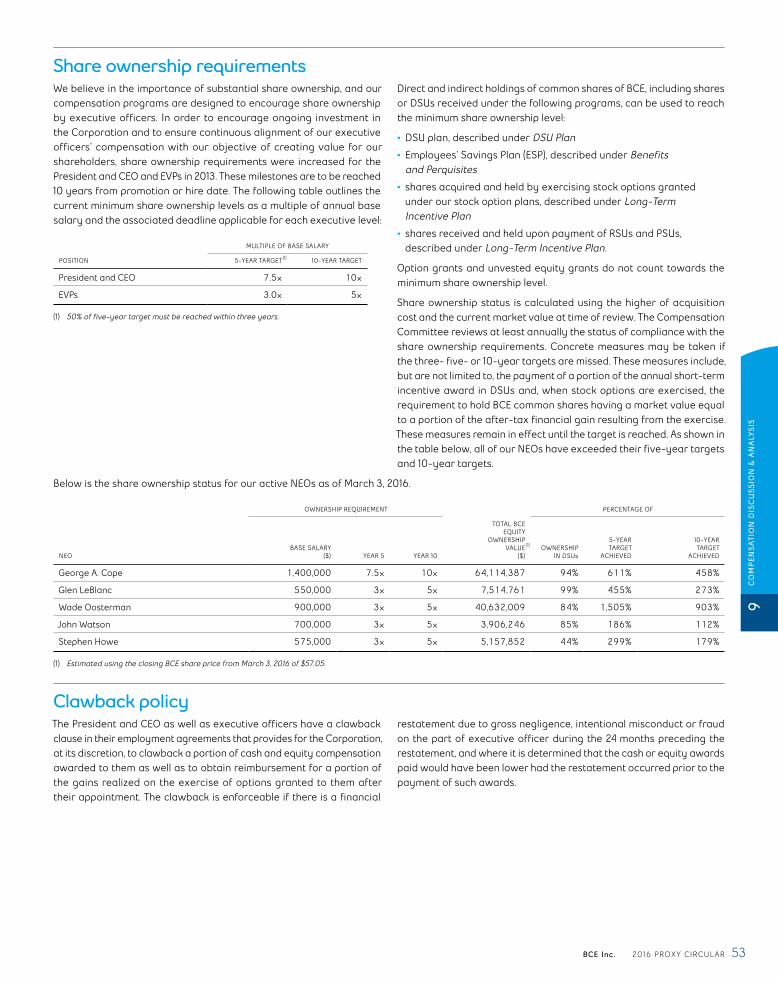
Below is the share ownership status for our active NEOs as of March 3, 2016.
OWNERSHIP REQUIREMENT PERCENTAGE OF
NEOBASE SALARY
($) YEAR 5 YEAR 10
TOTAL BCEEQUITY
OWNERSHIPVALUE
($)OWNERSHIP
IN DSUs
5-YEARTARGET
ACHIEVED
10-YEAR TARGET
ACHIEVED
George A. Cope 1,400,000 7.5π 10π 64,114,387 94% 611% 458%
Glen LeBlanc 550,000 3π 5π 7,514,761 99% 455% 273%
Wade Oosterman 900,000 3π 5π 40,632,009 84% 1,505% 903%
John Watson 700,000 3π 5π 3,906,246 85% 186% 112%
Stephen Howe 575,000 3π 5π 5,157,852 44% 299% 179%
(1) Estimated using the closing BCE share price from March 3, 2016 of $57.05.
Clawback policyThe President and CEO as well as executive officers have a clawback clause in their employment agreements that provides for the Corporation, at its discretion, to clawback a portion of cash and equity compensation awarded to them as well as to obtain reimbursement for a portion of the gains realized on the exercise of options granted to them after their appointment. The clawback is enforceable if there is a financial
restatement due to gross negligence, intentional misconduct or fraud on the part of executive officer during the 24 months preceding the restatement, and where it is determined that the cash or equity awards paid would have been lower had the restatement occurred prior to the payment of such awards.
(1)
(1)
9C
OM
PEN
SATI
ON
DIS
CU
SSIO
N &
AN
ALY
SIS
BCE Inc. 2016 PROXY CIRCULAR54
Pension, benefits and perquisitesPENSIONNo change was made to our pension plan in 2015 as it was well positioned relative to market.
With the exception of Mr. Vanaselja, our former CFO, all NEOs participate in the Defined Contribution (DC) pension plan, which has been the only pension plan available to employees hired since 2004. Mr. Vanaselja, who was hired prior to 2004, participated in Bell Canada’s Defined Benefit (DB) pension plan.
All our NEOs are eligible for supplementary retirement arrangements. The pension benefits provided to our NEOs are described under section 11.4 entitled Pension arrangements.
BENEFITS AND PERQUISITESWe believe that offering competitive and flexible benefits is essential to attract and retain qualified employees. The Corporation provides the Omniflex benefit program, which gives employees the flexibility to choose health, life and accident insurance most suited to their individual needs. The NEOs are provided with additional benefits, mainly relating to incremental life and accident insurance.
We also offer to all of our employees the possibility to participate in our Employee Savings Plan (ESP). The ESP is designed to support long-term share ownership and to build greater interest in the growth and success of our Corporation. Under the ESP, employees can contribute up to 6% of their eligible earnings to buy BCE common shares. The Corporation contributes $1 for every $3 the employee contributes. The shares purchased with the Corporation contributions are vested to employees after two years. More information on the ESP can be found under section 11.3 entitled Employees’ savings plans (ESPs).
The NEOs receive a competitive cash allowance for perquisites.
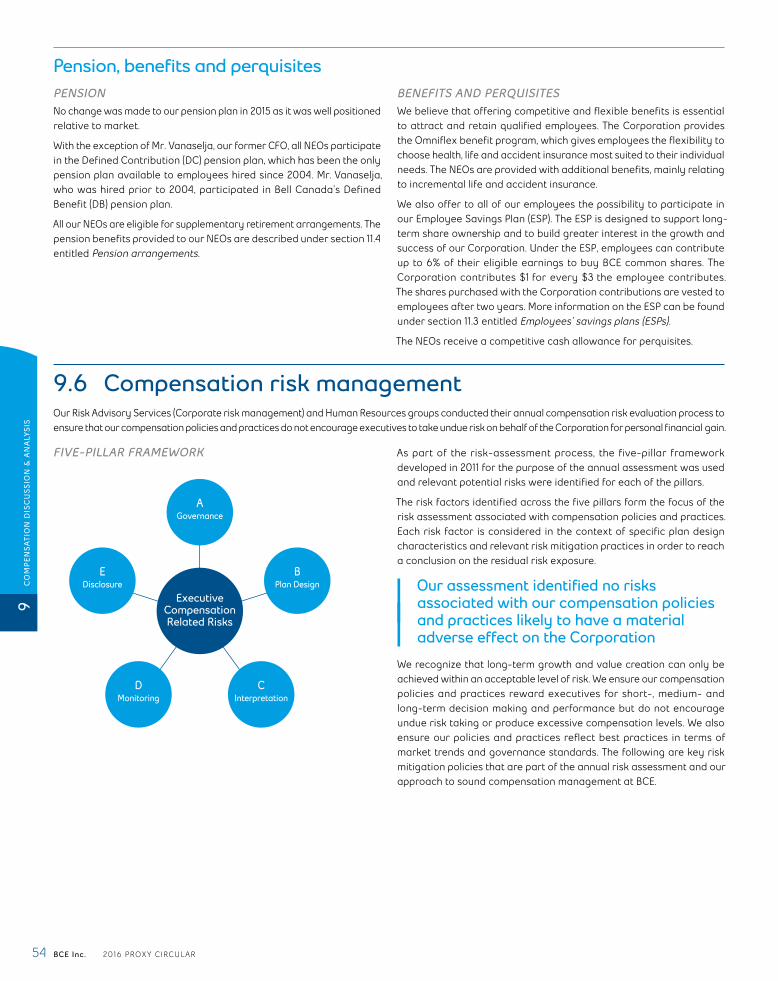
9.6 Compensation risk managementOur Risk Advisory Services (Corporate risk management) and Human Resources groups conducted their annual compensation risk evaluation process to ensure that our compensation policies and practices do not encourage executives to take undue risk on behalf of the Corporation for personal financial gain.
FIVE-PILLAR FRAMEWORK
Executive Compensation Related Risks
AGovernance
CInterpretation
DMonitoring
BPlan Design
EDisclosure
As part of the risk-assessment process, the five-pillar framework developed in 2011 for the purpose of the annual assessment was used and relevant potential risks were identified for each of the pillars.
The risk factors identified across the five pillars form the focus of the risk assessment associated with compensation policies and practices. Each risk factor is considered in the context of specific plan design characteristics and relevant risk mitigation practices in order to reach a conclusion on the residual risk exposure.
Our assessment identified no risks associated with our compensation policies and practices likely to have a material adverse effect on the Corporation
We recognize that long-term growth and value creation can only be achieved within an acceptable level of risk. We ensure our compensation policies and practices reward executives for short-, medium- and long-term decision making and performance but do not encourage undue risk taking or produce excessive compensation levels. We also ensure our policies and practices reflect best practices in terms of market trends and governance standards. The following are key risk mitigation policies that are part of the annual risk assessment and our approach to sound compensation management at BCE.
CO
MP
ENSA
TIO
N D
ISC
USS
ION
& A
NA
LYSI
S9
BCE Inc. 2016 PROXY CIRCULAR 55
OVERVIEW OF COMPENSATION AND RISK GOVERNANCE POLICIES AT BCE
WHAT WE DOUse external independent consultants to assess our executive compensation programs to ensure they are aligned with shareholder and corporate objectives, best practices and governance principles.
Incorporate caps on the annual short-term incentive payouts, medium- and long-term incentive grants and executive pension plans to prevent excessive compensation levels.
Incorporate risk mitigation mechanisms(1) into incentive programs and compensation policies to minimize the likelihood that executives will take undue risks to enhance their remuneration.
Balance short- (annual short-term incentive), medium- (RSUs and PSUs) and long-term (stock options) incentives to align compensation to the risk horizon for each compensation component.
Offer a pay mix that emphasizes performance with 80% of NEO target total direct compensation being at risk and tightly linked to BCE’s performance.
Enforce an incentive compensation clawback policy and forfeiture provisions(2).
Impose material share ownership requirements and offer the possibility to convert incentive payouts into DSUs, which further aligns executives’ interests with those of our shareholders.
Maintain a pre-clearance process for the President and CEO and all EVPs to protect against insider trading and trading during blackout periods.
Ensure that the Compensation Committee is comprised of independent members to avoid compensation-related conflicts of interest.
Offer our shareholders an opportunity to provide input to the Board regarding our executive compensation practices and levels via our annual Say on Pay advisory vote.
WHAT WE AVOIDMaintaining or reducing performance target levels for incentive plans. Steadily increasing performance levels must be achieved to realize payouts year after year.
Paying out incentives if they are not commensurate with performance results. The Board and the Compensation Committee have discretionary powers to alter incentive payouts when unexpected circumstances arise.
Setting performance targets for incentives without appropriate stress testing.
Offering compensation exceptions to NEOs without appropriate Board approval.
Offering single trigger change in control (CIC) rights to our executives(3).
Issuing stock option grants below market value and allowing option grants to be re-priced or forfeited in exchange for options with a lower strike price.
Allowing hedging of the economic exposure of BCE securities by all insiders, including directors and executives. BCE’s anti-hedging policy prohibits any kind of hedging the effect of which is to alter the insider’s economic interest in securities of BCE, or the insider’s economic exposure to BCE. As share ownership requirements and the long-term incentive plan align shareholder and executive interests, these restrictions ensure this alignment is fully maintained.
Including unvested and unexercised long-term incentives in share ownership calculations.
Guaranteeing variable incentive payouts.
(1) The main risk mitigation mechanisms include: incorporating a balanced and diversified combination of performance metrics for incentive plans to protect against one particular metric being promoted at the expense of overall health of the business, emphasis on long-term incentives with three-year vesting cycles in the executive pay mix to discourage undue short-term risk taking and curtailing the use of options (which offer the greatest leverage to share price fluctuation) so they represent only 14.5% of NEO total target direct compensation.
(2) The President and CEO as well as all EVPs have a clawback clause in their employment agreements that provides for the Corporation, at its discretion, to clawback a portion of cash and equity compensation awarded to them as well as to obtain reimbursement for a portion of the gains realized on the exercise of options granted to them after their appointment. The clawback is enforceable if there is a financial restatement due to gross negligence, intentional misconduct or fraud during the 24 months preceding the restatement, and where it is determined that the cash or equity awards paid would have been lower had the restatement occurred prior to the payment of such awards.All stock option holders are subject to a clawback clause if they engage in prohibited behaviours as described in greater detail in section 9.5 entitled 2015 Compensation elements under the heading Long-Term Incentive Plan.In the event of termination for cause, an individual forfeits all vested and unvested options and unvested RSU and PSU grants.
(3) The double-trigger CIC policy requires a CIC and termination for reasons other than for cause or resignation for good reason for 18 months post CIC. This prevents the Corporation from being obliged to pay termination benefits during a CIC if an executive’s employment is not terminated as part of the CIC. More information can be found in section 11.5 entitled Termination and change-in-control benefits.
9C
OM
PEN
SATI
ON
DIS
CU
SSIO
N &
AN
ALY
SIS
BCE Inc. 2016 PROXY CIRCULAR56
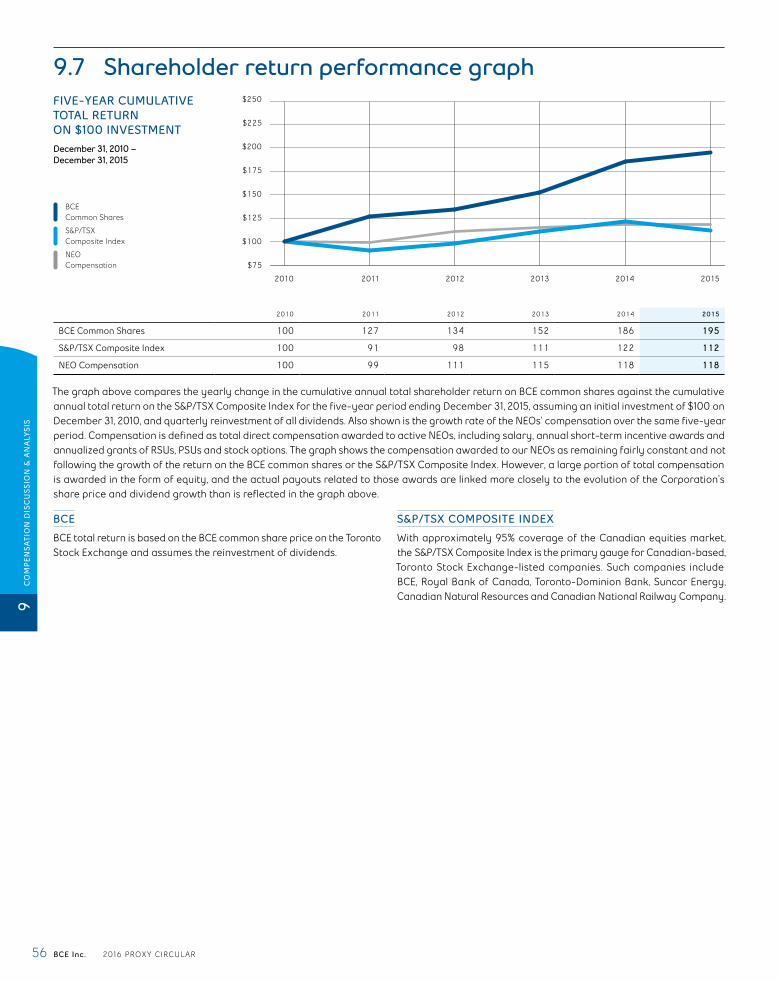
9.7 Shareholder return performance graphFIVE-YEAR CUMULATIVE TOTAL RETURN ON $100 INVESTMENTDecember 31, 2010 – December 31, 2015
$250
$225
$200
$175
$150
$125
$100
$75
2010 2011 2012 2013 2014 2015
BCE Common Shares
S&P/TSX Composite Index
NEO Compensation
2010 2011 2012 2013 2014 2015
BCE Common Shares 100 127 134 152 186 195
S&P/TSX Composite Index 100 91 98 111 122 112
NEO Compensation 100 99 111 115 118 118
The graph above compares the yearly change in the cumulative annual total shareholder return on BCE common shares against the cumulative annual total return on the S&P/TSX Composite Index for the five-year period ending December 31, 2015, assuming an initial investment of $100 on December 31, 2010, and quarterly reinvestment of all dividends. Also shown is the growth rate of the NEOs’ compensation over the same five-year period. Compensation is defined as total direct compensation awarded to active NEOs, including salary, annual short-term incentive awards and annualized grants of RSUs, PSUs and stock options. The graph shows the compensation awarded to our NEOs as remaining fairly constant and not following the growth of the return on the BCE common shares or the S&P/TSX Composite Index. However, a large portion of total compensation is awarded in the form of equity, and the actual payouts related to those awards are linked more closely to the evolution of the Corporation’s share price and dividend growth than is reflected in the graph above.
BCE
BCE total return is based on the BCE common share price on the Toronto Stock Exchange and assumes the reinvestment of dividends.
S&P/TSX COMPOSITE INDEX
With approximately 95% coverage of the Canadian equities market, the S&P/TSX Composite Index is the primary gauge for Canadian-based, Toronto Stock Exchange-listed companies. Such companies include BCE, Royal Bank of Canada, Toronto-Dominion Bank, Suncor Energy, Canadian Natural Resources and Canadian National Railway Company.
CO
MP
ENSA
TIO
N D
ISC
USS
ION
& A
NA
LYSI
S9