Embed Size (px)
Citation preview
Filed: 2016-05-27 EB-2016-0152
Exhibit F4 Tab 3
Schedule 1 Page 1 of 23
COMPENSATION AND BENEFITS 1
2
1.0 PURPOSE 3
The purpose of this exhibit is to: 4
Describe the work undertaken by OPG employees and where that work occurs, 5
Provide 2013-2021 compensation information for Nuclear, 6
Discuss OPG’s use of overtime, 7
Describe the compensation framework for OPG’s regulated facilities, and 8
Introduce the results of the independent compensation study prepared by Willis 9
Towers Watson (“Towers”). 10
11
2.0 OVERVIEW 12
The compensation costs presented in this exhibit are equivalent to approximately 50 per cent 13
of OPG’s forecast 2017 nuclear revenue requirement, reflecting the vital role OPG 14
employees play in producing electricity for Ontario. 15
16
OPG has a wide variety of employees, from senior executives who lead the organization, 17
professional staff who provide technical expertise related to OPG’s prescribed generation 18
facilities, and the skilled trades who operate and maintain generating facilities. These 19
employees work in generating stations and facilities across the province, and are largely 20
unionized. Additional details on OPG’s workforce, including the extent of unionization, 21
working conditions, and demographics are presented in section 3.0. 22
23
Given the extent of unionization, collective bargaining plays a dominant role in determining 24
OPG’s compensation costs. Collective bargaining directly affects the wages and incentives 25
provided to unionized employees, as well as the pensions and benefits they earn. Collective 26
bargaining also has an indirect impact on the compensation provided to non-unionized 27
positions because internal equity, career development and attracting experienced employees 28
into management positions are important factors in workforce planning and development. 29
30
Filed: 2016-05-27 EB-2016-0152 Exhibit F4 Tab 3 Schedule 1 Page 2 of 23
An overview of OPG’s compensation elements for both unionized and non-unionized 1
positions is found in section 4.0, and includes discussion of the actions that OPG has taken 2
to manage compensation costs. This section also includes a summary of compensation 3
costs for OPG’s nuclear business, with additional details available at Attachment 1 (Full Time 4
Equivalents [“FTE”], Compensation and Benefit Information for OPG’s Nuclear Facilities 5
[“Appendix 2k”]). 6
7
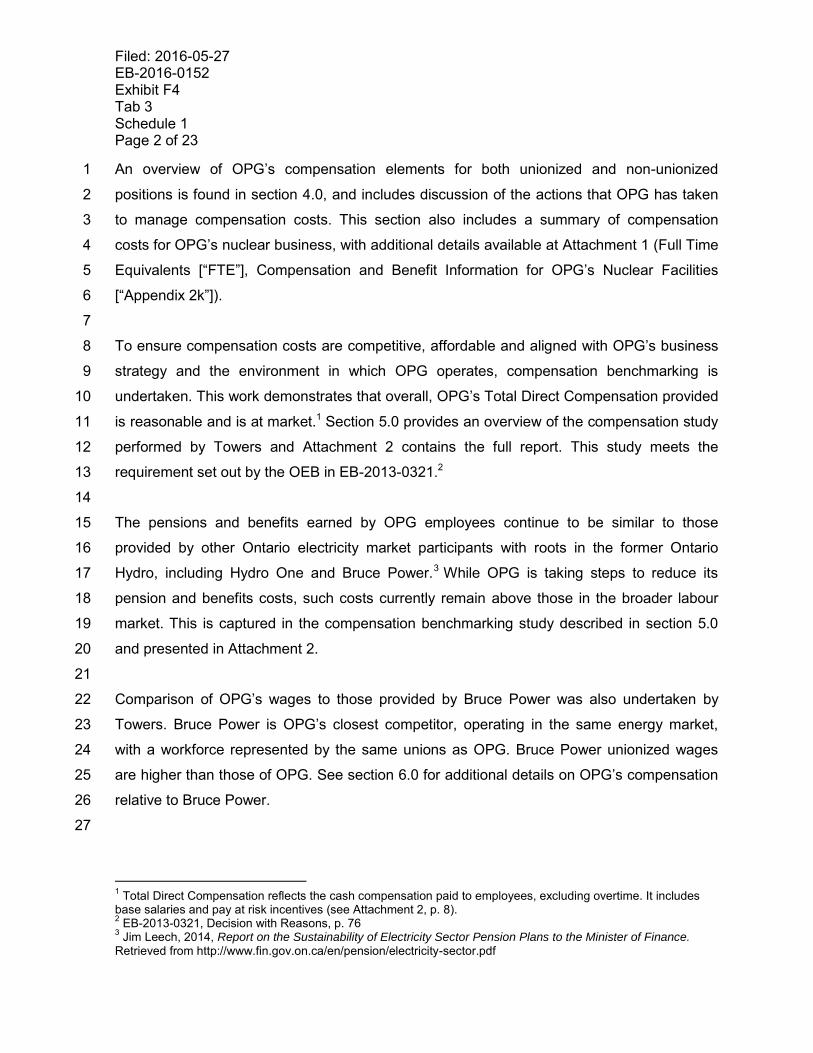
To ensure compensation costs are competitive, affordable and aligned with OPG’s business 8
strategy and the environment in which OPG operates, compensation benchmarking is 9
undertaken. This work demonstrates that overall, OPG’s Total Direct Compensation provided 10
is reasonable and is at market.1 Section 5.0 provides an overview of the compensation study 11
performed by Towers and Attachment 2 contains the full report. This study meets the 12
requirement set out by the OEB in EB-2013-0321.2 13
14
The pensions and benefits earned by OPG employees continue to be similar to those 15
provided by other Ontario electricity market participants with roots in the former Ontario 16
Hydro, including Hydro One and Bruce Power.3 While OPG is taking steps to reduce its 17
pension and benefits costs, such costs currently remain above those in the broader labour 18
market. This is captured in the compensation benchmarking study described in section 5.0 19
and presented in Attachment 2. 20
21
Comparison of OPG’s wages to those provided by Bruce Power was also undertaken by 22
Towers. Bruce Power is OPG’s closest competitor, operating in the same energy market, 23
with a workforce represented by the same unions as OPG. Bruce Power unionized wages 24
are higher than those of OPG. See section 6.0 for additional details on OPG’s compensation 25
relative to Bruce Power. 26
27
1 Total Direct Compensation reflects the cash compensation paid to employees, excluding overtime. It includes
base salaries and pay at risk incentives (see Attachment 2, p. 8). 2 EB-2013-0321, Decision with Reasons, p. 76
3 Jim Leech, 2014, Report on the Sustainability of Electricity Sector Pension Plans to the Minister of Finance.
Retrieved from http://www.fin.gov.on.ca/en/pension/electricity-sector.pdf

Filed: 2016-05-27 EB-2016-0152
Exhibit F4 Tab 3
Schedule 1 Page 3 of 23
In recognition of the impact that unionization has on sector-wide compensation, a broader 1
approach to collective bargaining has been taken, involving both Hydro One and the 2
Government of Ontario (“Government”). The resulting agreement with the Power Workers’ 3
Union (“PWU”) and Society of Energy Professionals (“Society”) made progress toward 4
reducing OPG’s pension contributions and modified eligibility rules and pension benefits to 5
be provided to OPG’s represented employees in the future. A summary of these negotiated 6
changes and the commensurate pension reforms implemented for Management employees 7
are presented in section 4.0. 8
9
3.0 OPG’s WORKFORCE 10
At the end of 2015, OPG had 9,247 regular employees. Of this total, approximately 7,294 11
employees worked directly in or supported OPG’s Nuclear facilities. 12
13
Unionization: OPG’s staff supporting regulated operations work in a predominantly 14
unionized environment, with approximately 90 per cent of staff belonging to either the PWU 15
or the Society. Nearly two thirds of OPG’s unionized staff belong to the PWU and 16
approximately one third belong to the Society. The extent of unionization and the mix of 17
PWU, Society and non-unionized staff (Management Group) have generally remained stable 18
over the past several years. 19

Filed: 2016-05-27 EB-2016-0152 Exhibit F4 Tab 3 Schedule 1 Page 4 of 23
Work Locations and Employees: OPG’s nuclear employees work in generating stations 1
and other facilities across the province as shown in Figure 1. 2
OPG employs individuals from 3
a variety of disciplines, many 4
of which are specialized 5
technical roles. This includes 6
engineers and operations staff 7
that operate and maintain 8
OPG’s nuclear facilities in a 9
safe and responsible manner. 10
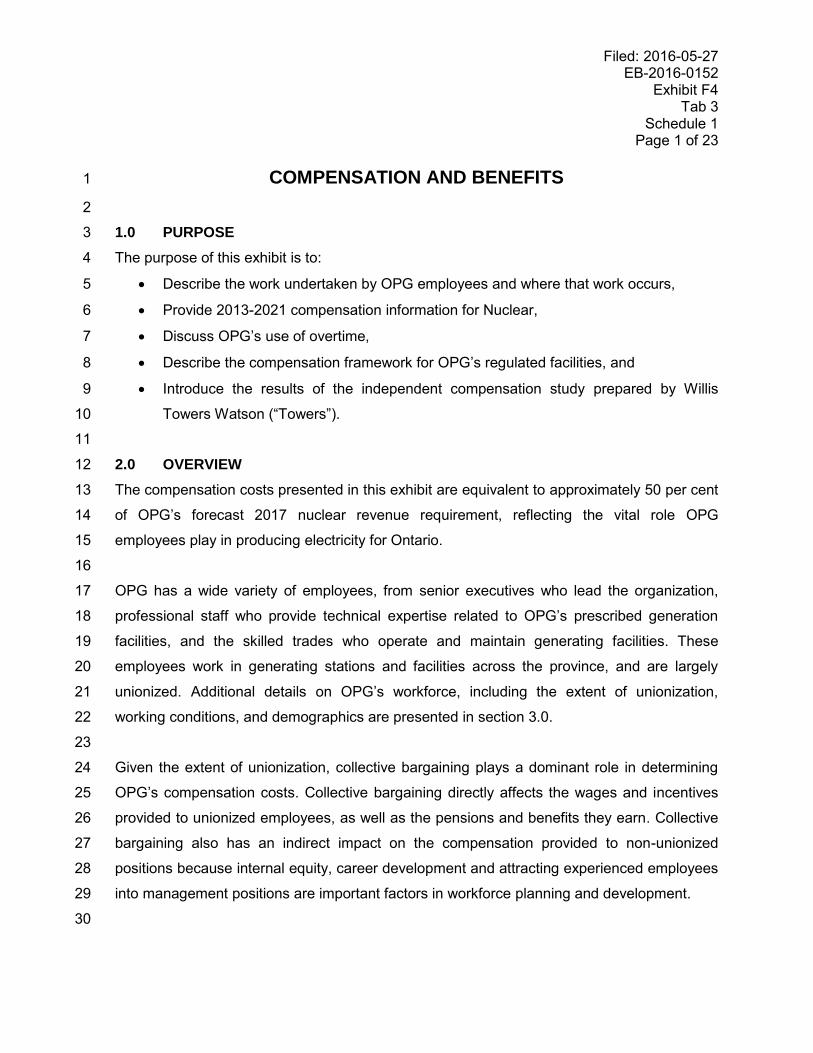
An overview of employee 11
counts as of December 31, 12
2015 by type of position is shown in Figure 2. Note that this information includes staff 13
supporting both OPG’s regulated and unregulated facilities. 14
15
16
17
18
19
20
21
22
23
24
25
26
27
28
29
30
Bruce Peninsula2%
Pickering Area57%
Clarington Region (Darlington)
32%
GTA / Other9%
Figure 1 - OPG Nuclear Work Locations
0 500 1000 1500 2000 2500 3000 3500 4000
Clerical, Semi-Skilled & General Trades
Skilled Trades
Managers & Professionals
Managerial Assistants
Executive
Senior Executive
Clerical, Semi-Skilled & General Trades
Skilled TradesManagers & Professionals
Managerial Assistants
Executive Senior Executive
Mgmt Group 15 0 353 112 467 80
Society 0 0 2933 0 0 0
PWU 1641 3646 0 0 0 0
Figure 2 - OPG Regular Headcount by Type of Position (December 31, 2015)
Operators, mechanical maintainers & control maintainers
Service maintainers &
administrative specialists
Directors & Senior Managers
CEO, CFO, Vice Presidents
Provide support to Senior Executives &
Executives
Total Number of Regular Staff
9,247(includes staff working at and
supporting both regulated and unregulated facilities)
Engineers, operations &
maintenance support , supervisors & technical support

Filed: 2016-05-27 EB-2016-0152
Exhibit F4 Tab 3
Schedule 1 Page 5 of 23
Demographics and OPG’s Business Transformation: OPG has a mature and 1
experienced workforce. By year-end 2016, approximately 20 per cent of active employees 2
will be eligible to retire with an undiscounted pension, with an additional 4 per cent becoming 3
eligible to retire each year thereafter. 4
5
OPG has been able to utilize this demographic profile to support its objectives of 6
transforming the business to a more cost effective and sustainable model. As part of 7
Business Transformation, OPG changed its structure to a centre-led matrix organization that 8
required fewer staff to support the production of electricity. By managing staffing reductions 9
through retirements and putting in place vacancy controls, OPG was able to reduce its 10
regular headcount by nearly 2,700 positions between 2011 and 2015 while avoiding costly 11
severance packages and minimizing disruptions associated with the redeployment of staff. 12
While Business Transformation has ended as a discrete initiative, efforts to continually 13
improve and manage OPG’s resources are embedded in day-to-day operations and business 14
plans. 15
16
4.0 COMPENSATION COSTS 17
Figure 3 summarizes the compensation costs for OPG’s Nuclear facilities for 2013-2021 and 18
reflects the impacts of wage escalation during the test period. The wage increases OPG 19
negotiated in its collective agreements are moderate (i.e., increases below expected 20
inflation), with increases arising as a result of the arbitrated progression catch up and items 21
negotiated in exchange for pension reforms. As discussed further below, the number of FTEs 22
grows between 2015 and 2017 before declining over the remainder of the rate period (2018-23
2021). This growth contributes significantly to the 2013 to 2021 trend in nuclear 24
compensation costs. 25
26

Filed: 2016-05-27 EB-2016-0152 Exhibit F4 Tab 3 Schedule 1 Page 6 of 23
1
2
3
Each component of compensation is described in more detail below, beginning with staffing 4
levels. Additional details can also be found in Attachment 1 (FTE, Compensation and Benefit 5
Information for OPG’s Nuclear Facilities [“Appendix 2k”]). 6
7
FTE Staffing levels 8
In 2016, staffing levels for OPG’s Nuclear facilities are expected to increase by over 600 9
FTEs due largely to the Darlington Refurbishment Project (“DRP”) and, to a lesser extent, the 10
workforce renewal required to sustain Pickering operations. In 2015, Nuclear attrition was at 11
its highest level in years, with over 300 retirements.4 This represents a 20 per cent increase 12
in the number of retirements in Nuclear compared to 2014. Over two thirds of the 2015 13
4 These retirements include only those reporting to the Nuclear organization directly. Attrition associated with
support staff attributed to the prescribed nuclear facilities is not reflected in this number.
2013 2014 2015 2016 2017 2018 2019 2020 2021
Pensions & Benefits (M$)* 399 342 417 397 407 400 405 404 405
Overtime (M$) 159 118 132 112 117 116 119 102 81
Base Salaries & Incentives (M$) 976 978 956 1,046 1,082 1,095 1,099 1,097 1,096
Total Compensation (M$) 1,534 1,438 1,506 1,554 1,606 1,611 1,623 1,603 1,582
Growth Rate (Total Compensation) 6% -6% 5% 3% 3% 0% 1% -1% -1%
Total Compensation (K$ / FTE) 179 171 186 178 182 184 187 190 191
Full Time Equivalents** 8594 8432 8114 8721 8801 8761 8665 8430 8293
0
200
400
600
800
1,000
1,200
1,400
1,600
1,800
2,000
Do
llars
Figure 3 - Compensation Costs for Nuclear Facilities
*Pension and benefits include current service costs and are shown on an accrual basis.** FTE includes both regular and non-regular FTEs. The actual 2013 FTEs shown are adjusted from those provided in EB-2013-0321,J7.3, Attachment 1. The adjustment increases the number of FTEs by excluding the impact of banked overtime (overtime taken as time off rather than pay) and shows the 2013 Actual FTEs on a consistent basis with the remaining years in the table.

Filed: 2016-05-27 EB-2016-0152
Exhibit F4 Tab 3
Schedule 1 Page 7 of 23
retirements were in critical operations, maintenance, engineering and technical roles and will 1
need to be replaced. As shown in Figure 4, staffing levels peak in 2017 and then decline by 2
over 500 FTEs by 2021. Nuclear staffing levels are discussed further in Ex. F2-1-1. 3
4
5
6
7
8
9
10
11
12
13
14
15
16
17
18
19
Workforce renewal leading up to the end of commercial operations at Pickering in 2022/2024 20
will be required to continue operating the station safely. To assist in mitigating the anticipated 21
disruption and costs associated with deployment and involuntary terminations after Pickering 22
is shut down, a new category of employees called “Term Employees” was negotiated with 23
the PWU for the current collective agreement period. In general, term employees may be 24
hired to avoid adding regular staff in circumstances where additional regular employees are 25
likely to be laid off as a result of Pickering’s end of commercial operations. Term employees 26
are hired with the understanding that they have no expectation of ongoing employment once 27
Pickering’s operations cease. 28
29
Base Salaries and Incentives represent about 68 per cent of OPG’s total compensation 30
costs related to the Nuclear facilities over the test period. These costs are largely a function 31
2013* 2014 2015 2016 2017 2018 2019 2020 2021
Temporary 634 734 843 808 833 853 816 731 694
Regular 7,960 7,698 7,271 7,912 7,968 7,909 7,848 7,699 7,599
Total 8,594 8,432 8,114 8,721 8,801 8,761 8,665 8,430 8,293
5,000
5,500
6,000
6,500
7,000
7,500
8,000
8,500
9,000
Figure 4- Nuclear Full Time Equivalents (FTE)
Darlington Refurb & Extended PIckering
Operations
* The actual 2013 FTEs shown are adjusted from those provided in EB-2013-0321, J7.3, Attachment 1. The adjustment increases the number of FTEs by excluding the impact of banked overtime (overtime taken as time off rather than pay) and shows the 2013 Actual FTEs on a consistent basis with the remaining years in the table.

Updated: 2016-11-10 EB-2016-0152 Exhibit F4 Tab 3 Schedule 1 Page 8 of 23
2001 2002 2003 2004 2005 2006 2007 2008 2009 2010 2011 2012 2013 2014 2015 2016 2017Bruce Power 3.0% 3.1% 4.0% 3.0% 3.0% 3.0% 3.25% 3.2% 3.0% 3.0% 2.75% 2.75% 3.5% 2.5% 2.0% 2.0% 2.5%Hydro One 3.0% 3.0% 3.0% 3.0% 3.5% 3.5% 3.0% 3.0% 3.0% 3.0% 3.0% 3.0% 2.5% 2.5% 1.0% 1.0% 1.0%OPG 3.0% 2.0% 3.0% 2.5% 2.5% 3.0% 3.0% 3.0% 3.0% 3.0% 3.0% 2.75% 2.75% 2.75% 1.0% 1.0% 1.0%
0.0%
0.5%
1.0%
1.5%
2.0%
2.5%
3.0%
3.5%
4.0%
4.5%
PWU Negotiated Annual Salary Increases
Cumulative Increases 2001 to 2015Bruce Power 55.9%Hydro One 52.8%OPG 48.7%
of staffing levels and the collective bargaining agreements that cover approximately 90 per 1
cent of OPG’s employees. 2
3
Unionized Salaries: 4
OPG is legally bound by its collective agreements. These agreements govern salary 5
increases, cost of living adjustments, and progressions through established salary ranges. 6
7
OPG, with the direct involvement and support of the Government, negotiated agreements 8
with both the PWU and Society in 2015 that will keep wage escalation below inflation. Both 9
agreements provide for a one per cent escalation increase each year and cover a three year 10
period, running from April 1, 2015 to March 31, 2018 for the PWU and from January 1, 2016 11
to December 31, 2018 for the Society. 12
13
Until recently, typical union salary increases have tended to be between 2 per cent and 3 per 14
cent per year for both OPG and other large companies within the electricity sector in Ontario, 15
as shown in Figures 5 to 8. 16
17
Figure 5 18
19
20
21
22
23
24
25
26
27
28
29
30
31

Filed: 2016-05-27 EB-2016-0152
Exhibit F4 Tab 3
Schedule 1 Page 9 of 23
Figure 6 1
2
3
4
5
6
7
8
9
10
11
12
13
14
15
Figure 7 16
17
18
19
20
21
22
23
24
25
26
27
28
29
30
31
2001 2002 2003 2004 2005 2006 2007 2008 2009 2010 2011 2012 2013 2014 2015 2016 2017
Bruce Power 3.0 6.2 10.4 13.8 17.2 20.7 24.6 28.6 32.4 36.4 40.2 44.0 49.1 52.8 55.9 59.0 62.9
Hydro One 3.0 6.1 9.3 12.6 16.5 20.6 24.2 27.9 31.7 35.7 39.8 44.0 47.6 51.3 52.8 54.3 55.8
OPG 3.0 5.1 8.2 10.9 13.7 17.1 20.6 24.2 28.0 31.8 35.8 39.5 43.3 47.3 48.7 50.2 51.7
-
10.0
20.0
30.0
40.0
50.0
60.0
70.0
PWU Negotiated Cumulative Salary Increases
2001 2002 2003 2004 2005 2006 2007 2008 2009 2010 2011 2012 2013 2014 2015 2016 2017 2018
Bruce Power 3.0% 2.5% 2.0% 4.0% 3.25% 3.25% 3.0% 3.0% 3.0% 3.0% 2.75% 2.75% 3.5% 2.75% 2.0% 2.0% 2.5% 2.0%
Hydro One 3.0% 2.0% 3.0% 3.0% 4.0% 3.0% 3.0% 3.0% 3.0% 3.0% 2.5% 2.5% 2.0% 2.25% 2.25% 0.5% 0.5% 0.5%
OPG 3.0% 2.5% 2.0% 3.0% 3.0% 3.0% 3.0% 3.0% 3.0% 3.0% 3.0% 3.0% 0.75% 1.75% 1.75% 1.0% 1.0% 1.0%
0.0%
0.5%
1.0%
1.5%
2.0%
2.5%
3.0%
3.5%
4.0%
4.5%
Society Negotiated Annual Salary Increases
Cumulative Increases 2001 to 2015Bruce Power 53.9%Hydro One 50.6%OPG 46.6%

Filed: 2016-05-27 EB-2016-0152 Exhibit F4 Tab 3 Schedule 1 Page 10 of 23
Figure 8 1
2
3
4
5
6
7
8
9
10
11
12
13
14
15
16
In addition to the one per cent annual escalation increase to wages, additional payments 17
were negotiated in exchange for pension reforms that will be payable to a subset of 18
employees for a limited time period. These are discussed in more detail below as part of the 19
changes to pensions and benefits. Compensation costs presented in this application reflect 20
escalation increases, pension reform savings and related payments negotiated with the PWU 21
and the Society in 2015. 22
23
Management Salaries: 24
For the remaining ten per cent of employees who are not covered by collective agreements 25
(Management Group or “Management”), base salary ranges and OPG’s pay for performance 26
programs are approved by the Board of Directors and subject to legislative restraints. 27
28
To control compensation costs for Management employees, OPG has taken the following 29
actions: 30
31
2001 2002 2003 2004 2005 2006 2007 2008 2009 2010 2011 2012 2013 2014 2015 2016 2017 2018
Bruce Power 3.0 5.6 7.7 12.0 15.6 19.4 23.0 26.7 30.5 34.4 38.1 41.9 46.8 50.9 53.9 55.0 56.3 57.5
Hydro One 3.0 5.1 8.2 11.5 15.9 19.4 23.0 26.7 30.5 34.4 37.7 41.2 44.0 47.2 50.6 50.8 51.1 51.3
OPG 3.0 5.6 7.7 10.9 14.2 17.7 21.2 24.8 28.6 32.4 36.4 40.5 41.6 44.0 46.6 47.0 47.5 48.0
-
10.0
20.0
30.0
40.0
50.0
60.0
70.0
Society Negotiated Cumulative Salary Increases

Filed: 2016-05-27 EB-2016-0152
Exhibit F4 Tab 3
Schedule 1 Page 11 of 23
a) Between 2011 and 2015, OPG’s Management employees received no annual base 1
salary increase. This has resulted in OPG’s Management compensation 2
benchmarking at or below the broader labour market for most positions, as shown in 3
section 5.0. 4
b) OPG continues to comply with compensation restraints outlined in the Broader Public 5
Sector Accountability Act, 2010, including amendments associated with Bill 55 (The 6
Strong Action for Ontario Act [Budget Measures], 2012). These restraints prohibit 7
compensation increases to Vice President level positions and above, and limit the 8
amount of monies available for OPG’s Stakeholder Return Program, a pay at risk 9
program that compensates Management employees based on the achievement of 10
corporate and individual performance objectives. These restraints are in place until 11
such time as the Ontario Budget is balanced or a compensation framework is 12
approved by the Lieutenant Governor of Ontario under the Broader Public Sector 13
Executive Compensation Act, 2014. This act was introduced as part of Bill 8 (Public 14
Sector and MPP Accountability and Transparency Act, 2014). As in OPG’s previous 15
proceedings, the costs of the Stakeholder Return Program are shown separately as a 16
centrally held cost in Ex. F4-4-1 Table 1 and Table 3, and are included in Attachment 17
1. 18
19
While the salary restraint measures have helped to reduce Management compensation 20
costs, they have created the following issues regarding internal equity and the ability to 21
attract talent. 22
23
a) Salary compression exists across OPG with approximately 250 managers currently 24
earning less than the staff they supervise, making it difficult to attract qualified 25
represented staff into Management positions. 26
b) The prospect of a long term salary freeze for Management is a concern for 27
represented staff when recruiting qualified internal personnel into Management 28
positions. This has led to the use of temporary and acting assignments to fill some of 29
the Management roles. This situation was cited in a recent World Association of 30
Filed: 2016-05-27 EB-2016-0152 Exhibit F4 Tab 3 Schedule 1 Page 12 of 23
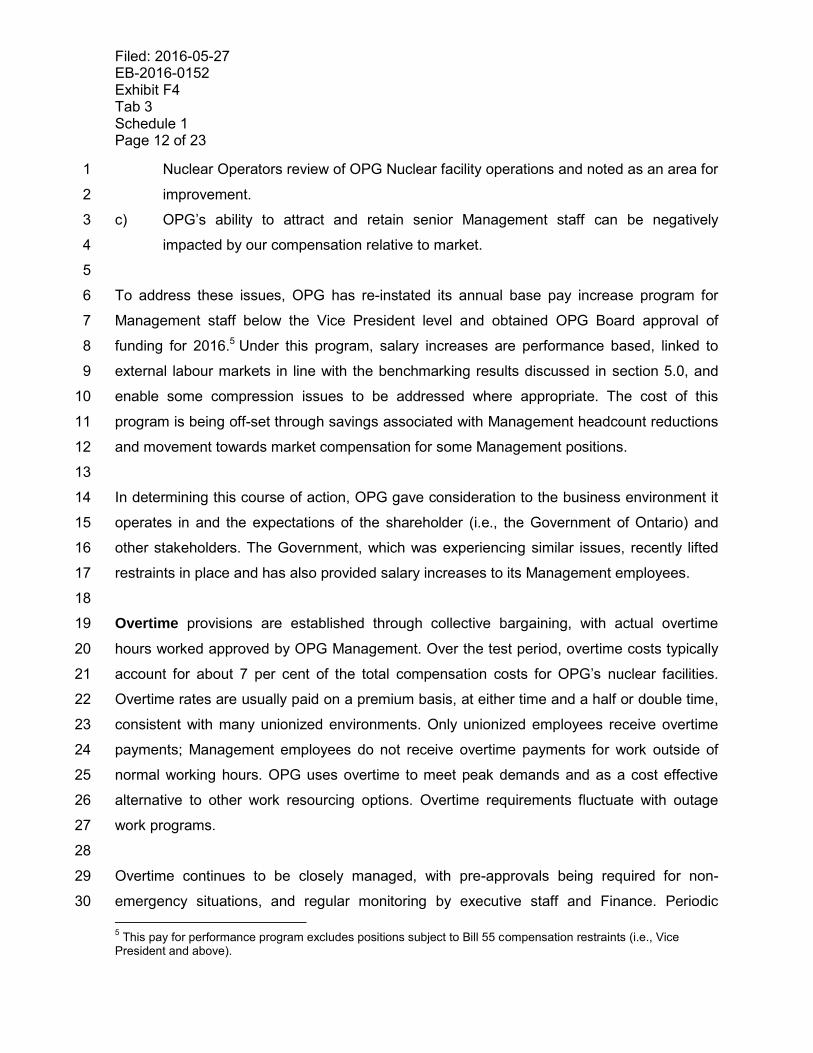
Nuclear Operators review of OPG Nuclear facility operations and noted as an area for 1
improvement. 2
c) OPG’s ability to attract and retain senior Management staff can be negatively 3
impacted by our compensation relative to market. 4
5
To address these issues, OPG has re-instated its annual base pay increase program for 6
Management staff below the Vice President level and obtained OPG Board approval of 7
funding for 2016.5 Under this program, salary increases are performance based, linked to 8
external labour markets in line with the benchmarking results discussed in section 5.0, and 9
enable some compression issues to be addressed where appropriate. The cost of this 10
program is being off-set through savings associated with Management headcount reductions 11
and movement towards market compensation for some Management positions. 12
13
In determining this course of action, OPG gave consideration to the business environment it 14
operates in and the expectations of the shareholder (i.e., the Government of Ontario) and 15
other stakeholders. The Government, which was experiencing similar issues, recently lifted 16
restraints in place and has also provided salary increases to its Management employees. 17
18
Overtime provisions are established through collective bargaining, with actual overtime 19
hours worked approved by OPG Management. Over the test period, overtime costs typically 20
account for about 7 per cent of the total compensation costs for OPG’s nuclear facilities. 21
Overtime rates are usually paid on a premium basis, at either time and a half or double time, 22
consistent with many unionized environments. Only unionized employees receive overtime 23
payments; Management employees do not receive overtime payments for work outside of 24
normal working hours. OPG uses overtime to meet peak demands and as a cost effective 25
alternative to other work resourcing options. Overtime requirements fluctuate with outage 26
work programs. 27
28
Overtime continues to be closely managed, with pre-approvals being required for non-29
emergency situations, and regular monitoring by executive staff and Finance. Periodic 30
5 This pay for performance program excludes positions subject to Bill 55 compensation restraints (i.e., Vice
President and above).

Filed: 2016-05-27 EB-2016-0152
Exhibit F4 Tab 3
Schedule 1 Page 13 of 23
reviews are also conducted to assess overtime usage and alternative options to address 1
work needs. 2
3
Overtime costs for OPG’s Nuclear facilities are expected to decline significantly, by 4
approximately 50 per cent, between 2013 and 2021, as shown in Figure 9 below. Over the 5
test period, overtime costs range from 7 per cent to 5 per cent of the Total Compensation 6
associated with OPG’s Nuclear facilities. See Attachment 1 for additional details. 7
8
9
10
11
12
13
14
15
16
17
18
19
20
21
22
23
Pension and Benefits costs represent approximately 25 per cent of OPG’s nuclear 24
compensation costs over the test period and include current employee benefits and current 25
service costs for pension and other post employment benefits (“OPEB”). In this Application, 26
OPG is proposing to limit the recovery of pension and OPEB costs to cash amounts during 27
the test period, subject to the outcome of the OEB’s generic proceeding on pension and 28
OPEB costs (EB-2015-0040). OPG is also proposing to record the difference between actual 29
accrual and actual cash valuations for pension and OPEB costs in the Pension & OPEB 30
Cash Versus Accrual Differential Deferral Account (see Ex. H1-1-1). In this exhibit and as in 31
2013 2014 2015 2016 2017 2018 2019 2020 2021
Nuclear 159.2 117.6 132.0 111.9 117.5 115.7 118.6 101.9 81.1
0.0
20.0
40.0
60.0
80.0
100.0
120.0
140.0
160.0
180.0
mil
lio
ns
of d
oll
ars
Fgure 9 - Overtime Costs for Nuclear

Filed: 2016-05-27 EB-2016-0152 Exhibit F4 Tab 3 Schedule 1 Page 14 of 23
EB-2013-0321, the current service pension and OPEB costs are presented on an accrual 1
basis, consistent with OPG’s labour costing for planning, accounting and reporting purposes. 2
The amount and calculation of pension and OPEB costs are described in Ex. F4-3-2, which 3
also shows the total cash amounts that OPG is seeking to recover in this Application. 4
Although OPG’s pension and OPEB proposal in this Application aligns with the OEB’s EB-5
2013-0321 Decision, OPG continues to be of the view that it would be appropriate for OPG to 6
recover its accrual pension and OPEB costs, as set out in OPG’s July 31, 2015 submission 7
in the EB-2015-0040 generic consultation and as summarized in Ex. F4-3-2. 8
9
i) Current Benefits includes the cost of OPG’s Health, Dental and Group Life Insurance 10
benefits for employees while on payroll, as well as statutory requirements such as the 11
Employer Health Tax, Canada Pension Plan, Employment Insurance and Workers 12
Compensation. Current employee benefit costs are expected to remain relatively stable on a 13
per capita basis between 2013 and 2021. While the cost of health and dental services are 14
expected to increase over this period, administrative savings and more stringent adjudication 15
of claims are expected to offset these cost pressures. OPG outsources claims administration 16
to Sun Life Financial and has a number of plan management and adjudication mechanisms 17
in place to control benefit costs. These include the mandatory substitution of generic drugs, 18
maximizing coordination of benefit opportunities, and a requirement for prior approval for 19
certain drug and treatment therapies. 20
21
Health, dental and life insurance benefits for PWU and Society employees are negotiated 22
with the unions whereas OPG’s Board of Directors approves the Management benefit 23
programs. To reduce costs and demonstrate leadership, Management benefits for new hires 24
since 2001 reflect a lower cost health and dental benefit plan. With higher co-payments and 25
different benefit coverage, this plan is nearly 20 per cent less costly than the plan provided to 26
Management employees hired before July 1, 2001. 27
28
ii) Pension and Other Post Employment Benefits (OPEB) costs include the employer 29
paid costs of providing a pension along with other post-employment benefits such as life 30

Filed: 2016-05-27 EB-2016-0152
Exhibit F4 Tab 3
Schedule 1 Page 15 of 23
insurance, and health and dental care for pensioners and their dependants, as well as long-1
term disability (“LTD”) benefits for current employees. 2
3
As discussed in Ex. F4-3-2, pension and OPEB accrual costs are actuarially determined to 4
reflect the benefits earned by today’s employees for service they have rendered in support of 5
the company’s operations. These costs are sensitive to changing economic conditions (e.g., 6
changes to interest rates that drive the discount rates used in the actuarial calculations) as 7
well as demographic and other actuarial assumptions. Ex. F4-3-2 discusses the major drivers 8
of year-over-year trends in pension and OPEB costs. 9
10
Pension and OPEB provided to Management employees are determined by OPG’s Board of 11
Directors. Collective agreements with the PWU and Society contain pension and benefits 12
clauses that can only be changed through negotiations. 13
14
iii) Changes to Pension and Benefits were recently negotiated with the direct involvement 15
of the Government and other electricity sector stakeholders. The Minister of Energy 16
established the bargaining mandate for OPG, and appointed Ed Clark, the Chair of the 17
Premier’s Advisory Council on Government Assets to lead the main bargaining team. This 18
mandate included obtaining a multi-year agreement, wage increases that were neutral to 19
Ontario taxpayers and electricity ratepayers, and longer term solutions to help address 20
pension sustainability. With the Government’s support, negotiations succeeded in introducing 21
a number of pension reform measures aimed at reducing pension benefit costs over the long 22
term. The Government was satisfied that the mandate was met. 23
24
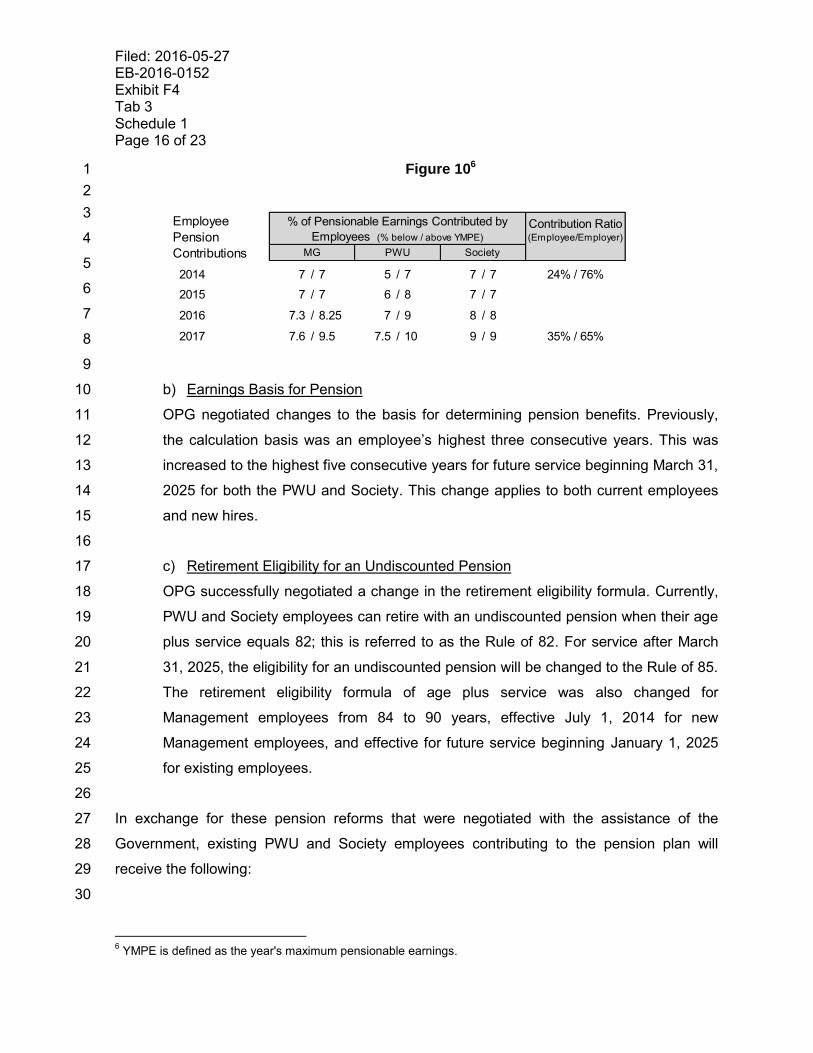
a) Employee Contributions Increases 25
Through negotiations, OPG was able to increase employee pension contributions 26
beginning April 1, 2015 for PWU employees, and January 1, 2016 for Society 27
employees. Comparable changes were made to contributions for Management 28
employees starting January 1, 2016. Figure 10 provides an overview of the increase 29
in employee contributions. 30
31
Filed: 2016-05-27 EB-2016-0152 Exhibit F4 Tab 3 Schedule 1 Page 16 of 23
Figure 106 1
2
3
4
5
6
7
8
9
b) Earnings Basis for Pension 10
OPG negotiated changes to the basis for determining pension benefits. Previously, 11
the calculation basis was an employee’s highest three consecutive years. This was 12
increased to the highest five consecutive years for future service beginning March 31, 13
2025 for both the PWU and Society. This change applies to both current employees 14
and new hires. 15
16
c) Retirement Eligibility for an Undiscounted Pension 17
OPG successfully negotiated a change in the retirement eligibility formula. Currently, 18
PWU and Society employees can retire with an undiscounted pension when their age 19
plus service equals 82; this is referred to as the Rule of 82. For service after March 20
31, 2025, the eligibility for an undiscounted pension will be changed to the Rule of 85. 21
The retirement eligibility formula of age plus service was also changed for 22
Management employees from 84 to 90 years, effective July 1, 2014 for new 23
Management employees, and effective for future service beginning January 1, 2025 24
for existing employees. 25
26
In exchange for these pension reforms that were negotiated with the assistance of the 27
Government, existing PWU and Society employees contributing to the pension plan will 28
receive the following: 29
30
6 YMPE is defined as the year's maximum pensionable earnings.
2014 7 / 7 5 / 7 7 / 7 24% / 76%
2015 7 / 7 6 / 8 7 / 7
2016 7.3 / 8.25 7 / 9 8 / 8
2017 7.6 / 9.5 7.5 / 10 9 / 9 35% / 65%
Employee
Pension
Contributions
Contribution Ratio (Employee/Employer)
MG PWU Society
% of Pensionable Earnings Contributed by
Employees (% below / above YMPE)

Filed: 2016-05-27 EB-2016-0152
Exhibit F4 Tab 3
Schedule 1 Page 17 of 23
a) Lump Sum Payment 1
Both the PWU and society represented employees are entitled to receive non-2
pensionable lump sum payments of 1 per cent of salary in the first year of the 3
contract and 2 per cent of salary in the second year of the contract. 4
5
b) Share Performance Plan 6
PWU and Society represented employees who were contributing to the pension plan 7
on April 1, 2015 (PWU) and January 1, 2016 (Society) and had less than 35 years of 8
pensionable service as of those dates will be granted Hydro One Limited shares 9
awards at the start of the third year of the current contract term (April 1, 2017 for 10
PWU and January 1, 2018 for Society). Eligible employees will continue to receive 11
shares annually for up to 15 years subject to the following conditions: 12
13
1. The number of shares to be awarded annually will be based on a set 14
percentage of salary at the beginning of the contract term (2.75 per cent of 15
salary as of April 1, 2015 for PWU and 2.0 per cent of salary as of January 1, 16
2016 for Society) 17
18
2. Shares will be granted annually to active employees with less than 35 years of 19
pensionable service on April 1 of the corresponding year for the PWU and 20
January 1 for the Society. The last share award will be granted on April 1, 21
2031 for eligible PWU employees and January 1, 2032 for eligible Society 22
employees. 23
24
In 2016, OPG acquired nine million Hydro One shares at a price per share of $23.65, as a 25
risk management strategy against future fluctuations in the price of the shares. OPG expects 26
to be able to satisfy its share award obligations to eligible PWU and Society employees 27
during the test period by using the shares it acquired in 2016. Forecast compensation costs 28
included in the nuclear revenue requirement for the test period reflect the expense 29
corresponding to the years in the test period associated with projected share award 30
obligations, at the purchase price of the shares at the time of acquisition (i.e., $23.65 per 31

Filed: 2016-05-27 EB-2016-0152 Exhibit F4 Tab 3 Schedule 1 Page 18 of 23
share). As such, ratepayers are protected from fluctuations in the market price of the shares. 1
In this Application, OPG is not seeking recovery of expenses of the post-2021 period 2
associated with the share awards. 3
4
Over the test period, the costs associated with the lump sum payments and the share 5
performance plan largely equal the cost savings from the pension reforms, but the pension 6
savings will continue to grow over time. 7
8
5.0 COMPENSATION BENCHMARKING STUDY 9
Benchmarking conducted by Towers indicates that OPG’s Total Direct Compensation is at 10
market. A copy of the report prepared by Towers is attached as Attachment 2, and an 11
overview of the approach taken, comparator groups used, and summarized results are 12
provided below. 13
14
In assessing OPG’s compensation relative to external labour markets, OPG’s positions were 15
categorized into three segments: Utility, Nuclear Authorized, and General Industry. OPG’s 16
compensation in each of these segments was compared to other companies who employ 17
similar positions. 18
19
This assessment included reviewing OPG’s Base Salaries, Total Direct Compensation, as 20
well as Pensions and Benefits. Total Direct Compensation reflects the cash compensation 21
paid to employees, excluding overtime. It includes Base Salaries and pay at risk incentives. 22
23
Compensation benchmarking results are considered to be at market if they are within +/- 10 24
per cent of the target market positioning. OPG’s target market positioning is the 50th 25
percentile for positions in the Utility and General Industry segments, and 75th percentile for 26
the Nuclear Authorized segment. 27
28
Most of OPG’s positions (about 69 per cent) fall into the Utility segment, including many 29
positions associated with the regulated facilities. The Nuclear Authorized segment captures 30
only those positions that require the incumbent to be, or have been, licensed by federal 31

Filed: 2016-05-27 EB-2016-0152
Exhibit F4 Tab 3
Schedule 1 Page 19 of 23
regulators, and represents a very small portion of OPG’s employee population (about 4 per 1
cent). The General Industry segment positions (about 27 per cent) are those commonly 2
found in many different types of industries, and that rely on expertise and knowledge from 3
disciplines not specific to energy generation (i.e., administrative support staff, finance, law, 4
human resources, etc.). 5
6
In determining the appropriate comparator group or companies, Towers focused on the 7
following types of organizations: 8
a) organizations from which OPG recruits, 9
b) organizations to which OPG loses staff, 10
c) organizations which operate in the same or similar industry sectors, and 11
d) organizations that reflect the complexity and size of OPG. 12
13
Figure 11 depicts the results of the Towers study in 2015 compared to the compensation 14
study conducted by AON Hewitt (“AON”) that was filed with the OEB in EB-2013-0321. 15
These results are shown by industry segment and union representation, capturing whether 16
OPG’s Total Direct Compensation is above, at, or under market. The downward arrows in 17
this table indicate those areas where OPG’s Total Direct Compensation dropped relative to 18
the market since 2013. 19
20
Figure 11 21
22
23
24
25
26
27
28
29
30
31
OPG
2015 2015 2013 2015 2013 2015 2013
PWU18%
Society
Mgmt Group
OPG
* Largest portion of OPG employees are in the Utility segment (69%).
Total Direct Compensation % Above or Below Market
Utility * Nuclear General Industry
-3%
3% -3%
-4%
21% 19% 29%
23%
21%
4%
7%
2%
-19% -27% 1%
27%
27%
19%
8%
8%
5%
10%
-13%
-14%
-3%

Filed: 2016-05-27 EB-2016-0152 Exhibit F4 Tab 3 Schedule 1 Page 20 of 23
Some variation in the benchmarking results has been noted between segments and by 1
representation: 2
3
a) Within the Utility and Nuclear Authorized segments, PWU represented employee 4
compensation is considered to be at market. Most PWU represented employees work 5
in positions in the Utility segment, and receive compensation that is at market. PWU 6
represented employee total direct compensation continues to be above market in the 7
General Industry segment. A small percentage of PWU employees (about 5 per cent) 8
work in the Nuclear Authorized segment and about a quarter of PWU employees work 9
in general industry segment jobs. 10
11
b) Society represented employees in the Utility segment receive compensation that is 12
considered to be at market, and is comparable to that provided in the comparator 13
organizations. Society represented employees in the Nuclear Authorized segment 14
receive compensation that is considered to be below market. 80 per cent of Society 15
represented employees work in the Utility and Nuclear Authorized segments. 16
17
c) Management compensation, as measured by total direct compensation, has dropped 18
significantly across all three segments since 2013 and is currently below market 19
overall. This is partly due to on-going salary restraints, as well as the inclusion of 20
long-term incentives in the market data. The incentives data were not included in the 21
AON study because there was insufficient data available for a valid comparison. 22
Long-term incentives are common in the market for Senior Management positions. 23
OPG does not have a long-term incentive program. 24
25
Overall results by segment suggest that the compensation provided for positions in the Utility 26
and Nuclear Authorized segments is appropriate. This is where the large majority of OPG’s 27
employees work. 28
29
Challenges continue to be faced for PWU and Society positions in the General Industry 30
segment where OPG is above market, although the comparison would be closer to market if 31

Filed: 2016-05-27 EB-2016-0152
Exhibit F4 Tab 3
Schedule 1 Page 21 of 23
measured against similar positions at utility companies. Challenges are also faced in the 1
Management Group in the Utility segment where compensation continues to be significantly 2
below market.7 3
4
To address these challenges the following actions have been taken: 5
6
a) Benchmarking information was shared with the unions to inform and set context for 7
the collective bargaining processes, along with a pension education session 8
conducted by AON. 9
10
b) New Management salary ranges were established in 2015 to align the mid-point of 11
the salary range with the target market position for each segment. OPG’s target 12
market for base salaries was set at the 50th percentile. Use of these new schedules 13
will help to align Management salaries for all segments and levels with the market in 14
the future. 15
16
Further changes to OPG’s compensation program are anticipated as part of Bill 8. Bill 8 17
allows the Lieutenant Governor of Ontario to establish a compensation framework for senior 18
leadership (e.g., Vice President and above) that OPG would be required to comply with. 19
20
6.0 WAGES AND THE GENERATION OF ELECTRICITY IN ONTARIO 21
Bruce Power is OPG’s closest competitor for attracting and retaining talent. Both Bruce 22
Power and OPG generate electricity in the same energy market, operate similar technology, 23
have a workforce comprised of similar roles, and have staff represented by the same unions. 24
25
Towers undertook a comparison of OPG’s wages to those provided by Bruce Power. The 26
results of this comparison are captured in Attachment 3 and a summary is provided below in 27
Figure 12. Bruce Power’s unionized wages are 16 per cent higher for PWU positions and 2 28
per cent higher for Society positions. 29
7 The Nuclear Authorized segment results are being affected by volatile exchange rates. Under more “typical”
economic conditions, the gap to market presented above is expected to be smaller than that shown here. These results do however reflect the current situation in the US market.

Filed: 2016-05-27 EB-2016-0152 Exhibit F4 Tab 3 Schedule 1 Page 22 of 23
1
Figure 12 2
Comparison of OPG and Bruce Power PWU and Society Base Salary 3
4
5
6
7
8
9
Note that OPG and Bruce Power both utilize a common job rating system and salary 10
structure for Society represented positions. Accordingly, a higher percentage of OPG’s 11
Society population could be compared to Bruce Power, than that depicted for the PWU. 12
OPG and Bruce Power no longer share a common salary structure for PWU represented 13
positions, which requires that the comparison be done by matching of individual jobs. 14
15
7.0 CONCLUSION 16
OPG employs a highly skilled workforce across the Province. Its regulated facilities constitute 17
critical infrastructure for the Province’s electric supply. OPG’s compensation and benefits are 18
largely the product of its collective agreements, which have recently been renegotiated with 19
the direct involvement of the Government of Ontario. Progress has been made in both the 20
recent PWU and Society collective agreements to bring compensation levels closer to 21
market, when compared to the levels in the EB-2013-0321 proceeding, as reflected in the 22
updated compensation benchmarking study. This includes wage increases below expected 23
CPI escalation and reductions to OPG’s pension costs. 24

Filed: 2016-05-27 EB-2016-0152
Exhibit F4 Tab 3
Schedule 1 Page 23 of 23
ATTACHMENTS 1
2
Attachment 1 - FTE, Compensation and Benefit Information for OPG’s Nuclear Facilities 3
(“Appendix 2k”) 4
5
Attachment 2 - Total Compensation Benchmarking Study prepared by Willis Towers 6
Watson 7
8
Attachment 3 - Comparison of Salary Schedules for Society and PWU Roles prepared by 9
Willis Towers Watson 10
11
Note: Attachments 2 and 3 are marked “Confidential”, however, OPG has determined them 12
to be non-confidential in their entirety. 13

Filed: 2016-05-27
EB-2016-0152
Ex. F4-3-1
Numbers may not add due to rounding Attachment 1
Line
No.NUCLEAR FACILITIES
2013
Actual
2014
Actual
2015
Actual
2016
Budget
2017
Plan
2018
Plan
2019
Plan
2020
Plan
2021
Plan
(a) (b) (c) (d) (e) (f) (g) (h) (i)
1 Staff (Regular and Non-Regular) FTEs FTEs FTEs FTEs FTEs FTEs FTEs FTEs FTEs
2
3 Nuclear - Direct
4 Management 578.6 553.1 521.7 573.3 605.8 602.9 606.2 596.0 583.2
5 Society 2,008.5 1,922.2 1,893.7 2,089.7 2,119.0 2,117.1 2,065.9 1,994.4 1,955.1
6 PWU 4,026.9 4,002.4 3,975.2 4,164.9 4,162.8 4,165.6 4,173.2 4,015.4 3,885.7
7 EPSCA 60.2 69.6 94.2 119.6 170.7 172.1 139.6 165.1 213.1
8 Subtotal 6,674.2 6,547.3 6,484.8 6,947.4 7,058.4 7,057.7 6,984.9 6,770.9 6,637.0
9
10 Nuclear - Allocated
11 Management 382.2 376.0 368.6 353.6 352.7 347.3 339.6 337.6 337.4
12 Society 607.1 625.6 590.3 664.2 665.5 652.8 642.2 638.9 636.9
13 PWU 930.2 882.8 658.0 739.5 708.7 687.6 682.0 666.6 665.9
14 EPSCA 0.0 0.0 12.0 16.0 16.0 16.0 16.0 16.0 16.0
15 Subtotal 1,919.5 1,884.4 1,628.9 1,773.3 1,742.8 1,703.7 1,679.8 1,659.0 1,656.2
16
17 NUCLEAR FACILITIES
18 Management 960.8 929.1 890.3 926.9 958.5 950.2 945.7 933.6 920.6
19 Society 2,615.5 2,547.8 2,484.0 2,753.9 2,784.5 2,769.9 2,708.1 2,633.3 2,592.0
20 PWU 4,957.1 4,885.2 4,633.2 4,904.3 4,871.4 4,853.2 4,855.3 4,681.9 4,551.5
21 EPSCA 60.2 69.6 106.2 135.6 186.7 188.1 155.6 181.1 229.1
22 Total 8,593.7 8,431.8 8,113.7 8,720.7 8,801.2 8,761.4 8,664.7 8,429.9 8,293.2
23
24Salary & Incentive Pay (including Fiscal Adjustment)
$M $M $M $M $M $M $M $M $M
25 Management 145.8 147.8 144.1 147.2 152.9 153.5 155.0 154.8 153.7
26 Society 318.9 312.9 310.8 348.9 361.0 367.3 363.0 362.1 363.5
27 PWU 502.1 507.0 487.3 535.8 549.1 555.2 565.2 560.4 553.9
28 EPSCA 8.9 10.6 14.3 13.6 19.1 19.3 16.3 19.3 25.0
29 Total 975.7 978.4 956.5 1,045.6 1,082.1 1,095.3 1,099.5 1,096.7 1,096.1
30 Overtime $M $M $M $M $M $M $M $M $M
31 Management 0.0 0.0 0.0 0.0 0.0 0.0 0.0 0.0 0.0
32 Society 46.8 32.2 36.8 33.1 36.0 35.7 36.8 30.4 24.0
33 PWU 110.5 83.4 89.4 77.5 79.6 78.4 80.3 69.9 54.6
34 EPSCA 1.8 1.9 5.7 1.3 1.8 1.7 1.5 1.6 2.5
35 Total 159.2 117.6 132.0 111.9 117.5 115.7 118.6 101.9 81.1
36Benefits (Current Benefits and Pension & OPEB)
$M $M $M $M $M $M $M $M $M
37 Management 57.8 48.7 51.3 50.2 52.6 51.4 51.8 51.6 51.0
38 Society 147.1 117.7 136.3 141.0 145.0 141.7 142.8 142.5 143.1
39 PWU 194.0 174.8 228.6 200.2 201.8 200.0 204.6 203.1 201.4
40 EPSCA 0.5 0.6 1.0 5.1 7.2 7.2 6.1 7.2 9.4
41 Total 399.5 341.9 417.2 396.5 406.5 400.3 405.2 404.4 404.9
42
43 Current Benefits (Statutory) 56.5 55.6 58.7 56.1 58.2 57.2 57.4 57.5 57.7
44 Current Benefits (Non-Statutory) 48.3 47.5 47.2 63.2 65.1 64.5 64.2 64.0 65.1
45 Pension & OPEB (Current Service)* 294.7 238.8 311.3 277.2 283.2 278.7 283.6 283.0 282.1
46 TOTAL COMPENSATION $M $M $M $M $M $M $M $M $M
47 Management 203.6 196.6 195.4 197.5 205.5 204.8 206.8 206.4 204.8
48 Society 512.8 462.9 483.9 523.0 542.0 544.7 542.6 535.0 530.7
49 PWU 806.6 765.3 805.4 813.5 830.5 833.7 850.0 833.5 809.9
50 EPSCA 11.3 13.1 21.0 20.0 28.2 28.2 23.8 28.2 36.9
51 Total 1,534.4 1,437.8 1,505.7 1,554.0 1,606.1 1,611.4 1,623.3 1,603.0 1,582.2
52
53 *presented on an accrual basis
F4-03-01_Attachment 1_20160527___ 2K Report - 2016-05-07_LD_DA.xlsx

Total Compensation Benchmarking Study
April 22, 2016
Prepared by Willis Towers Watson
175 Bloor Street East
Suite 1701
Toronto, ON
M4W 3T6
Ontario Power Generation
Filed: 2016-05-27
EB-2016-0152
Exhibit F4-3-1
Attachment 2
Page 1 of 37

Table of Contents
Introduction p. 3
Compensation Methodology
Segment Definitions p. 5
Comparator Group Selection p. 6
Compensation Benchmark Role Selection p. 7
Compensation Elements and Market Statistics p. 8
Compensation Benchmark Results Presentation p. 9
Overview: Compensation Analysis Results p. 10
Compensation Analysis Results by Job Family
Utility p. 13
Nuclear Authorized p. 17
General Industry p. 21
Pension and Benefits Analysis
Methodology p. 26
Market Statistics p. 27
Appendices
I. Comparator Organizations by Segment p. 29
II. Nuclear Utilities (Non Authorized) Market Analysis p. 34
III. Pension and Benefits Valuation p. 35
Filed: 2016-05-27
EB-2016-0152
Exhibit F4-3-1
Attachment 2
Page 2 of 37

Introduction
This benchmark review has
been conducted on a
segmented basis. Roles are
benchmarked against
comparator organizations
best representing the
underlying skill sets required.
The three segments are:
Utility, Nuclear Authorized and
General Industry.
78% of OPG incumbents are
in roles covered by this
benchmark review. In our
experience, this is a strong
representative sample.
Willis Towers Watson has conducted a total compensation benchmarking study for roles across
Ontario Power Generation’s (OPG) Management, PWU and Society employee groups.
OPG GroupTotal # OPG
Incumbents
Total # OPG
Incumbents
Benchmarked
% OPG Incumbents
Benchmarked
PWU 5,533 4,475 81%
Utility 3,754 3,169 84%
Nuclear Authorized 255 255 100%
General Industry 1,524 1,051 69%
Society 2,918 2,151 74%
Utility 2,235 1,808 81%
Nuclear Authorized 111 53 48%
General Industry 572 290 51%
Management 1,062 754 71%
Utility 532 355 67%
Nuclear Authorized 39 37 95%
General Industry 491 362 74%
Total 9,513 7,380 78%
Note: OPG incumbent information as of April 2015
Filed: 2016-05-27
EB-2016-0152
Exhibit F4-3-1
Attachment 2
Page 3 of 37

Compensation Methodology
Filed: 2016-05-27
EB-2016-0152
Exhibit F4-3-1
Attachment 2
Page 4 of 37

Segment Definitions
Roles are benchmarked against peer groups appropriately representing the underlying skills sets
required. These are categorized as three unique segments for benchmarking purposes.
Segment% Total
PopulationDefinition
Utility 69%
Requires specific education and knowledge in a unique discipline related to the
theories, principles and methods associated with the generation, regulation or
trading of nuclear or non-nuclear energy. The requirement to apply this
professional body of knowledge represents a significant portion of the job.
Nuclear Authorized 4%
Requires federal licensing, specific education and in-depth knowledge in a unique
discipline related to the theories, principles and methods associated with the
generation, regulation or training of nuclear energy. The requirement to apply this
professional body of knowledge represents a significant portion of the job.
General Industry 27%
Roles that do not meet the Utilities and Nuclear segment definition criteria.
These roles may require formal education and/or in-depth knowledge of a
professional body of knowledge; however, this body of knowledge is not specific to
energy generation.
Previous industry experience may support faster contextual understanding,
however this can be learned “on the job”.
Methodology Overview UtilityNuclear
Authorized
General
Industry
Pension and
BenefitsAppendices
Filed: 2016-05-27
EB-2016-0152
Exhibit F4-3-1
Attachment 2
Page 5 of 37

Comparator Group Selection
Comparator groups by segment were derived from the full list of organizations participating in the
Willis Towers Watson 2015 Compensation databases, based on the criteria below. The full list of
comparator organizations used by segment is provided in Appendix I.
1. Utility
• Primarily consists of public and private sector utility companies.
2. Nuclear Authorized
• These roles represent a small percentage of the total OPG population and are characterized by
unique complexity requirements and pay practices (particularly licensing and certification
allowances). Comparable roles are not readily found in Canada. Unlike the comparator
organizations for the other segments which reflect data for Canadian employees only, this
comparator group reflects a sample of 10 large nuclear organizations of a comparable size to
OPG, including Bruce Power (Canada) and nine US nuclear organizations.
3. General Industry
• Includes both public and private companies requiring a large range of skill sets and emphasis
on large Ontario employers. The “total sample” data consists of data weighted “50/50” between
the public and private companies within the peer group.
Methodology Overview UtilityNuclear
Authorized
General
Industry
Pension and
BenefitsAppendices
Filed: 2016-05-27
EB-2016-0152
Exhibit F4-3-1
Attachment 2
Page 6 of 37

Compensation Benchmark Role Selection
Based on job content information from OPG, each OPG role was matched to benchmark role
functional specialities and levels of accountability within the Willis Towers Watson’s 2015
Compensation databases where a suitable match was available.
In total, 78% of incumbents matched to over 250 survey roles are included in the analysis. This
encompasses roles across all OPG job families, employee groups and pay bands.
For non-authorized roles residing in nuclear plants, no direct matches were available, however it is
recognized that comparable skill sets reside within energy and utilities organizations. As such, jobs
were matched to non-nuclear comparators based on similar skills and level of accountability. Based
on a supplemental US analysis (details in Appendix II) a 10% adjustment was made to market
statistics for nuclear operations management roles reflecting the premium for these roles observed in
the US market where a critical mass of these skills reside.
Methodology Overview UtilityNuclear
Authorized
General
Industry
Pension and
BenefitsAppendices
Filed: 2016-05-27
EB-2016-0152
Exhibit F4-3-1
Attachment 2
Page 7 of 37

Compensation Elements and Market Statistics
Market statistics reported reflect the 50th percentile and 75th percentile of the benchmark samples for
the data elements summarized below:
50th percentile represents the mid-point of the sample, 50% of the data points are positioned below
and above this level.
75th percentile represents the level where 75% of the data points are positioned below and 25%
are positioned above this level.
For survey confidentiality purposes, the 75th percentile can only be shown if there are a
minimum of 5 data points in the sample.
Market data for the US nuclear peer group used for the Nuclear Authorized segment were converted
to CAD, consistent with Willis Towers Watson’s practice, using an average annual exchange rate to
February 2016 of $1 USD - $1.29676 CAD to moderate fluctuations.
Compensation
ElementMarket OPG
Salary2015 actual reported comparator organization salaries of incumbents in benchmark roles
Average salary (as of April 2015) of incumbents in benchmark roles
Total direct compensation (TDC)
2015 actual reported comparator organization salary + target bonus + nuclear allowances + perquisites (if applicable) + long-term incentives (if applicable) of incumbents in benchmark roles
Average salary (as of April 2015) + target bonus (if applicable) + nuclearand/or and other applicable allowances of incumbents in benchmark roles
Methodology Overview UtilityNuclear
Authorized
General
Industry
Pension and
BenefitsAppendices
Filed: 2016-05-27
EB-2016-0152
Exhibit F4-3-1
Attachment 2
Page 8 of 37

Compensation Benchmark Results Presentation
The benchmark results are separated by segment and OPG Group and are summarized by job family.
All OPG roles have been aligned to one of the following job families based on the underlying skill
set and benchmarked function:
OPG and market findings reflect the average pay and market statistics for all incumbents
benchmarked.
The % above or below the market reflects the variance between the sum of OPG’s compensation
and the sum of market results (i.e. 50th percentile or 75th percentile) for all incumbents
benchmarked within the respective job family, OPG Group and segment for the data element
reported where market data is available.
Administration Human Resources
Corporate Services Information Technology
Engineering Maintenance
Environment, Health & Safety Operations
Finance Supply Chain
Methodology Overview UtilityNuclear
Authorized
General
Industry
Pension and
BenefitsAppendices
Filed: 2016-05-27
EB-2016-0152
Exhibit F4-3-1
Attachment 2
Page 9 of 37

Overview: Compensation Analysis
Results
Filed: 2016-05-27
EB-2016-0152
Exhibit F4-3-1
Attachment 2
Page 10 of 37

Overview: Compensation Analysis Results
Methodology Overview UtilityNuclear
Authorized
General
Industry
Pension and
BenefitsAppendices
Willis Towers Watson considers compensation for benchmark jobs to be aligned with the
competitive market when it falls within +/- 10% of the target market position. OPG’s compensation
philosophy defines a target market position at the 50th percentile for Utility and General Industry
segments and the 75th percentile for the Nuclear Authorized Segment (based on role complexity).
Overall, OPG’s Total Direct Compensation is positioned within 5% of the target market. The Utility
segment, which includes approximately three quarters of the incumbents, is positioned within 2%
of the target market.
Note: Target positioning for roles in the Nuclear Authorized
segment is the 75th percentile, except for Senior Executive roles
which target the 50th percentile.
OPG Group and
Segment
# OPG Matched
Incumbents
% +/- Target
Market
Base Salary
% +/- Target
Market
TDC
PWU 4,475 13% 8%
Utility 3,169 10% 4%
Nuclear Authorized 255 7% 10%
General Industry 1,051 31% 27%
Society 2,151 18% 8%
Utility 1,808 17% 7%
Nuclear Authorized 53 -7% -14%
General Industry 290 38% 27%
Management Group 754 -7% -13%
Utility 355 -12% -19%
Nuclear Authorized 37 -18% -27%
General Industry 362 3% 1%
Overall 7,380 12% 5%
OPG Segment
% +/- Target
Market
Base Salary
% +/- Target
Market
TDC
Utility 10% 2%
Nuclear Authorized 1% -3%
General Industry 25% 19%
Filed: 2016-05-27
EB-2016-0152
Exhibit F4-3-1
Attachment 2
Page 11 of 37

Compensation Analysis Results by
Job Family
Filed: 2016-05-27
EB-2016-0152
Exhibit F4-3-1
Attachment 2
Page 12 of 37

Results by Job FamilyUtility Segment
Job Family Distribution
The PWU Group consists primarily of the Maintenance (62%) and Operations (37%) job families.
The majority of benchmarked incumbents in the Society Group are within the Engineering Job Family
(64%). Low population job families are related to energy trading and plant front-line technology
training.
The majority of benchmarked incumbents within the Management Group are within the Engineering
(35%) and Corporate Services (28%) job families. Corporate Services includes industry specific
regulatory affairs, sustainability and strategic planning roles.
Market Positioning
Overall, the PWU, Society and Management Groups are positioned within the market competitive
range on a Total Direct Compensation basis although overall positioning varies between groups and
job families, with the Management Group falling below the market competitive range.
Methodology Overview UtilityNuclear
Authorized
General
Industry
Pension and
BenefitsAppendices
Filed: 2016-05-27
EB-2016-0152
Exhibit F4-3-1
Attachment 2
Page 13 of 37

Utility Segment Results by Job FamilyPWU
Methodology Overview UtilityNuclear
Authorized
General
Industry
Pension and
BenefitsAppendices
Note: 75th percentile % above or below the market reflects the variance between the sum of OPG’s compensation and the sum of market results for all
incumbents benchmarked where 75th percentile market data is available.
Segment: Utility
OPG Group: PWU
Job Family
# OPG
Matched
Incumbents
Avg.
OPGAvg. P50 % +/- P50 Avg. P75 % +/- P75
Avg.
OPGAvg. P50 % +/- P50 Avg. P75 % +/- P75
Administration
Corporate Services
Engineering
Environment, Health & Safety 16 $119 $123 -3% $128 -7% $119 $138 -14% $145 -18%
Finance
Human Resources
Information Technology
Maintenance 1,966 $108 $93 17% $109 -1% $108 $99 9% $116 -6%
Operations 1,187 $104 $102 1% $116 -11% $104 $107 -3% $121 -14%
Supply Chain
Average (weighted average) 10% -5% 4% -9%
Base Salary Total Direct Compensation
Filed: 2016-05-27
EB-2016-0152
Exhibit F4-3-1
Attachment 2
Page 14 of 37

Utility Segment Results by Job FamilySociety
Methodology Overview UtilityNuclear
Authorized
General
Industry
Pension and
BenefitsAppendices
Note: 75th percentile % above or below the market reflects the variance between the sum of OPG’s compensation and the sum of market results for all
incumbents benchmarked where 75th percentile market data is available.
Segment: Utility
OPG Group: Society
Job Family
# OPG
Matched
Incumbents
Avg.
OPGAvg. P50 % +/- P50 Avg. P75 % +/- P75
Avg.
OPGAvg. P50 % +/- P50 Avg. P75 % +/- P75
Administration
Corporate Services 143 $129 $108 19% $118 9% $129 $119 8% $130 -1%
Engineering 1,157 $111 $94 19% $106 5% $111 $101 10% $114 -2%
Environment, Health & Safety 138 $123 $107 15% $117 5% $123 $119 4% $129 -4%
Finance
Human Resources
Information Technology
Maintenance 215 $139 $123 13% $139 0% $139 $138 0% $160 -13%
Operations 155 $129 $119 9% $133 -2% $129 $131 -1% $143 -10%
Supply Chain
Average (weighted average) 17% 4% 7% -5%
Base Salary Total Direct Compensation
Filed: 2016-05-27
EB-2016-0152
Exhibit F4-3-1
Attachment 2
Page 15 of 37

Utility Segment Results by Job FamilyManagement
Methodology Overview UtilityNuclear
Authorized
General
Industry
Pension and
BenefitsAppendices
Note: 75th percentile % above or below the market reflects the variance between the sum of OPG’s compensation and the sum of market results for all
incumbents benchmarked where 75th percentile market data is available.
Due to small sample size (less than 4 incumbents), average compensation results for the Supply Chain Job Family can not be disclosed.
Segment: Utility
OPG Group: Management
Job Family
# OPG
Matched
Incumbents
Avg.
OPGAvg. P50 % +/- P50 Avg. P75 % +/- P75
Avg.
OPGAvg. P50 % +/- P50 Avg. P75 % +/- P75
Administration
Corporate Services 100 $139 $157 -12% $186 -26% $162 $198 -18% $240 -32%
Engineering 126 $129 $154 -16% $172 -25% $150 $184 -18% $230 -35%
Environment, Health & Safety 23 $136 $144 -6% $158 -14% $157 $172 -9% $199 -21%
Finance
Human Resources
Information Technology
Maintenance 75 $139 $146 -5% $158 -12% $161 $172 -7% $202 -20%
Operations 30 $176 $202 -13% $228 -23% $237 $395 -40% $624 -62%
Supply Chain 1 --- --- 20% --- -14% --- --- 1% --- -29%
Average (weighted average) -12% -22% -19% -37%
Base Salary Total Direct Compensation
Filed: 2016-05-27
EB-2016-0152
Exhibit F4-3-1
Attachment 2
Page 16 of 37

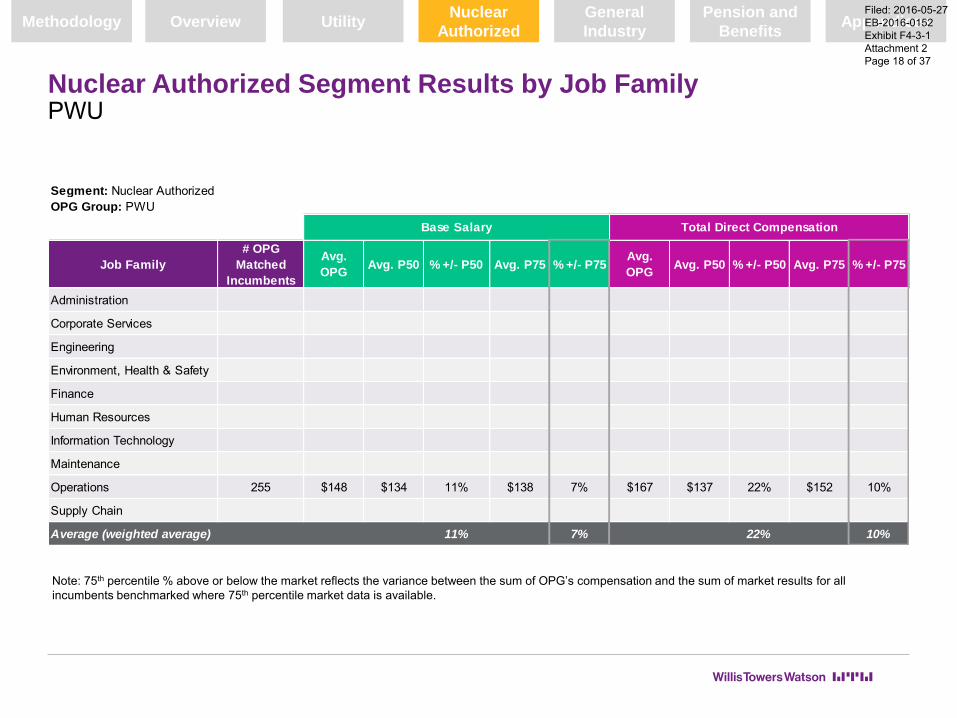
Results by Job FamilyNuclear Authorized Segment
Job Family Distribution
The Operations Job Family represents 100% of benchmarked roles within the PWU and Society
Groups and 97% of the Management Group benchmarked roles.
Market Positioning
Total Direct Compensation positioning within the Nuclear Authorized segment relative to the target
market position (75th percentile) varies by OPG Group.
The PWU Group is positioned within the competitive range while the Society and Management
Groups are positioned below the competitive range, respectively.
Methodology Overview UtilityNuclear
Authorized
General
Industry
Pension and
BenefitsAppendices
Filed: 2016-05-27
EB-2016-0152
Exhibit F4-3-1
Attachment 2
Page 17 of 37
Nuclear Authorized Segment Results by Job FamilyPWU
Methodology Overview UtilityNuclear
Authorized
General
Industry
Pension and
BenefitsAppendices
Note: 75th percentile % above or below the market reflects the variance between the sum of OPG’s compensation and the sum of market results for all
incumbents benchmarked where 75th percentile market data is available.
Segment: Nuclear Authorized
OPG Group: PWU
Job Family
# OPG
Matched
Incumbents
Avg.
OPGAvg. P50 % +/- P50 Avg. P75 % +/- P75
Avg.
OPGAvg. P50 % +/- P50 Avg. P75 % +/- P75
Administration
Corporate Services
Engineering
Environment, Health & Safety
Finance
Human Resources
Information Technology
Maintenance
Operations 255 $148 $134 11% $138 7% $167 $137 22% $152 10%
Supply Chain
Average (weighted average) 11% 7% 22% 10%
Base Salary Total Direct Compensation
Filed: 2016-05-27
EB-2016-0152
Exhibit F4-3-1
Attachment 2
Page 18 of 37

Nuclear Authorized Segment Results by Job FamilySociety
Methodology Overview UtilityNuclear
Authorized
General
Industry
Pension and
BenefitsAppendices
Note: 75th percentile % above or below the market reflects the variance between the sum of OPG’s compensation and the sum of market results for all
incumbents benchmarked where 75th percentile market data is available.
Segment: Nuclear Authorized
OPG Group: Society
Job Family
# OPG
Matched
Incumbents
Avg.
OPGAvg. P50 % +/- P50 Avg. P75 % +/- P75
Avg.
OPGAvg. P50 % +/- P50 Avg. P75 % +/- P75
Administration
Corporate Services
Engineering
Environment, Health & Safety
Finance
Human Resources
Information Technology
Maintenance
Operations 53 $172 $178 -3% $185 -7% $213 $229 -7% $249 -14%
Supply Chain
Average (weighted average) -3% -7% -7% -14%
Base Salary Total Direct Compensation
Filed: 2016-05-27
EB-2016-0152
Exhibit F4-3-1
Attachment 2
Page 19 of 37

Nuclear Authorized Segment Results by Job FamilyManagement
Methodology Overview UtilityNuclear
Authorized
General
Industry
Pension and
BenefitsAppendices
Note: 75th percentile % above or below the market reflects the variance between the sum of OPG’s compensation and the sum of market results for all
incumbents benchmarked where 75th percentile market data is available.
Due to small sample size (less than 4 incumbents), average compensation results for the Engineering Job Family can not be disclosed.
Target positioning for roles in the Nuclear Authorized segment is the 75th percentile, except for Senior Executive roles which target the 50th percentile. The Total
Direct Compensation positioning to target market for the Management Group is -27%.
Segment: Nuclear Authorized
OPG Group: Management
Job Family
# OPG
Matched
Incumbents
Avg.
OPGAvg. P50 % +/- P50 Avg. P75 % +/- P75
Avg.
OPGAvg. P50 % +/- P50 Avg. P75 % +/- P75
Administration
Corporate Services
Engineering 1 --- --- -11% --- -28% --- --- -38% --- -55%
Environment, Health & Safety
Finance
Human Resources
Information Technology
Maintenance
Operations 36 $183 $216 -15% $234 -22% $287 $365 -21% $418 -31%
Supply Chain
Average (weighted average) -15% -22% -22% -33%
Base Salary Total Direct Compensation
Filed: 2016-05-27
EB-2016-0152
Exhibit F4-3-1
Attachment 2
Page 20 of 37

Results by Job FamilyGeneral Industry
Job Family Distribution
Benchmarked incumbents within PWU are primarily within Administration (39%) and Maintenance
(52%).
Benchmarked incumbents also span seven job families within the Society Group with the majority
within Finance (49%) and Information Technology (27%).
Benchmarked incumbents span seven job families within the Management Group, with the majority in
Administration (37%) and Human Resources (25%).
Market Positioning
Total Direct Compensation positioning within the General Industry segment varies by OPG Group and
Job Family:
The PWU and Society Groups are generally aligned above the competitive market range.
The Management Group is aligned overall with the competitive market range.
Methodology Overview UtilityNuclear
Authorized
General
Industry
Pension and
BenefitsAppendices
Filed: 2016-05-27
EB-2016-0152
Exhibit F4-3-1
Attachment 2
Page 21 of 37

General Industry Segment Results by Job FamilyPWU
Methodology Overview UtilityNuclear
Authorized
General
Industry
Pension and
BenefitsAppendices
Note: 75th percentile % above or below the market reflects the variance between the sum of OPG’s compensation and the sum of market results for all
incumbents benchmarked where 75th percentile market data is available.
Segment: General Industry
OPG Group: PWU
Job Family
# OPG
Matched
Incumbents
Avg.
OPGAvg. P50 % +/- P50 Avg. P75 % +/- P75
Avg.
OPGAvg. P50 % +/- P50 Avg. P75 % +/- P75
Administration 408 $71 $49 45% $54 33% $71 $51 40% $57 25%
Corporate Services
Engineering
Environment, Health & Safety
Finance 78 $79 $53 48% $60 32% $79 $55 44% $62 27%
Human Resources
Information Technology
Maintenance 551 $84 $69 21% $78 9% $84 $72 18% $84 0%
Operations
Supply Chain 14 $84 $52 62% $60 40% $84 $53 57% $64 31%
Average (weighted average) 31% 19% 27% 11%
Base Salary Total Direct Compensation
Filed: 2016-05-27
EB-2016-0152
Exhibit F4-3-1
Attachment 2
Page 22 of 37

General Industry Segment Results by Job FamilySociety
Methodology Overview UtilityNuclear
Authorized
General
Industry
Pension and
BenefitsAppendices
Note: 75th percentile % above or below the market reflects the variance between the sum of OPG’s compensation and the sum of market results for all
incumbents benchmarked where 75th percentile market data is available.
Segment: General Industry
OPG Group: Society
Job Family
# OPG
Matched
Incumbents
Avg.
OPGAvg. P50 % +/- P50 Avg. P75 % +/- P75
Avg.
OPGAvg. P50 % +/- P50 Avg. P75 % +/- P75
Administration 14 $105 $85 23% $100 5% $105 $93 13% $114 -8%
Corporate Services 20 $114 $82 39% $95 20% $114 $90 27% $106 8%
Engineering
Environment, Health & Safety
Finance 142 $123 $88 40% $101 22% $123 $96 29% $112 10%
Human Resources 7 $104 $68 54% $79 33% $104 $72 46% $87 20%
Information Technology 79 $124 $93 34% $103 21% $124 $100 24% $114 10%
Maintenance
Operations
Supply Chain 28 $118 $85 39% $96 23% $118 $91 30% $105 12%
Average (weighted average) 38% 21% 27% 9%
Base Salary Total Direct Compensation
Filed: 2016-05-27
EB-2016-0152
Exhibit F4-3-1
Attachment 2
Page 23 of 37

General Industry Segment Results by Job FamilyManagement
Methodology Overview UtilityNuclear
Authorized
General
Industry
Pension and
BenefitsAppendices
Note: 75th percentile % above or below the market reflects the variance between the sum of OPG’s compensation and the sum of market results for all
incumbents benchmarked where 75th percentile market data is available.
Due to small sample size (less than 4 incumbents), average compensation results for the Information Technology Job Family can not be disclosed.
Segment: General Industry
OPG Group: Management
Job Family
# OPG
Matched
Incumbents
Avg.
OPGAvg. P50 % +/- P50 Avg. P75 % +/- P75
Avg.
OPGAvg. P50 % +/- P50 Avg. P75 % +/- P75
Administration 133 $56 $53 7% $57 -2% $61 $55 10% $61 0%
Corporate Services 40 $151 $144 5% $167 -9% $184 $185 0% $229 -19%
Engineering
Environment, Health & Safety 11 $93 $79 18% $126 -26% $104 $90 16% $155 -33%
Finance 68 $137 $131 5% $143 -4% $162 $164 -2% $183 -12%
Human Resources 91 $108 $111 -3% $126 -14% $128 $131 -2% $152 -16%
Information Technology 4 --- --- 2% --- -13% --- --- -3% --- -23%
Maintenance
Operations
Supply Chain 15 $139 $129 8% $148 -6% $162 $147 10% $172 -6%
Average (weighted average) 3% -7% 1% -12%
Base Salary Total Direct Compensation
Filed: 2016-05-27
EB-2016-0152
Exhibit F4-3-1
Attachment 2
Page 24 of 37

Pension and Benefits Analysis
Filed: 2016-05-27
EB-2016-0152
Exhibit F4-3-1
Attachment 2
Page 25 of 37

Methodology – Pension and Benefit Analysis
Pension and benefit information was obtained from the Willis Towers Watson’s Benefit Data Source –
Canada based on comparator organizations representing a 50%/50% mix of private and public sector
organizations. Comparator organizations are not differentiated by segment as organizations typically
offer common pension and benefit plans across all roles and skill sets. A list of comparator
organizations are presented in Appendix I.
Comparator organizations were established based on data availability where program information is
available for comparator PWU, Society and Management populations. Plan provisions valued are
those that apply to newly hired employees.
Results are based on the benefits data and information provided to Willis Towers Watson by
participating organizations. Benefit plans included in the analysis are: pension, savings (including
stock purchase, group RRSP, DPSP), active and retiree health care and dental care, short-term
disability, long term disability and active and retiree benefits. Benefits no longer available to new hires
are not considered.
We determined a value for these benefits by applying a standard methodology to develop employee
profiles based on applicable PWU, Society and Management age, service, gender and salary
demographics. Detailed methodology is presented in Appendix III.
Methodology Overview UtilityNuclear
Authorized
General
Industry
Pension and
BenefitsAppendices
Filed: 2016-05-27
EB-2016-0152
Exhibit F4-3-1
Attachment 2
Page 26 of 37

Market Statistics
Methodology Overview UtilityNuclear
Authorized
General
Industry
Pension and
BenefitsAppendices
For the market studied in this review, pension and benefits represent a small component of the
overall total compensation package.
The table below illustrates the weighted average of pension and benefit employer-provided values
as a % of base salary at OPG and how it compares to the 50th percentile of the market, recognizing
that values vary across demographic, tenure and age profiles.
The employer-provided value of OPG’s pension and benefits as a % of base salary is above the 50th
percentile of the market for the PWU, Society and Management Groups.
OPG Group OPG Market P50
PWU 29.7% 20.2%
Society 30.3% 20.3%
Management 31.3% 22.8%
Pension & Benefits % of Base Salary
Filed: 2016-05-27
EB-2016-0152
Exhibit F4-3-1
Attachment 2
Page 27 of 37

Appendices
Filed: 2016-05-27
EB-2016-0152
Exhibit F4-3-1
Attachment 2
Page 28 of 37

Compensation Comparator OrganizationsUtility Segment
* Data excludes Alberta incumbents
# Company (n = 29)
1 Alberta Electric System Operator 16 FortisAlberta Inc.
2 Alcoa Canada 17 GE Energy
3 Algonquin Power and Utilities Corp. 18 Hydro One Inc.
4 Altalink 19 Hydro Quebec
5 ArcelorMittal Montreal Inc. 20 Kinross Gold Corporation
6 ATCO Group 21 Newfoundland and Labrador Hydro Electric Corporation
7 Barrick Gold Corporation 22 Rio Tinto Alcan Canada
8 BC Hydro Power & Authority 23 Samuel, Son & Co., Ltd.
9 Bruce Power LP 24 SaskPower
10 Capital Power Corporation 25 Spectra Energy Transmission*
11 Chevron Canada Limited 26 Toronto Hydro Electric
12 Enbridge Inc.* 27 TransAlta Corporation
13 ENMAX Corporation 28 TransCanada Corp.
14 EPCOR Utilities Inc. 29 United States Steel Canada
15 ExxonMobil Canada
Methodology Overview UtilityNuclear
Authorized
General
Industry
Pension and
BenefitsAppendix I
Filed: 2016-05-27
EB-2016-0152
Exhibit F4-3-1
Attachment 2
Page 29 of 37

Compensation Comparator OrganizationsNuclear Authorized Segment
# Company (n = 10)
1 Bruce Power
2 Dominion Resources
3 Duke Energy
4 Entergy
5 Exelon
6 FirstEnergy
7 NextEra Energy
8 Public Service Enterprise Group
9 Southern Company Services
10 Tennessee Valley Authority
Methodology Overview UtilityNuclear
Authorized
General
Industry
Pension and
BenefitsAppendix I
Filed: 2016-05-27
EB-2016-0152
Exhibit F4-3-1
Attachment 2
Page 30 of 37

Compensation Comparator OrganizationsGeneral Industry Segment – Public Sector
# Company (n = 23)
Public Sector - weighted 50% for benchmarking purposes
1 Alberta Electric System Operator
2 Alberta Energy Regulator (previously Energy Resources Conservation Board)
3 Bank of Canada
4 BC Hydro Power & Authority
5 British Columbia Lottery Corporation
6 Canada Post
7 Canadian Broadcasting Corporation/Radio Canada
8 CPP Investment Board
9 ENMAX Corporation
10 EPCOR Utilities Inc.
11 Healthcare of Ontario Pension Plan
12 Hydro-Québec
13 Insurance Corporation of British Columbia (ICBC)
14 Loto-Québec
15 Newfoundland and Labrador Hydro Electric Corporation
16 SaskPower
17 SGI Canada
18 Toronto Hydro Electric
19 Treasury Board of Canada Secretariat
20 University Health Network
21 VIA Rail Canada Inc.
22 Workplace Safety & Insurance Board - Ontario
23 York University
Methodology Overview UtilityNuclear
Authorized
General
Industry
Pension and
BenefitsAppendix I
Filed: 2016-05-27
EB-2016-0152
Exhibit F4-3-1
Attachment 2
Page 31 of 37

Compensation Comparator OrganizationsGeneral Industry Segment – Private Sector
* Data will exclude Alberta incumbents
# Company (n = 58)
Private Sector - weighted 50% for benchmarking purposes
1 The Coca-Cola Company-Canada 30 Kinross Gold Corporation
2 Air Canada 31 Kruger Inc.3 Alcoa Canada 32 Loblaw Companies Limited4 Algonquin Power and Utilities Corp. 33 Magna International Inc.5 AMEC Americas Limited 34 Manulife Financial Corporation
6 ATCO Group 35 Maple Leaf Foods Inc.
7 ATS Automation Tooling Systems Inc 36 McCain Foods Limited
8 Bank of Montreal 37 Molson Coors Canada
9 BCE Inc. 38 Nexen Energy ULC
10 Bruce Power LP 39 Nissan Canada, Inc.11 Canada Colors and Chemicals Limited 40 Parmalat Canada
12 Canadian Imperial Bank of Commerce 41 Procter & Gamble Inc.
13 Canadian National Railway 42 Purolator Inc.14 Canadian Pacific Railway Ltd. 43 RBC Financial
15 Canadian Tire Corporation 44 Rio Tinto Alcan Canada
16 Capital Power Corporation 45 RioCan Real Estate Investment Trust17 Cargill Limited 46 Rogers Communications Inc.18 Celestica Inc. 47 Rothmans Bensons & Hedges
19 Chevron Canada Limited 48 Samuel, Son & Co., Ltd
20 Enbridge Inc. * 49 Scotiabank21 Encana Corporation 50 Spectra Energy *
22 Ernst & Young Canada 51 Sun Life Financial23 FCA Canada Inc. (Formerly Chrysler Canada Inc.) 52 Talisman Energy Inc.
24 Federal Express Canada Ltd. 53 TD Bank Financial Group25 Ford Motor Company of Canada, Limited 54 Toyota Motor Manufacturing Canada26 General Electric Canada 55 TransAlta Corporation
27 Gerdau Long Steel North America 56 TransCanada Corp.
28 Hydro One Inc. 57 Unilever Canada
29 Johnson and Johnson Canada 58 Viterra Inc
Methodology Overview UtilityNuclear
Authorized
General
Industry
Pension and
BenefitsAppendix I
Filed: 2016-05-27
EB-2016-0152
Exhibit F4-3-1
Attachment 2
Page 32 of 37
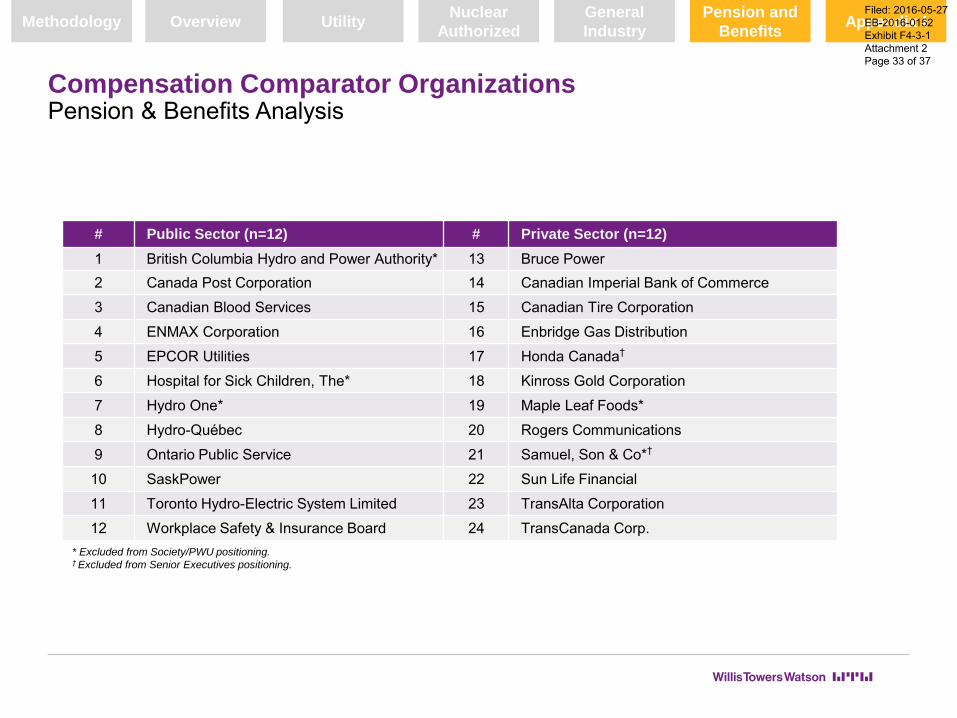
Compensation Comparator OrganizationsPension & Benefits Analysis
# Public Sector (n=12) # Private Sector (n=12)
1 British Columbia Hydro and Power Authority* 13 Bruce Power
2 Canada Post Corporation 14 Canadian Imperial Bank of Commerce
3 Canadian Blood Services 15 Canadian Tire Corporation
4 ENMAX Corporation 16 Enbridge Gas Distribution
5 EPCOR Utilities 17 Honda Canada†
6 Hospital for Sick Children, The* 18 Kinross Gold Corporation
7 Hydro One* 19 Maple Leaf Foods*
8 Hydro-Québec 20 Rogers Communications
9 Ontario Public Service 21 Samuel, Son & Co*†
10 SaskPower 22 Sun Life Financial
11 Toronto Hydro-Electric System Limited 23 TransAlta Corporation
12 Workplace Safety & Insurance Board 24 TransCanada Corp.
Methodology Overview UtilityNuclear
Authorized
General
Industry
Pension and
BenefitsAppendix I
* Excluded from Society/PWU positioning.† Excluded from Senior Executives positioning.
Filed: 2016-05-27
EB-2016-0152
Exhibit F4-3-1
Attachment 2
Page 33 of 37

Nuclear Utilities (Non Authorized) Market Analysis
To assess whether base salaries within the Non-Authorized Nuclear segment are different relative to
the Utility segment for similar skills sets and levels of accountability, the following analysis was
performed:
Comparison of relative job rates between select US utilities and nuclear organizations to
understand whether nuclear roles within the US are paid differently than utility roles in the US (for
roles reflecting comparable skills and level of accountability).
Comparison of relative job rates between the Canadian Utility comparator group (used for the
benchmark review) and the US nuclear comparator group to assess whether there is any
differentiation between these two markets (for roles reflecting comparable skills and level of
accountability).
The analysis indicated that for many roles and levels of work, salaries are comparable between these
sectors. However, for nuclear operations management roles, base salaries are observed to carry an
average premium of 10% relative to their non-nuclear counterparts. As such, where comparisons for
non-authorized roles in nuclear facilities have been made to the Canadian utility comparator group,
market data is adjusted by 10% to reflect this identified premium for such roles.
Methodology Overview UtilityNuclear
Authorized
General
Industry
Pension and
BenefitsAppendix II
Filed: 2016-05-27
EB-2016-0152
Exhibit F4-3-1
Attachment 2
Page 34 of 37

Pension and Benefits Valuation Pension Plans
The methodology used determines the value to employees of each organization’s benefits program by
plan. The purpose is to quantify the provisions offered by each organization. The pension and benefit
plan values are determined by applying a common set of actuarial methods and assumptions to
employee profiles (these values are not intended to represent actual plan/program costs).
Defined Benefit (DB) Plans
These plans are valued in terms of anticipated prospective benefit payments being allocated over
the employee's entire working history (Projected Unit Credit with service prorate method was used
except for Executives where the Entry Age Normal cost method was used).
The following elements are considered in determining comparative values for defined benefit
pension plans: normal and early retirement benefits, preretirement and postretirement death
benefits, termination benefits, postretirement pension adjustments and employee contributions.
For Executives, bridge benefits were not considered since these benefits are relatively low in
comparison with the total pension benefit of high earners and information available on these
benefits is limited.
Defined Contribution (DC) and Savings Plans
Plans are valued by determining employee and employer contributions made during the year of
valuation (Term Cost method). Employees are deemed to contribute in such a way that reflects
their savings opportunity and ability to contribute. Accordingly, they will contribute differently
depending on available income, on the level of contributions permitted in the plan and on the level
of employer match. Contribution levels to profit sharing plans are determined by averaging the last
five years’ actual contributions to the plan.
Methodology Overview UtilityNuclear
Authorized
General
Industry
Pension and
BenefitsAppendix III
Filed: 2016-05-27
EB-2016-0152
Exhibit F4-3-1
Attachment 2
Page 35 of 37

Pension and Benefits Valuation Benefit Plans
Death Benefit Plans
Death Benefit plan values for the following benefits are calculated: preretirement and
postretirement group life insurance (using the projected unit credit with service prorate method),
accidental death and dismemberment benefits and survivor income benefits.
Disability Plans
Short-term disability benefits include salary continuance and sickness plans. Values are
determined according to specific plan provisions including waiting periods, durations and benefit
amounts.
Long-term Disability Plan values are determined according to specific plan provisions including
waiting periods, definitions of disability, durations, benefit amounts, benefits coordination and
indexation.
Flexible Benefits (other than pension)
The value determined for these benefits is based on the highest enrolled option for each plan.
When not determined by the plan design, flexible benefit credits are allocated in the following
order: health care benefits, dental care benefits, life insurance benefits and disability benefits.
Remaining flexible credits, if any, are directed to a Health/Dental Care Spending Account if it exists
and the value of such credits are included in the value of the health care plan.
The postretirement Health/Dental Care Spending Account is assumed to remain at the current level
unless stated otherwise by participants, in which case the annual increase assumption provided by
each participant is applied.
Methodology Overview UtilityNuclear
Authorized
General
Industry
Pension and
BenefitsAppendix III
Filed: 2016-05-27
EB-2016-0152
Exhibit F4-3-1
Attachment 2
Page 36 of 37

Pension and Benefits Valuation Benefit Plans
Health Care and Dental Care Plans
Values are generated for preretirement and postretirement coverage (using the projected unit credit
with service prorate method). Postretirement values and retiree contributions are increased to
reflect future inflation. However, deductibles under postretirement health care plans are assumed
to remain at the current level in the future. Values are determined using recent claims experience
for large organizations taking into account plan deductibles, coinsurance and maximums as well as
eligibility requirements.
In line with general market practice, health care plans (including drug plans) are generally assumed
to be second payer to any provincial health care plans when applicable. It is also assumed that the
current practice with respect to government programs having an impact on our calculations would
remain unchanged. Amounts allocated to the Health/Dental Care Spending Account are included in
the health care plan value.
Methodology Overview UtilityNuclear
Authorized
General
Industry
Pension and
BenefitsAppendix III
Filed: 2016-05-27
EB-2016-0152
Exhibit F4-3-1
Attachment 2
Page 37 of 37

Comparison of Salary Schedules for Society and
PWU roles (OPG vs Bruce Power)
25 April, 2016
Ontario Power Generation (OPG)
Filed: 2016-05-27
EB-2016-0152
Exhibit F4-3-1
Attachment 3
Page 1 of 3

Base Salary ComparisonSociety of Energy Professional Roles
Notes:
• Employee headcount is based on incumbent file dated April 2015
• Sample job titles are those roles with the highest employee populations
• Hours worked are the same for both OPG and Bruce Power
• Where annualized salary is calculated it is based on a 365.25 day year recognizing the effect of the 2016 leap year
Sources:
• Collective Agreement between Bruce Power and the Society of Energy Professionals (Jan 1, ‘15 – Dec 31, ’18) attained from the Ministry of Labour
• OPG Society of Energy Professionals salary schedules obtained from OPG as they were not filed with the Ministry of Labour at the date of the analysis
2015 2015
Weekly Yearly
OPG Band Sample Job TitlesApril 2015
HeadcountOPG
Bruce
Power
Difference (OPG - Bruce Power)OPG
Bruce
Power
Difference (OPG - Bruce Power)
$ Per Week % Per Week $ Per Year % Per Year
Authorized
Shift Supervisor In Training 53 $3,008.08 $3,107.00 -$98.92 -3% $156,850 $162,008 -$5,158 -3%
Control Room Shift Supervisor, Training Supervisor 58 $3,363.23 $3,793.00 -$429.77 -13% $175,368 $197,778 -$22,409 -13%
MP6 - 40 Hr Section Manager Outage, Real Time Markets Supv (Shift) 23 $3,043.52 $3,104.00 -$60.48 -2% $158,806 $161,962 -$3,156 -2%
MP5 - 40 Hr Project Site Supervisor, Real Time Markets Specialist (Shift) 22 $2,854.88 $2,912.00 -$57.12 -2% $148,964 $151,944 -$2,980 -2%
MP4 - 40 Hr FLM, Control/Mechanical / Trades Mgmt Supv, Hydroelectric 518 $2,677.83 $2,730.00 -$52.17 -2% $139,725 $142,447 -$2,722 -2%
MP3 - 40 Hr FLM, Civil Maintenance 32 $2,511.01 $2,560.00 -$48.99 -2% $131,021 $133,577 -$2,556 -2%
MP6 - 35 Hr Section Head Information Systems, Senior Performance Improvement Officer 347 $2,598.28 $2,650.00 -$51.72 -2% $135,575 $138,273 -$2,699 -2%
MP5 - 35 Hr Sr Engineer/Scientist - Specialist 226 $2,436.59 $2,486.00 -$49.41 -2% $127,138 $129,716 -$2,578 -2%
MP4 - 35 Hr Senior Technical Engineer/Officer , Eng/Applied Science Trainee 1513 $2,285.19 $2,331.00 -$45.81 -2% $119,238 $121,628 -$2,390 -2%
MP3 - 35 Hr Assistant Proceurement Specialist, Financial Analyst 80 $2,144.04 $2,186.00 -$41.96 -2% $111,873 $114,062 -$2,189 -2%
MP2 - 35 Hr Materials Co-Ordinator, Support Specialist 24 $2,010.61 $2,051.00 -$40.39 -2% $104,911 $107,018 -$2,107 -2%
Totals & Weighted Average 2,896 $2,446.24 $2,502.93 -$56.69 -2% $127,637 $130,594 -$2,957 -2%
% of OPG Society population 100%
Filed: 2016-05-27
EB-2016-0152
Exhibit F4-3-1
Attachment 3
Page 2 of 3

Base Salary ComparisonPower Workers’ Union Roles
Notes:
• Employee headcount is based on incumbent file dated April 2015
• OPG collective agreement provides salary schedules by band, whereas the Bruce Power agreement is on a role basis. Prior to the introduction of skill broadening, OPG utilized
a salary schedule that was structured similar to Bruce Power. Therefore comparisons are on a best effort basis by matching jobs at Bruce Power to those previously used by
OPG and which continue to be utilized today in a broader capacity
• As there are differences in hours worked between OPG and Bruce Power (cases where † is indicated), annualized salary has been provided which takes into account the
different working hours
• Where annualized salary is calculated it is based on a 365.25 day year recognizing the effect of the 2016 leap year
Sources:
• Collective Agreement between Bruce Power and the Power Workers’ Union (Jan 1,’14 – Dec 31, ‘17) attained from the Ministry of Labour
• Collective Agreement between OPG and the Power Workers Union (Apr 1, ‘15 – Mar 31, ‘18) attained from the Ministry of Labour and OPG
2015
Hourly Yearly
OPG Band Job TitlesApril 2015
HeadcountOPG
Bruce
Power
Difference (OPG - Bruce Power)OPG
Bruce
Power
Difference (OPG - Bruce Power)
$ Per Hour % Per Hour $ Per Year % Per Year
AuthorizedAuthorized Nuclear Operator (including Trainees, excluding supervisors) 227 $73.14 $71.75 $1.39 2% $152,654 $149,752 $2,901 2%
Certified Unit 0 Control Room Operator (including Trainees) 22 $65.81 $64.58 $1.23 2% $137,355 $134,788 $2,567 2%
Band 3
Nuclear Operator (including Trainees) 649 $51.97 $60.96 -$8.99 -17% $108,469 $127,232 -$18,763 -17%
Electrical & Control Techn & Technologists / Shift Control Technician 729 $51.97 $59.87 -$7.90 -15% $108,469 $124,957 -$16,488 -15%
Mechanical Technician & Technologist / Mechanical Maintainer 714 $51.97 $59.70 -$7.73 -15% $108,469 $124,602 -$16,134 -15%
Chemical Technician / Chemical Technologist†
72 $51.97 $62.12 -$10.15 -20% $108,469 $113,447 -$4,978 -5%
Planning & Cost Control Technician / Cost & Scheduling Technician†
45 $51.97 $55.02 -$3.05 -6% $108,469 $100,480 $7,989 7%
Project Technician - E&C / Project Tech II - E&C 28 $51.97 $53.69 -$1.72 -3% $101,690 $105,047 -$3,358 -3%
Band 2
Civil & Service Trades Maintainers / Civil Maintainer I435
$40.42 $54.74 -$14.32 -35% $84,362 $114,250 -$29,888 -35%
Civil & Service Trades Maintainers / Civil Maintainer II $40.42 $51.27 -$10.85 -27% $84,362 $107,008 -$22,645 -27%
Nuclear Security Officer n/a $40.42 $42.73 -$2.31 -6% $84,362 $89,184 -$4,821 -6%
Emergency Response Maintainer / Emergency Services Maintainer 84 $40.42 $49.33 -$8.91 -22% $84,362 $102,959 -$18,596 -22%
Office Support Representative II / Administrative Assistant - Clerk I (Admin) 194 $40.42 $48.12 -$7.70 -19% $73,817 $87,879 -$14,062 -19%
Finance Clerk / Payroll & Accounting Services Specialist 42 $40.42 $50.96 -$10.54 -26% $73,817 $93,066 -$19,249 -26%
Band 1 Office Support Representative I / Clerk II 101 $33.20 $37.21 -$4.01 -12% $60,631 $67,955 -$7,323 -12%
Totals & Weighted Average 3,342 $50.32 $58.18 -$7.85 -17% $103,967 $119,634 -$15,667 -16%
% of PWU population 60%
Filed: 2016-05-27
EB-2016-0152
Exhibit F4-3-1
Attachment 3
Page 3 of 3


![BENEFITS & COMPENSATION INTERNATIONAL1].pdf · United States who are US citizens, ... qualified deferred compensation plan”. ... Benefits & Compensation International• 2](https://img.pdfslide.us/doc/110x75/5b69676e7f8b9ab0128e2df1/benefits-compensation-1pdf-united-states-who-are-us-citizens-qualified.jpg)