Embed Size (px)
Citation preview
ORNL/TM-2012/88
COMPATIBILITY STUDY FOR PLASTIC, ELASTOMERIC, AND METALLIC FUELING INFRASTRUCTURE MATERIALS EXPOSED TO AGGRESSIVE FORMULATIONS OF ETHANOL-BLENDED GASOLINE
May 2012 Prepared by
Michael D. Kass Timothy J. Theiss Christopher J. Janke Steven J. Pawel
DOCUMENT AVAILABILITY Reports produced after January 1, 1996, are generally available free via the U.S. Department of Energy (DOE) Information Bridge. Web site http://www.osti.gov/bridge Reports produced before January 1, 1996, may be purchased by members of the public from the following source. National Technical Information Service 5285 Port Royal Road Springfield, VA 22161 Telephone 703-605-6000 (1-800-553-6847) TDD 703-487-4639 Fax 703-605-6900 E-mail [email protected] Web site http://www.ntis.gov/support/ordernowabout.htm Reports are available to DOE employees, DOE contractors, Energy Technology Data Exchange (ETDE) representatives, and International Nuclear Information System (INIS) representatives from the following source. Office of Scientific and Technical Information P.O. Box 62 Oak Ridge, TN 37831 Telephone 865-576-8401 Fax 865-576-5728 E-mail [email protected] Web site http://www.osti.gov/contact.html
This report was prepared as an account of work sponsored by an agency of the United States Government. Neither the United States Government nor any agency thereof, nor any of their employees, makes any warranty, express or implied, or assumes any legal liability or responsibility for the accuracy, completeness, or usefulness of any information, apparatus, product, or process disclosed, or represents that its use would not infringe privately owned rights. Reference herein to any specific commercial product, process, or service by trade name, trademark, manufacturer, or otherwise, does not necessarily constitute or imply its endorsement, recommendation, or favoring by the United States Government or any agency thereof. The views and opinions of authors expressed herein do not necessarily state or reflect those of the United States Government or any agency thereof.
ORNL/TM-2012/88
Energy and Transportation Science Division
COMPATIBILITY STUDY FOR PLASTIC, ELASTOMERIC, AND METALLIC FUELING INFRASTRUCTURE MATERIALS EXPOSED TO AGGRESSIVE
FORMULATIONS OF ETHANOL-BLENDED GASOLINE
Michael D. Kass, Timothy J. Theiss, Christopher J. Janke, and Steven J. Pawel
Date Published: May 2012
Prepared by OAK RIDGE NATIONAL LABORATORY
Oak Ridge, Tennessee 37831-6283 managed by
UT-BATTELLE, LLC for the
U.S. DEPARTMENT OF ENERGY under contract DE-AC05-00OR22725

iii
CONTENTS
Page
LIST OF FIGURES ...................................................................................................................................... v LIST OF TABLES ...................................................................................................................................... vii ACRONYMS ............................................................................................................................................... ix FOREWORD ............................................................................................................................................... xi ACKNOWLEDGMENTS ......................................................................................................................... xiii EXECUTIVE SUMMARY ........................................................................................................................ xv 1. INTRODUCTION ................................................................................................................................ 1 2. MATERIALS ........................................................................................................................................ 2
2.1 SELECTION AND DESCRIPTION OF PLASTIC MATERIALS ........................................... 4 2.2 SELECTION AND DESCRIPTION OF ELASTOMERIC MATERIALS ............................... 5 2.3 SELECTION AND DESCRIPTION OF METALLIC MATERIALS ....................................... 5
3. TEST FUELS ........................................................................................................................................ 6 4. EXPERIMENTAL PROTOCOL .......................................................................................................... 8 5. POLYMER COMPATIBILITY AND SOLUBILITY ANALYSIS................................................... 11 6. RESULTS ........................................................................................................................................... 17
6.1 PLASTICS ................................................................................................................................ 17 6.1.1 Wet Volume ................................................................................................................. 17 6.1.2 Comparison of Measured Volume Swell to Hansen Model Predictions ...................... 22 6.1.3 Wet Hardness ............................................................................................................... 23 6.1.4 Dry-out Volume ........................................................................................................... 25 6.1.5 Dry-out Hardness for Liquid-Phase Exposures............................................................ 28 6.1.6 Dry-out Hardness for Vapor-Phase Exposures ............................................................ 31 6.1.7 Dynamic Mechanical Analysis .................................................................................... 32
6.2 ELASTOMERS ........................................................................................................................ 36 6.2.1 Wet Volume and Hardness .......................................................................................... 36 6.2.2 Dry-out Volume and Hardness .................................................................................... 41 6.2.3 Hardness Results for Vapor-Phase Exposures ............................................................. 45 6.2.4 Cork ............................................................................................................................. 47
6.3 METALS ................................................................................................................................... 49 6.3.1 Bare Metal Specimens ................................................................................................. 49 6.3.2 Plated Metal Specimens ............................................................................................... 53
7. CONCLUSIONS ................................................................................................................................ 57 7.1 PLASTICS ................................................................................................................................ 57 7.2 ELASTOMERS ........................................................................................................................ 58 7.3 METALS ................................................................................................................................... 59
8. REFERENCES ................................................................................................................................... 59

v
LIST OF FIGURES
Figure Page
1 Fueling infrastructure components and materials used for tank fill-up and general storage. ............ 2
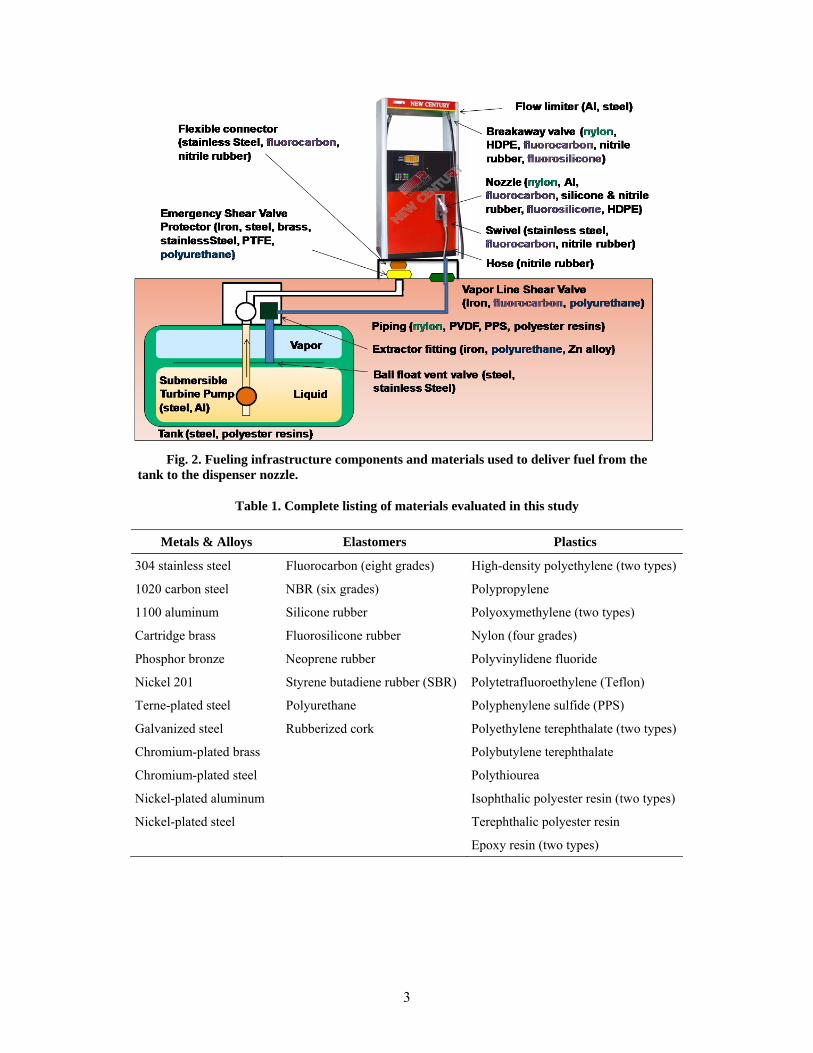
2 Fueling infrastructure components and materials used to deliver fuel from the tank to the dispenser nozzle. ....................................................................................................................... 3
3 Appearance of galvanically-coupled specimens showing exposed surfaces. .................................... 6
4 Arrangement and components of dynamic environmental chamber. ................................................ 9
5 Photograph of plastic specimens assembled on a mounting fixture.. ................................................ 9
6 Photograph of metal specimens assembled on mounting fixture.. .................................................. 10
7 Plan view of the interior of the environmental chamber showing arrangement of specimens and the liner. ............................................................................................................................ 10
8 Flowchart outlining test and measurement protocols for each material type. ................................. 11
9 Calculated solubility distances of PPS, PTFE, PVDF, PET, PETG, PBT, HDPE, and PP with fuel ethanol content. ................................................................................................................ 14
10 Calculated solubility distances of the nylons with fuel ethanol content. ......................................... 14
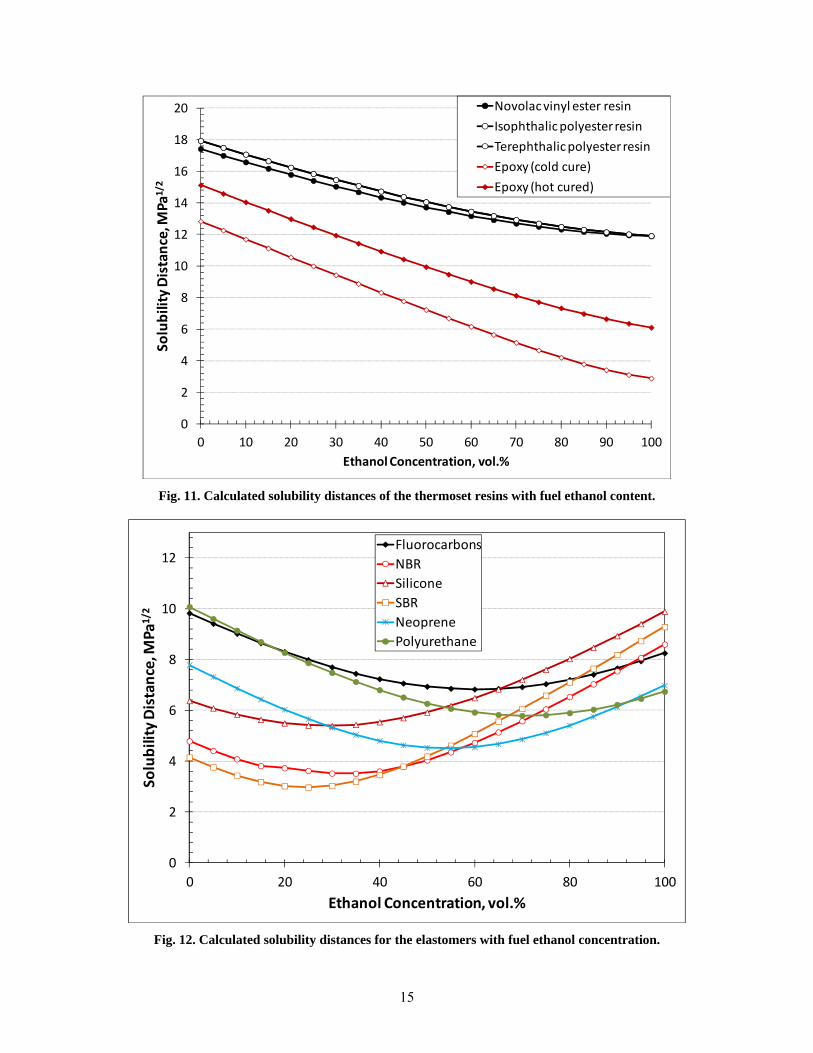
11 Calculated solubility distances of the thermoset resins with fuel ethanol content. ......................... 15
12 Calculated solubility distances for the elastomers with fuel ethanol concentration. ....................... 15
13 Relationship between the changes in volume and mass following exposure of the plastics to the test fuels. ............................................................................................................................ 18
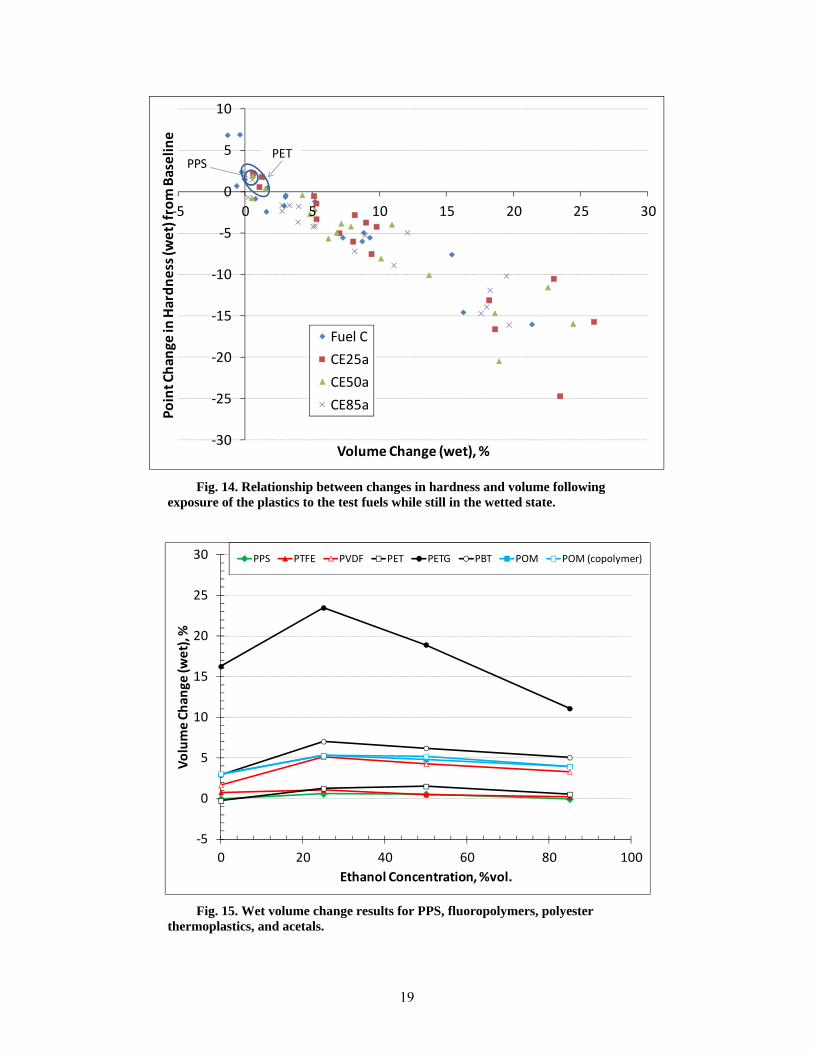
14 Relationship between changes in hardness and volume following exposure of the plastics to the test fuels while still in the wetted state. ............................................................................. 19
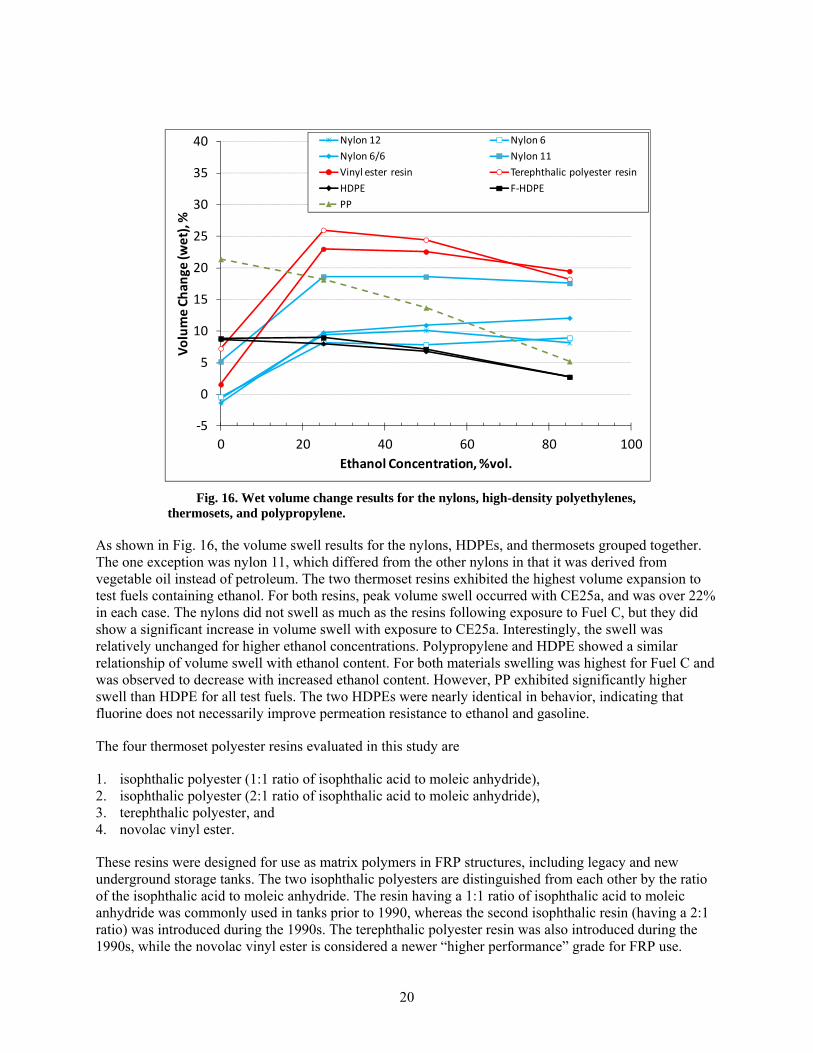
15 Wet volume change results for PPS, fluoropolymers, polyester thermoplastics, and acetals. ........ 19
16 Wet volume change results for the nylons, high-density polyethylenes, thermosets, and polypropylene. ......................................................................................................................... 20
17 Volume swell results for polyester thermoset resins. ...................................................................... 21
18 Wet hardness change results for PPS, fluoropolymers, polyester thermoplastics and acetals as a function of ethanol concentration. .................................................................................... 24
19 Wet hardness change results for the nylons, HDPEs, thermoset resins, and polypropylene as a function of ethanol concentration. ........................................................................................ 24
20 Change in volume for wetted and dried plastics exposed to Fuel C. ............................................... 26
21 Change in volume for wetted and dried plastics exposed to CE25a. ............................................... 26
22 Change in volume for wetted and dried plastics exposed to CE50a. ............................................... 27
23 Change in volume for wetted and dried plastics exposed to CE85a. ............................................... 27
24 Correlation between volume and mass change (from baseline) following drying at 60oC for 65 hours. ................................................................................................................ 28
25 Dry-out hardness versus volume change for plastic specimens. ..................................................... 29
26 Point change in hardness for wetted specimens of PPS, fluoropolymers, thermoplastic polyesters, and acetals after drying at 60oC for 65 hours as a function of ethanol concentration. .......................................................................................................................... 30
27 Point change in hardness for wetted specimens of the nylons, HDPEs, thermoset resins, and PP after drying at 60oC for 65 hours as a function of ethanol concentration. ......................... 30
vi
28 Point change in hardness for PPS, fluoropolymers, thermoplastic polyesters, and acetals exposed to test fuel vapors as a function of ethanol concentration. ........................................ 31
29 Point change in hardness for nylons, HDPEs, thermoset resins, and PP specimens exposed to test fuel vapors as a function of ethanol concentration. .......................................................... 32
30 Glass-to-rubber transition temperatures for the baseline plastic specimens and those exposed to the liquid and vapor phases of Fuel C and CE25a. .............................................................. 33
31 Percent change in storage modulus associated with the onset to glass-to-rubber transition for the plastic specimens immersed in Fuel C and CE25a. ........................................................... 35
32 Wet volume and hardness change for the eight fluorocarbons and one fluorosilicone sample as a function of ethanol concentration. .................................................................................... 37
33 Wet volume and hardness change for the six NBRs as a function of ethanol concentration. ......... 39
34 Wet volume and hardness change for polyurethane, neoprene, SBR, and silicone as a function of ethanol concentration. ........................................................................................... 40
35 Dry-out change in volume and hardness for the fluoroelastomer specimens as a function of ethanol concentration. ............................................................................................................. 42
36 Dry-out change in volume and hardness for NBR specimens as a function of ethanol concentration. .......................................................................................................................... 43
37 Dry-out change in volume and hardness for polyurethane, neoprene, SBR, and silicone as a function of ethanol concentration ............................................................................................ 44
38 Point change in hardness for the fluoroelastomer specimens placed in the vapor-phase regions as a function of ethanol concentration. ....................................................................... 46
39 Point change in hardness for the NBR specimens placed in the vapor-phase regions as a function of ethanol concentration. ........................................................................................... 46
40 Point change in hardness for the polyurethane, neoprene, SBR, and silicone specimens placed in the vapor-phase regions as a function of ethanol concentration. ............................. 47
41 Change in volume, mass and hardness for cork as a function of ethanol content. .......................... 49
42 Post-exposure appearance of the cartridge brass specimens. .......................................................... 50
43 Post-exposure appearance of the phosphor bronze specimens. ....................................................... 51
44 Post-exposure appearance of the carbon steel specimens. ............................................................... 51
45 Post-exposure appearance of the Nickel 201 specimens. ................................................................ 52
46 Post-exposure appearance of the galvanized steel specimens. ........................................................ 54
47 Post-exposure appearance of the Terne-plated steel specimens. ..................................................... 54
48 Post-exposure appearance of nickel-plated aluminum specimens. .................................................. 55
vii
LIST OF TABLES
Table Page
1 Complete listing of materials evaluated in this study ...................................................................... 3
2 Categories and types of plastic materials evaluated in this study .................................................... 4
3 List of single- and plated-metal materials ........................................................................................ 6
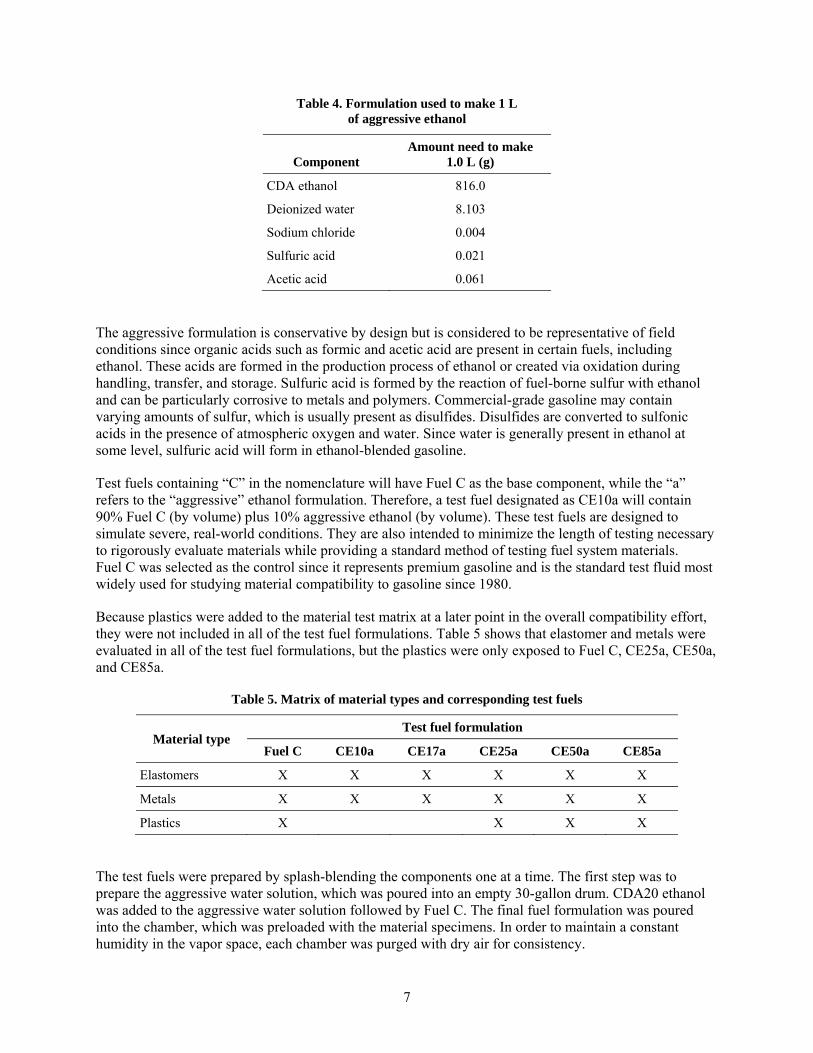
4 Formulation used to make 1 L of aggressive ethanol ..................................................................... 7
5 Matrix of material types and corresponding test fuels ..................................................................... 7
6 Hansen solubility parameters for the test fuel components and selected test fuel formulations ............................................................................................................................ 12
7 Hansen solubility parameters for plastic and elastomeric materials evaluated in this study ......... 13
8 Interaction radius and calculated solubility distances for each plastic material and test fuel combination (units are in MPa1/2) ............................................................................................ 16
9 Interaction radius and calculated solubility distances for each elastomer material and test fuel combination (units are in MPa1/2) ..................................................................................... 17
10 Predicted and actual results based on the calculated solubility distance and observed swell for the plastic materials ........................................................................................................... 23
11 Predicted and actual results based on the calculated solubility distance and observed swell for the elastomer materials ...................................................................................................... 36
12 Corrosion rate (µm/year) based on weight loss for materials immersed in CE50a and CE85a ............................................................................................................................... 52
13 Annualized corrosion rates calculated from weight loss of phosphor bronze and cartridge brass specimens immersed 28 days at 60oC as a function of fuel composition ....................... 52
14 Annualized corrosion rates (µm/year) calculated from weight loss of fully and partially plated specimens ...................................................................................................................... 57

ix
ACRONYMS
ACN Acrylonitrile
API American Petroleum Institute
ASTM American Society for Testing and Materials
BGPY Billion gallons per year
CEXXa Test fuel containing XX amount of aggressive ethanol with the balance composed of Fuel C
CRC Coordinating Research Council
δ Total Solubility Parameter
DMA Dynamic Mechanical Analysis
DOE Department of Energy
E’ Storage modulus associated with the onset of the glass-to-rubber transition
EERE Energy Efficiency and Renewable Energy
EISA Energy Independence and Security Act
EPA U. S. Environmental Protection Agency
EPA-OUST EPA Office of Underground Storage Tanks
FFV Flex-Fuel Vehicle
F-HDPE Fluorinated high- density polyethylene
FRP Fiber-reinforced plastics
Fuel C Gasoline test fuel composed of 50vol.% toluene and 50vol.% isooctane
GC-MS Gas chromatography–mass spectrometry
HDPE High- density polyethylene
HSP Hansen solubility parameter
IR Interaction radius
ISO International Organization for Standardization
NBR Acrylonitrile (or nitrile) butadiene rubber
NREL National Renewable Energy Laboratory
OBP DOE Office of Biomass Program
ORNL Oak Ridge National Laboratory
PBT Polybutylene terephthalate
PEI Petroleum Equipment Institute
PET Polyethylene terephthalate
PETG Polyethylene terephthalate co-polymer
POM Polyoxymethylene
x
PP Polypropylene
PPS Polyphenylene sulfide
PTFE Polytetrafluoroethylene
PTU Polythiourea
PVDF Polyvinylidene fluoride
RFS Renewable Fuel Standard
RT Room temperature
SAE Society of Automotive Engineers
SBR Styrene butadiene rubber
SD Solubility distance
Tg Glass-to-rubber transition temperature
UL Underwriters Laboratories
UST Underground Storage Tank
VTP DOE Vehicle Technologies Program
XPS X-ray photoelectron spectroscopy

xi
FOREWORD
The purpose of this study was not to define the acceptable limits of material performance or to rate individual materials. Rather, the goal was to measure critical property changes (volume, hardness, mass, etc.) for representative classes of fueling infrastructure materials in ethanol-blend test fluids. The test results are intended to be used by material designers and users to identify potential issues and guide the selection and development of materials compatible for use in ethanol-blended gasoline dispensers, up to and including E85.

xiii
ACKNOWLEDGMENTS
This report and the work described were sponsored by the Biomass, Clean Cities, and Vehicle Technologies Programs within the U.S. Department of Energy (DOE) Office of Energy Efficiency and Renewable Energy (EERE). The authors gratefully acknowledge the support and guidance of Brian Duff, Shab Fardanesh, Alicia Lindauer, Joan Glickman, Steve Przesmitzki, Dennis Smith, and Kevin Stork at DOE.
This effort originated from a collaboration of Oak Ridge National Laboratory (ORNL), the National Renewable Energy Laboratory (NREL), and Underwriters Laboratories (UL). Collaborators from NREL included Kristi Moriarty and Wendy Clark. The authors also respectfully acknowledge our UL collaborators Tom Chapin, Ken Boyce, Tom Fabian, and Edwin Yang, who provided substantial input, direction, and research assistance. This work also benefitted from discussions and suggestions provided by participants from the E10+ Research and Planning Meetings sponsored by the American Petroleum Institute (API). The authors are especially grateful for the technical exchanges with Prentiss Searles and Brian Knapp, from the API; Andrea Barbery, Paul Miller, and Mark Barolo, of the Environmental Protection Agency Office of Underground Storage Tanks (EPA-OUST); and Bob Renkes, of the Petroleum Equipment Institute. Dennis Boyd from BP also provided much useful input. The authors also acknowledge and appreciate the thorough review and input provided by Marc Goodman from New West Technologies, LLC. The authors are indebted to many technical experts in industry and other government agencies. While these companies and their experts provided valuable guidance and information as noted above, this consultation does not constitute endorsement by their organizations. This study also benefitted greatly from the material contributions from Dupont and 3M and two gracious suppliers of nitrile rubbers. Their contributions and guidance on material selection were crucial to facilitating the experiments and subsequent analysis of the results. Finally, the authors would also like to acknowledge Brian West for his many insights and willingness to participate in various discussions. His readiness to provide reviews was extremely helpful in getting presentations and publications out in a timely manner.
Several ORNL staff made important contributions to this work; Dr. Harry Meyer performed x-ray photoelectron spectroscopy measurements and analysis, and Eric Nafziger and Jeff Chambers were instrumental in facilitating the exposure tests.

xv
EXECUTIVE SUMMARY
Background
The Energy Independence and Security Act (EISA) of 2007 is an omnibus energy policy law designed to move the United States toward greater energy security and independence. A key provision of EISA is the Renewable Fuel Standard (RFS) which requires the nation to use 36 billion gallons per year (BGPY) of renewable fuel in vehicles by 2022.1 Ethanol is the most widely used renewable fuel, and increasing the allowable ethanol content from 10% to 15% is expected to push renewable fuel consumption to 21BGPY. Therefore, a large portion of 36 billion gallon goal can be met by increasing the ethanol in gasoline to 15%. However, concerns were raised that this increase in ethanol may negatively impact the compatibility of materials and components used in standard gasoline fueling hardware. In the summer of 2008, the U.S. Department of Energy recognized the need to assess the impact of intermediate blends of ethanol on the fueling infrastructure, specifically those systems located at the fueling station. A short time later (March 2009), Growth Energy (a coalition of ethanol producers and supporters) requested a waiver from the Environmental Protection Agency (EPA) to allow the use of 15% ethanol in gasoline.2
The first phase of this research focused on intermediate ethanol levels (10 to 25%), and the materials evaluated at that time were limited to elastomers, metals and sealants. The results from the Phase 1effort were published in March of 2011.3 At the conclusion of the Phase 1 activity, ORNL expanded the material selection to include plastics, which included types typically found in fueling infrastructure systems, including piping and underground storage tanks. Initially, the test fuels were those representing gasoline containing 0 to 25% levels of ethanol, but later, test fuels representing the high ethanol blends, E50 and E85, were added for completeness. Since elastomers and metals had not been evaluated in these high ethanol blends, they were included along with the plastic materials.
The results contained within this report are divided into three sections according to material type. In the first section, the compatibility results are presented for plastic materials exposed to gasoline test fuels containing low and high levels of ethanol. The remaining two sections emphasize the compatibility of elastomers and metals with gasoline test fuels containing high ethanol concentrations. Additional data obtained from the earlier study on these materials are included for additional interpretation and summary.
Experimental Overview
The materials chosen for evaluation were selected based on a thorough survey of fueling infrastructure components by the ORNL materials research team. Team members contacted manufacturers of gasoline dispensers as well as manufacturers and suppliers of elastomers, seals, and plastics. Additional guidance and input was provided from stakeholders including Underwriters Laboroatories, the Petroleum Equipment Institute (PEI), and the API members. Although the research team was able to identify typical dispenser materials according to polymer class, specific grades and formulations could not be precisely identified. As a result, the material list does not necessarily include those specific grades or formulations used in legacy and current standard gasoline fueling infrastructure, but rather broad material classes of interest.
For the plastic materials, only four test fuels (Fuel C, CE25a, CE50a, and CE85a) were used to evaluate compatibility. These fuels are based on the Fuel C composition and aggressive ethanol formulations described in Society of Automotive Engineers (SAE) J1681, “Gasoline, Alcohol, and Diesel Fuel Surrogates for Materials Testing.”4 In an earlier study,3 elastomers and metals were also exposed to CE10, CE17a, and CE20a in addition to the four test fuels previously mentioned. Fuel C is a 50-50 mixture of toluene and isooctane and is representative of highly aromatic gasoline (>40% aromatics by volume). The other test fuels contain an aggressive ethanol solution added to Fuel C. The numbers that follow CE refer
xvi
to the volume fraction of ethanol added to Fuel C, and the use of aggressive ethanol (containing water and trace levels of sodium chloride, acetic and sulfuric acids) is represented by the “a.” These contaminants are found in ethanol-gasoline fuels and represent potential high contamination conditions for fuel-grade ethanol. In order to better simulate vapor recovery conditions, additional specimens were placed in the gaseous region above the liquid fuel line (in the headspace). All of the material specimens were placed inside sealed chambers; a portion of the specimens were completely immersed in the liquid fuel, which was flowed at a 0.8m/s and kept at 60oC. After 4 weeks, the elastomers and metals were removed for property measurement, while the plastics were exposed for an additional 12 weeks in order to complete a 16 week total exposure period. The use of aggressive ethanol and elevated test temperature are intended to minimize the length of exposure necessary to rigorously evaluate materials while providing a standard method of testing.
The plastic materials included 16 thermoplastic samples and 6 thermoset plastic (thermoset) samples. Thermoplastic materials included polyphenylene sulfide (PPS), polytetrafluoroethylene (PTFE), polyvinylidene fluoride (PVDF), polyester (3 types), nylon (4 types), acetal (2 types), polypropylene (PP), polythiourea (PTU), high-density polyethylene (HDPE), and fluorinated high-density polyethylene (F-HDPE). The thermosets included two isophthalic polyesters, one terephthalic polyester, one vinyl ester, and two epoxies. The elastomer types were fluorocarbon, fluorosilicone, silicone, acrylonitrile butadiene rubber (also known as nitrile rubber or NBR), styrene butadiene rubber (SBR), polyurethane, and neoprene. This study evaluated eight types of fluorocarbons and six grades of NBR, while the remaining elastomer types consisted of one sample only.
The changes in mass, volume, and hardness (from the original baseline condition) were determined for each plastic and elastomer specimen immersed in the test fuels. These measurements were made immediately upon removal of the specimens from the test fuel liquid (wetted state) and after drying for 65 hours at 60oC (dried state). Those specimens which were exposed to the vapor phase were measured only for hardness. Dynamic mechanic analysis (DMA) was performed only on those plastics exposed to the liquid and vapor phases of Fuel C and CE25a. In addition, a model based on Hansen solubility theory5 was constructed to predict the swell behavior of each polymeric material and test fuel composition. The level of solubility is physically measured as volume swell, and the model was used to estimate the extent of swelling and the ethanol concentration at which maximum swelling (and hence solubility) occurs.
The metals and alloys that were evaluated in this study included single metal/alloy coupons of 1020 carbon steel, 304 stainless steel, 1100 aluminum, nickel 201, cartridge brass, phosphor bronze, and galvanized and Terne-plated steels. In addition, to better reflect dissimilar metal-to-metal contacts existing in the field, specimens composed of steel, brass, and aluminum were coupled with lead, zinc, chromium, and nickel to create galvanic scenarios for evaluation. Corrosion was primarily assessed by measuring the mass loss for each exposed coupon and observing any discoloration that may have occurred. For each metal sample, one or more specimens were exposed to the liquid and one was exposed to the vapor region of the test chambers.
Plastic Results
A predictive model was constructed using Hansen solubility theory5 for each material. The parameters used in this model were derived from literature sources that may or may not represent the specific material types and compositions used. In spite of this uncertainty, the predicted results calculated using Hansen solubility theory generally provided good to excellent agreement to the observed volume swell for many of the plastic materials. There were several notable exceptions such as PVDF, nylon 11, and one of the thermosetting resins. The best-performing plastic materials were PPS, polyethylene terephthalate (PET), and PTFE. Not surprisingly these three materials are typically used as primary barriers for flexible plastic piping systems designed for fuel use. Modest swelling (around 5%) was observed for polybutylene
xvii
terephthalate (PBT), PVDF, and the acetals for fuel containing ethanol. Three of the nylon grades (nylon 6, nylon 6/6, and nylon 12) were found to exhibit moderate to high swelling (~10%) with exposure to ethanol-blended fuels. Those materials that exhibited the highest degree of swell (>20%) upon exposure to test fuels containing ethanol included nylon 11, the PET co-polymer (PETG), PTU, and the thermoset resins.
All of the thermosets exhibited excessive swell; in fact, the two epoxies fractured during exposure to CE25a, CE50a, and CE85a, and the two isophthalic resins fractured from exposure to CE25a and CE50a. The other material that fractured during exposure to the ethanol-blended test fuels was PTU. Polypropylene and HDPE were unique in that the highest volume swelling occurred for exposure to Fuel C (CE0), and the level of swell decreased with increasing ethanol concentration. For PP, the volume expansion declined from 22% for Fuel C to 5% for CE85a, while both HDPE samples declined from 10% to 2.5% over the same ethanol range. The volume change (and hence solubility) of PP, HDPE, PETG, and the thermosets showed a heightened sensitivity and strong dependence to ethanol concentration. In contrast, the other plastic materials showed little to no change in volume swell for the CE25a, CE50a, and CE85a test fuels. In general, volume swell was accompanied by a corresponding decrease in hardness (softening) for the plastic materials. For most materials, the hardness drop was very low; however, significant softening was noted for PP, PETG, nylon 11, and the thermosets.
After drying at 60oC for 65 hours, the plastics retained some level of test fuel within the polymer structure, as evidenced by a mass and volume increase from the original baseline condition. The lone exception was nylon 12, which not only lost volume and mass but also exhibited a hardness increase indicative of plasticizer extraction. The other materials exhibited either no change or a small decrease in hardness following dry-out. This drop in hardness is consistent with fuel retention in the polymer structure.
Exposure to the test fuels resulted in significant structural changes for several plastic types. Structural change was indirectly assessed by analyzing the shift in the temperature associated with onset of the glass-to-rubber transition (Tg). Negligible Tg shift was observed for PPS, the fluoropolymers, the acetals, and the HDPEs, indicating minimal change of their respective polymer structures. However, significant shifts in Tg were noted for PET, PETG, PBT, PP, the nylons, and the thermosets. A key observation was made that although the volume and hardness of PET were unchanged by the test fuels, its polymer structure was altered by the added ethanol, as evidenced by a 40 degree reduction in Tg. Fuel ethanol also impacted Tgs of PBT, nylon 6, nylon 6/6, nylon 11, and the vinyl ester resin. In contrast, for PETG, PP, nylon 12, and the terephthalic polyester resin, the Tg shift was primarily caused by the Fuel C component (and not ethanol).
Those specimens exposed to the vapor phase of the test fuels exhibited behavior similar to those immersed in the corresponding liquid phase, albeit to a lesser extent. In fact, the fuel chemistries responsible for fracturing thermosetting resins in the liquid phase also fractured these specimens in the vapor-phase region. The implication is that materials exposed to fuel vapors are subject to the same degradation potential as materials in direct contact with liquid fuel.
Elastomer Results
In general the elastomers exhibited peak swelling for low concentrations of ethanol. For most of these materials, peak swelling occurred with exposure to CE17a, and higher concentrations of ethanol caused the volume swell to decrease dramatically with ethanol concentration. In fact, following exposure to CE85, the volume swell either matched the value obtained for Fuel C (CE0) or was lower. This result corresponds closely to the predicted behavior as calculated using the Hansen solubility parameters. For several of the NBRs, SBR, and the neoprene, volume swell with CE85 exposure approached the original
xviii
baseline value. In fact for NBR#1 there was no measureable change in volume following exposure to CE85a. Analysis based on volume swell alone would indicate that these materials were insoluble to CE85a. However, following dry-out, these same specimens exhibited a significant loss of mass and volume from the original baseline value. This feature, along with the accompanying pronounced hardness increase (embrittlement), indicates that the fuel had, in fact, successfully extracted plasticizer components from the elastomer. This observation is important since volume swell is the property most associated with solubility, and hence compatibility. These results clearly show that for elastomers such as NBRs, SBR, and neoprene, fluid permeation and potential extraction may exist without noticeable swell.
The fluoroelastomers, polyurethane, SBR, and silicone specimens that were placed above the liquid fuel line in the vapor-phase region exhibited a change in dry-out hardness that roughly corresponded to those specimens that were fully immersed in the test fuel liquids. However, the dry-out hardness values for five of the NBRs and the neoprene specimen were relatively unaffected from exposure to the CE85a vapor phase. The lack of significant property change for these materials to the vapor space of CE85a may be the result of lowered solubility for these materials.
Metal Results
Very little corrosion was noted for the metallic specimens exposed to ethanol-blended gasoline test fuels, even at high levels of ethanol. Single-component specimens representing a number of metals commonly found in fuel storage and dispensing systems were immersed in CE50a and CE85a along with the elastomer and plastic specimens. In all cases, the annualized corrosion rates based on uniform weight loss were minor, with all values under 10 µm/year, except for that of commercially pure nickel exposed to CE85a (~35 µm/year). Corrosion films were examined using x-ray photoelectron spectroscopy, or XPS, and the composition and thickness of each was not found to depend on the ethanol content of the test fluid (CE10a to CE85a).
Minor corrosion was also observed for plated metal specimens exposed in CE50a and CE85a. Of the metals tested, zinc (originating from the galvanized steel surfaces) was the most susceptible to dissolution and corrosion. Corrosion of steel was accelerated somewhat in CE50a and CE85a, when it was galvanically-coupled to either zinc or lead. In addition, aluminum was found to be susceptible to widespread pitting when it was galvanically-coupled to nickel. In all cases, accelerated corrosion was due to a combination of galvanic coupling of dissimilar metals (plating and substrate) and the increased conductivity of the environment (CE50a, CE85a), compared to previously examined test fluids. Specimens exposed to the vapor phase above each solution exhibited slight discoloration in some cases (particularly the brass and bronze coupons), but no loss of mass was observed for any of the metals exposed in the vapor above the test fluids.
1
1. INTRODUCTION
In 2008 Oak Ridge National Laboratory began a series of experiments to evaluate the compatibility of fueling infrastructure materials with intermediate levels of ethanol-blended gasoline. Initially, the focus was elastomers, metals, and sealants, and the test fuels were Fuel C, CE10a, CE17a and CE25a. The results of these studies were published in 2010.3 Follow-on studies were performed with an emphasis on plastic (thermoplastic and thermoset) materials used in underground storage and dispenser systems. These materials were exposed to test fuels of Fuel C and CE25a. Upon completion of this effort, it was felt that additional compatibility data with higher ethanol blends was needed and another round of experimentation was performed on elastomers, metals, and plastics with CE50a and CE85a test fuels.
Compatibility of polymers typically relates to the solubility of the solid polymer with a solvent. It can also mean susceptibility to chemical attack, but the polymers and test fuels evaluated in this study are not considered to be chemically reactive with each other. Solubility in polymers is typically assessed by measuring the volume swell of the polymer exposed to the solvent of interest.6,7 Elastomers are a class of polymers that are predominantly used as seals, and most o-ring and seal manufacturers provide compatibility tables of their products with various solvents including ethanol, toluene, and isooctane, which are components of aggressive oxygenated gasoline as described by the Society of Automotive Engineers (SAE) J1681. These tables include a ranking based on the level of volume swell in the elastomer associated with exposure to a particular solvent. Swell is usually accompanied by a decrease in hardness (softening) that also affects performance. For seal applications, shrinkage of the elastomer upon drying is also a critical parameter since a contraction of volume can conceivably enable leakage to occur. Shrinkage is also indicative of the removal of one or more components of the elastomers (by the solvent). This extraction of additives can negatively change the properties of the elastomer, leading to reduced performance and durability. For a seal application, some level of volume swell is acceptable, since the expansion will serve to maintain a seal.8 However, the acceptable level of swell is dependent on the particular application of the elastomer product. It is known that excessive swell can lead to unacceptable extrusion of the elastomer beyond the sealed interface, where it becomes susceptible to damage. Also, since high swell is indicative of high solubility, there is a heightened potential for fluid to seep through the seal and into the environment.
Plastics, on the other hand, are used primarily in structural applications, such as solid components, including piping and fluid containment. Volume change, especially in a rigid system, will create internal stresses that may negatively affect performance.
In order to better understand and predict the compatibility for a given polymer type and fuel composition, an analysis based on Hansen solubility theory was performed for each plastic and elastomer material. From this study, the solubility distance was calculated for each polymer material and test fuel combination. Using the calculated solubility distance, the ethanol concentration associated with peak swell and overall extent of swell can be predicted for each polymer.
The bulk of the material discussion centers on the plastic materials, and their compatibility with Fuel C, CE25a, CE50a, and CE85a. The next section of this paper focuses on the elastomer compatibility with the higher ethanol concentrations with comparison to results obtained previously for the lower ethanol levels. The elastomers were identical to those used in the earlier study. Hansen solubility theory is also applied to the elastomers to provide added interpretation of the results. The final section summarizes the performance of the metal coupons.
2
2. MATERIALS
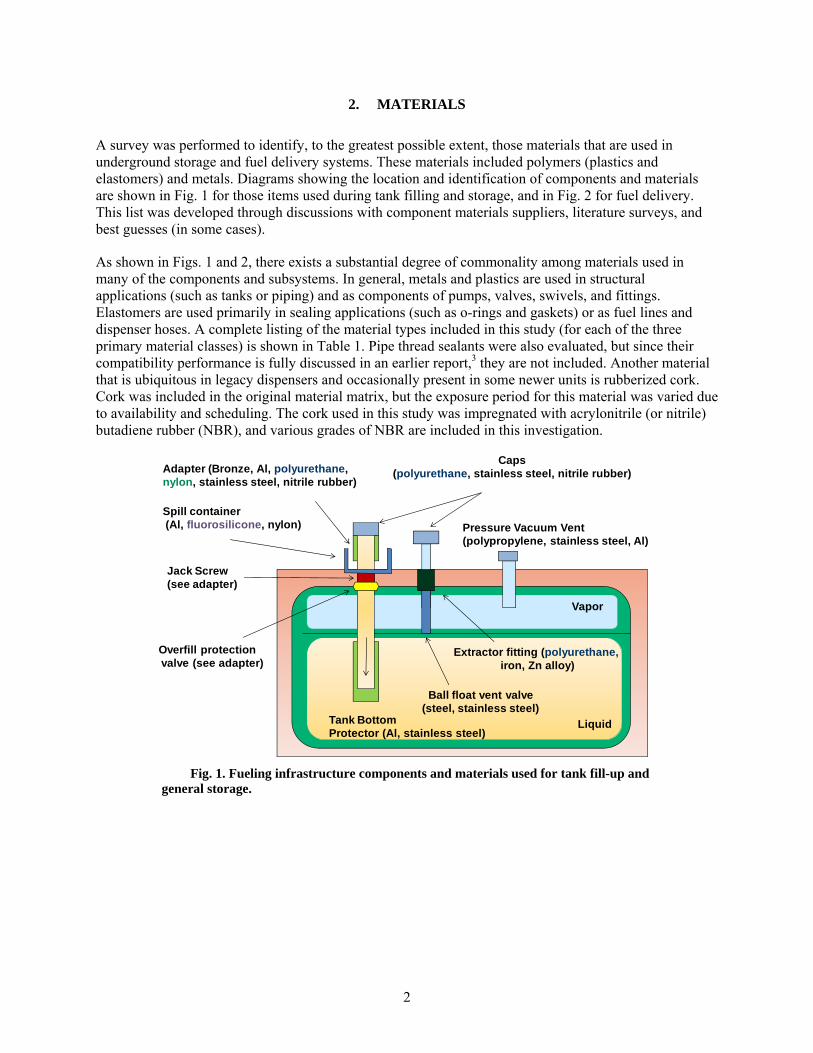
A survey was performed to identify, to the greatest possible extent, those materials that are used in underground storage and fuel delivery systems. These materials included polymers (plastics and elastomers) and metals. Diagrams showing the location and identification of components and materials are shown in Fig. 1 for those items used during tank filling and storage, and in Fig. 2 for fuel delivery. This list was developed through discussions with component materials suppliers, literature surveys, and best guesses (in some cases).
As shown in Figs. 1 and 2, there exists a substantial degree of commonality among materials used in many of the components and subsystems. In general, metals and plastics are used in structural applications (such as tanks or piping) and as components of pumps, valves, swivels, and fittings. Elastomers are used primarily in sealing applications (such as o-rings and gaskets) or as fuel lines and dispenser hoses. A complete listing of the material types included in this study (for each of the three primary material classes) is shown in Table 1. Pipe thread sealants were also evaluated, but since their compatibility performance is fully discussed in an earlier report,3 they are not included. Another material that is ubiquitous in legacy dispensers and occasionally present in some newer units is rubberized cork. Cork was included in the original material matrix, but the exposure period for this material was varied due to availability and scheduling. The cork used in this study was impregnated with acrylonitrile (or nitrile) butadiene rubber (NBR), and various grades of NBR are included in this investigation.
Fig. 1. Fueling infrastructure components and materials used for tank fill-up and general storage.
Caps(polyurethane, stainless steel, nitrile rubber)
Jack Screw(see adapter)
Spill container(Al, fluorosilicone, nylon)
Adapter (Bronze, Al, polyurethane,nylon, stainless steel, nitrile rubber)
Tank BottomProtector (Al, stainless steel)
Overfill protectionvalve (see adapter)
Pressure Vacuum Vent(polypropylene, stainless steel, Al)
Liquid
Vapor
Extractor fitting (polyurethane,iron, Zn alloy)
Ball float vent valve(steel, stainless steel)
3
Fig. 2. Fueling infrastructure components and materials used to deliver fuel from the tank to the dispenser nozzle.
Table 1. Complete listing of materials evaluated in this study
Metals & Alloys Elastomers Plastics
304 stainless steel Fluorocarbon (eight grades) High-density polyethylene (two types)
1020 carbon steel NBR (six grades) Polypropylene
1100 aluminum Silicone rubber Polyoxymethylene (two types)
Cartridge brass Fluorosilicone rubber Nylon (four grades)
Phosphor bronze Neoprene rubber Polyvinylidene fluoride
Nickel 201 Styrene butadiene rubber (SBR) Polytetrafluoroethylene (Teflon)
Terne-plated steel Polyurethane Polyphenylene sulfide (PPS)
Galvanized steel Rubberized cork Polyethylene terephthalate (two types)
Chromium-plated brass Polybutylene terephthalate
Chromium-plated steel Polythiourea
Nickel-plated aluminum Isophthalic polyester resin (two types)
Nickel-plated steel Terephthalic polyester resin
Epoxy resin (two types)
4
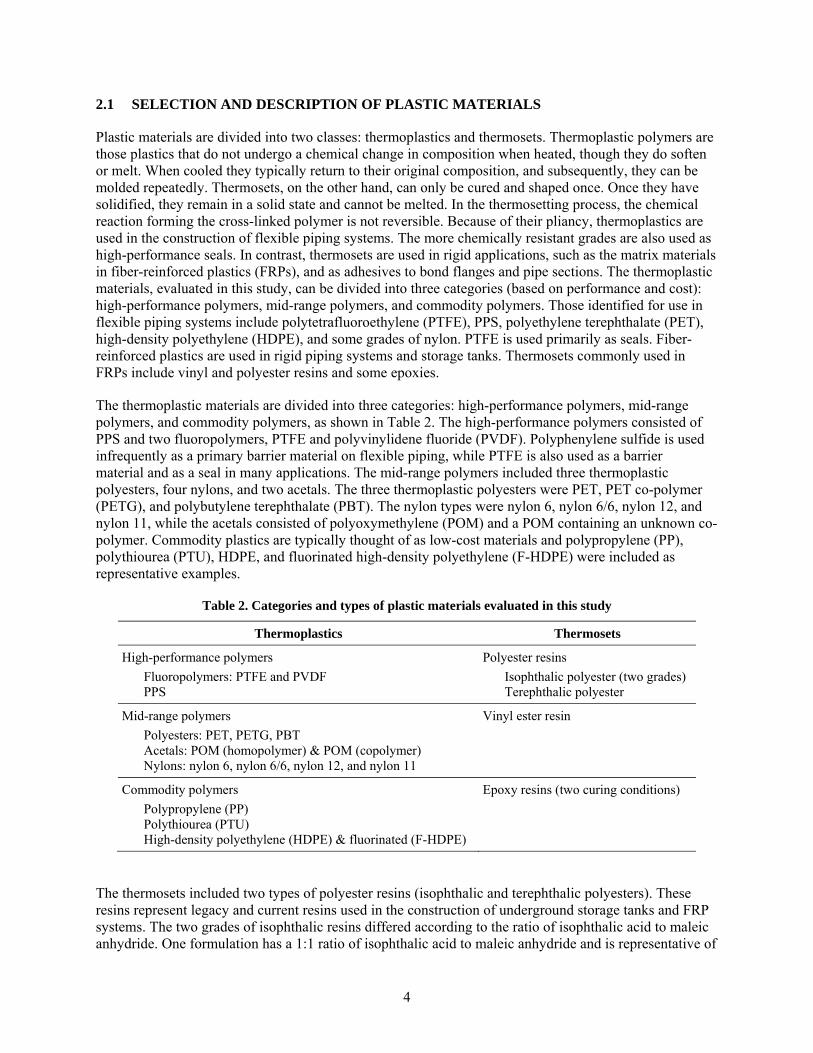
2.1 SELECTION AND DESCRIPTION OF PLASTIC MATERIALS
Plastic materials are divided into two classes: thermoplastics and thermosets. Thermoplastic polymers are those plastics that do not undergo a chemical change in composition when heated, though they do soften or melt. When cooled they typically return to their original composition, and subsequently, they can be molded repeatedly. Thermosets, on the other hand, can only be cured and shaped once. Once they have solidified, they remain in a solid state and cannot be melted. In the thermosetting process, the chemical reaction forming the cross-linked polymer is not reversible. Because of their pliancy, thermoplastics are used in the construction of flexible piping systems. The more chemically resistant grades are also used as high-performance seals. In contrast, thermosets are used in rigid applications, such as the matrix materials in fiber-reinforced plastics (FRPs), and as adhesives to bond flanges and pipe sections. The thermoplastic materials, evaluated in this study, can be divided into three categories (based on performance and cost): high-performance polymers, mid-range polymers, and commodity polymers. Those identified for use in flexible piping systems include polytetrafluoroethylene (PTFE), PPS, polyethylene terephthalate (PET), high-density polyethylene (HDPE), and some grades of nylon. PTFE is used primarily as seals. Fiber-reinforced plastics are used in rigid piping systems and storage tanks. Thermosets commonly used in FRPs include vinyl and polyester resins and some epoxies.
The thermoplastic materials are divided into three categories: high-performance polymers, mid-range polymers, and commodity polymers, as shown in Table 2. The high-performance polymers consisted of PPS and two fluoropolymers, PTFE and polyvinylidene fluoride (PVDF). Polyphenylene sulfide is used infrequently as a primary barrier material on flexible piping, while PTFE is also used as a barrier material and as a seal in many applications. The mid-range polymers included three thermoplastic polyesters, four nylons, and two acetals. The three thermoplastic polyesters were PET, PET co-polymer (PETG), and polybutylene terephthalate (PBT). The nylon types were nylon 6, nylon 6/6, nylon 12, and nylon 11, while the acetals consisted of polyoxymethylene (POM) and a POM containing an unknown co-polymer. Commodity plastics are typically thought of as low-cost materials and polypropylene (PP), polythiourea (PTU), HDPE, and fluorinated high-density polyethylene (F-HDPE) were included as representative examples.
Table 2. Categories and types of plastic materials evaluated in this study
Thermoplastics Thermosets
High-performance polymers
Fluoropolymers: PTFE and PVDF PPS
Polyester resins
Isophthalic polyester (two grades) Terephthalic polyester
Mid-range polymers
Polyesters: PET, PETG, PBT Acetals: POM (homopolymer) & POM (copolymer) Nylons: nylon 6, nylon 6/6, nylon 12, and nylon 11
Vinyl ester resin
Commodity polymers
Polypropylene (PP) Polythiourea (PTU) High-density polyethylene (HDPE) & fluorinated (F-HDPE)
Epoxy resins (two curing conditions)
The thermosets included two types of polyester resins (isophthalic and terephthalic polyesters). These resins represent legacy and current resins used in the construction of underground storage tanks and FRP systems. The two grades of isophthalic resins differed according to the ratio of isophthalic acid to maleic anhydride. One formulation has a 1:1 ratio of isophthalic acid to maleic anhydride and is representative of
5
resins used in FRP systems (including underground storage tanks) prior to 1990. The other isophthalic polyester resin has a 1:2 ratio of isophthalic acid to maleic anhydride and was introduced during the 1990s for use with FRP systems. The terephthalic resin has a 1:1 ratio of terephthalic acid to maleic anhydride and was also introduced in the 1990s for use in FRP systems. A vinyl ester resin material was also included which is representative of a newer high-performance formulation used in the construction of FRP systems.
It is important to note that the thermoset specimens were composed entirely of resin. In actuality, these resins are never used without some level of fiber reinforcement, which serves to constrain expansion and increase fracture resistance, strength, and durability. Therefore, the performance of pure resins to the test fuels does not necessarily correspond directly to the actual reinforced composite structure. However, should the resin become degraded, the composite itself will be less durable. It is important to note that in addition to being used as the matrix material in FRP, these resins may be used as adhesives to connect piping and flanges.
An epoxy resin that was cured under two different temperatures, room temperature and elevated temperature, was also examined. There are a multitude of epoxy resin types as well as curing conditions; all variations could not be included, so one formulation and two different processing conditions were examined as representative examples. Epoxies, like polyester resins, are used primarily as the matrix material in FRP construction. For each plastic type, three specimens were evaluated.
2.2 SELECTION AND DESCRIPTION OF ELASTOMERIC MATERIALS
The elastomer results presented and discussed in this report are an expansion of an earlier effort that focused on evaluating elastomer performance with gasoline test fuels containing up to 25% aggressive ethanol. These earlier results were published in a detailed report3 that includes a more detailed discussion of the literature, materials, experimental procedure, and results. The elastomeric materials evaluated in this study were
1. eight types of fluorocarbon rubbers, 2. one fluorosilicone rubber, 3. one silicone rubber, 4. six acrylonitrile-butadiene rubbers (NBRs), 5. one styrene-butadiene rubber (SBR), 6. one neoprene rubber, and 7. one polyurethane rubber.
The fluorocarbons were provided by two suppliers, and each supplier provided four types for experimentation. The NBRs were also supplied by two manufacturers, and the six grades that were evaluated are designed for use as fuel lines or hoses.
2.3 SELECTION AND DESCRIPTION OF METALLIC MATERIALS
Metals are used ubiquitously in fueling infrastructure, and a list of those alloys selected for evaluation is shown in Table 3. The two most commonly used metals or alloys are steel and aluminum. Steel is commonly used in the construction of underground storage tanks and piping systems, and aluminum is used in submersible turbine pumps, valves, and nozzles. Other metallic materials, such as bronze, brass, and nickel, are used in connections, valves, swivels, etc.
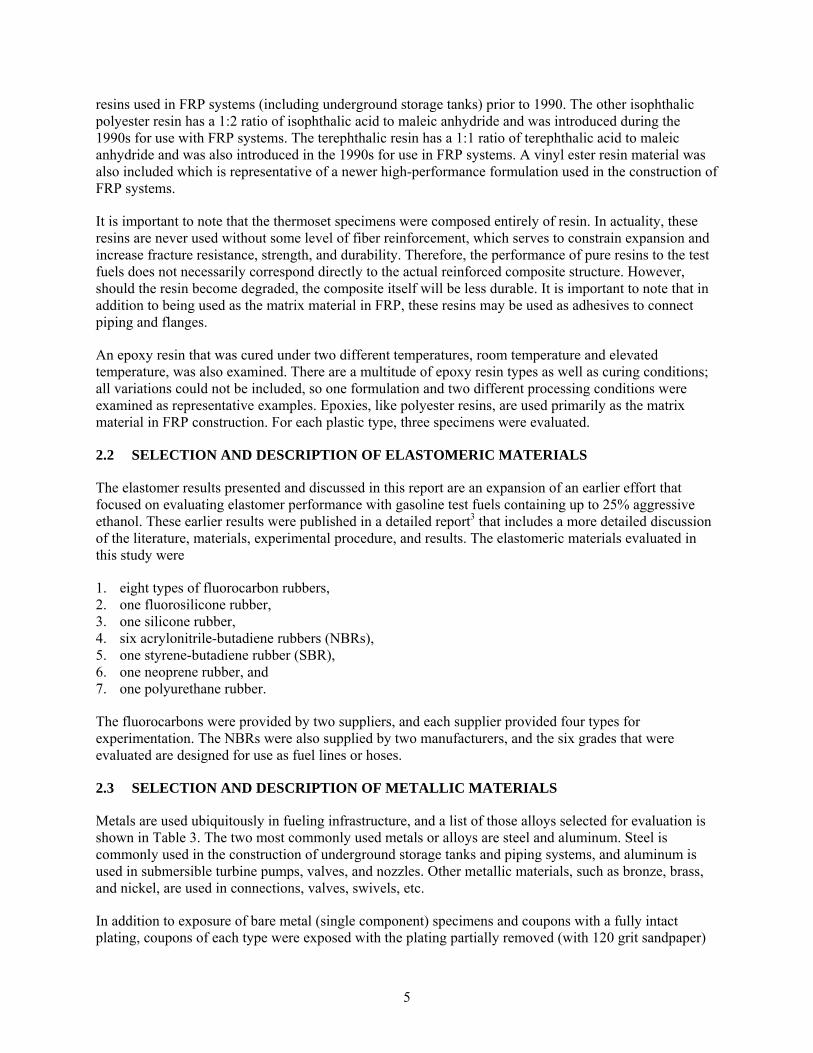
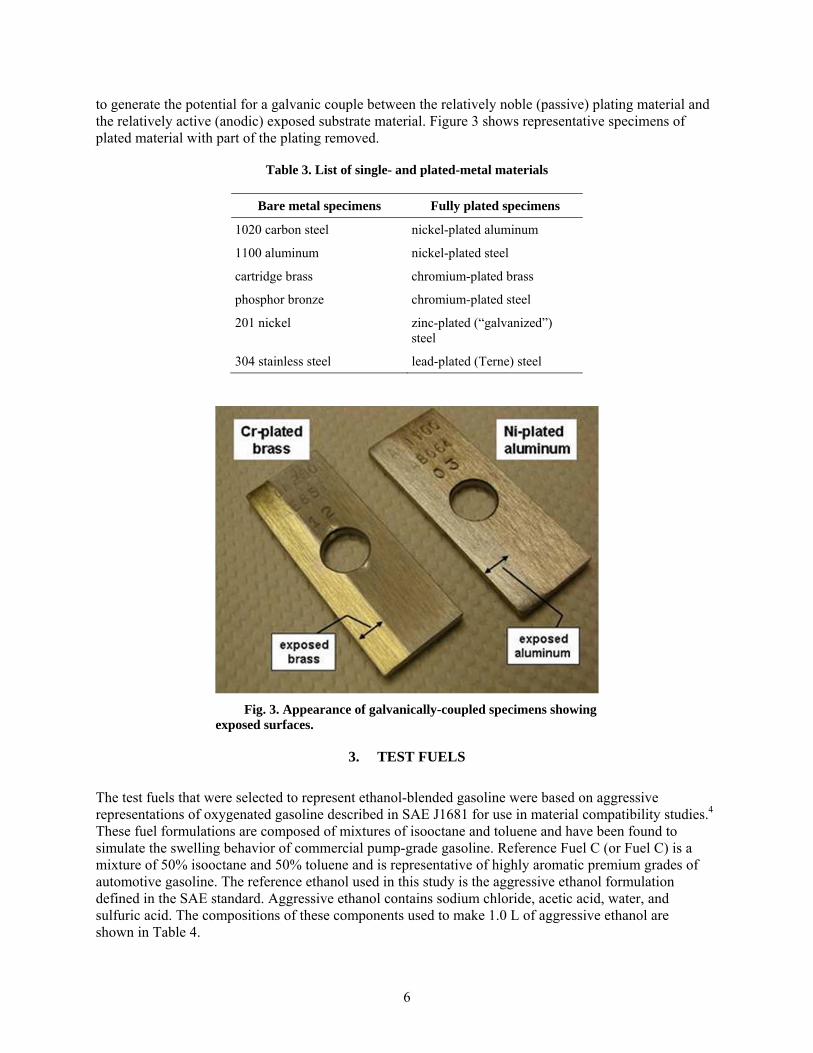
In addition to exposure of bare metal (single component) specimens and coupons with a fully intact plating, coupons of each type were exposed with the plating partially removed (with 120 grit sandpaper)
6
to generate the potential for a galvanic couple between the relatively noble (passive) plating material and the relatively active (anodic) exposed substrate material. Figure 3 shows representative specimens of plated material with part of the plating removed.
Table 3. List of single- and plated-metal materials
Bare metal specimens Fully plated specimens
1020 carbon steel nickel-plated aluminum
1100 aluminum nickel-plated steel
cartridge brass chromium-plated brass
phosphor bronze chromium-plated steel
201 nickel zinc-plated (“galvanized”) steel
304 stainless steel lead-plated (Terne) steel
Fig. 3. Appearance of galvanically-coupled specimens showing exposed surfaces.
3. TEST FUELS
The test fuels that were selected to represent ethanol-blended gasoline were based on aggressive representations of oxygenated gasoline described in SAE J1681 for use in material compatibility studies.4 These fuel formulations are composed of mixtures of isooctane and toluene and have been found to simulate the swelling behavior of commercial pump-grade gasoline. Reference Fuel C (or Fuel C) is a mixture of 50% isooctane and 50% toluene and is representative of highly aromatic premium grades of automotive gasoline. The reference ethanol used in this study is the aggressive ethanol formulation defined in the SAE standard. Aggressive ethanol contains sodium chloride, acetic acid, water, and sulfuric acid. The compositions of these components used to make 1.0 L of aggressive ethanol are shown in Table 4.
7
Table 4. Formulation used to make 1 L of aggressive ethanol
Component Amount need to make
1.0 L (g)
CDA ethanol 816.0
Deionized water 8.103
Sodium chloride 0.004
Sulfuric acid 0.021
Acetic acid 0.061
The aggressive formulation is conservative by design but is considered to be representative of field conditions since organic acids such as formic and acetic acid are present in certain fuels, including ethanol. These acids are formed in the production process of ethanol or created via oxidation during handling, transfer, and storage. Sulfuric acid is formed by the reaction of fuel-borne sulfur with ethanol and can be particularly corrosive to metals and polymers. Commercial-grade gasoline may contain varying amounts of sulfur, which is usually present as disulfides. Disulfides are converted to sulfonic acids in the presence of atmospheric oxygen and water. Since water is generally present in ethanol at some level, sulfuric acid will form in ethanol-blended gasoline.
Test fuels containing “C” in the nomenclature will have Fuel C as the base component, while the “a” refers to the “aggressive” ethanol formulation. Therefore, a test fuel designated as CE10a will contain 90% Fuel C (by volume) plus 10% aggressive ethanol (by volume). These test fuels are designed to simulate severe, real-world conditions. They are also intended to minimize the length of testing necessary to rigorously evaluate materials while providing a standard method of testing fuel system materials. Fuel C was selected as the control since it represents premium gasoline and is the standard test fluid most widely used for studying material compatibility to gasoline since 1980.
Because plastics were added to the material test matrix at a later point in the overall compatibility effort, they were not included in all of the test fuel formulations. Table 5 shows that elastomer and metals were evaluated in all of the test fuel formulations, but the plastics were only exposed to Fuel C, CE25a, CE50a, and CE85a.
Table 5. Matrix of material types and corresponding test fuels
Material type Test fuel formulation
Fuel C CE10a CE17a CE25a CE50a CE85a
Elastomers X X X X X X
Metals X X X X X X
Plastics X X X X
The test fuels were prepared by splash-blending the components one at a time. The first step was to prepare the aggressive water solution, which was poured into an empty 30-gallon drum. CDA20 ethanol was added to the aggressive water solution followed by Fuel C. The final fuel formulation was poured into the chamber, which was preloaded with the material specimens. In order to maintain a constant humidity in the vapor space, each chamber was purged with dry air for consistency.
8
4. EXPERIMENTAL PROTOCOL
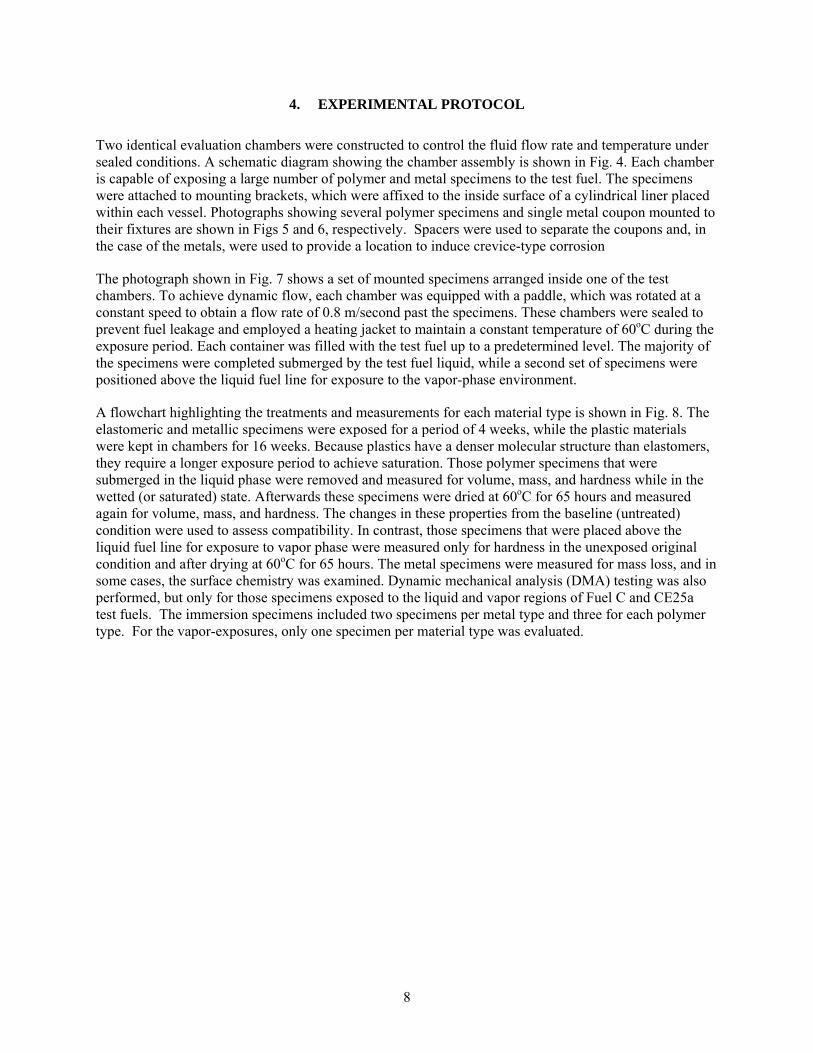
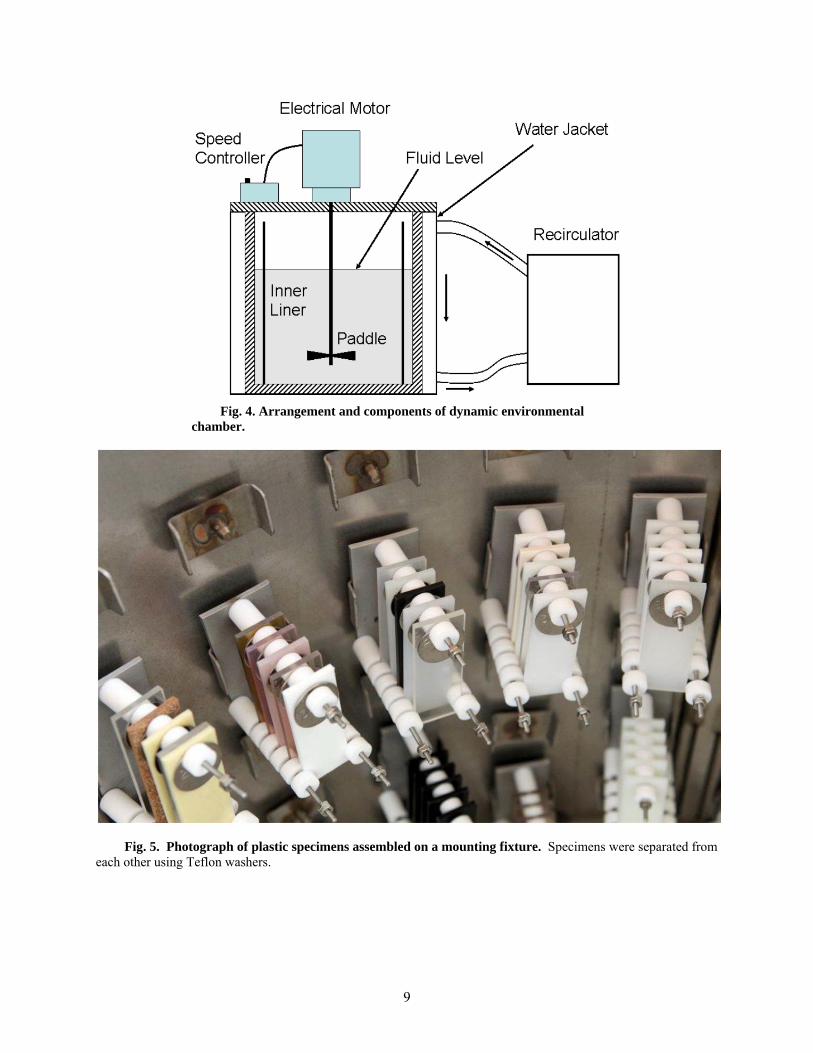
Two identical evaluation chambers were constructed to control the fluid flow rate and temperature under sealed conditions. A schematic diagram showing the chamber assembly is shown in Fig. 4. Each chamber is capable of exposing a large number of polymer and metal specimens to the test fuel. The specimens were attached to mounting brackets, which were affixed to the inside surface of a cylindrical liner placed within each vessel. Photographs showing several polymer specimens and single metal coupon mounted to their fixtures are shown in Figs 5 and 6, respectively. Spacers were used to separate the coupons and, in the case of the metals, were used to provide a location to induce crevice-type corrosion
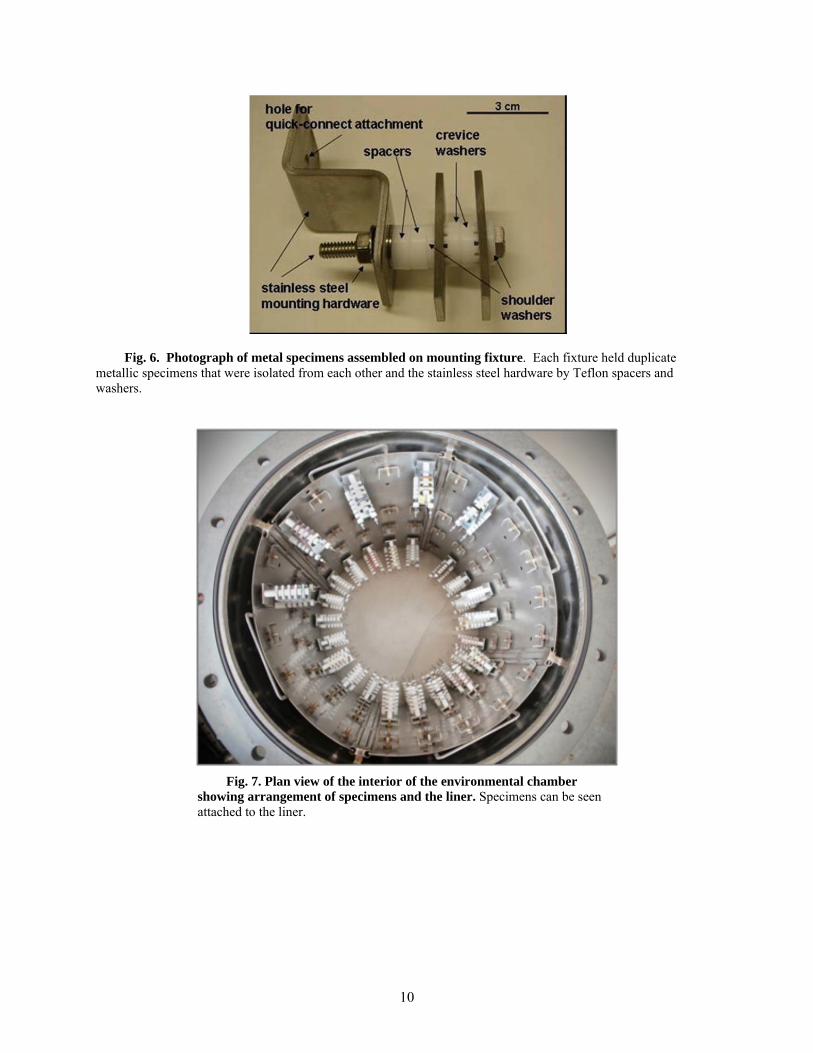
The photograph shown in Fig. 7 shows a set of mounted specimens arranged inside one of the test chambers. To achieve dynamic flow, each chamber was equipped with a paddle, which was rotated at a constant speed to obtain a flow rate of 0.8 m/second past the specimens. These chambers were sealed to prevent fuel leakage and employed a heating jacket to maintain a constant temperature of 60oC during the exposure period. Each container was filled with the test fuel up to a predetermined level. The majority of the specimens were completed submerged by the test fuel liquid, while a second set of specimens were positioned above the liquid fuel line for exposure to the vapor-phase environment.
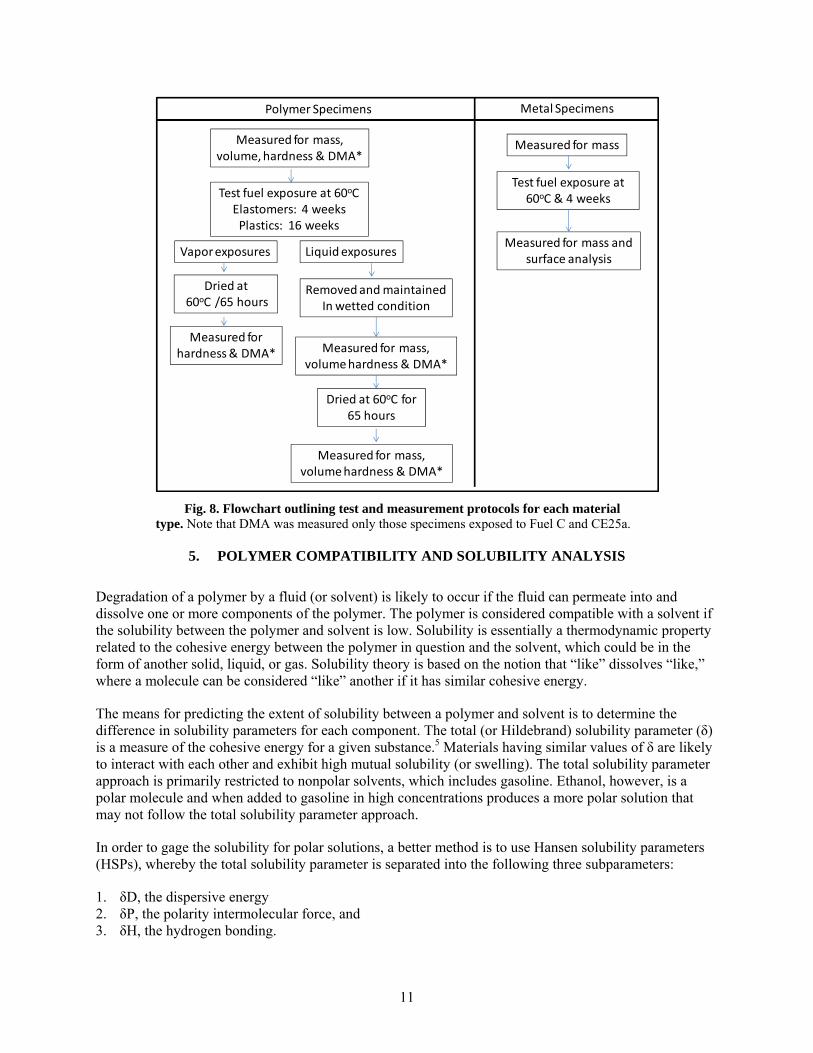
A flowchart highlighting the treatments and measurements for each material type is shown in Fig. 8. The elastomeric and metallic specimens were exposed for a period of 4 weeks, while the plastic materials were kept in chambers for 16 weeks. Because plastics have a denser molecular structure than elastomers, they require a longer exposure period to achieve saturation. Those polymer specimens that were submerged in the liquid phase were removed and measured for volume, mass, and hardness while in the wetted (or saturated) state. Afterwards these specimens were dried at 60oC for 65 hours and measured again for volume, mass, and hardness. The changes in these properties from the baseline (untreated) condition were used to assess compatibility. In contrast, those specimens that were placed above the liquid fuel line for exposure to vapor phase were measured only for hardness in the unexposed original condition and after drying at 60oC for 65 hours. The metal specimens were measured for mass loss, and in some cases, the surface chemistry was examined. Dynamic mechanical analysis (DMA) testing was also performed, but only for those specimens exposed to the liquid and vapor regions of Fuel C and CE25a test fuels. The immersion specimens included two specimens per metal type and three for each polymer type. For the vapor-exposures, only one specimen per material type was evaluated.
9
Fig. 4. Arrangement and components of dynamic environmental chamber.
Fig. 5. Photograph of plastic specimens assembled on a mounting fixture. Specimens were separated from each other using Teflon washers.
10
Fig. 6. Photograph of metal specimens assembled on mounting fixture. Each fixture held duplicate metallic specimens that were isolated from each other and the stainless steel hardware by Teflon spacers and washers.
Fig. 7. Plan view of the interior of the environmental chamber showing arrangement of specimens and the liner. Specimens can be seen attached to the liner.
11
Fig. 8. Flowchart outlining test and measurement protocols for each material type. Note that DMA was measured only those specimens exposed to Fuel C and CE25a.
5. POLYMER COMPATIBILITY AND SOLUBILITY ANALYSIS
Degradation of a polymer by a fluid (or solvent) is likely to occur if the fluid can permeate into and dissolve one or more components of the polymer. The polymer is considered compatible with a solvent if the solubility between the polymer and solvent is low. Solubility is essentially a thermodynamic property related to the cohesive energy between the polymer in question and the solvent, which could be in the form of another solid, liquid, or gas. Solubility theory is based on the notion that “like” dissolves “like,” where a molecule can be considered “like” another if it has similar cohesive energy.
The means for predicting the extent of solubility between a polymer and solvent is to determine the difference in solubility parameters for each component. The total (or Hildebrand) solubility parameter (δ) is a measure of the cohesive energy for a given substance.5 Materials having similar values of δ are likely to interact with each other and exhibit high mutual solubility (or swelling). The total solubility parameter approach is primarily restricted to nonpolar solvents, which includes gasoline. Ethanol, however, is a polar molecule and when added to gasoline in high concentrations produces a more polar solution that may not follow the total solubility parameter approach.
In order to gage the solubility for polar solutions, a better method is to use Hansen solubility parameters (HSPs), whereby the total solubility parameter is separated into the following three subparameters:
1. δD, the dispersive energy 2. δP, the polarity intermolecular force, and 3. δH, the hydrogen bonding.
Test fuel exposure at 60oCElastomers: 4 weeksPlastics: 16 weeks
Dried at 60oC for 65 hours
Liquid exposuresVapor exposures
Dried at60oC /65 hours
Measured for mass,volume, hardness & DMA*
Measured for hardness & DMA* Measured for mass,
volume hardness & DMA*
Measured for mass, volume hardness & DMA*
Removed and maintainedIn wetted condition
Measured for mass
Test fuel exposure at 60oC & 4 weeks
Measured for mass and surface analysis
Polymer Specimens Metal Specimens
12
These three parameters serve as coordinates for a site in three dimensions also known as the Hansen space. The distance between two molecules in this space determines how likely they are to dissolve into each other; the closer they are, the more likely they are to mutually dissolve each other (become miscible). For solid materials (solutes), their HSPs define the coordinates (location) of the center of a sphere, the radius of which is known as the interaction radius. The interaction radius represents a region of high solubility, and solvents having HSP values that are inside this sphere are considered highly soluble with the polymer solid, while those outside the sphere are not.5
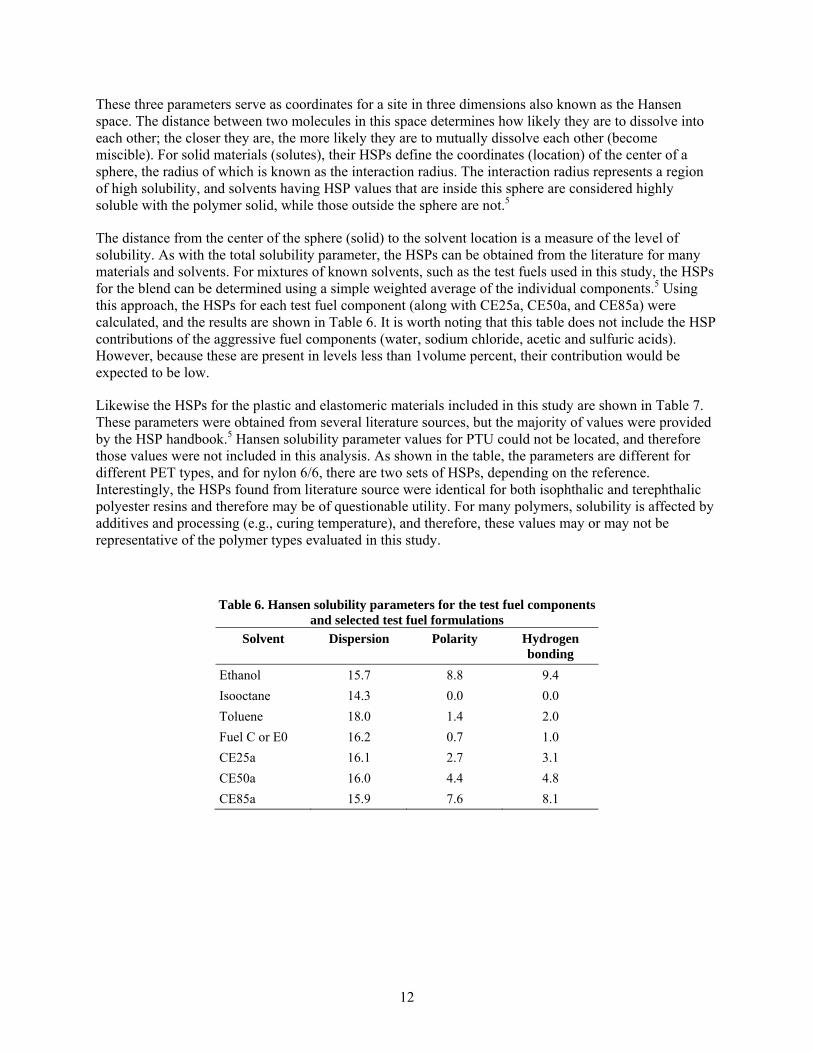
The distance from the center of the sphere (solid) to the solvent location is a measure of the level of solubility. As with the total solubility parameter, the HSPs can be obtained from the literature for many materials and solvents. For mixtures of known solvents, such as the test fuels used in this study, the HSPs for the blend can be determined using a simple weighted average of the individual components.5 Using this approach, the HSPs for each test fuel component (along with CE25a, CE50a, and CE85a) were calculated, and the results are shown in Table 6. It is worth noting that this table does not include the HSP contributions of the aggressive fuel components (water, sodium chloride, acetic and sulfuric acids). However, because these are present in levels less than 1volume percent, their contribution would be expected to be low.
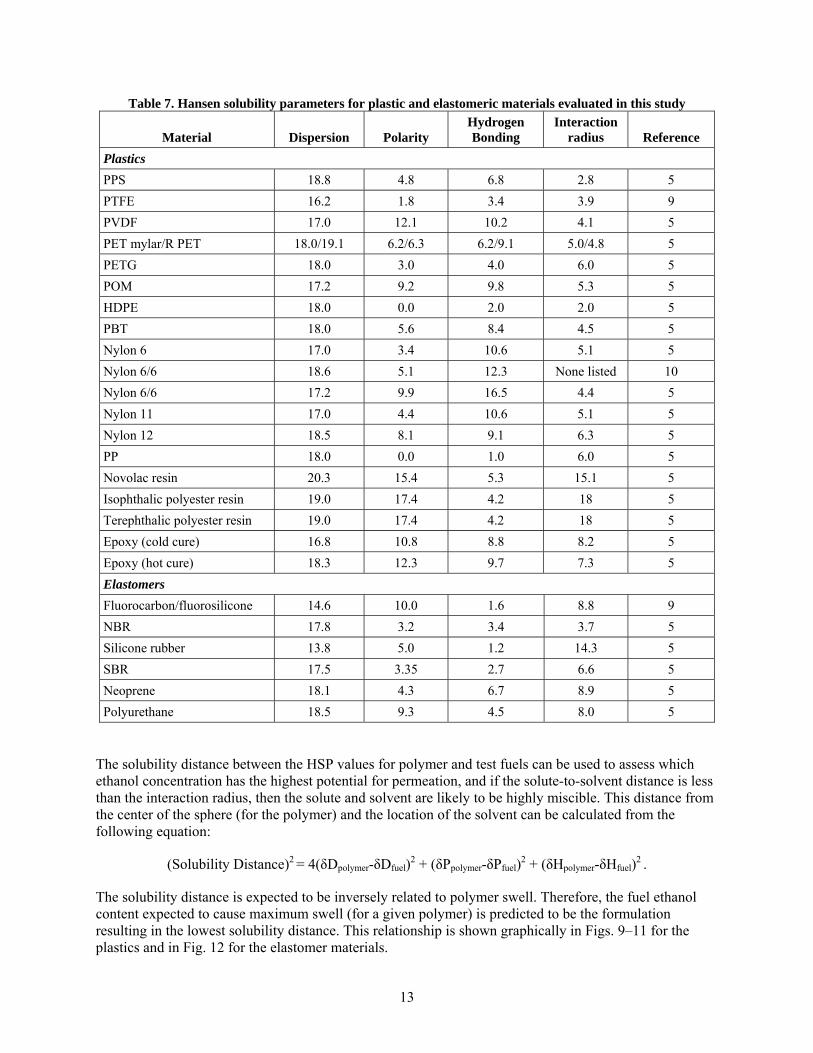
Likewise the HSPs for the plastic and elastomeric materials included in this study are shown in Table 7. These parameters were obtained from several literature sources, but the majority of values were provided by the HSP handbook.5 Hansen solubility parameter values for PTU could not be located, and therefore those values were not included in this analysis. As shown in the table, the parameters are different for different PET types, and for nylon 6/6, there are two sets of HSPs, depending on the reference. Interestingly, the HSPs found from literature source were identical for both isophthalic and terephthalic polyester resins and therefore may be of questionable utility. For many polymers, solubility is affected by additives and processing (e.g., curing temperature), and therefore, these values may or may not be representative of the polymer types evaluated in this study.
Table 6. Hansen solubility parameters for the test fuel components and selected test fuel formulations
Solvent Dispersion Polarity Hydrogen bonding
Ethanol 15.7 8.8 9.4
Isooctane 14.3 0.0 0.0
Toluene 18.0 1.4 2.0
Fuel C or E0 16.2 0.7 1.0
CE25a 16.1 2.7 3.1
CE50a 16.0 4.4 4.8
CE85a 15.9 7.6 8.1
13
Table 7. Hansen solubility parameters for plastic and elastomeric materials evaluated in this study
Material Dispersion Polarity Hydrogen Bonding
Interaction radius Reference
Plastics
PPS 18.8 4.8 6.8 2.8 5
PTFE 16.2 1.8 3.4 3.9 9
PVDF 17.0 12.1 10.2 4.1 5
PET mylar/R PET 18.0/19.1 6.2/6.3 6.2/9.1 5.0/4.8 5
PETG 18.0 3.0 4.0 6.0 5
POM 17.2 9.2 9.8 5.3 5
HDPE 18.0 0.0 2.0 2.0 5
PBT 18.0 5.6 8.4 4.5 5
Nylon 6 17.0 3.4 10.6 5.1 5
Nylon 6/6 18.6 5.1 12.3 None listed 10
Nylon 6/6 17.2 9.9 16.5 4.4 5
Nylon 11 17.0 4.4 10.6 5.1 5
Nylon 12 18.5 8.1 9.1 6.3 5
PP 18.0 0.0 1.0 6.0 5
Novolac resin 20.3 15.4 5.3 15.1 5
Isophthalic polyester resin 19.0 17.4 4.2 18 5
Terephthalic polyester resin 19.0 17.4 4.2 18 5
Epoxy (cold cure) 16.8 10.8 8.8 8.2 5
Epoxy (hot cure) 18.3 12.3 9.7 7.3 5
Elastomers
Fluorocarbon/fluorosilicone 14.6 10.0 1.6 8.8 9
NBR 17.8 3.2 3.4 3.7 5
Silicone rubber 13.8 5.0 1.2 14.3 5
SBR 17.5 3.35 2.7 6.6 5
Neoprene 18.1 4.3 6.7 8.9 5
Polyurethane 18.5 9.3 4.5 8.0 5
The solubility distance between the HSP values for polymer and test fuels can be used to assess which ethanol concentration has the highest potential for permeation, and if the solute-to-solvent distance is less than the interaction radius, then the solute and solvent are likely to be highly miscible. This distance from the center of the sphere (for the polymer) and the location of the solvent can be calculated from the following equation:
(Solubility Distance)2 = 4(δDpolymer-δDfuel)2 + (δPpolymer-δPfuel)
2 + (δHpolymer-δHfuel)2 .
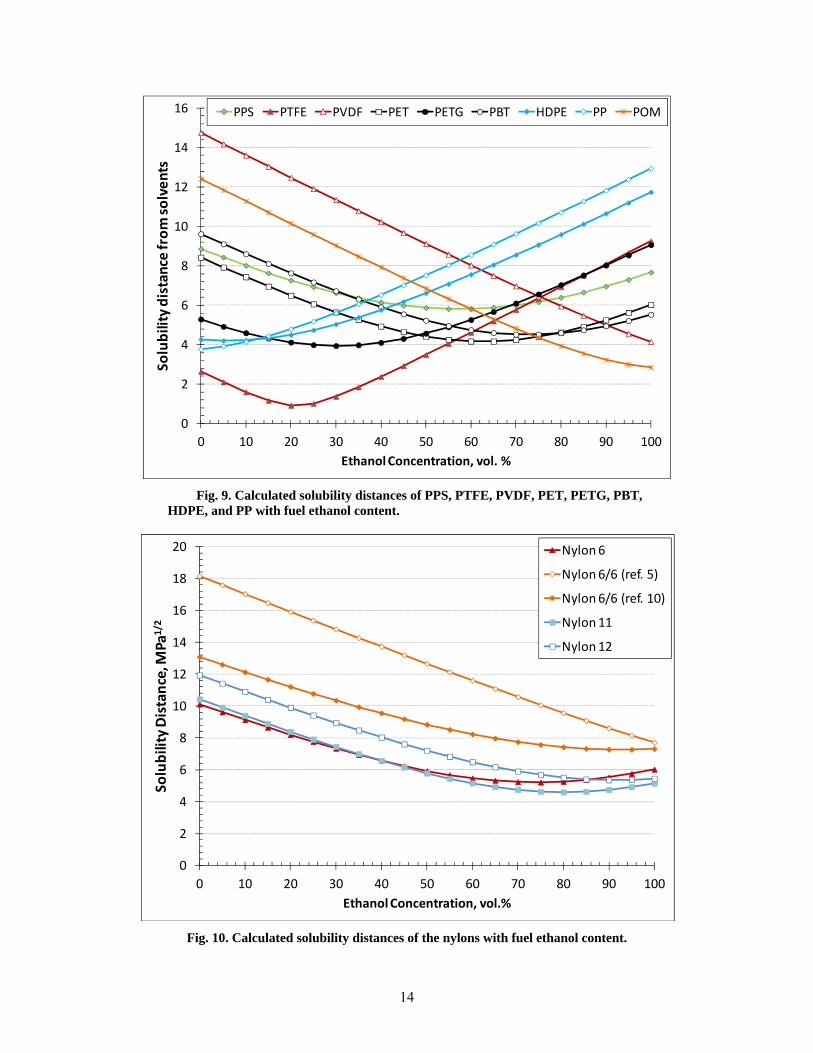
The solubility distance is expected to be inversely related to polymer swell. Therefore, the fuel ethanol content expected to cause maximum swell (for a given polymer) is predicted to be the formulation resulting in the lowest solubility distance. This relationship is shown graphically in Figs. 9–11 for the plastics and in Fig. 12 for the elastomer materials.
14
Fig. 9. Calculated solubility distances of PPS, PTFE, PVDF, PET, PETG, PBT, HDPE, and PP with fuel ethanol content.
Fig. 10. Calculated solubility distances of the nylons with fuel ethanol content.
0
2
4
6
8
10
12
14
16
0 10 20 30 40 50 60 70 80 90 100
Solubility distance from solvents
Ethanol Concentration, vol. %
PPS PTFE PVDF PET PETG PBT HDPE PP POM
0
2
4
6
8
10
12
14
16
18
20
0 10 20 30 40 50 60 70 80 90 100
Solubility Distance, M
Pa1/2
Ethanol Concentration, vol.%
Nylon 6
Nylon 6/6 (ref. 5)
Nylon 6/6 (ref. 10)
Nylon 11
Nylon 12
15
Fig. 11. Calculated solubility distances of the thermoset resins with fuel ethanol content.
Fig. 12. Calculated solubility distances for the elastomers with fuel ethanol concentration.
0
2
4
6
8
10
12
14
16
18
20
0 10 20 30 40 50 60 70 80 90 100
Solubility Distance, M
Pa1/2
Ethanol Concentration, vol.%
Novolac vinyl ester resin
Isophthalic polyester resin
Terephthalic polyester resin
Epoxy (cold cure)
Epoxy (hot cured)
0
2
4
6
8
10
12
0 20 40 60 80 100
Solubility Distance, M
Pa1/2
Ethanol Concentration, vol.%
Fluorocarbons
NBR
Silicone
SBR
Neoprene
Polyurethane
16
The curves in Fig. 9 represent the majority of thermoplastic materials, excluding the nylons and thermosets. The results show that for most of these plastics, peak swell is expected to occur at low to mid levels of ethanol. Notable exceptions include HDPE, PP, PVDF, and POM. The calculated solubility distances for the four nylon materials are shown in Fig. 10. The nylons exhibited relatively similar behavior except for the curve generated for nylon 6/6 using reference 5 HSPs. In contrast, the HSPs from reference 10 produced a curve for nylon 6/6 that followed more closely to the other nylon types in shape and value. Because of its similarity with the other nylon grades, reference 10 data was used to predict performance. Unfortunately, reference 10 did not provide an interaction radius, so the value used from reference 5 was used. The thermoset resin results (Fig. 11) predict solubility to increase with increasing ethanol content up to E100.
In general the solubility distances for the elastomers are lower than for plastics, as shown in Fig. 12. Elastomers have a lower degree of crosslinking and reduced density relative to plastics, which contributes to their higher solubility and swell. As shown in Fig. 12, these materials are predicted to exhibit peak swell at low to mid levels of ethanol.
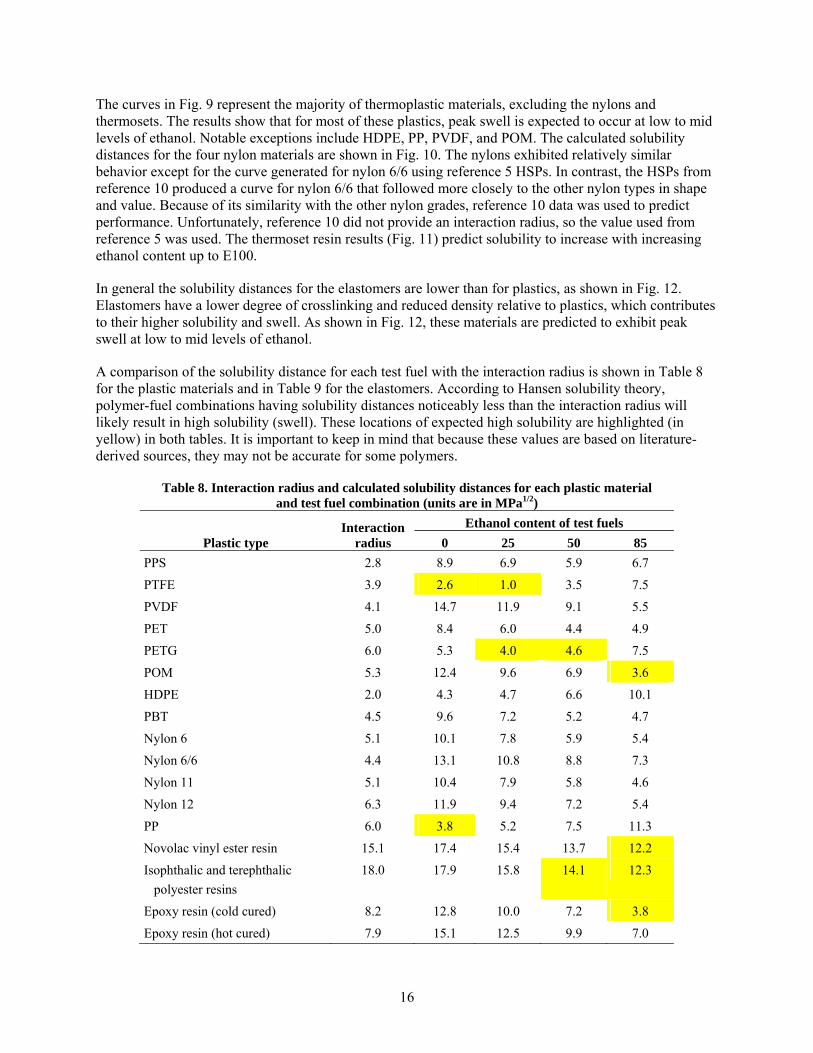
A comparison of the solubility distance for each test fuel with the interaction radius is shown in Table 8 for the plastic materials and in Table 9 for the elastomers. According to Hansen solubility theory, polymer-fuel combinations having solubility distances noticeably less than the interaction radius will likely result in high solubility (swell). These locations of expected high solubility are highlighted (in yellow) in both tables. It is important to keep in mind that because these values are based on literature-derived sources, they may not be accurate for some polymers.
Table 8. Interaction radius and calculated solubility distances for each plastic material and test fuel combination (units are in MPa1/2)
Plastic type Interaction
radius
Ethanol content of test fuels
0 25 50 85
PPS 2.8 8.9 6.9 5.9 6.7
PTFE 3.9 2.6 1.0 3.5 7.5
PVDF 4.1 14.7 11.9 9.1 5.5
PET 5.0 8.4 6.0 4.4 4.9
PETG 6.0 5.3 4.0 4.6 7.5
POM 5.3 12.4 9.6 6.9 3.6
HDPE 2.0 4.3 4.7 6.6 10.1
PBT 4.5 9.6 7.2 5.2 4.7
Nylon 6 5.1 10.1 7.8 5.9 5.4
Nylon 6/6 4.4 13.1 10.8 8.8 7.3
Nylon 11 5.1 10.4 7.9 5.8 4.6
Nylon 12 6.3 11.9 9.4 7.2 5.4
PP 6.0 3.8 5.2 7.5 11.3
Novolac vinyl ester resin 15.1 17.4 15.4 13.7 12.2
Isophthalic and terephthalic
polyester resins
18.0 17.9 15.8 14.1 12.3
Epoxy resin (cold cured) 8.2 12.8 10.0 7.2 3.8
Epoxy resin (hot cured) 7.9 15.1 12.5 9.9 7.0
17
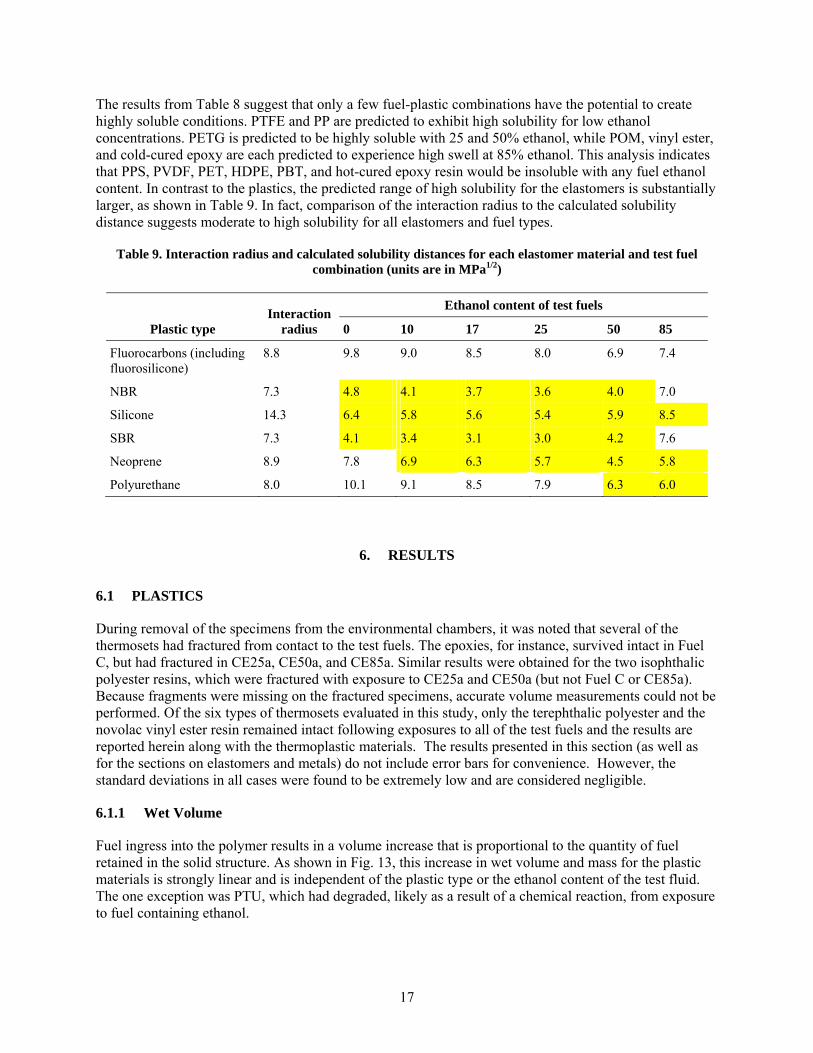
The results from Table 8 suggest that only a few fuel-plastic combinations have the potential to create highly soluble conditions. PTFE and PP are predicted to exhibit high solubility for low ethanol concentrations. PETG is predicted to be highly soluble with 25 and 50% ethanol, while POM, vinyl ester, and cold-cured epoxy are each predicted to experience high swell at 85% ethanol. This analysis indicates that PPS, PVDF, PET, HDPE, PBT, and hot-cured epoxy resin would be insoluble with any fuel ethanol content. In contrast to the plastics, the predicted range of high solubility for the elastomers is substantially larger, as shown in Table 9. In fact, comparison of the interaction radius to the calculated solubility distance suggests moderate to high solubility for all elastomers and fuel types.
Table 9. Interaction radius and calculated solubility distances for each elastomer material and test fuel combination (units are in MPa1/2)
Plastic type Interaction
radius
Ethanol content of test fuels
0 10 17 25 50 85
Fluorocarbons (including fluorosilicone)
8.8 9.8 9.0 8.5 8.0 6.9 7.4
NBR 7.3 4.8 4.1 3.7 3.6 4.0 7.0
Silicone 14.3 6.4 5.8 5.6 5.4 5.9 8.5
SBR 7.3 4.1 3.4 3.1 3.0 4.2 7.6
Neoprene 8.9 7.8 6.9 6.3 5.7 4.5 5.8
Polyurethane 8.0 10.1 9.1 8.5 7.9 6.3 6.0
6. RESULTS
6.1 PLASTICS
During removal of the specimens from the environmental chambers, it was noted that several of the thermosets had fractured from contact to the test fuels. The epoxies, for instance, survived intact in Fuel C, but had fractured in CE25a, CE50a, and CE85a. Similar results were obtained for the two isophthalic polyester resins, which were fractured with exposure to CE25a and CE50a (but not Fuel C or CE85a). Because fragments were missing on the fractured specimens, accurate volume measurements could not be performed. Of the six types of thermosets evaluated in this study, only the terephthalic polyester and the novolac vinyl ester resin remained intact following exposures to all of the test fuels and the results are reported herein along with the thermoplastic materials. The results presented in this section (as well as for the sections on elastomers and metals) do not include error bars for convenience. However, the standard deviations in all cases were found to be extremely low and are considered negligible.
6.1.1 Wet Volume
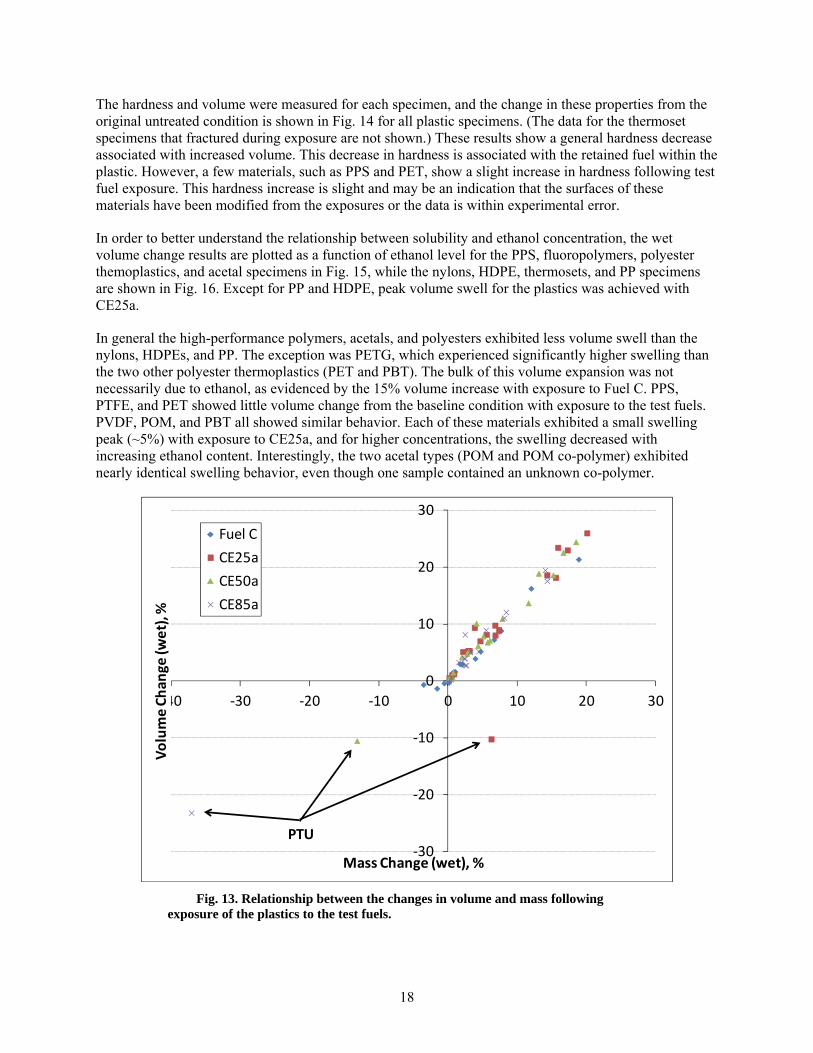
Fuel ingress into the polymer results in a volume increase that is proportional to the quantity of fuel retained in the solid structure. As shown in Fig. 13, this increase in wet volume and mass for the plastic materials is strongly linear and is independent of the plastic type or the ethanol content of the test fluid. The one exception was PTU, which had degraded, likely as a result of a chemical reaction, from exposure to fuel containing ethanol.
18
The hardness and volume were measured for each specimen, and the change in these properties from the original untreated condition is shown in Fig. 14 for all plastic specimens. (The data for the thermoset specimens that fractured during exposure are not shown.) These results show a general hardness decrease associated with increased volume. This decrease in hardness is associated with the retained fuel within the plastic. However, a few materials, such as PPS and PET, show a slight increase in hardness following test fuel exposure. This hardness increase is slight and may be an indication that the surfaces of these materials have been modified from the exposures or the data is within experimental error.
In order to better understand the relationship between solubility and ethanol concentration, the wet volume change results are plotted as a function of ethanol level for the PPS, fluoropolymers, polyester themoplastics, and acetal specimens in Fig. 15, while the nylons, HDPE, thermosets, and PP specimens are shown in Fig. 16. Except for PP and HDPE, peak volume swell for the plastics was achieved with CE25a.
In general the high-performance polymers, acetals, and polyesters exhibited less volume swell than the nylons, HDPEs, and PP. The exception was PETG, which experienced significantly higher swelling than the two other polyester thermoplastics (PET and PBT). The bulk of this volume expansion was not necessarily due to ethanol, as evidenced by the 15% volume increase with exposure to Fuel C. PPS, PTFE, and PET showed little volume change from the baseline condition with exposure to the test fuels. PVDF, POM, and PBT all showed similar behavior. Each of these materials exhibited a small swelling peak (~5%) with exposure to CE25a, and for higher concentrations, the swelling decreased with increasing ethanol content. Interestingly, the two acetal types (POM and POM co-polymer) exhibited nearly identical swelling behavior, even though one sample contained an unknown co-polymer.
Fig. 13. Relationship between the changes in volume and mass following exposure of the plastics to the test fuels.
‐30
‐20
‐10
0
10
20
30
‐40 ‐30 ‐20 ‐10 0 10 20 30
Volume Chan
ge (w
et), %
Mass Change (wet), %
Fuel C
CE25a
CE50a
CE85a
PTU
19
Fig. 14. Relationship between changes in hardness and volume following exposure of the plastics to the test fuels while still in the wetted state.
Fig. 15. Wet volume change results for PPS, fluoropolymers, polyester thermoplastics, and acetals.
‐30
‐25
‐20
‐15
‐10
‐5
0
5
10
‐5 0 5 10 15 20 25 30
Point Chan
ge in Hardness (w
et) from Baseline
Volume Change (wet), %
Fuel C
CE25a
CE50a
CE85a
PPSPET
‐5
0
5
10
15
20
25
30
0 20 40 60 80 100
Volume Chan
ge (w
et), %
Ethanol Concentration, %vol.
PPS PTFE PVDF PET PETG PBT POM POM (copolymer)
20
Fig. 16. Wet volume change results for the nylons, high-density polyethylenes, thermosets, and polypropylene.
As shown in Fig. 16, the volume swell results for the nylons, HDPEs, and thermosets grouped together. The one exception was nylon 11, which differed from the other nylons in that it was derived from vegetable oil instead of petroleum. The two thermoset resins exhibited the highest volume expansion to test fuels containing ethanol. For both resins, peak volume swell occurred with CE25a, and was over 22% in each case. The nylons did not swell as much as the resins following exposure to Fuel C, but they did show a significant increase in volume swell with exposure to CE25a. Interestingly, the swell was relatively unchanged for higher ethanol concentrations. Polypropylene and HDPE showed a similar relationship of volume swell with ethanol content. For both materials swelling was highest for Fuel C and was observed to decrease with increased ethanol content. However, PP exhibited significantly higher swell than HDPE for all test fuels. The two HDPEs were nearly identical in behavior, indicating that fluorine does not necessarily improve permeation resistance to ethanol and gasoline.
The four thermoset polyester resins evaluated in this study are
1. isophthalic polyester (1:1 ratio of isophthalic acid to moleic anhydride), 2. isophthalic polyester (2:1 ratio of isophthalic acid to moleic anhydride), 3. terephthalic polyester, and 4. novolac vinyl ester.
These resins were designed for use as matrix polymers in FRP structures, including legacy and new underground storage tanks. The two isophthalic polyesters are distinguished from each other by the ratio of the isophthalic acid to moleic anhydride. The resin having a 1:1 ratio of isophthalic acid to moleic anhydride was commonly used in tanks prior to 1990, whereas the second isophthalic resin (having a 2:1 ratio) was introduced during the 1990s. The terephthalic polyester resin was also introduced during the 1990s, while the novolac vinyl ester is considered a newer “higher performance” grade for FRP use.
‐5
0
5
10
15
20
25
30
35
40
0 20 40 60 80 100
Volume Chan
ge (w
et), %
Ethanol Concentration, %vol.
Nylon 12 Nylon 6
Nylon 6/6 Nylon 11
Vinyl ester resin Terephthalic polyester resin
HDPE F‐HDPE
PP
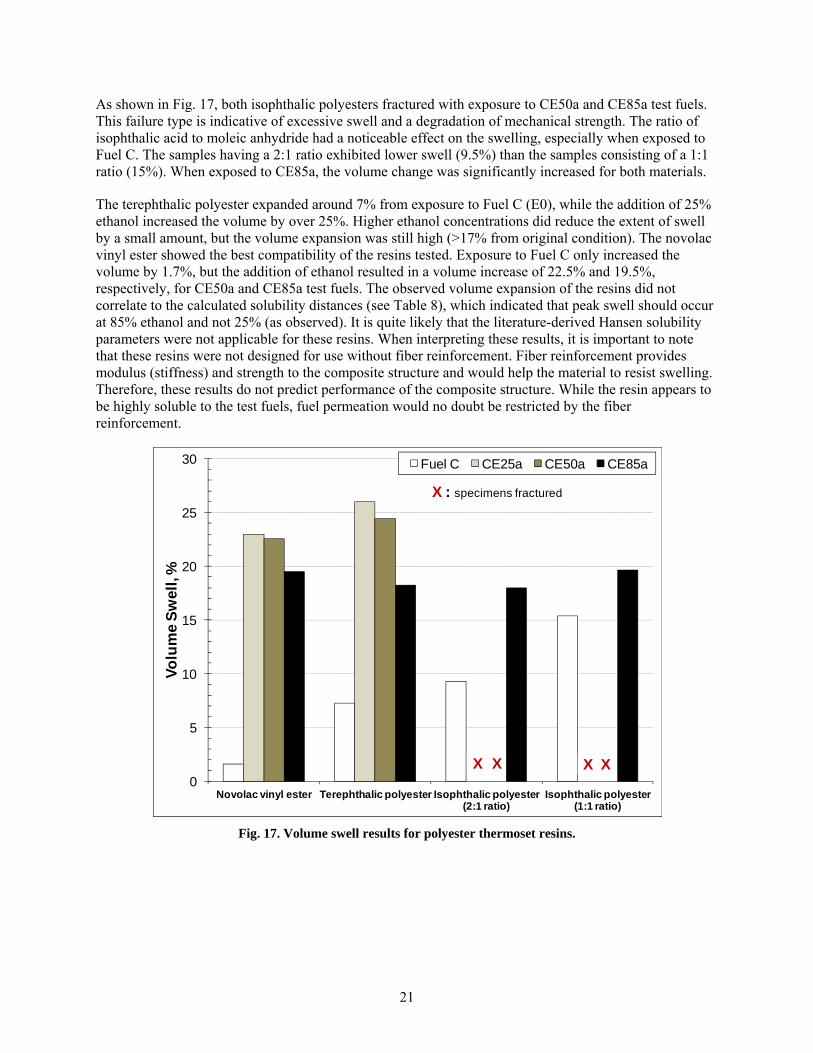
21
As shown in Fig. 17, both isophthalic polyesters fractured with exposure to CE50a and CE85a test fuels. This failure type is indicative of excessive swell and a degradation of mechanical strength. The ratio of isophthalic acid to moleic anhydride had a noticeable effect on the swelling, especially when exposed to Fuel C. The samples having a 2:1 ratio exhibited lower swell (9.5%) than the samples consisting of a 1:1 ratio (15%). When exposed to CE85a, the volume change was significantly increased for both materials.
The terephthalic polyester expanded around 7% from exposure to Fuel C (E0), while the addition of 25% ethanol increased the volume by over 25%. Higher ethanol concentrations did reduce the extent of swell by a small amount, but the volume expansion was still high (>17% from original condition). The novolac vinyl ester showed the best compatibility of the resins tested. Exposure to Fuel C only increased the volume by 1.7%, but the addition of ethanol resulted in a volume increase of 22.5% and 19.5%, respectively, for CE50a and CE85a test fuels. The observed volume expansion of the resins did not correlate to the calculated solubility distances (see Table 8), which indicated that peak swell should occur at 85% ethanol and not 25% (as observed). It is quite likely that the literature-derived Hansen solubility parameters were not applicable for these resins. When interpreting these results, it is important to note that these resins were not designed for use without fiber reinforcement. Fiber reinforcement provides modulus (stiffness) and strength to the composite structure and would help the material to resist swelling. Therefore, these results do not predict performance of the composite structure. While the resin appears to be highly soluble to the test fuels, fuel permeation would no doubt be restricted by the fiber reinforcement.
Fig. 17. Volume swell results for polyester thermoset resins.
0
5
10
15
20
25
30
Novolac vinyl ester Terephthalic polyester Isophthalic polyester (2:1 ratio)
Isophthalic polyester (1:1 ratio)
Vo
lum
e S
wel
l, %
Fuel C CE25a CE50a CE85a
X X X X
X : specimens fractured
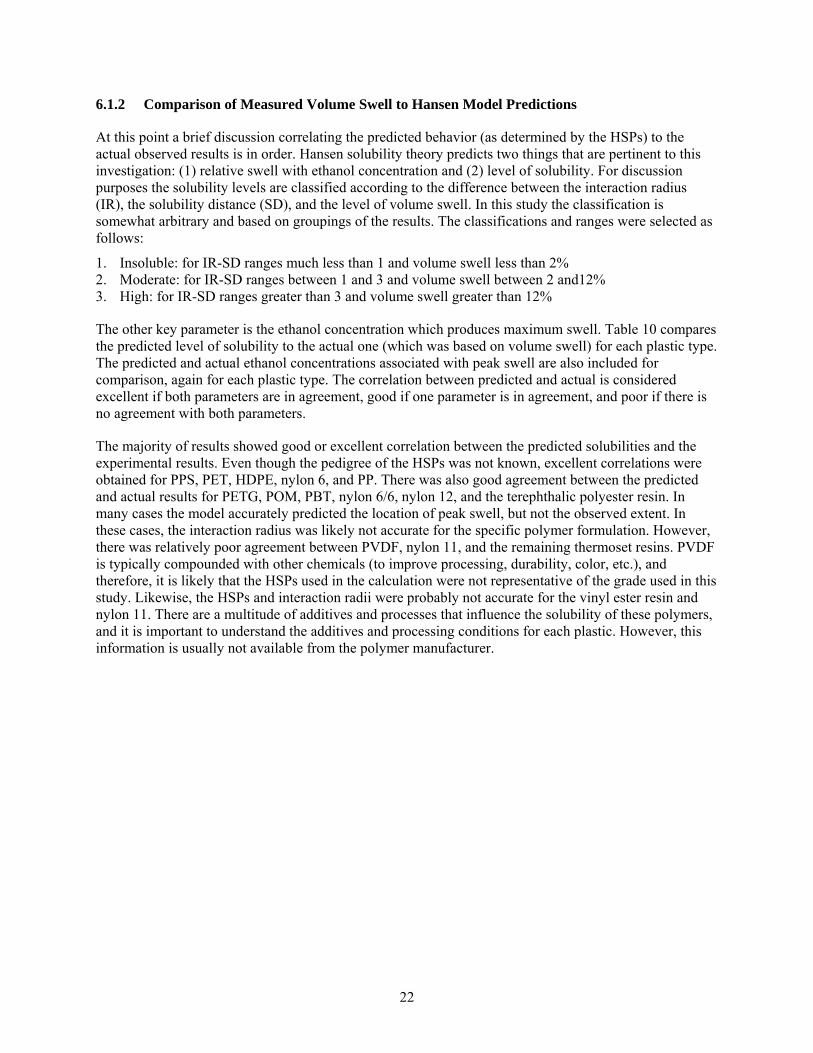
22
6.1.2 Comparison of Measured Volume Swell to Hansen Model Predictions
At this point a brief discussion correlating the predicted behavior (as determined by the HSPs) to the actual observed results is in order. Hansen solubility theory predicts two things that are pertinent to this investigation: (1) relative swell with ethanol concentration and (2) level of solubility. For discussion purposes the solubility levels are classified according to the difference between the interaction radius (IR), the solubility distance (SD), and the level of volume swell. In this study the classification is somewhat arbitrary and based on groupings of the results. The classifications and ranges were selected as follows:
1. Insoluble: for IR-SD ranges much less than 1 and volume swell less than 2% 2. Moderate: for IR-SD ranges between 1 and 3 and volume swell between 2 and12% 3. High: for IR-SD ranges greater than 3 and volume swell greater than 12%
The other key parameter is the ethanol concentration which produces maximum swell. Table 10 compares the predicted level of solubility to the actual one (which was based on volume swell) for each plastic type. The predicted and actual ethanol concentrations associated with peak swell are also included for comparison, again for each plastic type. The correlation between predicted and actual is considered excellent if both parameters are in agreement, good if one parameter is in agreement, and poor if there is no agreement with both parameters.
The majority of results showed good or excellent correlation between the predicted solubilities and the experimental results. Even though the pedigree of the HSPs was not known, excellent correlations were obtained for PPS, PET, HDPE, nylon 6, and PP. There was also good agreement between the predicted and actual results for PETG, POM, PBT, nylon 6/6, nylon 12, and the terephthalic polyester resin. In many cases the model accurately predicted the location of peak swell, but not the observed extent. In these cases, the interaction radius was likely not accurate for the specific polymer formulation. However, there was relatively poor agreement between PVDF, nylon 11, and the remaining thermoset resins. PVDF is typically compounded with other chemicals (to improve processing, durability, color, etc.), and therefore, it is likely that the HSPs used in the calculation were not representative of the grade used in this study. Likewise, the HSPs and interaction radii were probably not accurate for the vinyl ester resin and nylon 11. There are a multitude of additives and processes that influence the solubility of these polymers, and it is important to understand the additives and processing conditions for each plastic. However, this information is usually not available from the polymer manufacturer.
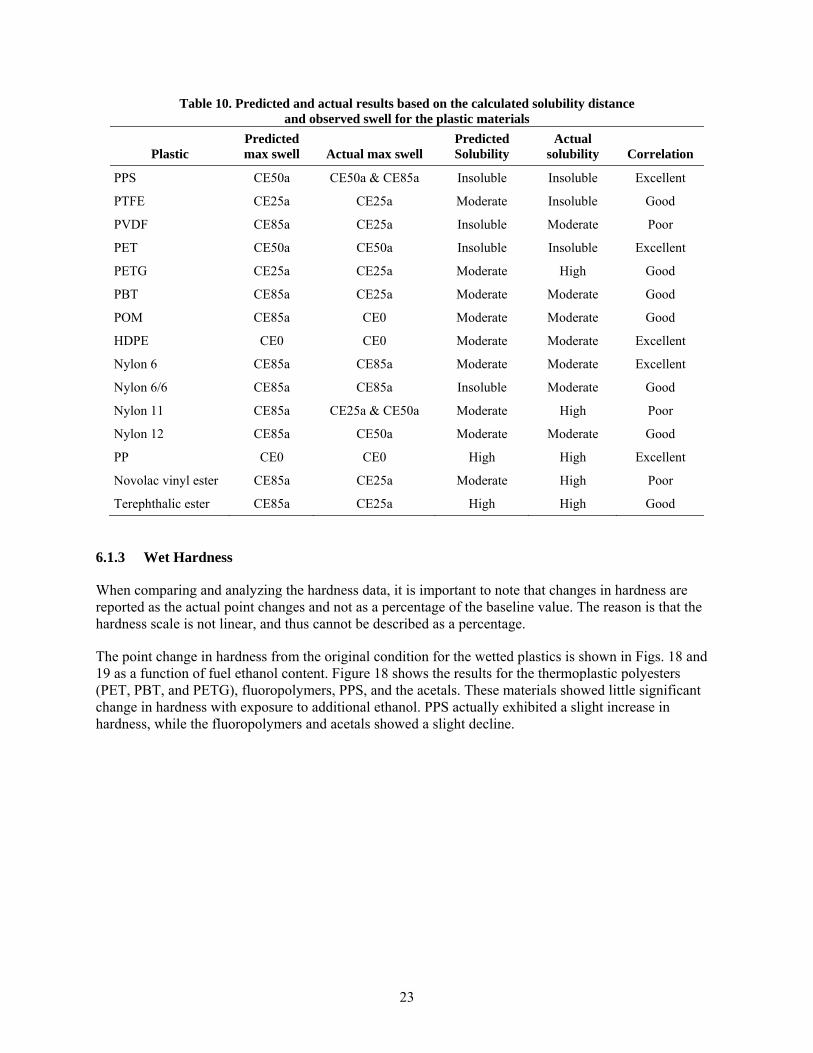
23
Table 10. Predicted and actual results based on the calculated solubility distance and observed swell for the plastic materials
Plastic Predicted max swell Actual max swell
Predicted Solubility
Actual solubility Correlation
PPS CE50a CE50a & CE85a Insoluble Insoluble Excellent
PTFE CE25a CE25a Moderate Insoluble Good
PVDF CE85a CE25a Insoluble Moderate Poor
PET CE50a CE50a Insoluble Insoluble Excellent
PETG CE25a CE25a Moderate High Good
PBT CE85a CE25a Moderate Moderate Good
POM CE85a CE0 Moderate Moderate Good
HDPE CE0 CE0 Moderate Moderate Excellent
Nylon 6 CE85a CE85a Moderate Moderate Excellent
Nylon 6/6 CE85a CE85a Insoluble Moderate Good
Nylon 11 CE85a CE25a & CE50a Moderate High Poor
Nylon 12 CE85a CE50a Moderate Moderate Good
PP CE0 CE0 High High Excellent
Novolac vinyl ester CE85a CE25a Moderate High Poor
Terephthalic ester CE85a CE25a High High Good
6.1.3 Wet Hardness
When comparing and analyzing the hardness data, it is important to note that changes in hardness are reported as the actual point changes and not as a percentage of the baseline value. The reason is that the hardness scale is not linear, and thus cannot be described as a percentage.
The point change in hardness from the original condition for the wetted plastics is shown in Figs. 18 and 19 as a function of fuel ethanol content. Figure 18 shows the results for the thermoplastic polyesters (PET, PBT, and PETG), fluoropolymers, PPS, and the acetals. These materials showed little significant change in hardness with exposure to additional ethanol. PPS actually exhibited a slight increase in hardness, while the fluoropolymers and acetals showed a slight decline.
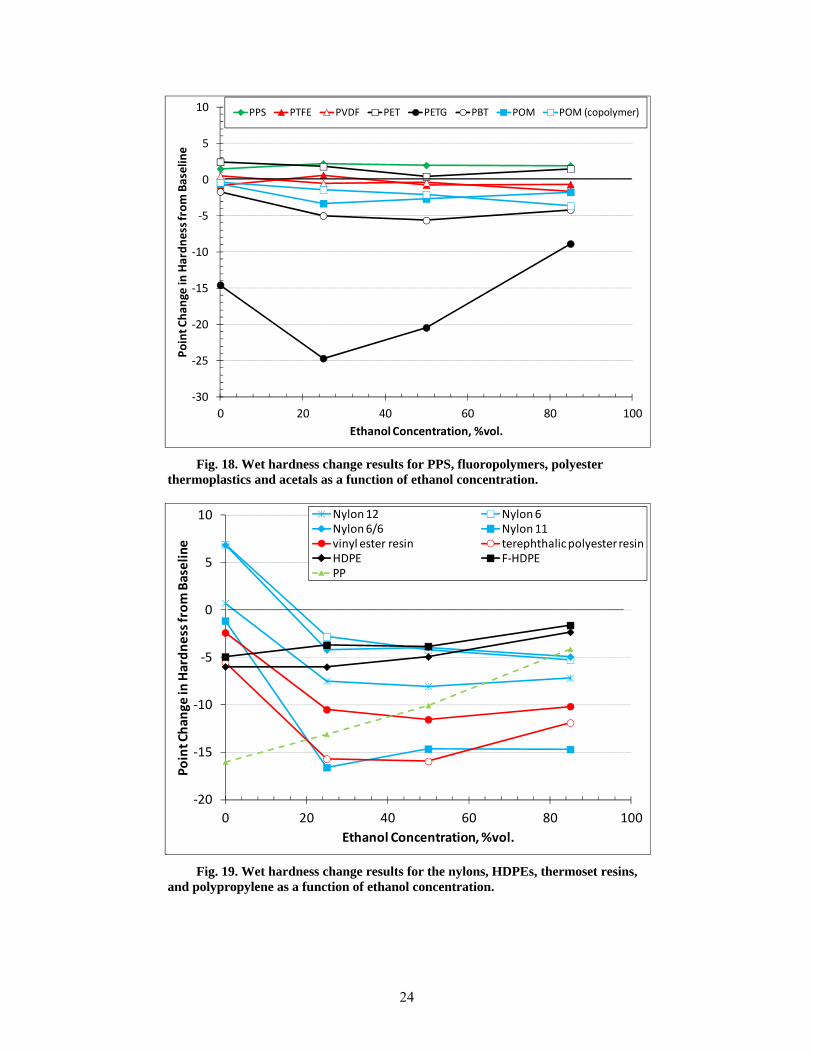
24
Fig. 18. Wet hardness change results for PPS, fluoropolymers, polyester thermoplastics and acetals as a function of ethanol concentration.
Fig. 19. Wet hardness change results for the nylons, HDPEs, thermoset resins, and polypropylene as a function of ethanol concentration.
‐30
‐25
‐20
‐15
‐10
‐5
0
5
10
0 20 40 60 80 100
Point C
han
ge in
Hardness from Baseline
Ethanol Concentration, %vol.
PPS PTFE PVDF PET PETG PBT POM POM (copolymer)
‐20
‐15
‐10
‐5
0
5
10
0 20 40 60 80 100
Point Chan
ge in Hardness from Baseline
Ethanol Concentration, %vol.
Nylon 12 Nylon 6Nylon 6/6 Nylon 11vinyl ester resin terephthalic polyester resinHDPE F‐HDPEPP
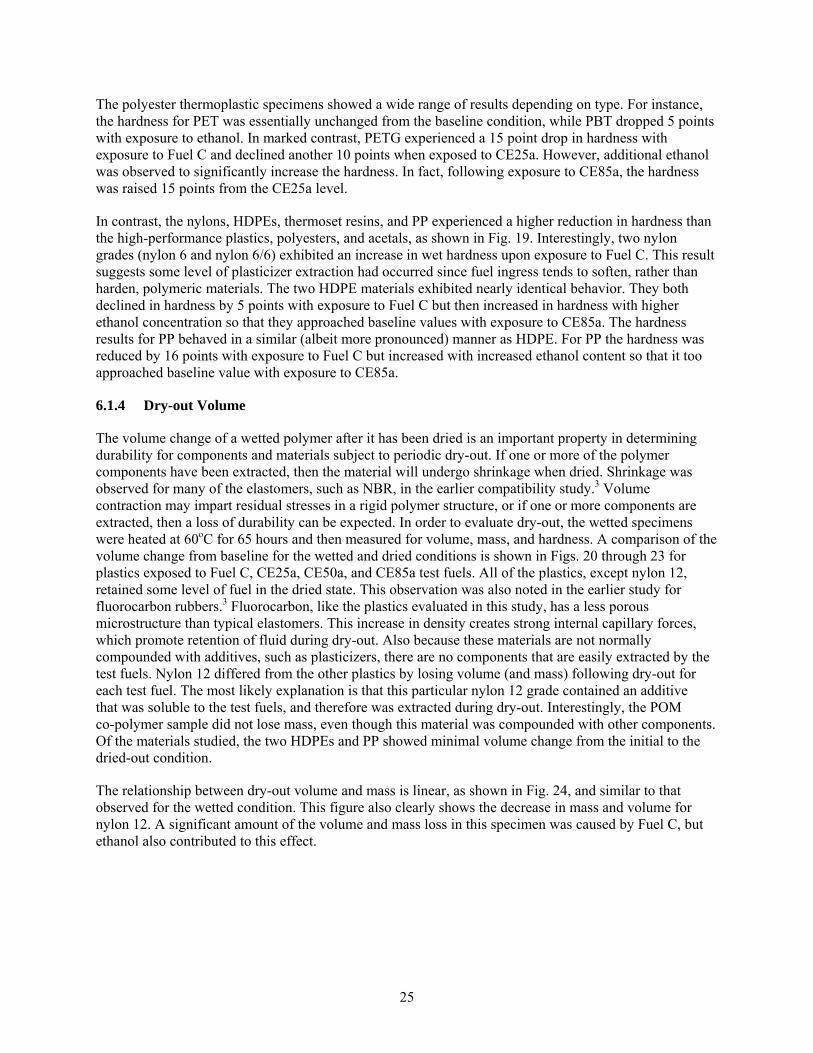
25
The polyester thermoplastic specimens showed a wide range of results depending on type. For instance, the hardness for PET was essentially unchanged from the baseline condition, while PBT dropped 5 points with exposure to ethanol. In marked contrast, PETG experienced a 15 point drop in hardness with exposure to Fuel C and declined another 10 points when exposed to CE25a. However, additional ethanol was observed to significantly increase the hardness. In fact, following exposure to CE85a, the hardness was raised 15 points from the CE25a level.
In contrast, the nylons, HDPEs, thermoset resins, and PP experienced a higher reduction in hardness than the high-performance plastics, polyesters, and acetals, as shown in Fig. 19. Interestingly, two nylon grades (nylon 6 and nylon 6/6) exhibited an increase in wet hardness upon exposure to Fuel C. This result suggests some level of plasticizer extraction had occurred since fuel ingress tends to soften, rather than harden, polymeric materials. The two HDPE materials exhibited nearly identical behavior. They both declined in hardness by 5 points with exposure to Fuel C but then increased in hardness with higher ethanol concentration so that they approached baseline values with exposure to CE85a. The hardness results for PP behaved in a similar (albeit more pronounced) manner as HDPE. For PP the hardness was reduced by 16 points with exposure to Fuel C but increased with increased ethanol content so that it too approached baseline value with exposure to CE85a.
6.1.4 Dry-out Volume
The volume change of a wetted polymer after it has been dried is an important property in determining durability for components and materials subject to periodic dry-out. If one or more of the polymer components have been extracted, then the material will undergo shrinkage when dried. Shrinkage was observed for many of the elastomers, such as NBR, in the earlier compatibility study.3 Volume contraction may impart residual stresses in a rigid polymer structure, or if one or more components are extracted, then a loss of durability can be expected. In order to evaluate dry-out, the wetted specimens were heated at 60oC for 65 hours and then measured for volume, mass, and hardness. A comparison of the volume change from baseline for the wetted and dried conditions is shown in Figs. 20 through 23 for plastics exposed to Fuel C, CE25a, CE50a, and CE85a test fuels. All of the plastics, except nylon 12, retained some level of fuel in the dried state. This observation was also noted in the earlier study for fluorocarbon rubbers.3 Fluorocarbon, like the plastics evaluated in this study, has a less porous microstructure than typical elastomers. This increase in density creates strong internal capillary forces, which promote retention of fluid during dry-out. Also because these materials are not normally compounded with additives, such as plasticizers, there are no components that are easily extracted by the test fuels. Nylon 12 differed from the other plastics by losing volume (and mass) following dry-out for each test fuel. The most likely explanation is that this particular nylon 12 grade contained an additive that was soluble to the test fuels, and therefore was extracted during dry-out. Interestingly, the POM co-polymer sample did not lose mass, even though this material was compounded with other components. Of the materials studied, the two HDPEs and PP showed minimal volume change from the initial to the dried-out condition.
The relationship between dry-out volume and mass is linear, as shown in Fig. 24, and similar to that observed for the wetted condition. This figure also clearly shows the decrease in mass and volume for nylon 12. A significant amount of the volume and mass loss in this specimen was caused by Fuel C, but ethanol also contributed to this effect.
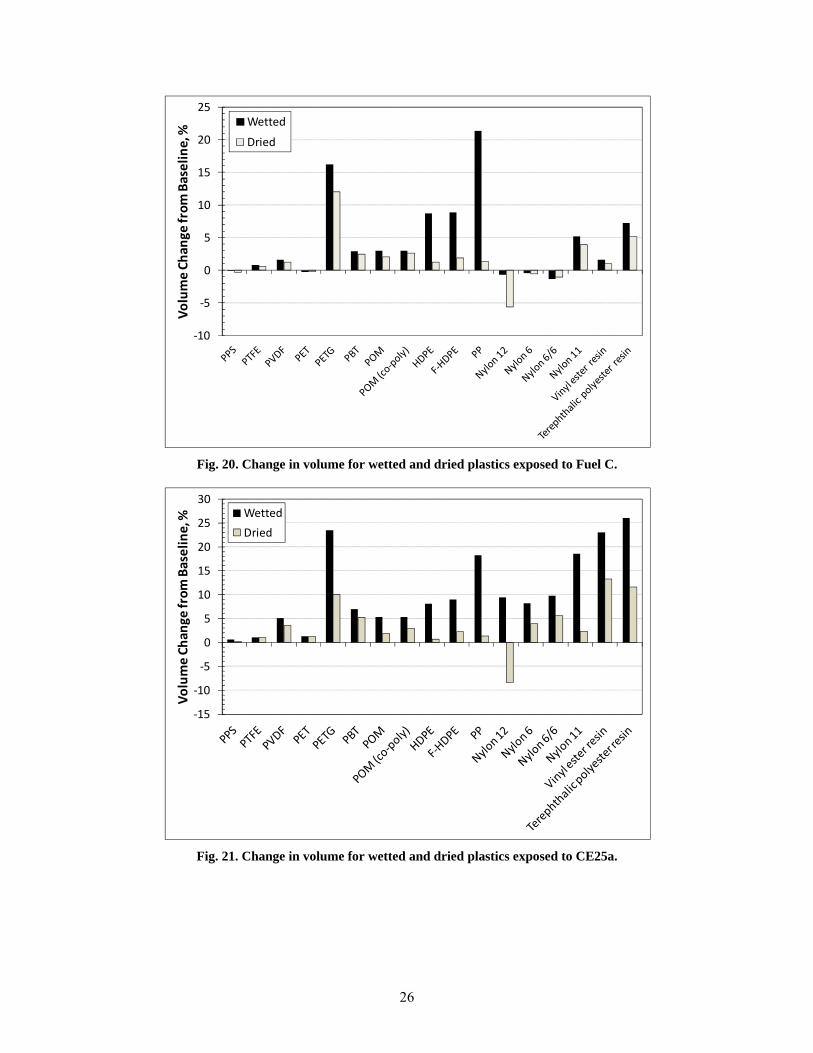
26
Fig. 20. Change in volume for wetted and dried plastics exposed to Fuel C.
Fig. 21. Change in volume for wetted and dried plastics exposed to CE25a.
‐10
‐5
0
5
10
15
20
25
Volume Chan
ge from Baseline, %
Wetted
Dried
‐15
‐10
‐5
0
5
10
15
20
25
30
Volume Chan
ge from Baseline, % Wetted
Dried
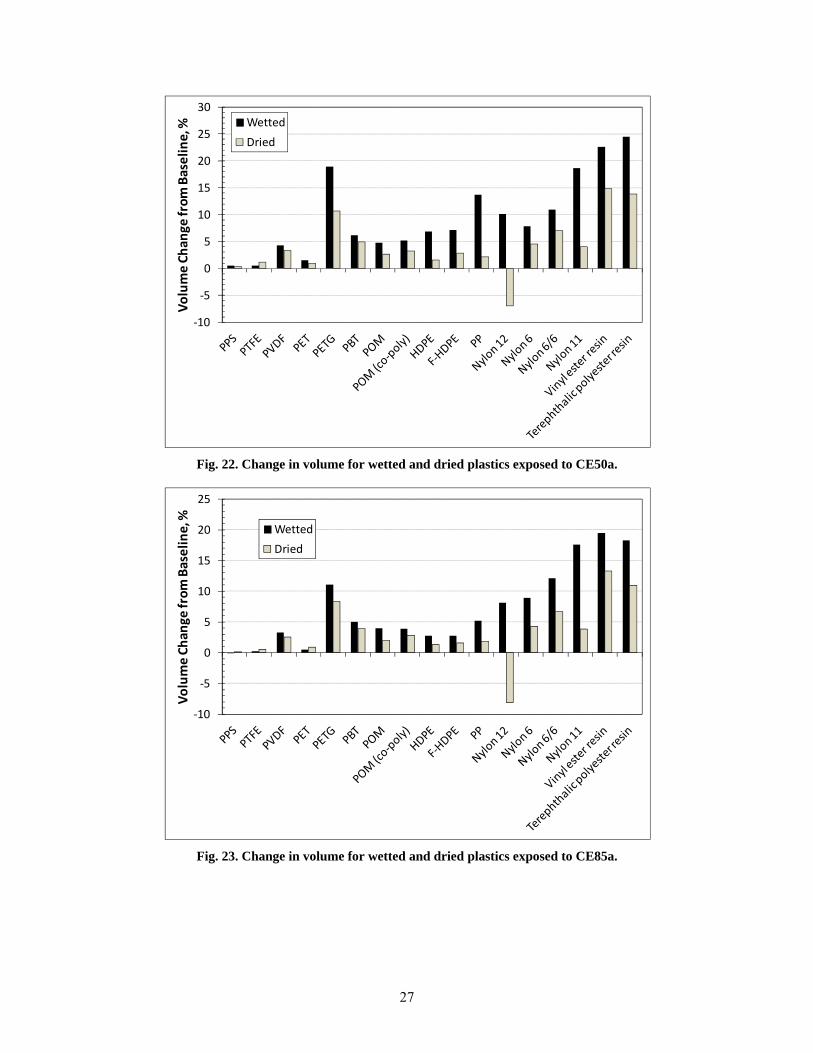
27
Fig. 22. Change in volume for wetted and dried plastics exposed to CE50a.
Fig. 23. Change in volume for wetted and dried plastics exposed to CE85a.
‐10
‐5
0
5
10
15
20
25
30
Volume Chan
ge from Baseline, % Wetted
Dried
‐10
‐5
0
5
10
15
20
25
Volume Chan
ge from Baseline, %
Wetted
Dried
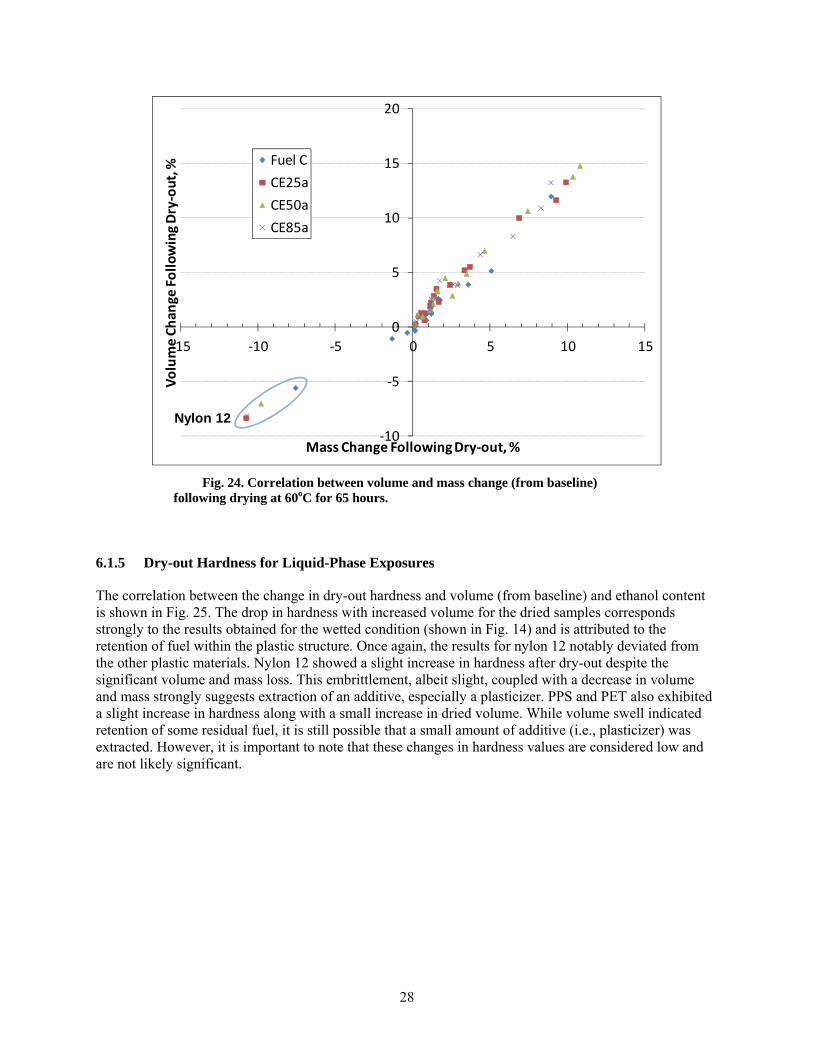
28
Fig. 24. Correlation between volume and mass change (from baseline) following drying at 60oC for 65 hours.
6.1.5 Dry-out Hardness for Liquid-Phase Exposures
The correlation between the change in dry-out hardness and volume (from baseline) and ethanol content is shown in Fig. 25. The drop in hardness with increased volume for the dried samples corresponds strongly to the results obtained for the wetted condition (shown in Fig. 14) and is attributed to the retention of fuel within the plastic structure. Once again, the results for nylon 12 notably deviated from the other plastic materials. Nylon 12 showed a slight increase in hardness after dry-out despite the significant volume and mass loss. This embrittlement, albeit slight, coupled with a decrease in volume and mass strongly suggests extraction of an additive, especially a plasticizer. PPS and PET also exhibited a slight increase in hardness along with a small increase in dried volume. While volume swell indicated retention of some residual fuel, it is still possible that a small amount of additive (i.e., plasticizer) was extracted. However, it is important to note that these changes in hardness values are considered low and are not likely significant.
‐10
‐5
0
5
10
15
20
‐15 ‐10 ‐5 0 5 10 15
Volume Chan
ge Following Dry‐out, %
Mass Change Following Dry‐out, %
Fuel C
CE25a
CE50a
CE85a
Nylon 12
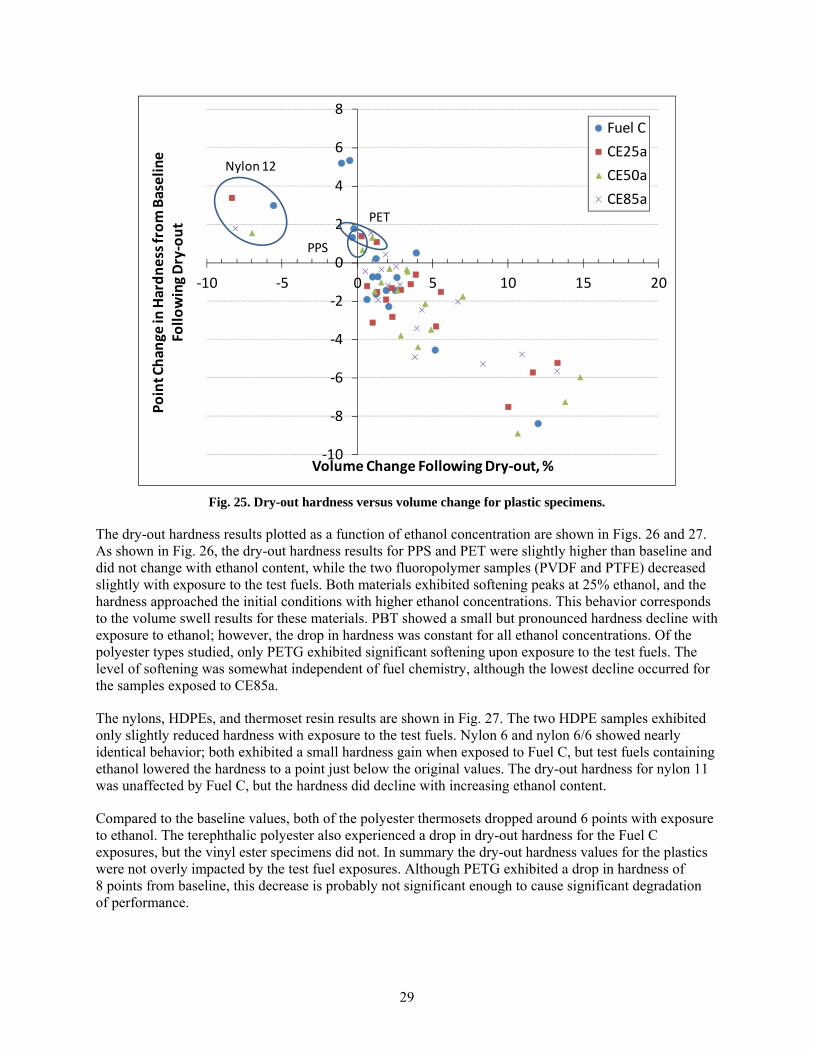
29
Fig. 25. Dry-out hardness versus volume change for plastic specimens.
The dry-out hardness results plotted as a function of ethanol concentration are shown in Figs. 26 and 27. As shown in Fig. 26, the dry-out hardness results for PPS and PET were slightly higher than baseline and did not change with ethanol content, while the two fluoropolymer samples (PVDF and PTFE) decreased slightly with exposure to the test fuels. Both materials exhibited softening peaks at 25% ethanol, and the hardness approached the initial conditions with higher ethanol concentrations. This behavior corresponds to the volume swell results for these materials. PBT showed a small but pronounced hardness decline with exposure to ethanol; however, the drop in hardness was constant for all ethanol concentrations. Of the polyester types studied, only PETG exhibited significant softening upon exposure to the test fuels. The level of softening was somewhat independent of fuel chemistry, although the lowest decline occurred for the samples exposed to CE85a.
The nylons, HDPEs, and thermoset resin results are shown in Fig. 27. The two HDPE samples exhibited only slightly reduced hardness with exposure to the test fuels. Nylon 6 and nylon 6/6 showed nearly identical behavior; both exhibited a small hardness gain when exposed to Fuel C, but test fuels containing ethanol lowered the hardness to a point just below the original values. The dry-out hardness for nylon 11 was unaffected by Fuel C, but the hardness did decline with increasing ethanol content.
Compared to the baseline values, both of the polyester thermosets dropped around 6 points with exposure to ethanol. The terephthalic polyester also experienced a drop in dry-out hardness for the Fuel C exposures, but the vinyl ester specimens did not. In summary the dry-out hardness values for the plastics were not overly impacted by the test fuel exposures. Although PETG exhibited a drop in hardness of 8 points from baseline, this decrease is probably not significant enough to cause significant degradation of performance.
‐10
‐8
‐6
‐4
‐2
0
2
4
6
8
‐10 ‐5 0 5 10 15 20
Point Chan
ge in Hardness from Baseline
Following Dry‐out
Volume Change Following Dry‐out, %
Fuel C
CE25a
CE50a
CE85a
Nylon12
PPS
PET
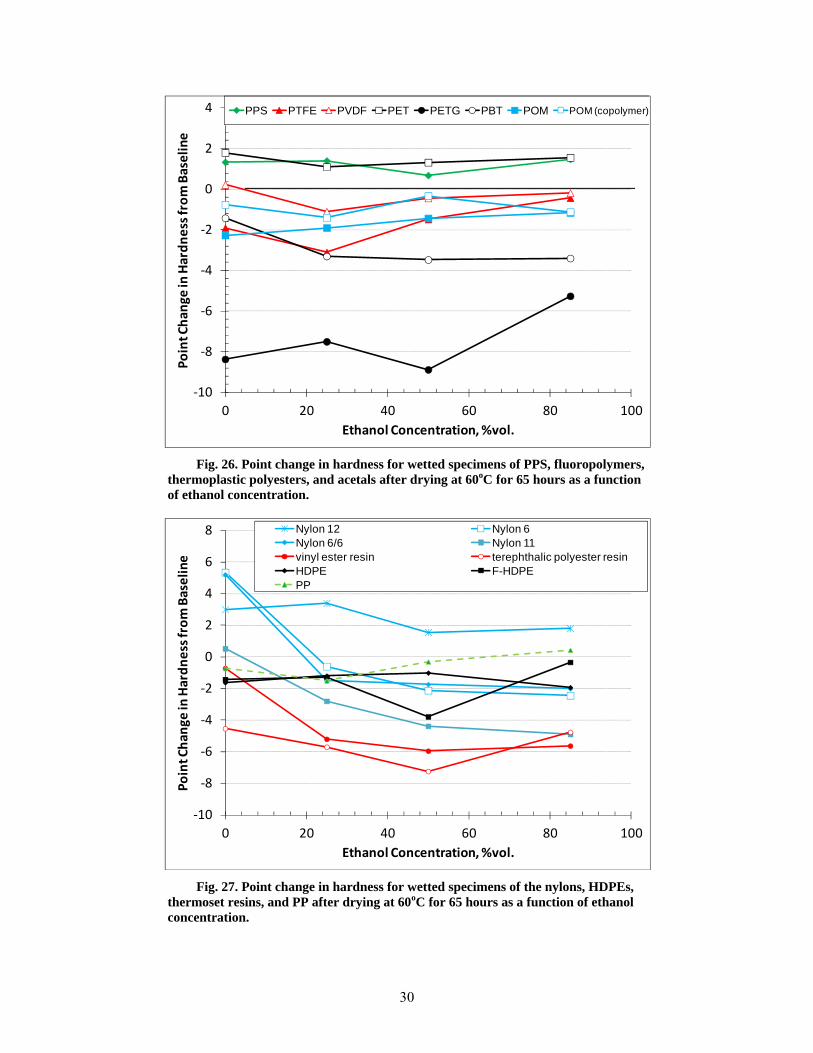
30
Fig. 26. Point change in hardness for wetted specimens of PPS, fluoropolymers, thermoplastic polyesters, and acetals after drying at 60oC for 65 hours as a function of ethanol concentration.
Fig. 27. Point change in hardness for wetted specimens of the nylons, HDPEs, thermoset resins, and PP after drying at 60oC for 65 hours as a function of ethanol concentration.
‐10
‐8
‐6
‐4
‐2
0
2
4
0 20 40 60 80 100
Point Chan
ge in Hardness from Baseline
Ethanol Concentration, %vol.
PPS PTFE PVDF PET PETG PBT POM POM (copolymer)
‐10
‐8
‐6
‐4
‐2
0
2
4
6
8
0 20 40 60 80 100
Point Chan
ge in Hardness from Baseline
Ethanol Concentration, %vol.
Nylon 12 Nylon 6Nylon 6/6 Nylon 11vinyl ester resin terephthalic polyester resinHDPE F-HDPEPP
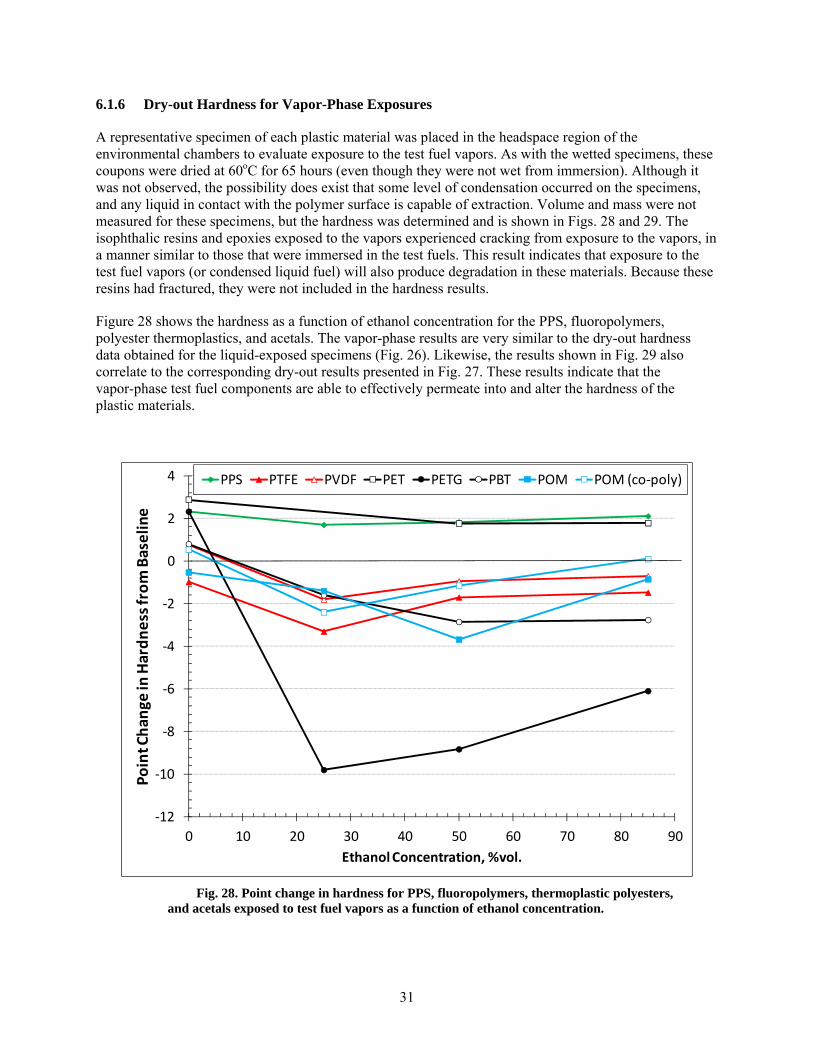
31
6.1.6 Dry-out Hardness for Vapor-Phase Exposures
A representative specimen of each plastic material was placed in the headspace region of the environmental chambers to evaluate exposure to the test fuel vapors. As with the wetted specimens, these coupons were dried at 60oC for 65 hours (even though they were not wet from immersion). Although it was not observed, the possibility does exist that some level of condensation occurred on the specimens, and any liquid in contact with the polymer surface is capable of extraction. Volume and mass were not measured for these specimens, but the hardness was determined and is shown in Figs. 28 and 29. The isophthalic resins and epoxies exposed to the vapors experienced cracking from exposure to the vapors, in a manner similar to those that were immersed in the test fuels. This result indicates that exposure to the test fuel vapors (or condensed liquid fuel) will also produce degradation in these materials. Because these resins had fractured, they were not included in the hardness results.
Figure 28 shows the hardness as a function of ethanol concentration for the PPS, fluoropolymers, polyester thermoplastics, and acetals. The vapor-phase results are very similar to the dry-out hardness data obtained for the liquid-exposed specimens (Fig. 26). Likewise, the results shown in Fig. 29 also correlate to the corresponding dry-out results presented in Fig. 27. These results indicate that the vapor-phase test fuel components are able to effectively permeate into and alter the hardness of the plastic materials.
Fig. 28. Point change in hardness for PPS, fluoropolymers, thermoplastic polyesters, and acetals exposed to test fuel vapors as a function of ethanol concentration.
‐12
‐10
‐8
‐6
‐4
‐2
0
2
4
0 10 20 30 40 50 60 70 80 90
Point Chan
ge in Hardness from Baseline
Ethanol Concentration, %vol.
PPS PTFE PVDF PET PETG PBT POM POM (co‐poly)
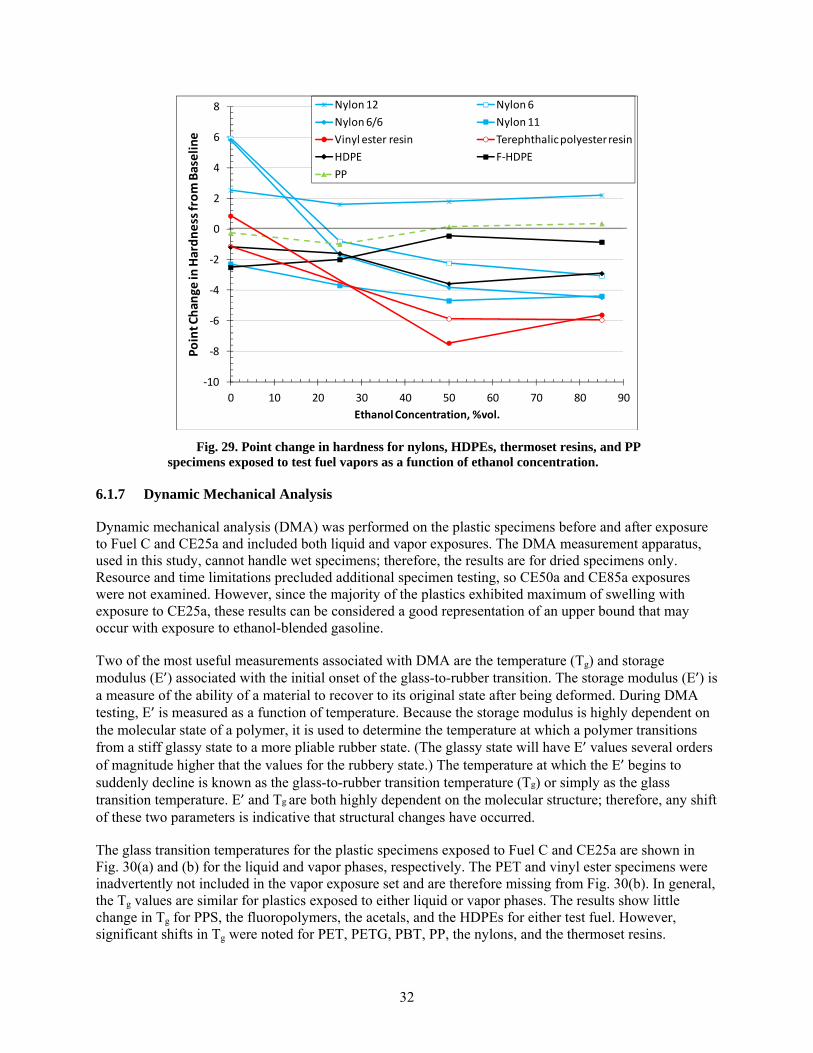
32
Fig. 29. Point change in hardness for nylons, HDPEs, thermoset resins, and PP specimens exposed to test fuel vapors as a function of ethanol concentration.
6.1.7 Dynamic Mechanical Analysis
Dynamic mechanical analysis (DMA) was performed on the plastic specimens before and after exposure to Fuel C and CE25a and included both liquid and vapor exposures. The DMA measurement apparatus, used in this study, cannot handle wet specimens; therefore, the results are for dried specimens only. Resource and time limitations precluded additional specimen testing, so CE50a and CE85a exposures were not examined. However, since the majority of the plastics exhibited maximum of swelling with exposure to CE25a, these results can be considered a good representation of an upper bound that may occur with exposure to ethanol-blended gasoline.
Two of the most useful measurements associated with DMA are the temperature (Tg) and storage modulus (E’) associated with the initial onset of the glass-to-rubber transition. The storage modulus (E’) is a measure of the ability of a material to recover to its original state after being deformed. During DMA testing, E’ is measured as a function of temperature. Because the storage modulus is highly dependent on the molecular state of a polymer, it is used to determine the temperature at which a polymer transitions from a stiff glassy state to a more pliable rubber state. (The glassy state will have E’ values several orders of magnitude higher that the values for the rubbery state.) The temperature at which the E’ begins to suddenly decline is known as the glass-to-rubber transition temperature (Tg) or simply as the glass transition temperature. E’ and Tg are both highly dependent on the molecular structure; therefore, any shift of these two parameters is indicative that structural changes have occurred.
The glass transition temperatures for the plastic specimens exposed to Fuel C and CE25a are shown in Fig. 30(a) and (b) for the liquid and vapor phases, respectively. The PET and vinyl ester specimens were inadvertently not included in the vapor exposure set and are therefore missing from Fig. 30(b). In general, the Tg values are similar for plastics exposed to either liquid or vapor phases. The results show little change in Tg for PPS, the fluoropolymers, the acetals, and the HDPEs for either test fuel. However, significant shifts in Tg were noted for PET, PETG, PBT, PP, the nylons, and the thermoset resins.
‐10
‐8
‐6
‐4
‐2
0
2
4
6
8
0 10 20 30 40 50 60 70 80 90
Point Chan
ge in Hardness from Baseline
Ethanol Concentration, %vol.
Nylon 12 Nylon 6
Nylon 6/6 Nylon 11
Vinyl ester resin Terephthalic polyester resin
HDPE F‐HDPE
PP
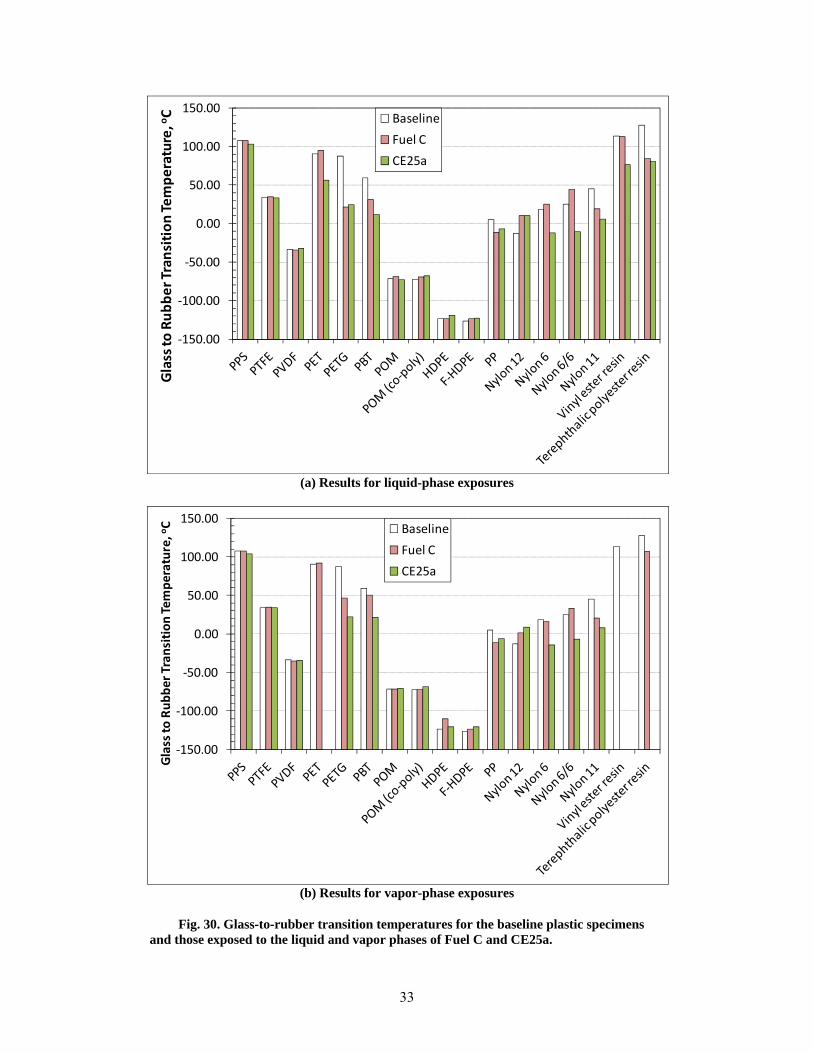
33
(a) Results for liquid-phase exposures
(b) Results for vapor-phase exposures
Fig. 30. Glass-to-rubber transition temperatures for the baseline plastic specimens and those exposed to the liquid and vapor phases of Fuel C and CE25a.
‐150.00
‐100.00
‐50.00
0.00
50.00
100.00
150.00
Glass to
Rubber Tran
sition Temperature, oC Baseline
Fuel C
CE25a
‐150.00
‐100.00
‐50.00
0.00
50.00
100.00
150.00
Glass to
Rubber Transition Tem
perature, oC Baseline
Fuel C
CE25a
34
Although Tg was unaffected by Fuel C for PET, a 40 degree drop was observed with exposure to CE25a. This shift in Tg for PET was unexpected since this material exhibited negligible volume and hardness change following exposure to the test fuels, including CE25a. However, PET did show a slight increase in hardness with the test fuels containing ethanol, and it seems likely that some level of structural change (possibly extraction of a plasticizer compound) had occurred. For PETG, the onset of the glassy-to-rubber transition was lowered by over 60oC when exposed to either Fuel C or CE25a. This decrease in Tg is dramatic, indicating that substantial structural changes had occurred. In the unexposed state PETG will remain glassy at 30oC (or 85oF); however, following exposure to Fuel C or CE25a, this material will transition to a rubbery state, and thus exhibit markedly different physical properties under ambient conditions. Since PETG is actually a PET with an additional copolymer, it is likely that the copolymer is primarily responsible for this negative shift in Tg following exposure to Fuel C, since PET by itself was not affected by Fuel C. It is also interesting that this drop occurred in both Fuel C and CE25a. This fact suggests that Fuel C is primarily responsible for the reduction in Tg for the PETG specimen. PBT also experienced a substantial negative shift in Tg with Fuel C exposure; however, the added aggressive ethanol further lowered the Tg by another 12 degrees. Polypropylene experienced a modest, though significant, negative shift between 12 and 17ºC with exposure to the test fuels.
The nylons exhibited a range of shifts and shift direction depending on the type. Fuel C and CE25a both increased Tg by 20 degrees for the nylon 12 samples, meaning that nylon 12 will remain in a glassy (brittle) state at higher temperatures than the unexposed specimens. This result further supports the earlier data that indicated a loss of plasticizer following exposure to the test fuels for nylon 12. Nylon 6 and nylon 6/6 exhibited similar behavior. Both materials showed a significant increase in Tg with exposure to Fuel C (7oC for nylon 6 and 19°C for nylon 6/6), while exposure to ethanol effectively reduced Tg by 30 degrees for both samples. These differences indicate that Fuel C and ethanol shift Tg in different directions for nylon 6 and nylon 6/6. For nylon 11, Tg was lowered 25 degrees with exposure to Fuel C and declined another 14 degrees with 25% aggressive ethanol. It is important to note that the nylons all exhibited Tgs that are within the typical range of temperatures for ambient conditions. Therefore, nylon may not be suitable for use with gasoline in some applications.
Tg for the vinyl ester resin was not significantly affected by Fuel C; however, exposure to 25% aggressive ethanol lowered the Tg by 37 degrees. In contrast, Tg for the terephthalic polyester resin dropped between 42 and 46°C with exposure to either Fuel C or CE25a, an indication that terephthalic polyester is affected more by Fuel C than ethanol.
The storage modulus associated with the onset of the glass-to-rubber transition is another property that can be used to assess structural change in polymers. As with the shift in Tg, the change of Eꞌ can be indicative of structural changes that may have occurred from fuel exposure. The percent change in Eꞌ (from baseline) is shown in Fig. 31 (a) and (b) for each plastic material exposed to liquid and vapor phases, respectively. For most plastics, the results from the vapor exposures trend with the liquid exposures, but that is not the case for PTFE, PVDF, and POM. The results vary considerably for each plastic type. Those materials that exhibited 10% or lower deviation from baseline for both test fuels were PPS, PVDF, PET, PETG, PBT, and the POM co-polymer.
Because residual fuel was retained within the plastic structures following dry-out, the storage modulus values would be expected to be lowered since the added fuel would effectively offer no resistance to stress. In fact, as shown in Fig. 31, Eꞌ decreased for the majority of the plastic types. However, significant increases in Eꞌ were noted for POM, nylon 6, and nylon 6/6 specimens exposed to ethanol and for PP, nylon 6, and terephthalic polyester resin exposed to Fuel C. The HDPEs also showed sensitivity to the presence of ethanol. Fuel C resulted in a small drop in Eꞌ, but the addition of 25% aggressive ethanol caused reductions of 12% for F-HDPE and 23% for HDPE.
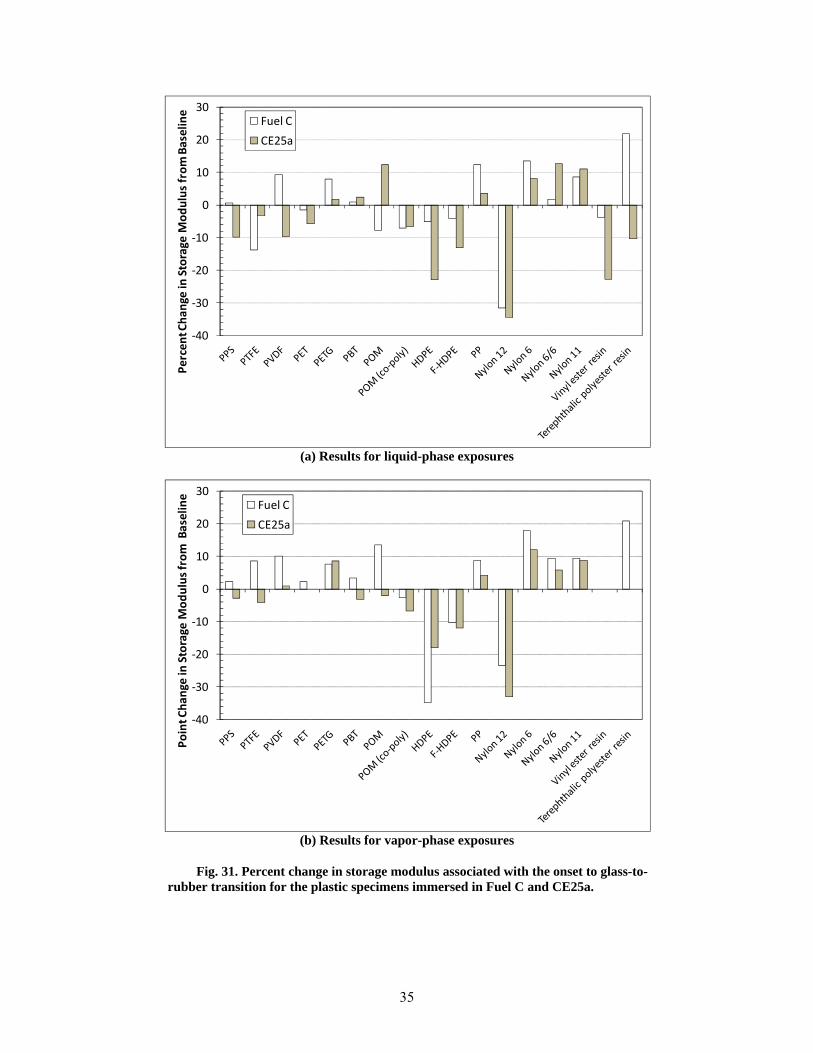
35
(a) Results for liquid-phase exposures
(b) Results for vapor-phase exposures
Fig. 31. Percent change in storage modulus associated with the onset to glass-to-rubber transition for the plastic specimens immersed in Fuel C and CE25a.
‐40
‐30
‐20
‐10
0
10
20
30
Percent Change in
Storage M
odulus from Baseline
Fuel C
CE25a
‐40
‐30
‐20
‐10
0
10
20
30
Point C
han
ge in
Storage M
odulus from Baseline
Fuel C
CE25a
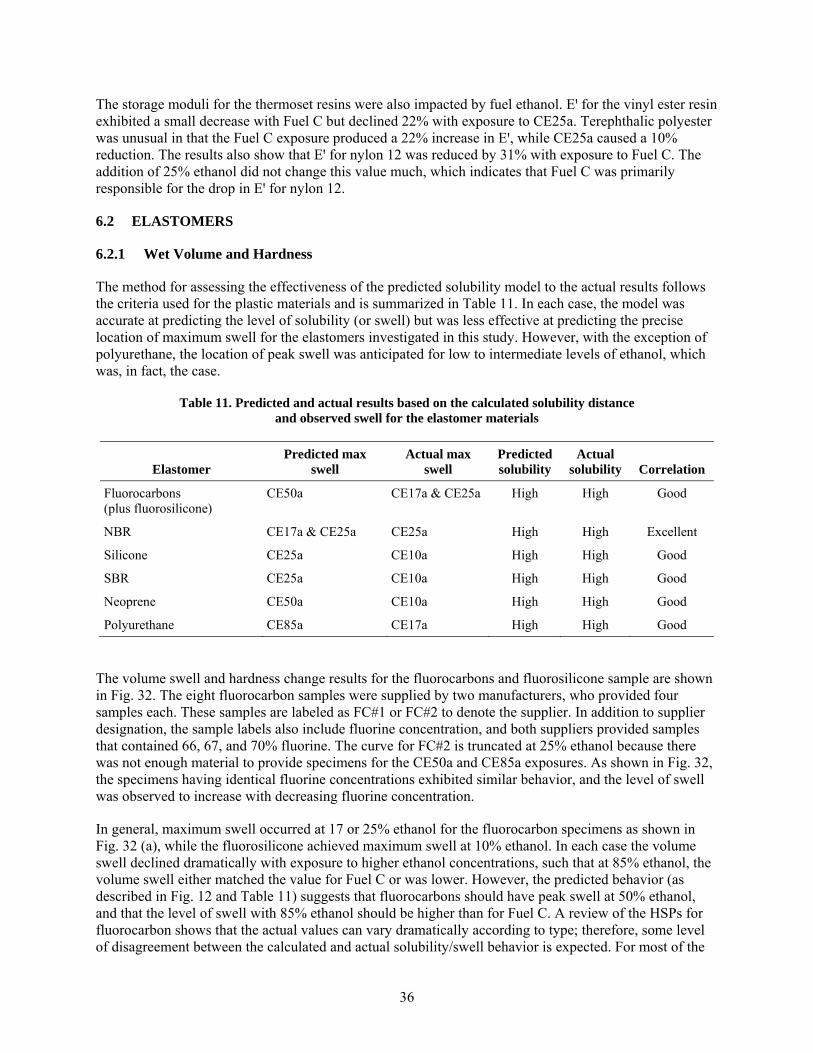
36
The storage moduli for the thermoset resins were also impacted by fuel ethanol. Eꞌ for the vinyl ester resin exhibited a small decrease with Fuel C but declined 22% with exposure to CE25a. Terephthalic polyester was unusual in that the Fuel C exposure produced a 22% increase in Eꞌ, while CE25a caused a 10% reduction. The results also show that Eꞌ for nylon 12 was reduced by 31% with exposure to Fuel C. The addition of 25% ethanol did not change this value much, which indicates that Fuel C was primarily responsible for the drop in Eꞌ for nylon 12.
6.2 ELASTOMERS
6.2.1 Wet Volume and Hardness
The method for assessing the effectiveness of the predicted solubility model to the actual results follows the criteria used for the plastic materials and is summarized in Table 11. In each case, the model was accurate at predicting the level of solubility (or swell) but was less effective at predicting the precise location of maximum swell for the elastomers investigated in this study. However, with the exception of polyurethane, the location of peak swell was anticipated for low to intermediate levels of ethanol, which was, in fact, the case.
Table 11. Predicted and actual results based on the calculated solubility distance and observed swell for the elastomer materials
Elastomer Predicted max
swell Actual max
swell Predicted solubility
Actual solubility Correlation
Fluorocarbons (plus fluorosilicone)
CE50a CE17a & CE25a High High Good
NBR CE17a & CE25a CE25a High High Excellent
Silicone CE25a CE10a High High Good
SBR CE25a CE10a High High Good
Neoprene CE50a CE10a High High Good
Polyurethane CE85a CE17a High High Good
The volume swell and hardness change results for the fluorocarbons and fluorosilicone sample are shown in Fig. 32. The eight fluorocarbon samples were supplied by two manufacturers, who provided four samples each. These samples are labeled as FC#1 or FC#2 to denote the supplier. In addition to supplier designation, the sample labels also include fluorine concentration, and both suppliers provided samples that contained 66, 67, and 70% fluorine. The curve for FC#2 is truncated at 25% ethanol because there was not enough material to provide specimens for the CE50a and CE85a exposures. As shown in Fig. 32, the specimens having identical fluorine concentrations exhibited similar behavior, and the level of swell was observed to increase with decreasing fluorine concentration.
In general, maximum swell occurred at 17 or 25% ethanol for the fluorocarbon specimens as shown in Fig. 32 (a), while the fluorosilicone achieved maximum swell at 10% ethanol. In each case the volume swell declined dramatically with exposure to higher ethanol concentrations, such that at 85% ethanol, the volume swell either matched the value for Fuel C or was lower. However, the predicted behavior (as described in Fig. 12 and Table 11) suggests that fluorocarbons should have peak swell at 50% ethanol, and that the level of swell with 85% ethanol should be higher than for Fuel C. A review of the HSPs for fluorocarbon shows that the actual values can vary dramatically according to type; therefore, some level of disagreement between the calculated and actual solubility/swell behavior is expected. For most of the
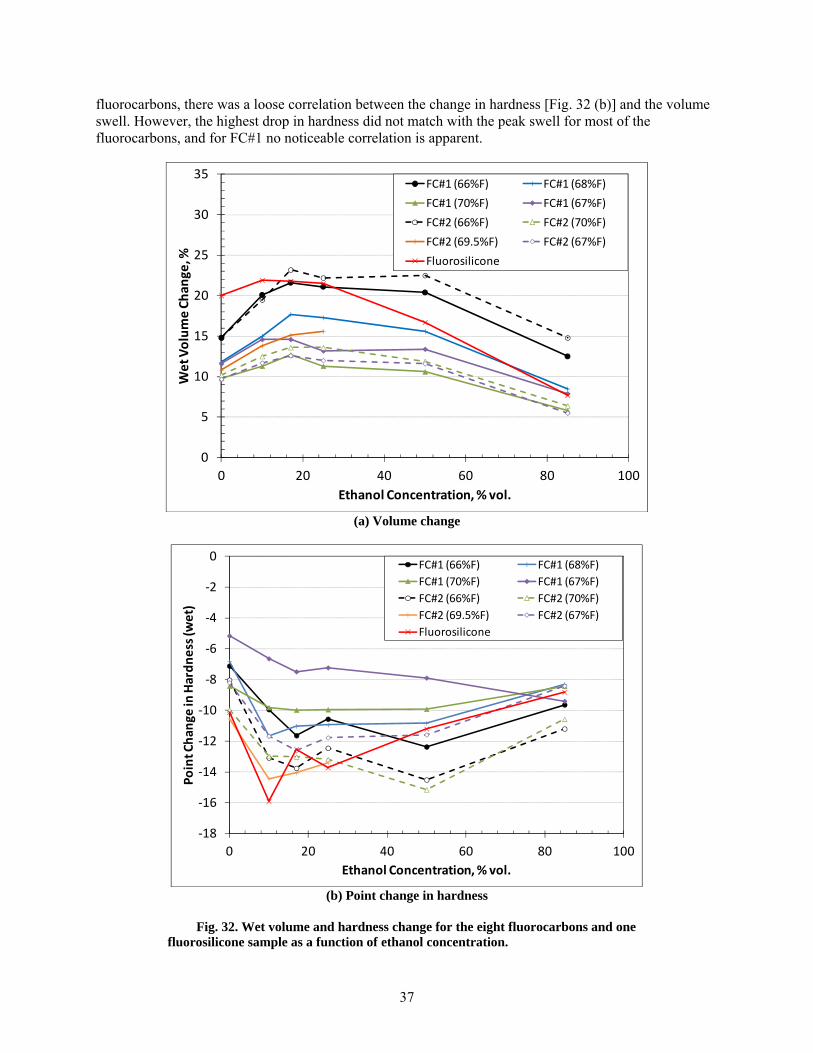
37
fluorocarbons, there was a loose correlation between the change in hardness [Fig. 32 (b)] and the volume swell. However, the highest drop in hardness did not match with the peak swell for most of the fluorocarbons, and for FC#1 no noticeable correlation is apparent.
(a) Volume change
(b) Point change in hardness
Fig. 32. Wet volume and hardness change for the eight fluorocarbons and one fluorosilicone sample as a function of ethanol concentration.
0
5
10
15
20
25
30
35
0 20 40 60 80 100
Wet V
olume Chan
ge, %
Ethanol Concentration, % vol.
FC#1 (66%F) FC#1 (68%F)
FC#1 (70%F) FC#1 (67%F)
FC#2 (66%F) FC#2 (70%F)
FC#2 (69.5%F) FC#2 (67%F)
Fluorosilicone
‐18
‐16
‐14
‐12
‐10
‐8
‐6
‐4
‐2
0
0 20 40 60 80 100
Point Chan
ge in Hardness (w
et)
Ethanol Concentration, % vol.
FC#1 (66%F) FC#1 (68%F)
FC#1 (70%F) FC#1 (67%F)
FC#2 (66%F) FC#2 (70%F)
FC#2 (69.5%F) FC#2 (67%F)
Fluorosilicone
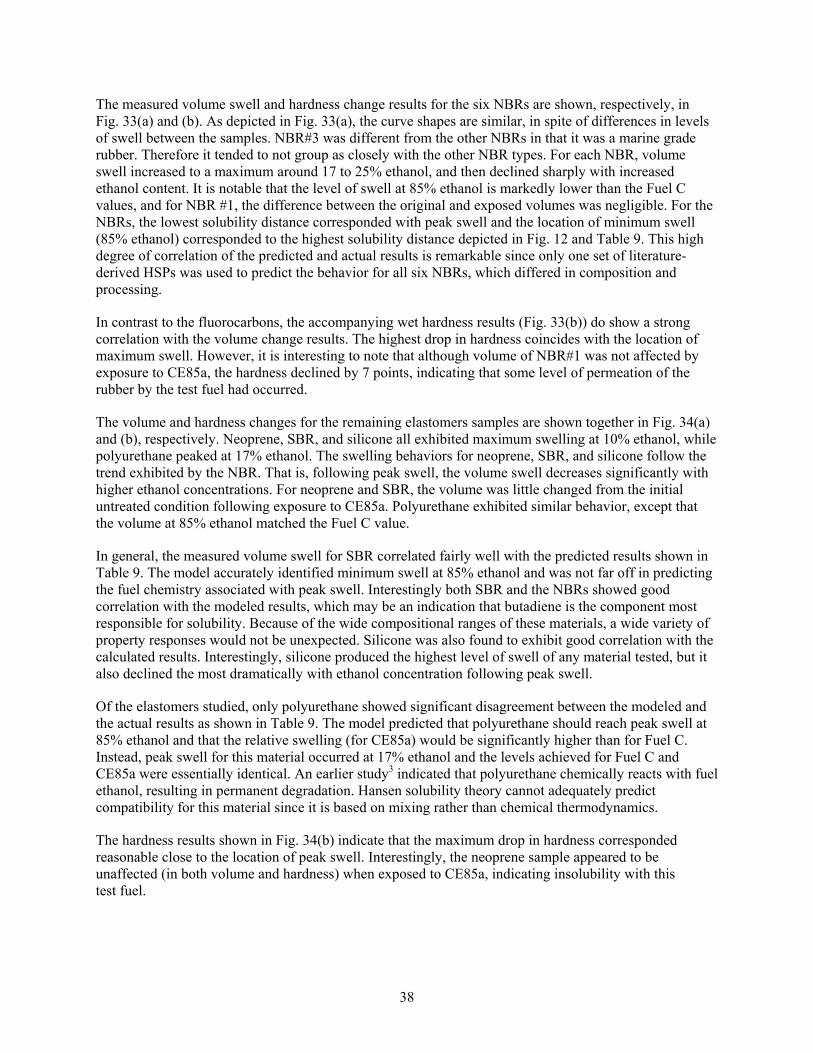
38
The measured volume swell and hardness change results for the six NBRs are shown, respectively, in Fig. 33(a) and (b). As depicted in Fig. 33(a), the curve shapes are similar, in spite of differences in levels of swell between the samples. NBR#3 was different from the other NBRs in that it was a marine grade rubber. Therefore it tended to not group as closely with the other NBR types. For each NBR, volume swell increased to a maximum around 17 to 25% ethanol, and then declined sharply with increased ethanol content. It is notable that the level of swell at 85% ethanol is markedly lower than the Fuel C values, and for NBR #1, the difference between the original and exposed volumes was negligible. For the NBRs, the lowest solubility distance corresponded with peak swell and the location of minimum swell (85% ethanol) corresponded to the highest solubility distance depicted in Fig. 12 and Table 9. This high degree of correlation of the predicted and actual results is remarkable since only one set of literature-derived HSPs was used to predict the behavior for all six NBRs, which differed in composition and processing.
In contrast to the fluorocarbons, the accompanying wet hardness results (Fig. 33(b)) do show a strong correlation with the volume change results. The highest drop in hardness coincides with the location of maximum swell. However, it is interesting to note that although volume of NBR#1 was not affected by exposure to CE85a, the hardness declined by 7 points, indicating that some level of permeation of the rubber by the test fuel had occurred.
The volume and hardness changes for the remaining elastomers samples are shown together in Fig. 34(a) and (b), respectively. Neoprene, SBR, and silicone all exhibited maximum swelling at 10% ethanol, while polyurethane peaked at 17% ethanol. The swelling behaviors for neoprene, SBR, and silicone follow the trend exhibited by the NBR. That is, following peak swell, the volume swell decreases significantly with higher ethanol concentrations. For neoprene and SBR, the volume was little changed from the initial untreated condition following exposure to CE85a. Polyurethane exhibited similar behavior, except that the volume at 85% ethanol matched the Fuel C value.
In general, the measured volume swell for SBR correlated fairly well with the predicted results shown in Table 9. The model accurately identified minimum swell at 85% ethanol and was not far off in predicting the fuel chemistry associated with peak swell. Interestingly both SBR and the NBRs showed good correlation with the modeled results, which may be an indication that butadiene is the component most responsible for solubility. Because of the wide compositional ranges of these materials, a wide variety of property responses would not be unexpected. Silicone was also found to exhibit good correlation with the calculated results. Interestingly, silicone produced the highest level of swell of any material tested, but it also declined the most dramatically with ethanol concentration following peak swell.
Of the elastomers studied, only polyurethane showed significant disagreement between the modeled and the actual results as shown in Table 9. The model predicted that polyurethane should reach peak swell at 85% ethanol and that the relative swelling (for CE85a) would be significantly higher than for Fuel C. Instead, peak swell for this material occurred at 17% ethanol and the levels achieved for Fuel C and CE85a were essentially identical. An earlier study3 indicated that polyurethane chemically reacts with fuel ethanol, resulting in permanent degradation. Hansen solubility theory cannot adequately predict compatibility for this material since it is based on mixing rather than chemical thermodynamics.
The hardness results shown in Fig. 34(b) indicate that the maximum drop in hardness corresponded reasonable close to the location of peak swell. Interestingly, the neoprene sample appeared to be unaffected (in both volume and hardness) when exposed to CE85a, indicating insolubility with this test fuel.
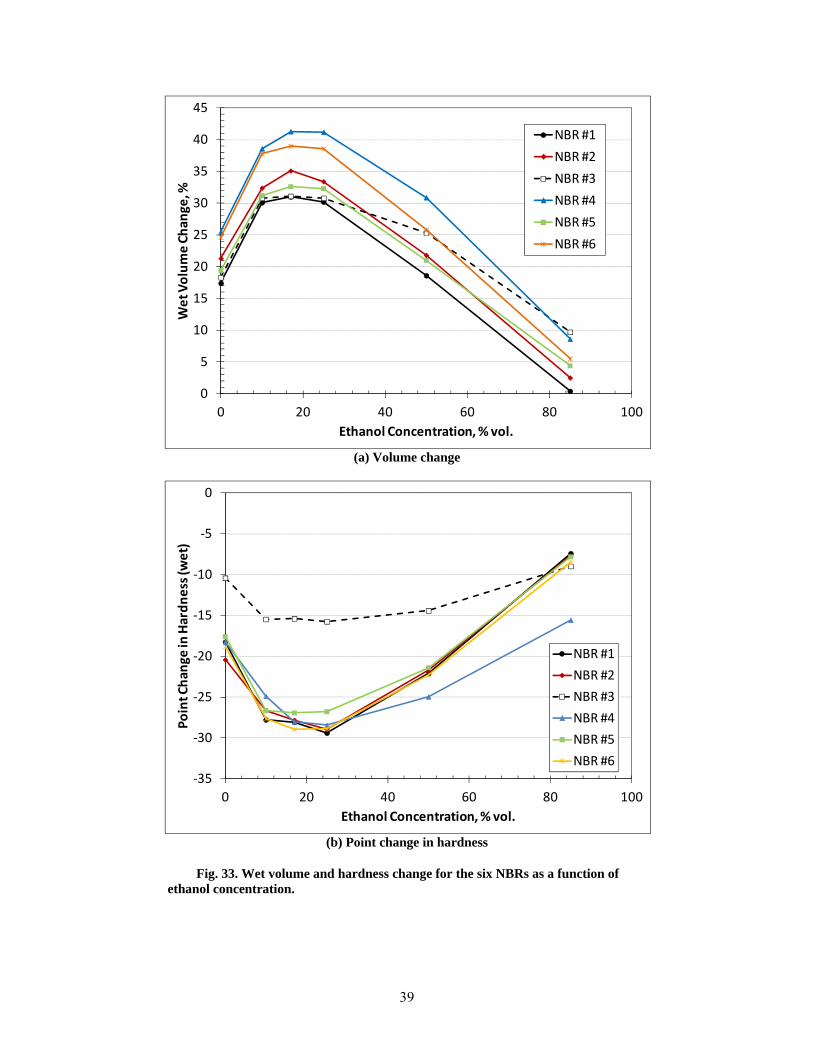
39
(a) Volume change
(b) Point change in hardness
Fig. 33. Wet volume and hardness change for the six NBRs as a function of ethanol concentration.
0
5
10
15
20
25
30
35
40
45
0 20 40 60 80 100
Wet V
olume Chan
ge, %
Ethanol Concentration, % vol.
NBR #1
NBR #2
NBR #3
NBR #4
NBR #5
NBR #6
‐35
‐30
‐25
‐20
‐15
‐10
‐5
0
0 20 40 60 80 100
Point Chan
ge in Hardness (w
et)
Ethanol Concentration, % vol.
NBR #1
NBR #2
NBR #3
NBR #4
NBR #5
NBR #6
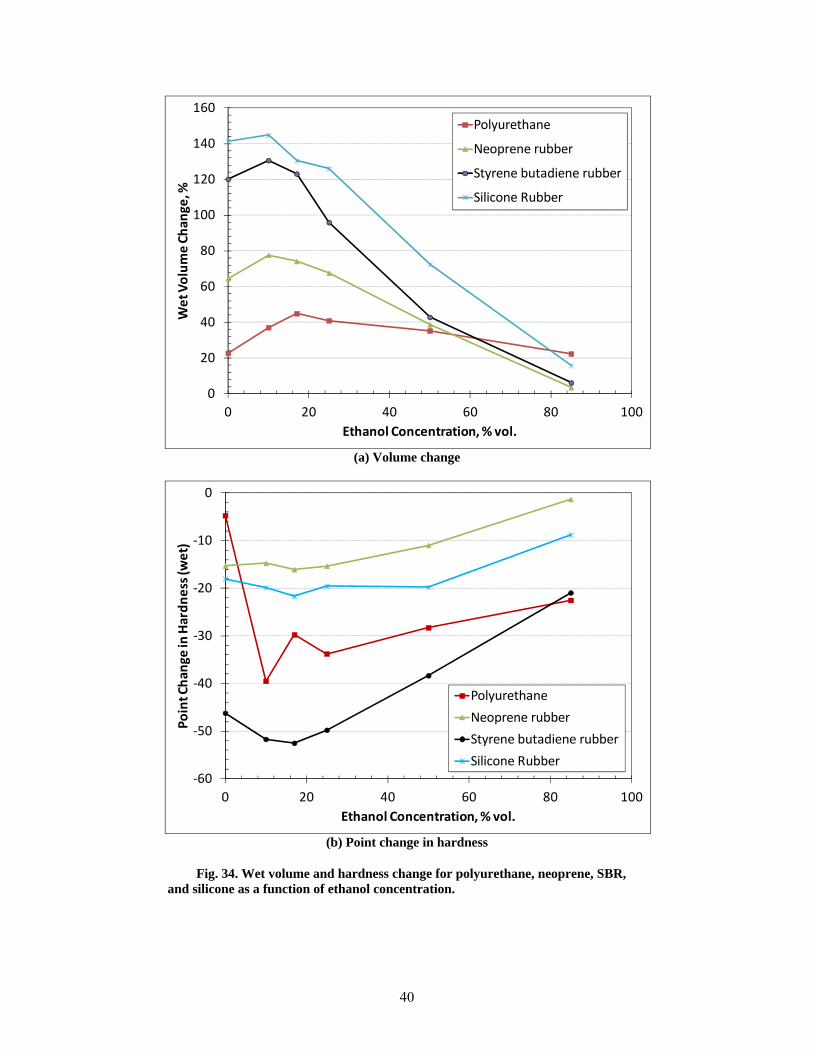
40
(a) Volume change
(b) Point change in hardness
Fig. 34. Wet volume and hardness change for polyurethane, neoprene, SBR, and silicone as a function of ethanol concentration.
0
20
40
60
80
100
120
140
160
0 20 40 60 80 100
Wet V
olume Chan
ge, %
Ethanol Concentration, % vol.
Polyurethane
Neoprene rubber
Styrene butadiene rubber
Silicone Rubber
‐60
‐50
‐40
‐30
‐20
‐10
0
0 20 40 60 80 100
Point Chan
ge in Hardness (w
et)
Ethanol Concentration, % vol.
Polyurethane
Neoprene rubber
Styrene butadiene rubber
Silicone Rubber
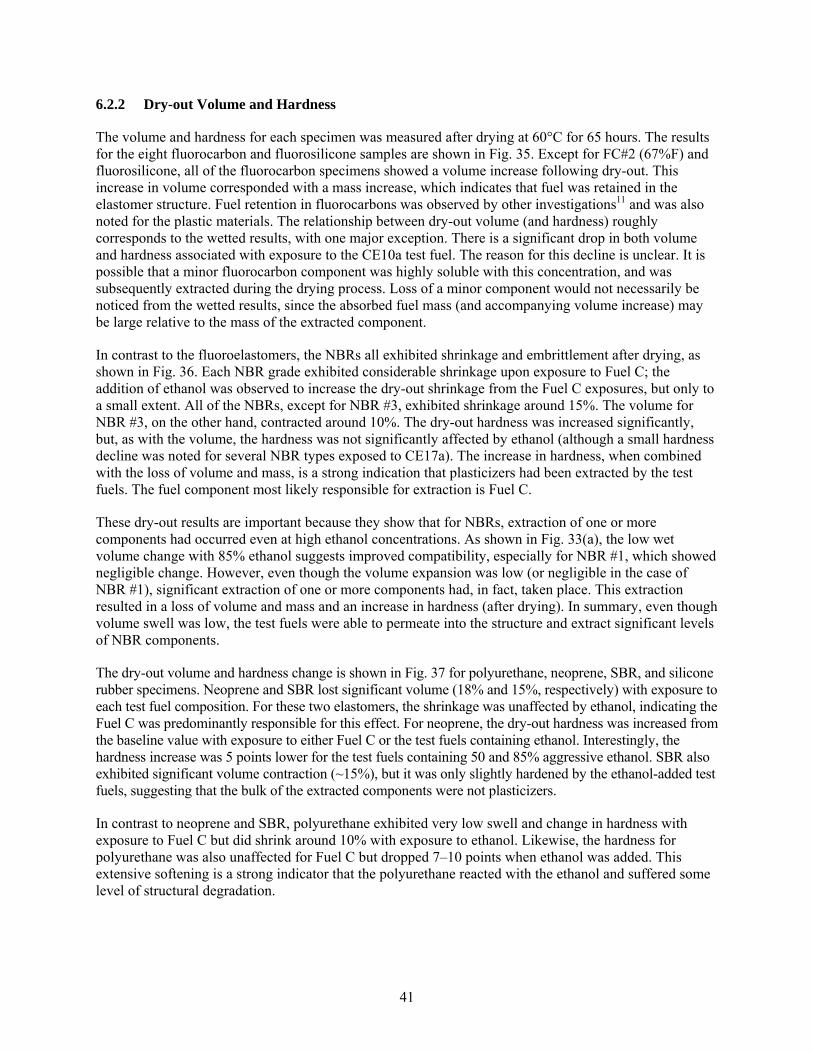
41
6.2.2 Dry-out Volume and Hardness
The volume and hardness for each specimen was measured after drying at 60°C for 65 hours. The results for the eight fluorocarbon and fluorosilicone samples are shown in Fig. 35. Except for FC#2 (67%F) and fluorosilicone, all of the fluorocarbon specimens showed a volume increase following dry-out. This increase in volume corresponded with a mass increase, which indicates that fuel was retained in the elastomer structure. Fuel retention in fluorocarbons was observed by other investigations11 and was also noted for the plastic materials. The relationship between dry-out volume (and hardness) roughly corresponds to the wetted results, with one major exception. There is a significant drop in both volume and hardness associated with exposure to the CE10a test fuel. The reason for this decline is unclear. It is possible that a minor fluorocarbon component was highly soluble with this concentration, and was subsequently extracted during the drying process. Loss of a minor component would not necessarily be noticed from the wetted results, since the absorbed fuel mass (and accompanying volume increase) may be large relative to the mass of the extracted component.
In contrast to the fluoroelastomers, the NBRs all exhibited shrinkage and embrittlement after drying, as shown in Fig. 36. Each NBR grade exhibited considerable shrinkage upon exposure to Fuel C; the addition of ethanol was observed to increase the dry-out shrinkage from the Fuel C exposures, but only to a small extent. All of the NBRs, except for NBR #3, exhibited shrinkage around 15%. The volume for NBR #3, on the other hand, contracted around 10%. The dry-out hardness was increased significantly, but, as with the volume, the hardness was not significantly affected by ethanol (although a small hardness decline was noted for several NBR types exposed to CE17a). The increase in hardness, when combined with the loss of volume and mass, is a strong indication that plasticizers had been extracted by the test fuels. The fuel component most likely responsible for extraction is Fuel C.
These dry-out results are important because they show that for NBRs, extraction of one or more components had occurred even at high ethanol concentrations. As shown in Fig. 33(a), the low wet volume change with 85% ethanol suggests improved compatibility, especially for NBR #1, which showed negligible change. However, even though the volume expansion was low (or negligible in the case of NBR #1), significant extraction of one or more components had, in fact, taken place. This extraction resulted in a loss of volume and mass and an increase in hardness (after drying). In summary, even though volume swell was low, the test fuels were able to permeate into the structure and extract significant levels of NBR components.
The dry-out volume and hardness change is shown in Fig. 37 for polyurethane, neoprene, SBR, and silicone rubber specimens. Neoprene and SBR lost significant volume (18% and 15%, respectively) with exposure to each test fuel composition. For these two elastomers, the shrinkage was unaffected by ethanol, indicating the Fuel C was predominantly responsible for this effect. For neoprene, the dry-out hardness was increased from the baseline value with exposure to either Fuel C or the test fuels containing ethanol. Interestingly, the hardness increase was 5 points lower for the test fuels containing 50 and 85% aggressive ethanol. SBR also exhibited significant volume contraction (~15%), but it was only slightly hardened by the ethanol-added test fuels, suggesting that the bulk of the extracted components were not plasticizers.
In contrast to neoprene and SBR, polyurethane exhibited very low swell and change in hardness with exposure to Fuel C but did shrink around 10% with exposure to ethanol. Likewise, the hardness for polyurethane was also unaffected for Fuel C but dropped 7–10 points when ethanol was added. This extensive softening is a strong indicator that the polyurethane reacted with the ethanol and suffered some level of structural degradation.
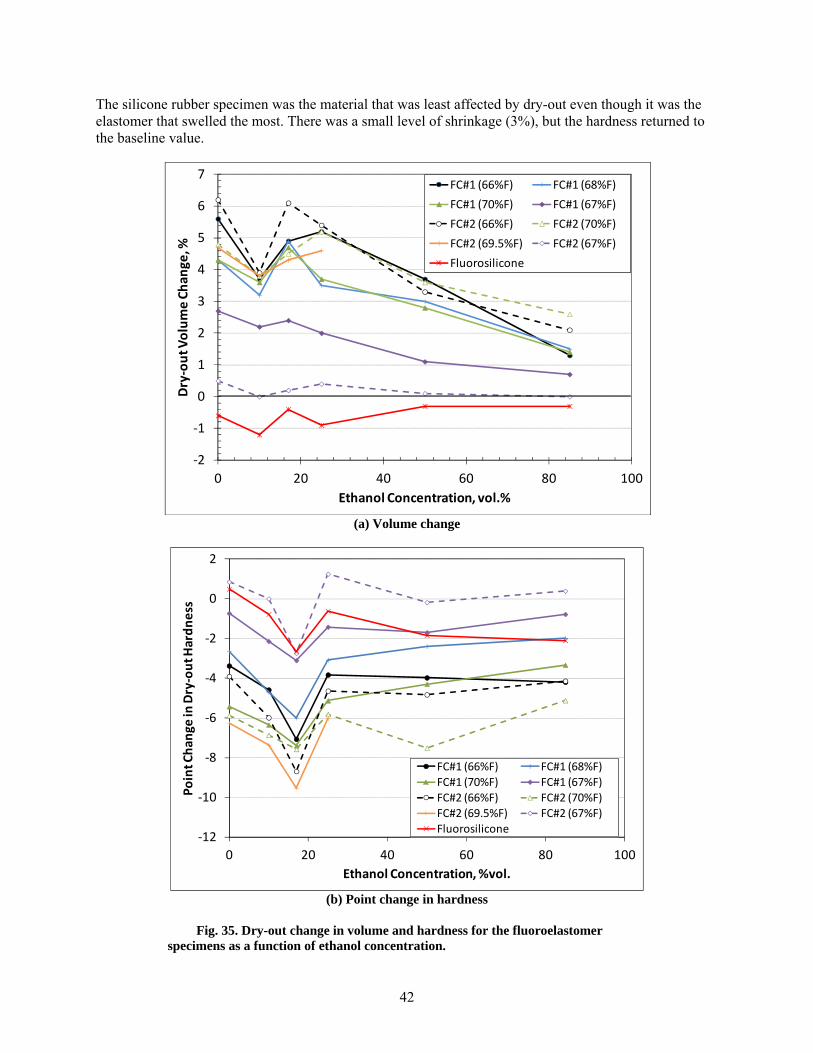
42
The silicone rubber specimen was the material that was least affected by dry-out even though it was the elastomer that swelled the most. There was a small level of shrinkage (3%), but the hardness returned to the baseline value.
(a) Volume change
(b) Point change in hardness
Fig. 35. Dry-out change in volume and hardness for the fluoroelastomer specimens as a function of ethanol concentration.
‐2
‐1
0
1
2
3
4
5
6
7
0 20 40 60 80 100
Dry‐out V
olume Chan
ge, %
Ethanol Concentration, vol.%
FC#1 (66%F) FC#1 (68%F)
FC#1 (70%F) FC#1 (67%F)
FC#2 (66%F) FC#2 (70%F)
FC#2 (69.5%F) FC#2 (67%F)
Fluorosilicone
‐12
‐10
‐8
‐6
‐4
‐2
0
2
0 20 40 60 80 100
Point Chan
ge in Dry‐out H
ardness
Ethanol Concentration, %vol.
FC#1 (66%F) FC#1 (68%F)
FC#1 (70%F) FC#1 (67%F)
FC#2 (66%F) FC#2 (70%F)
FC#2 (69.5%F) FC#2 (67%F)
Fluorosilicone
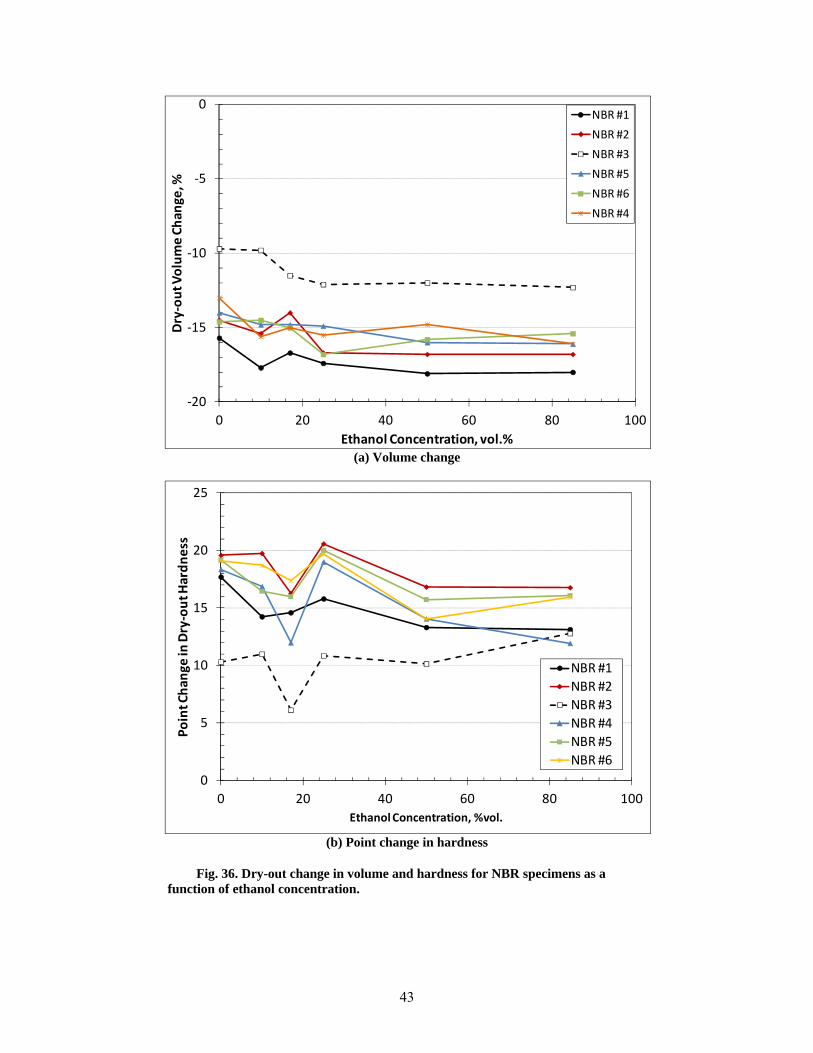
43
(a) Volume change
(b) Point change in hardness
Fig. 36. Dry-out change in volume and hardness for NBR specimens as a function of ethanol concentration.
‐20
‐15
‐10
‐5
0
0 20 40 60 80 100
Dry‐out V
olume Chan
ge, %
Ethanol Concentration, vol.%
NBR #1
NBR #2
NBR #3
NBR #5
NBR #6
NBR #4
0
5
10
15
20
25
0 20 40 60 80 100
Point Chan
ge in Dry‐out H
ardness
Ethanol Concentration, %vol.
NBR #1
NBR #2
NBR #3
NBR #4
NBR #5
NBR #6
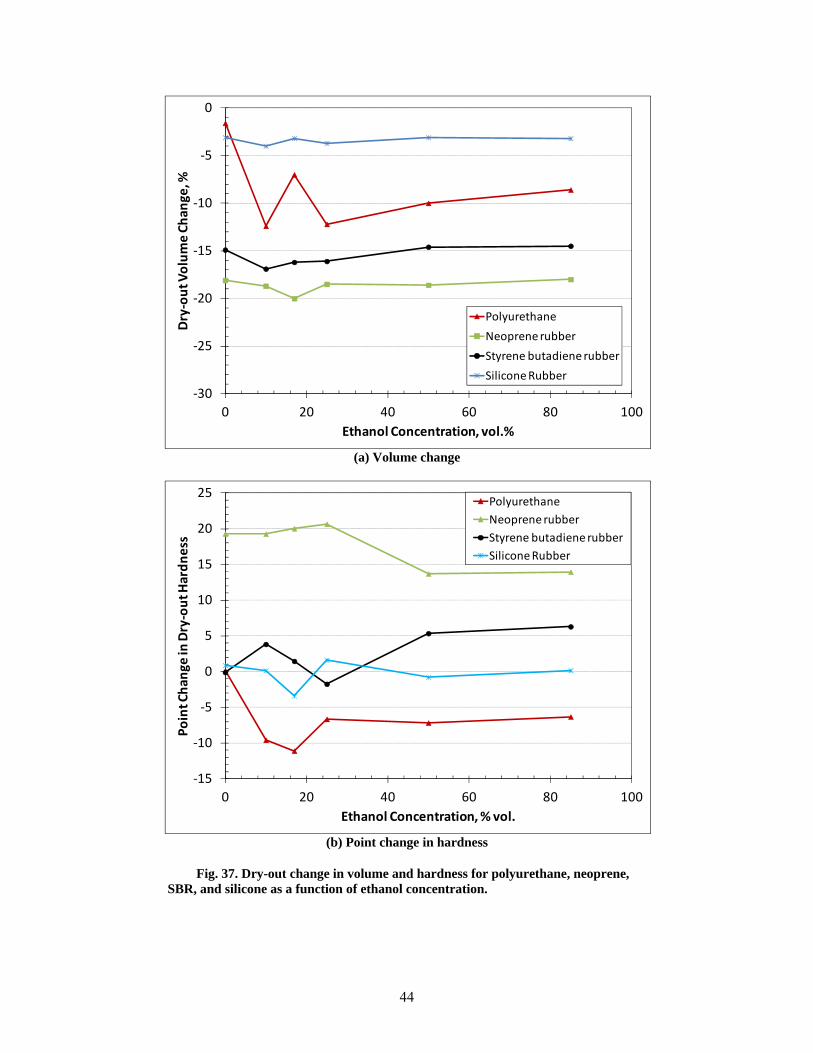
44
(a) Volume change
(b) Point change in hardness
Fig. 37. Dry-out change in volume and hardness for polyurethane, neoprene, SBR, and silicone as a function of ethanol concentration.
‐30
‐25
‐20
‐15
‐10
‐5
0
0 20 40 60 80 100
Dry‐out V
olume Chan
ge, %
Ethanol Concentration, vol.%
Polyurethane
Neoprene rubber
Styrene butadiene rubber
Silicone Rubber
‐15
‐10
‐5
0
5
10
15
20
25
0 20 40 60 80 100
Point Chan
ge in Dry‐out H
ardness
Ethanol Concentration, % vol.
Polyurethane
Neoprene rubber
Styrene butadiene rubber
Silicone Rubber
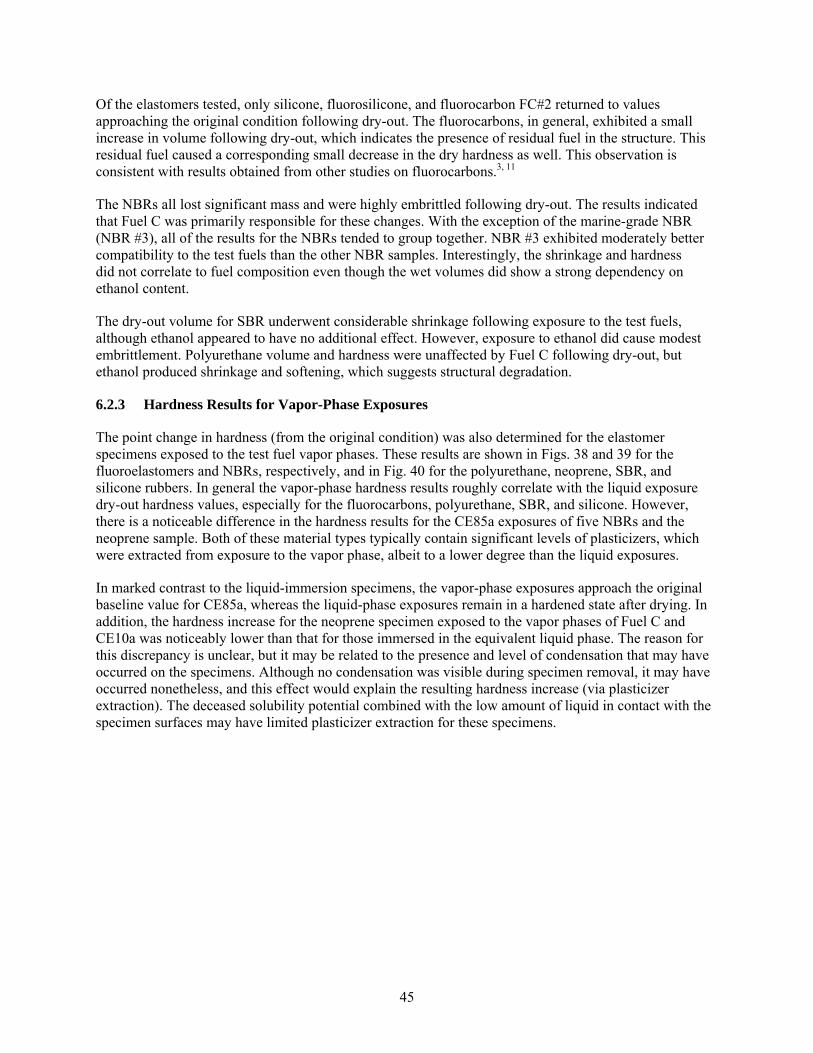
45
Of the elastomers tested, only silicone, fluorosilicone, and fluorocarbon FC#2 returned to values approaching the original condition following dry-out. The fluorocarbons, in general, exhibited a small increase in volume following dry-out, which indicates the presence of residual fuel in the structure. This residual fuel caused a corresponding small decrease in the dry hardness as well. This observation is consistent with results obtained from other studies on fluorocarbons.3, 11
The NBRs all lost significant mass and were highly embrittled following dry-out. The results indicated that Fuel C was primarily responsible for these changes. With the exception of the marine-grade NBR (NBR #3), all of the results for the NBRs tended to group together. NBR #3 exhibited moderately better compatibility to the test fuels than the other NBR samples. Interestingly, the shrinkage and hardness did not correlate to fuel composition even though the wet volumes did show a strong dependency on ethanol content.
The dry-out volume for SBR underwent considerable shrinkage following exposure to the test fuels, although ethanol appeared to have no additional effect. However, exposure to ethanol did cause modest embrittlement. Polyurethane volume and hardness were unaffected by Fuel C following dry-out, but ethanol produced shrinkage and softening, which suggests structural degradation.
6.2.3 Hardness Results for Vapor-Phase Exposures
The point change in hardness (from the original condition) was also determined for the elastomer specimens exposed to the test fuel vapor phases. These results are shown in Figs. 38 and 39 for the fluoroelastomers and NBRs, respectively, and in Fig. 40 for the polyurethane, neoprene, SBR, and silicone rubbers. In general the vapor-phase hardness results roughly correlate with the liquid exposure dry-out hardness values, especially for the fluorocarbons, polyurethane, SBR, and silicone. However, there is a noticeable difference in the hardness results for the CE85a exposures of five NBRs and the neoprene sample. Both of these material types typically contain significant levels of plasticizers, which were extracted from exposure to the vapor phase, albeit to a lower degree than the liquid exposures.
In marked contrast to the liquid-immersion specimens, the vapor-phase exposures approach the original baseline value for CE85a, whereas the liquid-phase exposures remain in a hardened state after drying. In addition, the hardness increase for the neoprene specimen exposed to the vapor phases of Fuel C and CE10a was noticeably lower than that for those immersed in the equivalent liquid phase. The reason for this discrepancy is unclear, but it may be related to the presence and level of condensation that may have occurred on the specimens. Although no condensation was visible during specimen removal, it may have occurred nonetheless, and this effect would explain the resulting hardness increase (via plasticizer extraction). The deceased solubility potential combined with the low amount of liquid in contact with the specimen surfaces may have limited plasticizer extraction for these specimens.
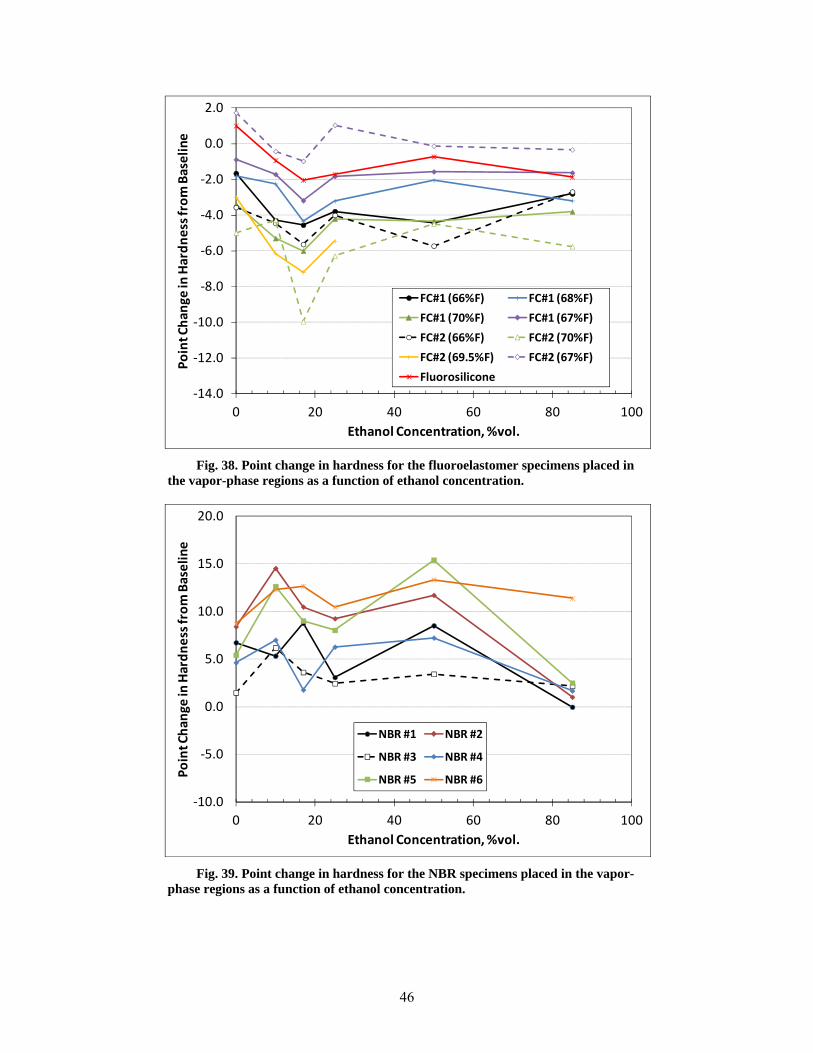
46
Fig. 38. Point change in hardness for the fluoroelastomer specimens placed in the vapor-phase regions as a function of ethanol concentration.
Fig. 39. Point change in hardness for the NBR specimens placed in the vapor-phase regions as a function of ethanol concentration.
‐14.0
‐12.0
‐10.0
‐8.0
‐6.0
‐4.0
‐2.0
0.0
2.0
0 20 40 60 80 100
Point Chan
ge in Hardness from Baseline
Ethanol Concentration, %vol.
FC#1 (66%F) FC#1 (68%F)
FC#1 (70%F) FC#1 (67%F)
FC#2 (66%F) FC#2 (70%F)
FC#2 (69.5%F) FC#2 (67%F)
Fluorosilicone
‐10.0
‐5.0
0.0
5.0
10.0
15.0
20.0
0 20 40 60 80 100
Point Chan
ge in Hardness from Baseline
Ethanol Concentration, %vol.
NBR #1 NBR #2
NBR #3 NBR #4
NBR #5 NBR #6
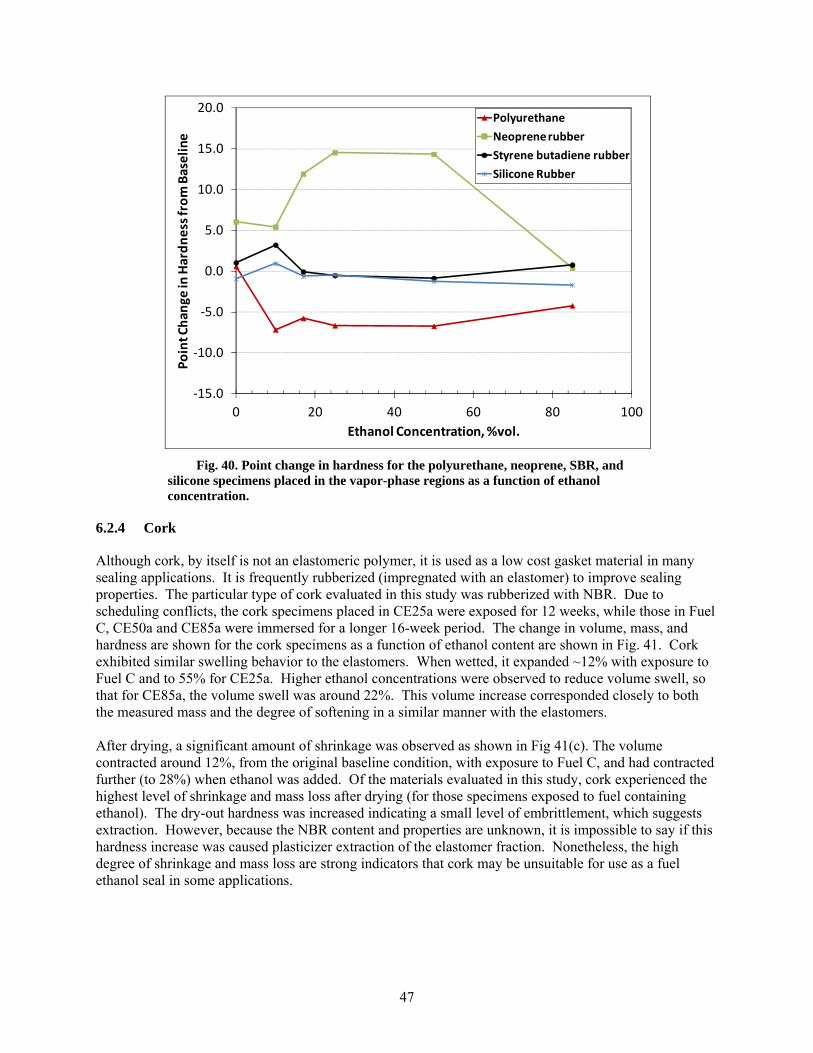
47
Fig. 40. Point change in hardness for the polyurethane, neoprene, SBR, and silicone specimens placed in the vapor-phase regions as a function of ethanol concentration.
6.2.4 Cork
Although cork, by itself is not an elastomeric polymer, it is used as a low cost gasket material in many sealing applications. It is frequently rubberized (impregnated with an elastomer) to improve sealing properties. The particular type of cork evaluated in this study was rubberized with NBR. Due to scheduling conflicts, the cork specimens placed in CE25a were exposed for 12 weeks, while those in Fuel C, CE50a and CE85a were immersed for a longer 16-week period. The change in volume, mass, and hardness are shown for the cork specimens as a function of ethanol content are shown in Fig. 41. Cork exhibited similar swelling behavior to the elastomers. When wetted, it expanded ~12% with exposure to Fuel C and to 55% for CE25a. Higher ethanol concentrations were observed to reduce volume swell, so that for CE85a, the volume swell was around 22%. This volume increase corresponded closely to both the measured mass and the degree of softening in a similar manner with the elastomers. After drying, a significant amount of shrinkage was observed as shown in Fig 41(c). The volume contracted around 12%, from the original baseline condition, with exposure to Fuel C, and had contracted further (to 28%) when ethanol was added. Of the materials evaluated in this study, cork experienced the highest level of shrinkage and mass loss after drying (for those specimens exposed to fuel containing ethanol). The dry-out hardness was increased indicating a small level of embrittlement, which suggests extraction. However, because the NBR content and properties are unknown, it is impossible to say if this hardness increase was caused plasticizer extraction of the elastomer fraction. Nonetheless, the high degree of shrinkage and mass loss are strong indicators that cork may be unsuitable for use as a fuel ethanol seal in some applications.
‐15.0
‐10.0
‐5.0
0.0
5.0
10.0
15.0
20.0
0 20 40 60 80 100
Point Chan
ge in Hardness from Baseline
Ethanol Concentration, %vol.
Polyurethane
Neoprene rubber
Styrene butadiene rubber
Silicone Rubber
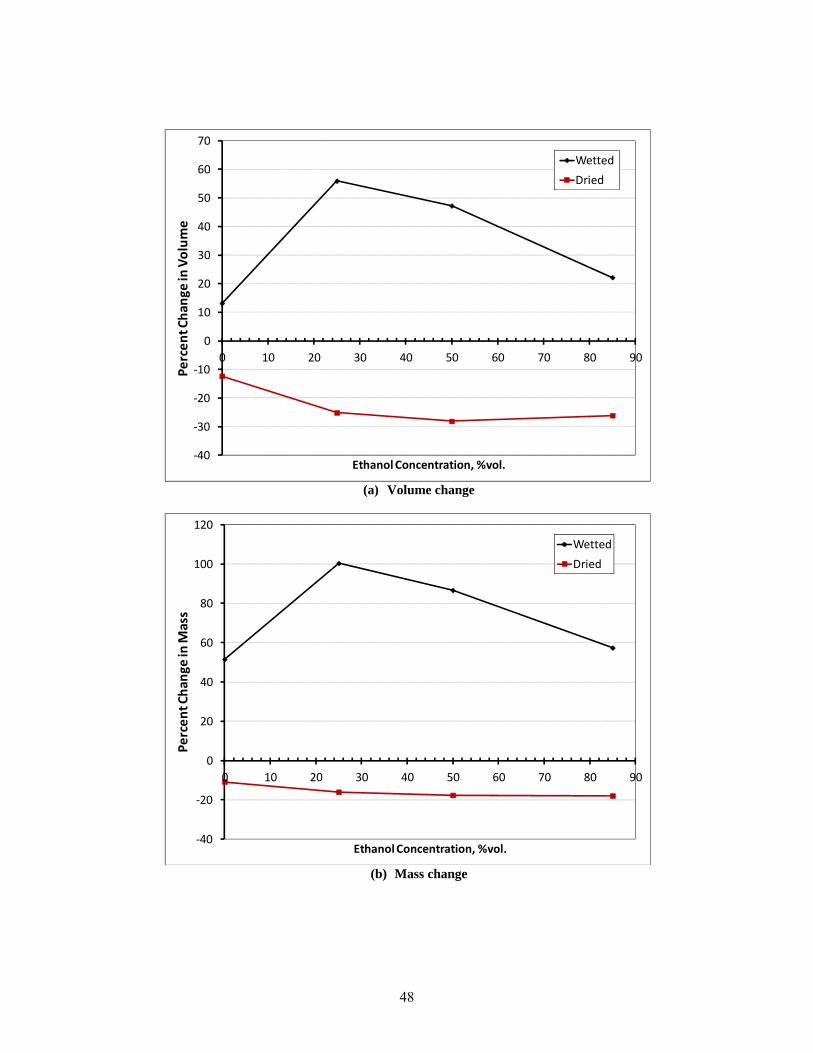
48
(a) Volume change
(b) Mass change
‐40
‐30
‐20
‐10
0
10
20
30
40
50
60
70
0 10 20 30 40 50 60 70 80 90
Percent Chan
ge in Volume
Ethanol Concentration, %vol.
Wetted
Dried
‐40
‐20
0
20
40
60
80
100
120
0 10 20 30 40 50 60 70 80 90
Percent Chan
ge in M
ass
Ethanol Concentration, %vol.
Wetted
Dried
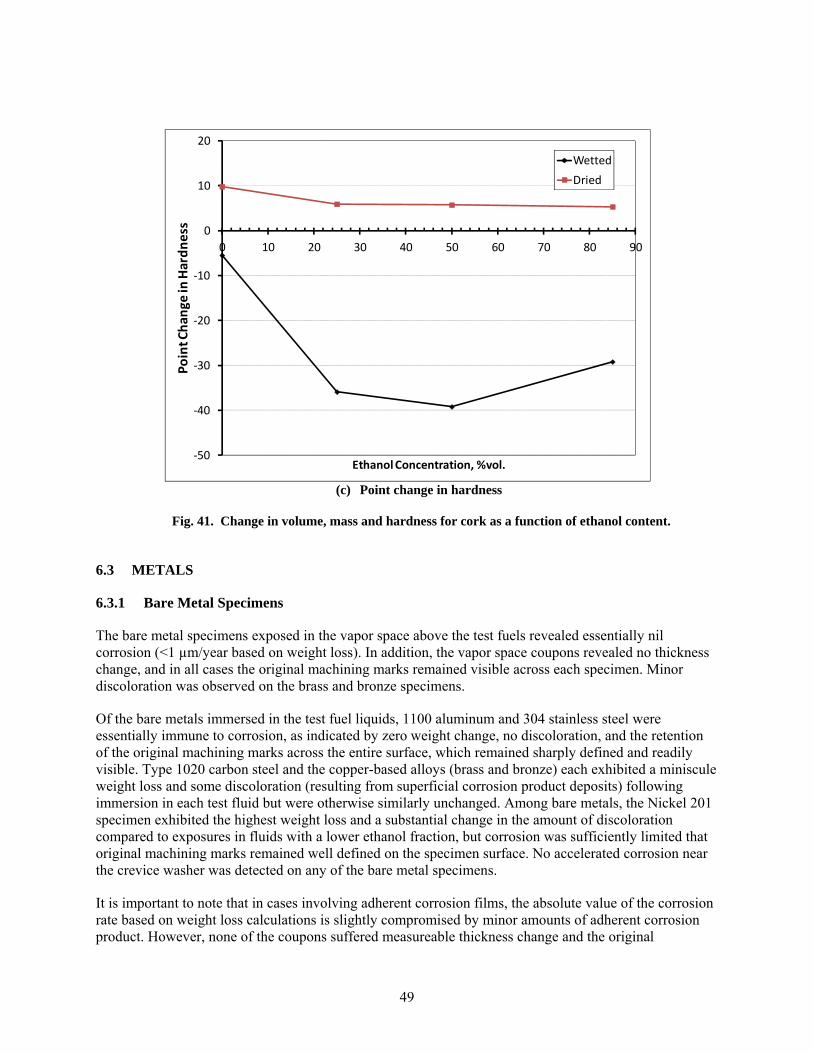
49
(c) Point change in hardness
Fig. 41. Change in volume, mass and hardness for cork as a function of ethanol content.
6.3 METALS
6.3.1 Bare Metal Specimens
The bare metal specimens exposed in the vapor space above the test fuels revealed essentially nil corrosion (<1 µm/year based on weight loss). In addition, the vapor space coupons revealed no thickness change, and in all cases the original machining marks remained visible across each specimen. Minor discoloration was observed on the brass and bronze specimens.
Of the bare metals immersed in the test fuel liquids, 1100 aluminum and 304 stainless steel were essentially immune to corrosion, as indicated by zero weight change, no discoloration, and the retention of the original machining marks across the entire surface, which remained sharply defined and readily visible. Type 1020 carbon steel and the copper-based alloys (brass and bronze) each exhibited a miniscule weight loss and some discoloration (resulting from superficial corrosion product deposits) following immersion in each test fluid but were otherwise similarly unchanged. Among bare metals, the Nickel 201 specimen exhibited the highest weight loss and a substantial change in the amount of discoloration compared to exposures in fluids with a lower ethanol fraction, but corrosion was sufficiently limited that original machining marks remained well defined on the specimen surface. No accelerated corrosion near the crevice washer was detected on any of the bare metal specimens.
It is important to note that in cases involving adherent corrosion films, the absolute value of the corrosion rate based on weight loss calculations is slightly compromised by minor amounts of adherent corrosion product. However, none of the coupons suffered measureable thickness change and the original
‐50
‐40
‐30
‐20
‐10
0
10
20
0 10 20 30 40 50 60 70 80 90
Point Chan
ge in Hardness
Ethanol Concentration, %vol.
Wetted
Dried
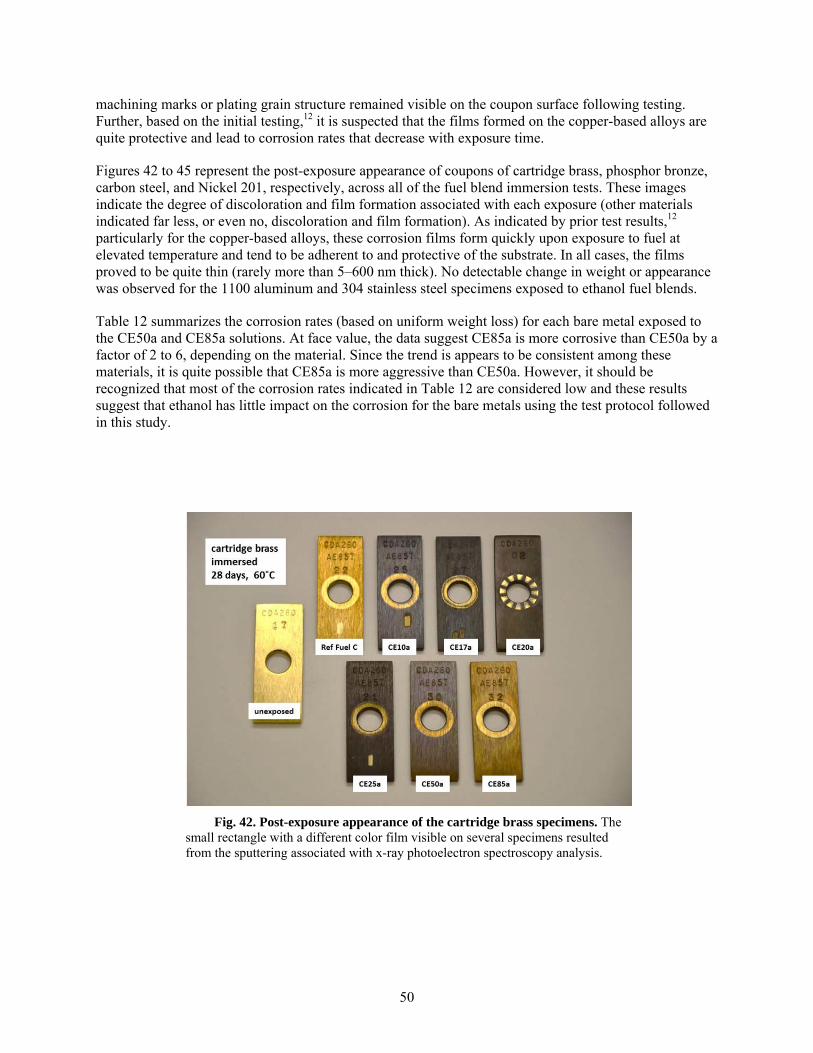
50
machining marks or plating grain structure remained visible on the coupon surface following testing. Further, based on the initial testing,12 it is suspected that the films formed on the copper-based alloys are quite protective and lead to corrosion rates that decrease with exposure time.
Figures 42 to 45 represent the post-exposure appearance of coupons of cartridge brass, phosphor bronze, carbon steel, and Nickel 201, respectively, across all of the fuel blend immersion tests. These images indicate the degree of discoloration and film formation associated with each exposure (other materials indicated far less, or even no, discoloration and film formation). As indicated by prior test results,12 particularly for the copper-based alloys, these corrosion films form quickly upon exposure to fuel at elevated temperature and tend to be adherent to and protective of the substrate. In all cases, the films proved to be quite thin (rarely more than 5–600 nm thick). No detectable change in weight or appearance was observed for the 1100 aluminum and 304 stainless steel specimens exposed to ethanol fuel blends.
Table 12 summarizes the corrosion rates (based on uniform weight loss) for each bare metal exposed to the CE50a and CE85a solutions. At face value, the data suggest CE85a is more corrosive than CE50a by a factor of 2 to 6, depending on the material. Since the trend is appears to be consistent among these materials, it is quite possible that CE85a is more aggressive than CE50a. However, it should be recognized that most of the corrosion rates indicated in Table 12 are considered low and these results suggest that ethanol has little impact on the corrosion for the bare metals using the test protocol followed in this study.
Fig. 42. Post-exposure appearance of the cartridge brass specimens. The small rectangle with a different color film visible on several specimens resulted from the sputtering associated with x-ray photoelectron spectroscopy analysis.
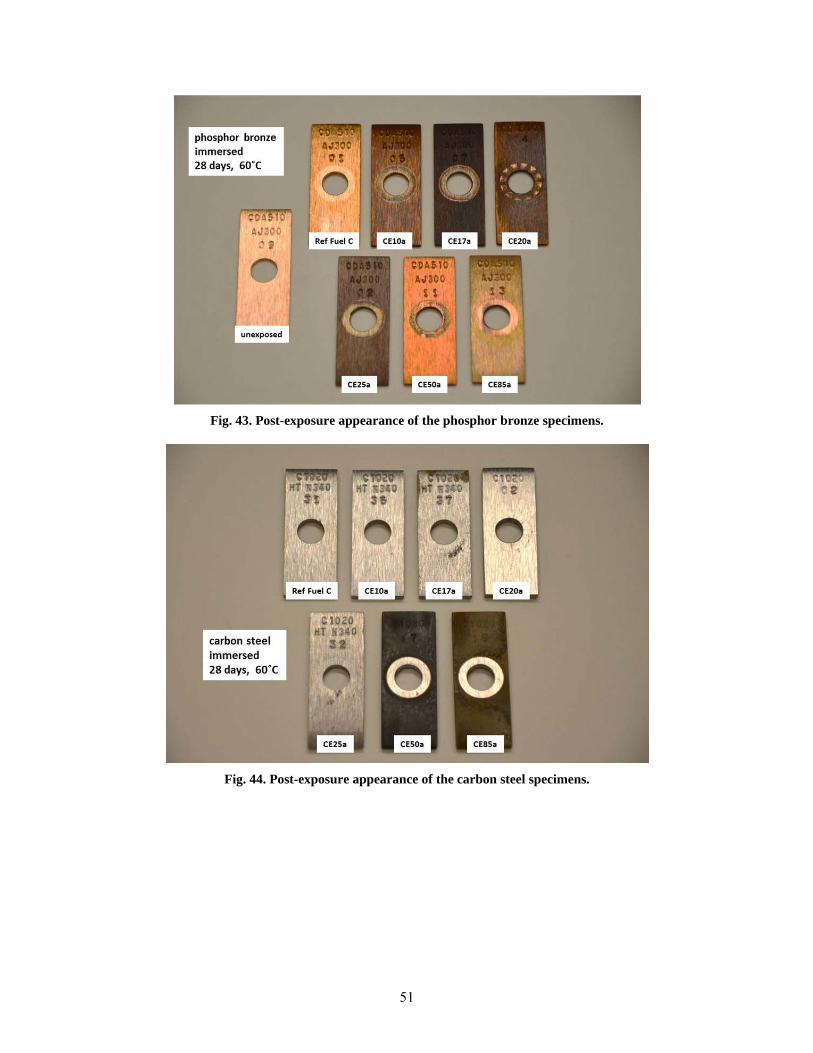
51
Fig. 43. Post-exposure appearance of the phosphor bronze specimens.
Fig. 44. Post-exposure appearance of the carbon steel specimens.
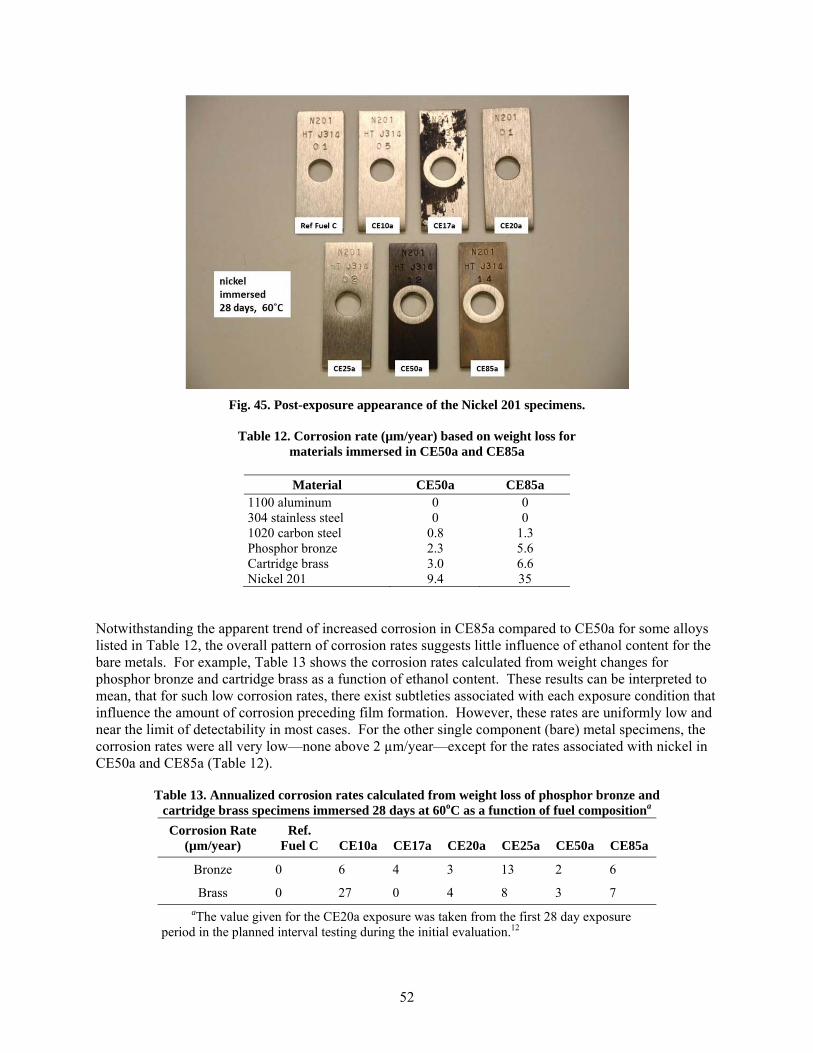
52
Fig. 45. Post-exposure appearance of the Nickel 201 specimens.
Table 12. Corrosion rate (µm/year) based on weight loss for materials immersed in CE50a and CE85a
Material CE50a CE85a 1100 aluminum 0 0 304 stainless steel 0 0 1020 carbon steel 0.8 1.3 Phosphor bronze 2.3 5.6 Cartridge brass 3.0 6.6 Nickel 201 9.4 35
Notwithstanding the apparent trend of increased corrosion in CE85a compared to CE50a for some alloys listed in Table 12, the overall pattern of corrosion rates suggests little influence of ethanol content for the bare metals. For example, Table 13 shows the corrosion rates calculated from weight changes for phosphor bronze and cartridge brass as a function of ethanol content. These results can be interpreted to mean, that for such low corrosion rates, there exist subtleties associated with each exposure condition that influence the amount of corrosion preceding film formation. However, these rates are uniformly low and near the limit of detectability in most cases. For the other single component (bare) metal specimens, the corrosion rates were all very low—none above 2 µm/year—except for the rates associated with nickel in CE50a and CE85a (Table 12).
Table 13. Annualized corrosion rates calculated from weight loss of phosphor bronze and cartridge brass specimens immersed 28 days at 60oC as a function of fuel compositiona
Corrosion Rate (µm/year)
Ref. Fuel C CE10a CE17a CE20a CE25a CE50a CE85a
Bronze 0 6 4 3 13 2 6
Brass 0 27 0 4 8 3 7 aThe value given for the CE20a exposure was taken from the first 28 day exposure
period in the planned interval testing during the initial evaluation.12
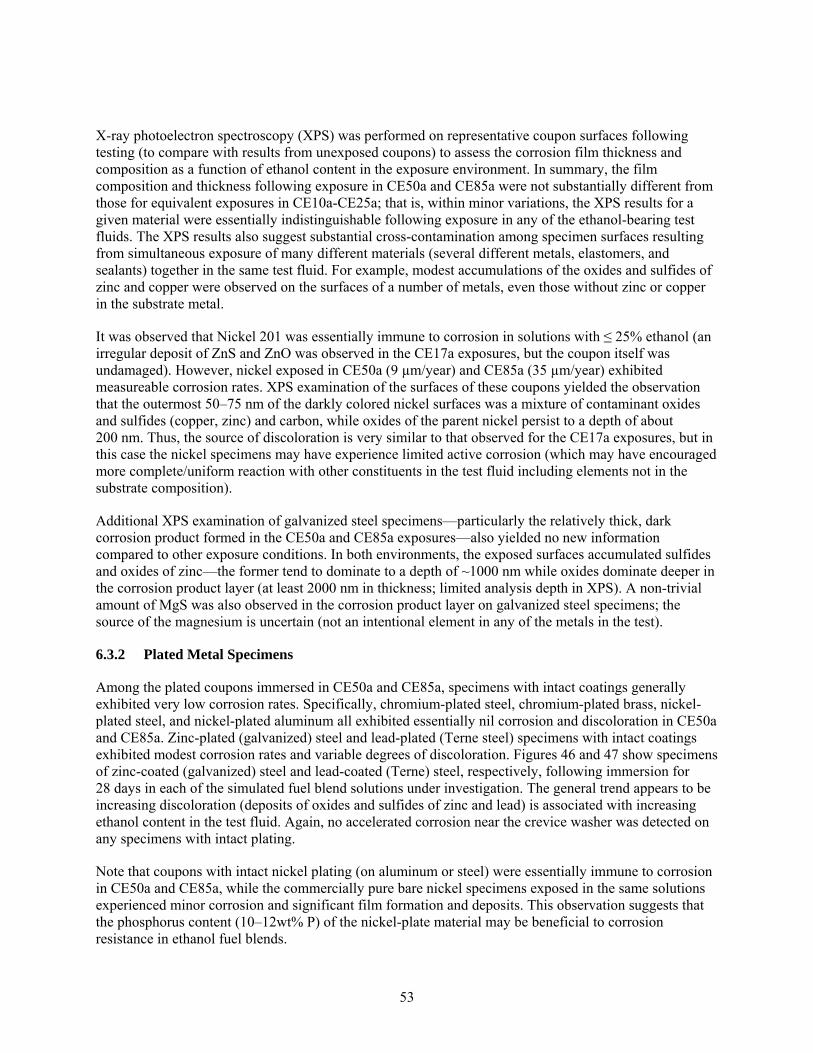
53
X-ray photoelectron spectroscopy (XPS) was performed on representative coupon surfaces following testing (to compare with results from unexposed coupons) to assess the corrosion film thickness and composition as a function of ethanol content in the exposure environment. In summary, the film composition and thickness following exposure in CE50a and CE85a were not substantially different from those for equivalent exposures in CE10a-CE25a; that is, within minor variations, the XPS results for a given material were essentially indistinguishable following exposure in any of the ethanol-bearing test fluids. The XPS results also suggest substantial cross-contamination among specimen surfaces resulting from simultaneous exposure of many different materials (several different metals, elastomers, and sealants) together in the same test fluid. For example, modest accumulations of the oxides and sulfides of zinc and copper were observed on the surfaces of a number of metals, even those without zinc or copper in the substrate metal.
It was observed that Nickel 201 was essentially immune to corrosion in solutions with ≤ 25% ethanol (an irregular deposit of ZnS and ZnO was observed in the CE17a exposures, but the coupon itself was undamaged). However, nickel exposed in CE50a (9 µm/year) and CE85a (35 µm/year) exhibited measureable corrosion rates. XPS examination of the surfaces of these coupons yielded the observation that the outermost 50–75 nm of the darkly colored nickel surfaces was a mixture of contaminant oxides and sulfides (copper, zinc) and carbon, while oxides of the parent nickel persist to a depth of about 200 nm. Thus, the source of discoloration is very similar to that observed for the CE17a exposures, but in this case the nickel specimens may have experience limited active corrosion (which may have encouraged more complete/uniform reaction with other constituents in the test fluid including elements not in the substrate composition).
Additional XPS examination of galvanized steel specimens—particularly the relatively thick, dark corrosion product formed in the CE50a and CE85a exposures—also yielded no new information compared to other exposure conditions. In both environments, the exposed surfaces accumulated sulfides and oxides of zinc—the former tend to dominate to a depth of ~1000 nm while oxides dominate deeper in the corrosion product layer (at least 2000 nm in thickness; limited analysis depth in XPS). A non-trivial amount of MgS was also observed in the corrosion product layer on galvanized steel specimens; the source of the magnesium is uncertain (not an intentional element in any of the metals in the test).
6.3.2 Plated Metal Specimens
Among the plated coupons immersed in CE50a and CE85a, specimens with intact coatings generally exhibited very low corrosion rates. Specifically, chromium-plated steel, chromium-plated brass, nickel-plated steel, and nickel-plated aluminum all exhibited essentially nil corrosion and discoloration in CE50a and CE85a. Zinc-plated (galvanized) steel and lead-plated (Terne steel) specimens with intact coatings exhibited modest corrosion rates and variable degrees of discoloration. Figures 46 and 47 show specimens of zinc-coated (galvanized) steel and lead-coated (Terne) steel, respectively, following immersion for 28 days in each of the simulated fuel blend solutions under investigation. The general trend appears to be increasing discoloration (deposits of oxides and sulfides of zinc and lead) is associated with increasing ethanol content in the test fluid. Again, no accelerated corrosion near the crevice washer was detected on any specimens with intact plating.
Note that coupons with intact nickel plating (on aluminum or steel) were essentially immune to corrosion in CE50a and CE85a, while the commercially pure bare nickel specimens exposed in the same solutions experienced minor corrosion and significant film formation and deposits. This observation suggests that the phosphorus content (10–12wt% P) of the nickel-plate material may be beneficial to corrosion resistance in ethanol fuel blends.
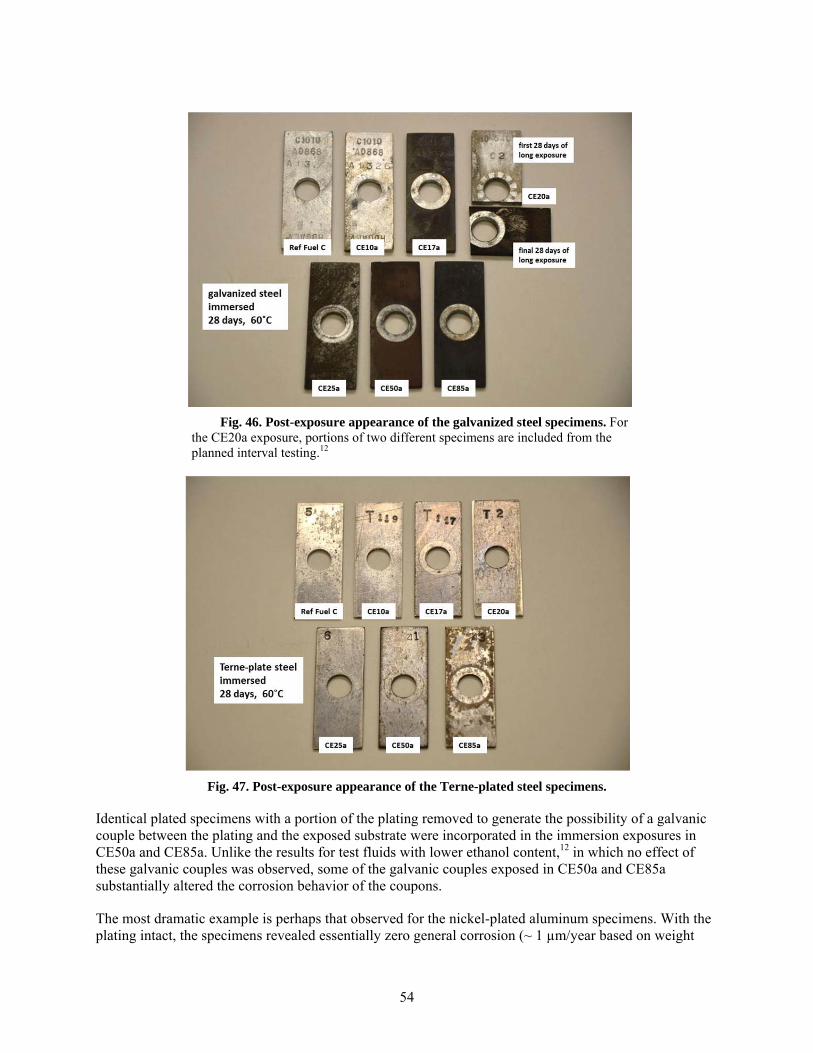
54
Fig. 46. Post-exposure appearance of the galvanized steel specimens. For
the CE20a exposure, portions of two different specimens are included from the planned interval testing.12
Fig. 47. Post-exposure appearance of the Terne-plated steel specimens.
Identical plated specimens with a portion of the plating removed to generate the possibility of a galvanic couple between the plating and the exposed substrate were incorporated in the immersion exposures in CE50a and CE85a. Unlike the results for test fluids with lower ethanol content,12 in which no effect of these galvanic couples was observed, some of the galvanic couples exposed in CE50a and CE85a substantially altered the corrosion behavior of the coupons.
The most dramatic example is perhaps that observed for the nickel-plated aluminum specimens. With the plating intact, the specimens revealed essentially zero general corrosion (~ 1 µm/year based on weight
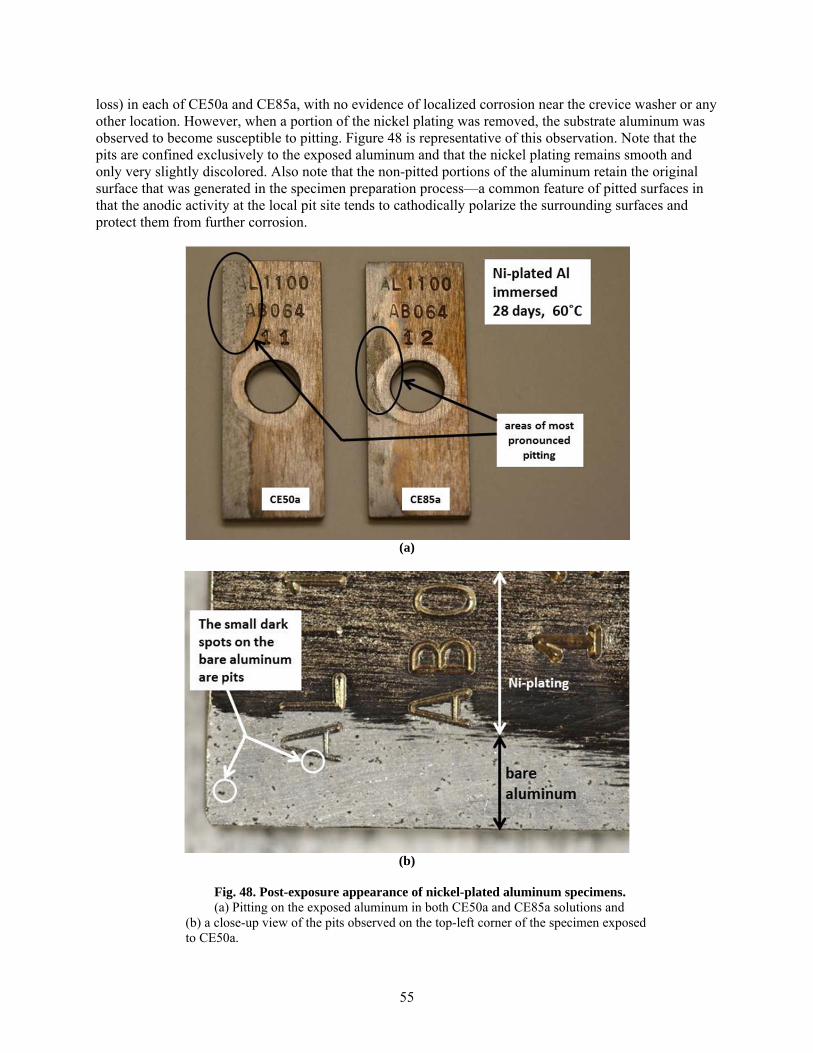
55
loss) in each of CE50a and CE85a, with no evidence of localized corrosion near the crevice washer or any other location. However, when a portion of the nickel plating was removed, the substrate aluminum was observed to become susceptible to pitting. Figure 48 is representative of this observation. Note that the pits are confined exclusively to the exposed aluminum and that the nickel plating remains smooth and only very slightly discolored. Also note that the non-pitted portions of the aluminum retain the original surface that was generated in the specimen preparation process—a common feature of pitted surfaces in that the anodic activity at the local pit site tends to cathodically polarize the surrounding surfaces and protect them from further corrosion.
(a)
(b)
Fig. 48. Post-exposure appearance of nickel-plated aluminum specimens. (a) Pitting on the exposed aluminum in both CE50a and CE85a solutions and
(b) a close-up view of the pits observed on the top-left corner of the specimen exposed to CE50a.
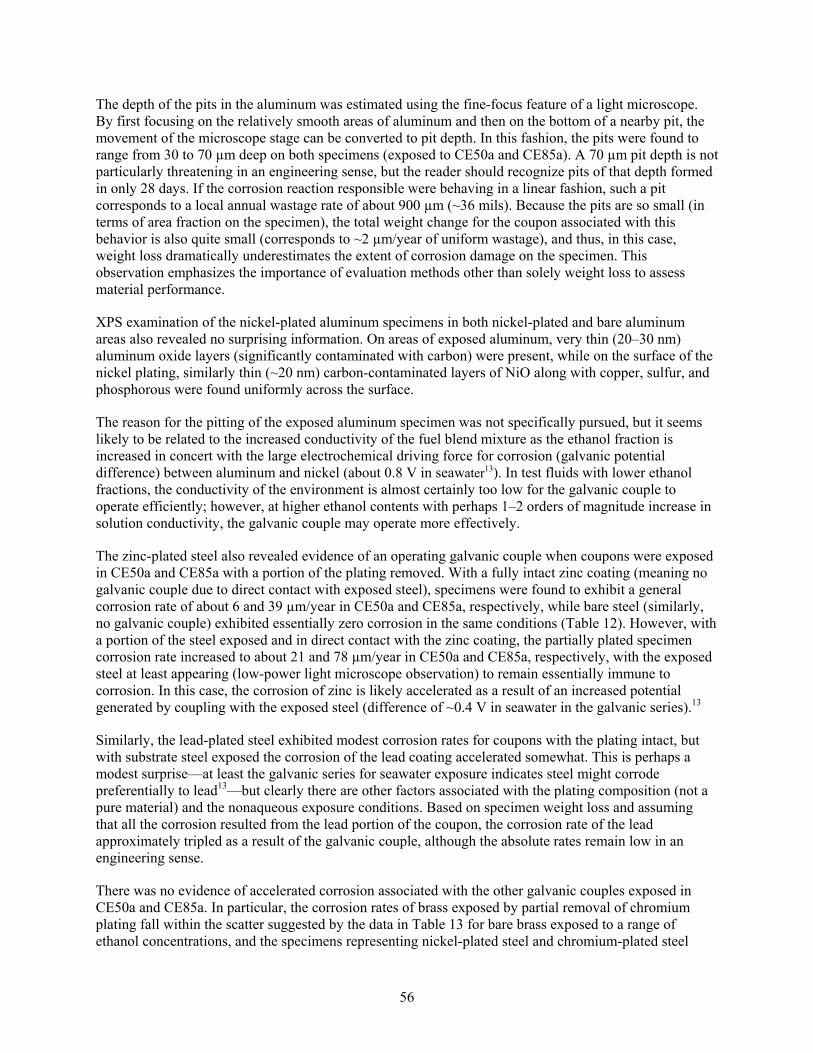
56
The depth of the pits in the aluminum was estimated using the fine-focus feature of a light microscope. By first focusing on the relatively smooth areas of aluminum and then on the bottom of a nearby pit, the movement of the microscope stage can be converted to pit depth. In this fashion, the pits were found to range from 30 to 70 µm deep on both specimens (exposed to CE50a and CE85a). A 70 µm pit depth is not particularly threatening in an engineering sense, but the reader should recognize pits of that depth formed in only 28 days. If the corrosion reaction responsible were behaving in a linear fashion, such a pit corresponds to a local annual wastage rate of about 900 µm (~36 mils). Because the pits are so small (in terms of area fraction on the specimen), the total weight change for the coupon associated with this behavior is also quite small (corresponds to ~2 µm/year of uniform wastage), and thus, in this case, weight loss dramatically underestimates the extent of corrosion damage on the specimen. This observation emphasizes the importance of evaluation methods other than solely weight loss to assess material performance.
XPS examination of the nickel-plated aluminum specimens in both nickel-plated and bare aluminum areas also revealed no surprising information. On areas of exposed aluminum, very thin (20–30 nm) aluminum oxide layers (significantly contaminated with carbon) were present, while on the surface of the nickel plating, similarly thin (~20 nm) carbon-contaminated layers of NiO along with copper, sulfur, and phosphorous were found uniformly across the surface.
The reason for the pitting of the exposed aluminum specimen was not specifically pursued, but it seems likely to be related to the increased conductivity of the fuel blend mixture as the ethanol fraction is increased in concert with the large electrochemical driving force for corrosion (galvanic potential difference) between aluminum and nickel (about 0.8 V in seawater13). In test fluids with lower ethanol fractions, the conductivity of the environment is almost certainly too low for the galvanic couple to operate efficiently; however, at higher ethanol contents with perhaps 1–2 orders of magnitude increase in solution conductivity, the galvanic couple may operate more effectively.
The zinc-plated steel also revealed evidence of an operating galvanic couple when coupons were exposed in CE50a and CE85a with a portion of the plating removed. With a fully intact zinc coating (meaning no galvanic couple due to direct contact with exposed steel), specimens were found to exhibit a general corrosion rate of about 6 and 39 µm/year in CE50a and CE85a, respectively, while bare steel (similarly, no galvanic couple) exhibited essentially zero corrosion in the same conditions (Table 12). However, with a portion of the steel exposed and in direct contact with the zinc coating, the partially plated specimen corrosion rate increased to about 21 and 78 µm/year in CE50a and CE85a, respectively, with the exposed steel at least appearing (low-power light microscope observation) to remain essentially immune to corrosion. In this case, the corrosion of zinc is likely accelerated as a result of an increased potential generated by coupling with the exposed steel (difference of ~0.4 V in seawater in the galvanic series).13
Similarly, the lead-plated steel exhibited modest corrosion rates for coupons with the plating intact, but with substrate steel exposed the corrosion of the lead coating accelerated somewhat. This is perhaps a modest surprise—at least the galvanic series for seawater exposure indicates steel might corrode preferentially to lead13—but clearly there are other factors associated with the plating composition (not a pure material) and the nonaqueous exposure conditions. Based on specimen weight loss and assuming that all the corrosion resulted from the lead portion of the coupon, the corrosion rate of the lead approximately tripled as a result of the galvanic couple, although the absolute rates remain low in an engineering sense.
There was no evidence of accelerated corrosion associated with the other galvanic couples exposed in CE50a and CE85a. In particular, the corrosion rates of brass exposed by partial removal of chromium plating fall within the scatter suggested by the data in Table 13 for bare brass exposed to a range of ethanol concentrations, and the specimens representing nickel-plated steel and chromium-plated steel
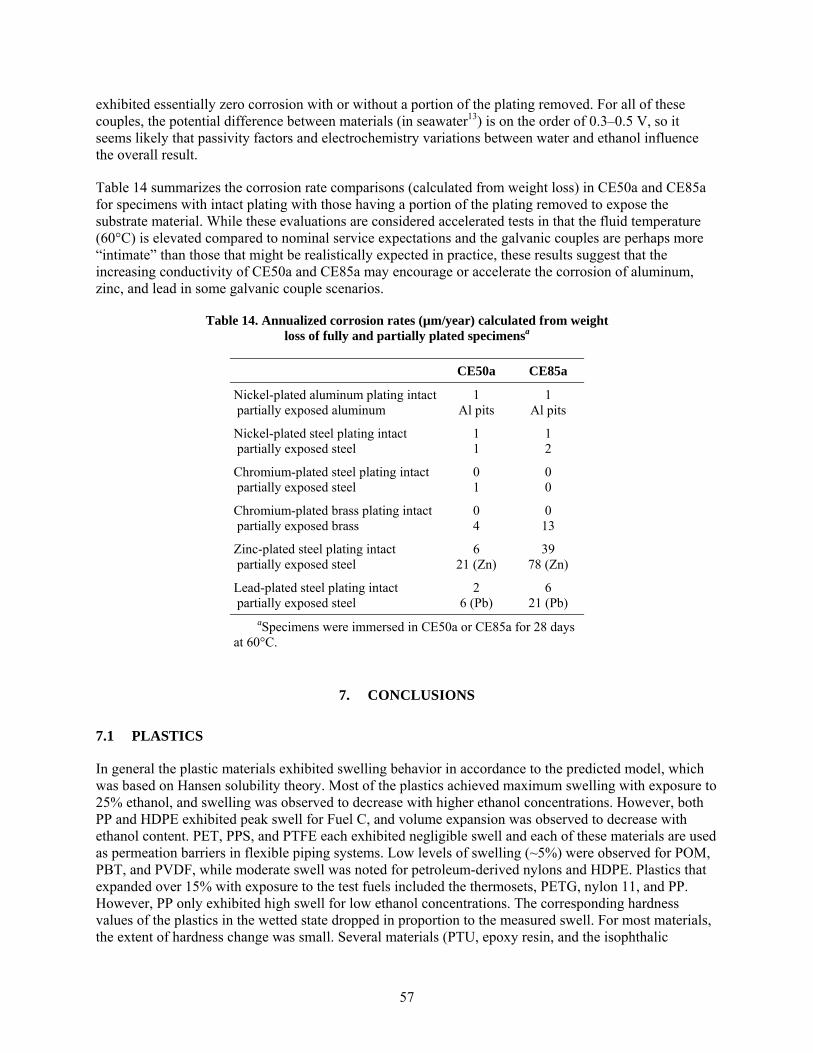
57
exhibited essentially zero corrosion with or without a portion of the plating removed. For all of these couples, the potential difference between materials (in seawater13) is on the order of 0.3–0.5 V, so it seems likely that passivity factors and electrochemistry variations between water and ethanol influence the overall result.
Table 14 summarizes the corrosion rate comparisons (calculated from weight loss) in CE50a and CE85a for specimens with intact plating with those having a portion of the plating removed to expose the substrate material. While these evaluations are considered accelerated tests in that the fluid temperature (60°C) is elevated compared to nominal service expectations and the galvanic couples are perhaps more “intimate” than those that might be realistically expected in practice, these results suggest that the increasing conductivity of CE50a and CE85a may encourage or accelerate the corrosion of aluminum, zinc, and lead in some galvanic couple scenarios.
Table 14. Annualized corrosion rates (µm/year) calculated from weight loss of fully and partially plated specimensa
CE50a CE85a
Nickel-plated aluminum plating intact partially exposed aluminum
1 Al pits
1 Al pits
Nickel-plated steel plating intact partially exposed steel
1 1
1 2
Chromium-plated steel plating intact partially exposed steel
0 1
0 0
Chromium-plated brass plating intact partially exposed brass
0 4
0 13
Zinc-plated steel plating intact partially exposed steel
6 21 (Zn)
39 78 (Zn)
Lead-plated steel plating intact partially exposed steel
2 6 (Pb)
6 21 (Pb)
aSpecimens were immersed in CE50a or CE85a for 28 days at 60°C.
7. CONCLUSIONS
7.1 PLASTICS
In general the plastic materials exhibited swelling behavior in accordance to the predicted model, which was based on Hansen solubility theory. Most of the plastics achieved maximum swelling with exposure to 25% ethanol, and swelling was observed to decrease with higher ethanol concentrations. However, both PP and HDPE exhibited peak swell for Fuel C, and volume expansion was observed to decrease with ethanol content. PET, PPS, and PTFE each exhibited negligible swell and each of these materials are used as permeation barriers in flexible piping systems. Low levels of swelling (~5%) were observed for POM, PBT, and PVDF, while moderate swell was noted for petroleum-derived nylons and HDPE. Plastics that expanded over 15% with exposure to the test fuels included the thermosets, PETG, nylon 11, and PP. However, PP only exhibited high swell for low ethanol concentrations. The corresponding hardness values of the plastics in the wetted state dropped in proportion to the measured swell. For most materials, the extent of hardness change was small. Several materials (PTU, epoxy resin, and the isophthalic
58
polyester resins) fractured during exposure to several of the test fuels. Polythiourea and the epoxies were cracked by CE25a, CE50a, and CE85a test fuels, while the isophthalic polyesters cracked only in CE25a and CE50a.
Following dry-out, all of the plastics (except nylon 12) retained some level of fuel in the dry state. Fuel retention caused the dry-out hardness to be slightly lower than the initial state for most of the plastics; however, the extent of softening was negligible for most samples. The one exception was nylon 12, which lost mass following exposure to the test fuels and showed slight embrittlement following dry-out. The change in hardness values for plastics exposed to the vapor phase was similar to those immersed in the test fuel liquids.
Tg and E’ were measured on specimens exposed to Fuel C and CE25a. These test fuels had no effect on Tg for PPS, the fluoropolymers, the acetals, and the HDPEs. However, significant shifts in Tg were noted for PET, PETG, PBT, PP, the nylons, and the thermoset resins. For many of these plastics, Tg was altered by both test fuels. The Tgs for PET, the nylons, and thermosets were especially sensitive to ethanol, and for these plastics, the Tg dropped dramatically following exposure to CE25a.
E’ decreased for the majority of the plastic types following exposure to the Fuel C and CE25a. However, significant increases in E’ were noted for POM, nylon 6, and nylon 6/6 specimens exposed to ethanol and for PP, nylon 6, and terephthalic polyester resin exposed to Fuel C. Ethanol had a pronounced effect on E’ for the HDPEs and the vinyl ester resin. For these materials, Fuel C did not notably affect E’, but exposure to 25% ethanol caused E’ to drop significantly. Terephthalic polyester was unusual in that the Fuel C exposure produced a 22% increase in E’, while CE25a caused a 10% reduction.
7.2 ELASTOMERS
In general there was good to excellent agreement between the predicted solubility behavior (as calculated using Hansen solubility theory) and the actual volume swell measurements. All of the elastomers exhibited high solubility for intermediate levels of ethanol (as predicted by Hansen solubility theory). In most cases the wet volume swell results obtained at 85% ethanol were lower than the observed swell at E0 (or Fuel C). This was especially true for the NBRs, SBR, neoprene, and silicone. In fact, several of the NBRs and SBR, exhibited very low or negligible volume change with exposure to CE85a. In addition, a decrease in wet hardness occurred that was found to roughly correspond with the level of volume swelling.
Following dry-out, only silicone, fluorosilicone, and one fluorocarbon sample (FC#2, 67%F) exhibited properties that returned near the original baseline values. In general, the fluorocarbons exhibited a positive volume change from baseline and a corresponding decline in hardness, and these effects were attributed to the retention of fuel within the fluorocarbon structure. The NBRs, SBR, and neoprene exhibited a hardness increase and volume reduction following dry-out, which indicates that plasticizers had been extracted. For NBRs and neoprene, this extraction was caused by Fuel C, whereas for SBR, ethanol was the component responsible for plasticizer removal.
Further comparison of the wetted to the dried properties indicated that volume swell was not proportional to the dry-out shrinkage and hardness. Several specimens, such as NBR#1, exhibited negligible volume change with exposure to CE85a. The implication is that CE85a is insoluble with NBR#1. However, the dry-out results showed that, in spite of the lack of swell, significant extraction of plasticizer had occurred. A key finding is that volume swell, by itself, does not adequately reflect the ability of a solvent to extract one or more components, and therefore does not necessarily reflect material-fuel compatibility. A cork sample was included in the evaluation and subsequent analysis. This particular type of cork exhibited
59
behavior similar to the elastomers. However, high levels of shrinkage and mass loss were observed following dry-out, and therefore, this cork may not be acceptable in some sealing applications.
7.3 METALS
Bare metal specimens representing a number of materials commonly found in fuel storage and dispensing systems were immersed in CE50a and CE85a at 60°C and exposed to the vapors above these solutions for 28 days. In all cases, the annualized corrosion rates based on uniform weight loss were minor, with all values under 10 µm/year except for that of commercially pure nickel exposed to CE85a (~35 µm/year). Corrosion films were examined with XPS, and the composition and thickness of each were not found to depend on the ethanol content of the test fluid (CE10a to CE85a).
Specimens representing common plated metal combinations were similarly exposed in CE50a and CE85a. In all cases, corrosion was again minor, with zinc from the galvanized steel surfaces being most susceptible to dissolution and corrosion (~40 µm/year in CE85a). Corrosion was accelerated somewhat in CE50a and CE85a by partially exposing the substrate steel of galvanized (zinc) and Terne (lead) plated coupons, and aluminum exposed by removal of nickel plating was found to be susceptible to widespread pitting. In all cases, exposure of the substrate accelerated corrosion due to a combination of galvanic coupling of dissimilar metals and the increased conductivity of the environment (CE50a, CE85a) compared to previously examined test fluids (reference Fuel C, CE10a–CE25a).12
8. REFERENCES
1. Energy Independence and Security Act of 2007: A Summary of Major Provisions, CRS Report for Congress, Order Code RL34294, December 21, 2007.
2. USEPA Website: www.epa.gov/otaq/regs/fuel/additive/e15.#wn
3. M. D. Kass, T. J. Theiss, C. J. Janke, S. J. Pawel, and S. A. Lewis, Intermediate Ethanol Blends Infrastructure Materials Compatibility Study: Elastomers, Metals, and Sealants, Oak Ridge National Laboratory Technical Memorandum ORNL/TM-2010-326, Oak Ridge, TN, March 2011.
4. Society of Automotive Engineers, “Gasoline, Alcohol, and Diesel Fuel Surrogates for Materials Testing,” SAE J1681, issued September 1993, revised January 2000–01.
5. C. M. Hansen, Hansen Solubility Parameters: A User’s Handbook, 2nd Edition, CRC Press, Taylor& Francis Group, Boca Raton, Florida, 2007.
6. Parker O-Ring Handbook, ORD 5700, Parker Hannifin Corporation, Cleveland, Ohio, 2007.
7. Dichtomatik O-Ring Handbook, D. Visscher, Editor, Dichtomatik North America, 47690 East Anchor Court, Plymouth, Michigan.
8. R. Flitney, Seals and Sealing Handbook, 5th Edition, Butterworth-Heinemann Publications, Burlington, MA 2007.
9. K. M. Evans and J. K. Hardy, “Predicting Solubility and Permeation Properties of Organic Solvents in Viton Glove Material Using Hansen’s Solubility Parameters,” Journal of Applied Polymer Science 93(6), 2688–2698 (2004).
10. L. M. Robeson, Polymer Blends, A Comprehensive Review, Hanser Gardner Publications, Inc., Cincinnati, OH, 2007.

60
11. B. Jones, G. Mead, P. Steevens, and C. Connors, The Effects of E20 on Elastomers Used in Automotive Fuel System Components, Minnesota Center for Automotive Research, Minnesota State University, Mankato, February 22, 2008.
12. S. J. Pawel, M. D. Kass, and C. J. Janke, Preliminary Compatibility Assessment of Metallic Dispenser Materials for Service in Ethanol Fuel Blends, Oak Ridge National Laboratory Technical Memorandum ORNL/TM-2009-086, Oak Ridge, TN, November 2009.
13. Metals Handbook, Ninth Edition, Volume 13 (Corrosion), ASM International, Metals Park, OH, 1987, p. 235.