Embed Size (px)
Citation preview
8/11/2019 compatibility studies acyclovir and lactose physical mixtures.pdf
http://slidepdf.com/reader/full/compatibility-studies-acyclovir-and-lactose-physical-mixturespdf 1/10
Research paper
Compatibility studies of acyclovir and lactose in physical mixtures
and commercial tablets
Farnaz Monajjemzadeh a,d, Davoud Hassanzadeh a,e,*, Hadi Valizadeh a,d, Mohammad R. Siahi-Shadbad a,d, Javid Shahbazi Mojarrad b,f , Thomas A. Robertson c, Michael S. Roberts c
a Department of Drug and Food Control, Tabriz University of Medical Sciences, Tabriz, Iranb Department of Medicinal Chemistry, Tabriz University of Medical Sciences, Tabriz, Iranc School of Pharmacy and Medical Sciences, University of South Australia, Adelaide, Australiad Drug Applied Research Center, Tabriz University of Medical Sciences, Tabriz, Irane Research Center for Pharmaceutical Nanotechnology, Tabriz University of Medical Sciences, Tabriz, Iran
f Biotechnology Research Center, Tabriz University of Medical Sciences, Tabriz, Iran
a r t i c l e i n f o
Article history:
Received 27 May 2009
Accepted in revised form 22 June 2009
Available online 23 July 2009
Keywords:
Acyclovir
Solid state
Lactose
Incompatibility
HPLC
FTIR DSC
LC–MS/MS
a b s t r a c t
This study documents drug–excipient incompatibility studies of acyclovir in physical mixtures with lac-
tose and in different tablet brands. Differential scanning calorimetry (DSC) was initially used to assess
compatibility of mixtures. The Fourier-transform infrared (FTIR) spectrum was also compared with the
spectra of pure drug and excipient. Although DSC results indicated incompatibility with lactose, FTIR
spectra were mostly unmodified due to overlapping peaks. Samples of isothermally stressed physical
mixture were stored at 95 C for 24 h. The residual drug was monitored using a validated high-perfor-
mance liquid chromatography (HPLC) assay and data fitting to solid-state kinetic models was performed.
The drug loss kinetics followed a diffusion model. The aqueous mixture of drug and excipient was heated
in order to prepare an adduct mixture. HPLC analysis revealed one extra peak that was fractionated and
subsequently injected into the liquid chromatography–mass spectrometry/mass spectrometry (LC–MS/
MS) system. The MRM (Multiple Reaction Monitoring) chromatograms characterized the peak withmolecular mass corresponding to an acyclovir–lactose Maillard reaction product. The presence of lactose
in commercial tablets was checked using a newTLC method. Overall, the incompatibility of acyclovir with
lactose was successfully evaluated using a combination of thermal methods and LC–MS/MS.
2009 Published by Elsevier B.V.
1. Introduction
The study of drug–excipient compatibility is an important pro-
cess in the development of a stable solid dosage form [1]. A new
chemical entity or drug substance becomes a drug product after
formulation and processing with excipients [2]. Incompatibility be-
tween drugs and excipients can alter the stability and bioavailabil-
ity of drugs, thereby affecting its safety and/or efficacy. Despite theimportance of this issue, there is no universally accepted protocol
for drug–excipient compatibility testing [1,2]. In recent years, ther-
mal analysis has been used in the development and improvement
of pharmaceutical formulations [3,4]. Thermogravimetric analysis
(TGA) and differential scanning calorimetry (DSC) are the most
commonly used thermal techniques in drug–excipient compatibil-
ity assessments [1,5,6]. Isothermal stress testing (IST) is another
method that involves storing the drug–excipient blends with or
without moisture at high temperature and determining the drug
content [2,7,8]. One of the IST methods adopted by Serajuddin
et al. [2] involved the storage of formulated samples with 20%
v/w added water at 50 C for 1–3 weeks. Later, Sims et al. modified
their method to a more rapid one by changing the storage temper-
ature and time to 100 C and 1–3 days, respectively. DSC can be
used in combination with IST to evaluate compatibility of drugs
with the selected excipients [1,9].Fourier-transform infrared (FTIR) spectroscopy is another ap-
proach used in compatibility tests based on the hypothesis that
some functional groups change during drug–excipient interaction
[5,10,11].
In the most detailed studies, degradation products can also be
identified by mass spectral, NMR, and other relevant analytical
techniques [2,11–14]. The identification of degradation products
in dosage formulations plays an important role in the drug devel-
opment process. During the past decade, with the commercializa-
tion of mass spectrometers using soft ionization techniques such as
electrospray ionization (ESI) and atmospheric pressure chemical
ionization (APCI), the coupling of high-performance liquid chroma-
0939-6411/$ - see front matter 2009 Published by Elsevier B.V.doi:10.1016/j.ejpb.2009.06.012
* Corresponding author. Department of Drug and Food Analysis, Tabriz University
of Medical Sciences, Tabriz, Iran. Tel.: +98 411 339 2614; fax: +98 411 334 4798.
E-mail addresses: [email protected], [email protected] (D.
Hassanzadeh).
European Journal of Pharmaceutics and Biopharmaceutics 73 (2009) 404–413
Contents lists available at ScienceDirect
European Journal of Pharmaceutics and Biopharmaceutics
j o u r n a l h o m e p a g e : w w w . e l s e v i e r . c o m / l o c a t e / e j p b
8/11/2019 compatibility studies acyclovir and lactose physical mixtures.pdf
http://slidepdf.com/reader/full/compatibility-studies-acyclovir-and-lactose-physical-mixturespdf 2/10
tography (HPLC) and mass spectrometry (MS) has become one of
the most powerful techniques for pharmaceutical analysis. The
separation by time provided by an HPLC system combined with a
mass spectrometer enables a chemist to acquire the structural
information of a specific impurity or degrade without a time-
consuming isolation process. Liquid chromatography–mass spec-
trometry (LC–MS) analysis is very sensitive for the detection of
low-level unknowns in complex mixtures such as formulations.
The great advantage of an LC–MS system is largely based on the
fact that soft ionization techniques usually provide molecular
weight information for the analytes. In general, protonated, ammo-
niated and sometimes sodiated molecules are produced in the
positive ion mode, while deprotonated molecules are generated
in the negative ion mode. Furthermore, these pseudomolecular
ions often produce structurally informative fragment ions via col-
lision-induced dissociation (CID) processes. Fragments of fragment
ions can also be collected using tandem mass spectrometry [15].
The kinetics of the reaction in the solid state is considerably
more complicated than in the case of solution-phase kinetics. First,
a solid system is inherently non-homogenous making the reaction
dependent on the physical configuration of the system and not
only dependent on its composition at any given time. Secondly,
molecules in the solid state have significantly more limited molec-
ular mobility than molecules in solution [13]. Solid-state kinetic
studies have appeared in the pharmaceutical literature over many
years and can be mechanistically classified as nucleation, geomet-
rical contraction, diffusion and reaction order models [16,17].
Lactose (molecular weight, MW = 342.3) is one of the most
commonly used pharmaceutical excipients. A survey of the Physi-
cian’s Desk Reference database shows that there are many pharma-
ceutical formulations where amino compounds and lactose are
both present [13,18]. Recently, the possible reaction of the amine
groups of drug entities with the carbonyl groups of common tablet
excipients, such as lactose, starch and cellulose, has gained the
interest of pharmaceutical scientists [12–14,19–21].
An acyclic nucleoside acyclovir (MW = 225.2) is used in the
treatment of varicella infections and prophylaxis of herpes simplexinfections. Acyclovir is an amine-containing drug, which makes it a
good candidate for the Maillard reaction with a reducing agent like
lactose [22]. Tu et al. increased the liver distribution of acyclovir
using an acyclovir–dextran conjugate, which was synthesized by
the formation of a Schiff base [23]. Later, Desai et al. studied the
stability of low concentrations of three guanine-based antivirals
(entecavir, lobucavir and acyclovir) in sucrose and maltitol solu-
tions and concluded that the formation of isomeric adducts of
the drugs and reducing sugars [24] occurs.
All previous investigations have been conducted in solutions,
and the possibility of the acyclovir–lactose reaction has not yet
been investigated.
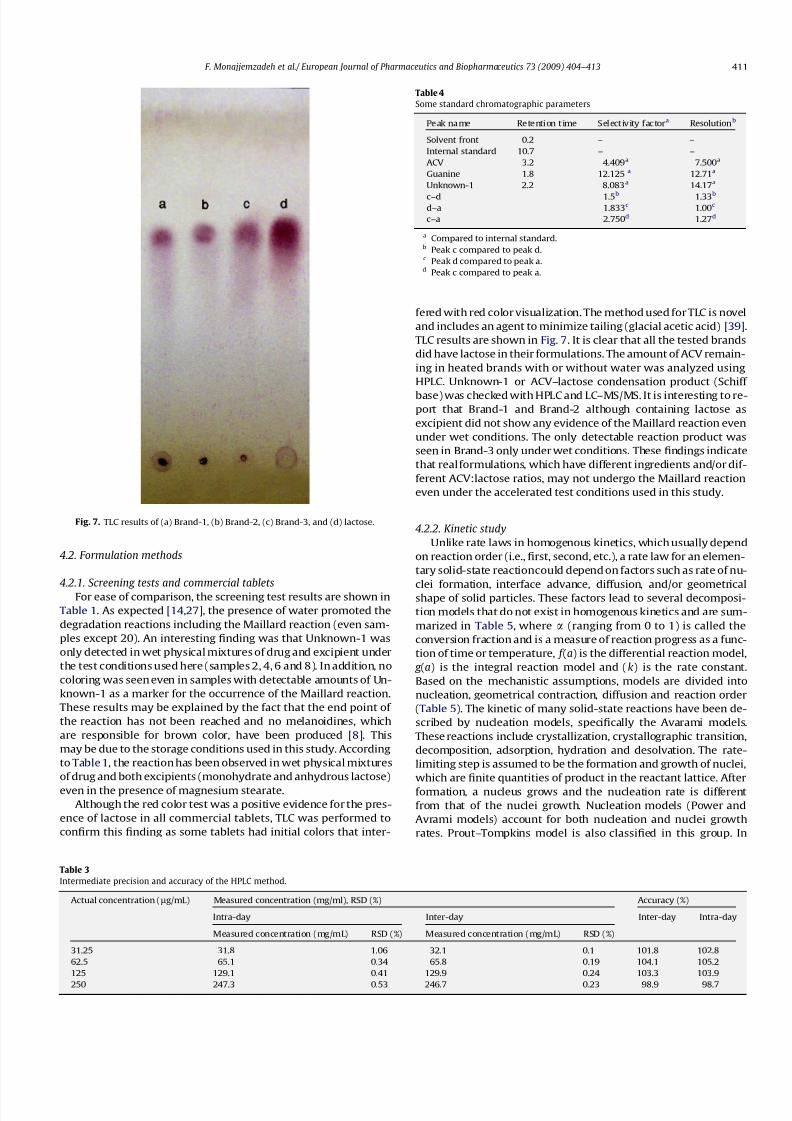
In this report, we focus on the determination of the early-stage
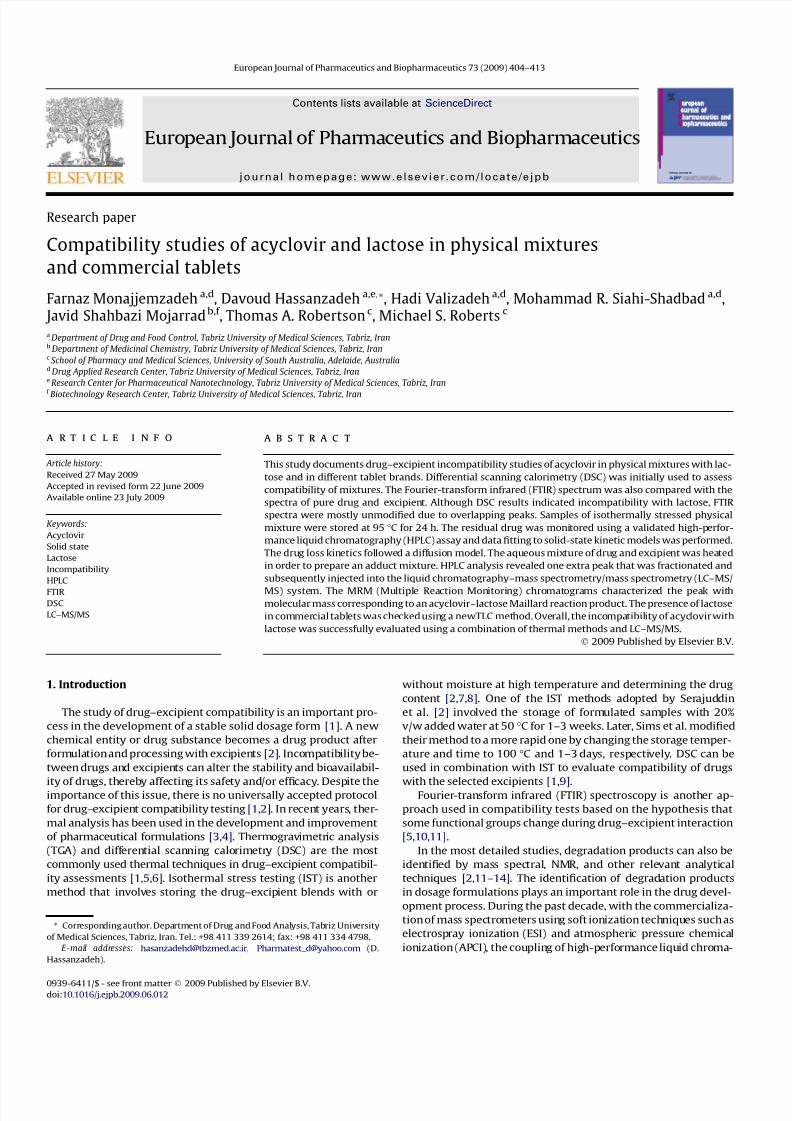
Maillard reaction products (ESMRP) between the amine-containingantiviral acyclovir (ACV) and lactose (Fig. 1) in solid-state mixtures
and tablet brands. For this purpose, the adduct mixture was ana-
lyzed using HPLC, FTIR and LC–MS/MS. Thin layer chromatography
(TLC) was also used to confirm the presence of lactose in brand for-
mulations. Finally, acyclovir loss data with or without lactose were
fitted to common solid-state kinetic models.
2. Materials and methods
2.1. Materials
Acyclovir (ACV) (2-amino-1,9-dihydro-9-(2-hydroxyethoxym-
ethyl)-6H-purin-6-one) and guanine (2-amino-1,7-dihydro-6H-purin-6-one) (acyclovir related compound) were obtained from
Arastoo Pharmaceutical Chemicals Incorp., Tehran, Iran (Fig. 1).
Lactose monohydrate (Pharma grade 200 Mesh) and anhydrous
lactose were provided from DMV Chemical Co., Netherlands. Acet-aminophen was received from Sigma Aldrich. All other chemicals
were of HPLC or analytical grade and obtained from Labscan ana-
lytical science, Ireland. Commercial tablets of ACV named Brand-
1–3 were acquired in Iran and Australia from local pharmacies.
3. Methods
3.1. Analytical methods
3.1.1. DSC (differential scanning calorimetry)
A differential scanning calorimeter (DSC-60, Shimadzu, Japan)
was used for thermal analysis of drug and mixtures of drug and
excipient in a 1:1 w/w ratio. Individual samples (drug and excipi-
ents) as well as physical mixtures of drug and excipients wereweighed to about 5 mg in the DSC aluminum pan and scanned in
the temperature range of 25–300C. A heating rate of 20 C per
minute was used, and the thermograms were reviewed for evi-
dence of any interaction. Enthalpy calculations were completed
using TA-60 software (version 1.51).
3.1.2. FTIR (Fourier-transform infrared) spectroscopy
FTIR spectra of drug and drug–excipient blends were recorded
immediately after mixing and/or heating on an FTIR spectropho-
tometer (Bomem, MB-100 series, Quebec, Canada) in the range of
400–4000 cm1 using potassium bromide discs. The spectrum
was a mean of ten consecutive scans on the same sample. Process-
ing of the FTIR data was performed using GRAMS/32 version 3.04
(Galactic Industries Corporation, Salem, NH).
3.1.3. HPLC
The HPLC system consisted of a SCL-10A XL auto injector, SCL-
10A VP system controller, LC-10AT liquid chromatograph and a
SPD-M10AVP, UV–Vis, photodiode array (PDA) detector and a
FRC-10A fraction collector, all from Shimadzu (Kyoto, Japan). Sam-
ples were injected onto a C18 column (100 mm, 4.60 mm, 5 lm;
Agilent, USA) maintained at ambient temperature. The two eluting
solutions used were A (Deionized water) and B (a mixture of ace-
tonitrile:water:formic acid (95:5:0.1 v/v)). Mobile phase was a
mixture of B and A (5:95, v/v). A volume of 1 mL/min was used
as the flow rate, and detection was performed at 250 nm. Data
were analyzed with Class VP software (version: 6.14 SP1). A solu-
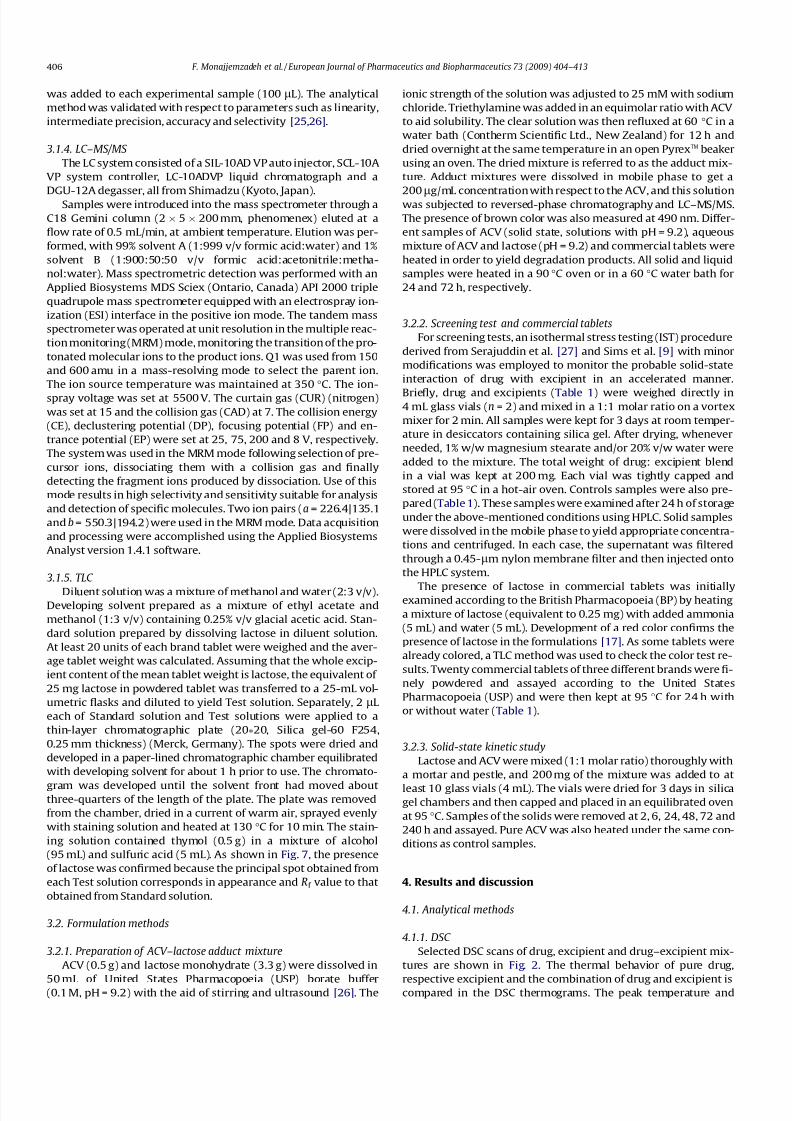
tion of Acetaminophen (4 mg/mL in mobile phase) was used asthe internal standard (Fig. 1). Internal standard solution (10 lL)
Fig. 1. Structures of (A) ACV, (B) Acetaminophen, (C) Guanine, and (D) Lactose.
F. Monajjemzadeh et al./ European Journal of Pharmaceutics and Biopharmaceutics 73 (2009) 404–413 405
8/11/2019 compatibility studies acyclovir and lactose physical mixtures.pdf
http://slidepdf.com/reader/full/compatibility-studies-acyclovir-and-lactose-physical-mixturespdf 3/10
was added to each experimental sample (100 lL). The analytical
method was validated with respect to parameters such as linearity,
intermediate precision, accuracy and selectivity [25,26].
3.1.4. LC–MS/MS
The LC system consisted of a SIL-10AD VP auto injector, SCL-10A
VP system controller, LC-10ADVP liquid chromatograph and a
DGU-12A degasser, all from Shimadzu (Kyoto, Japan).
Samples were introduced into the mass spectrometer through a
C18 Gemini column (2 5 200 mm, phenomenex) eluted at a
flow rate of 0.5 mL/min, at ambient temperature. Elution was per-
formed, with 99% solvent A (1:999 v/v formic acid:water) and 1%
solvent B (1:900:50:50 v/v formic acid:acetonitrile:metha-
nol:water). Mass spectrometric detection was performed with an
Applied Biosystems MDS Sciex (Ontario, Canada) API 2000 triple
quadrupole mass spectrometer equipped with an electrospray ion-
ization (ESI) interface in the positive ion mode. The tandem mass
spectrometer was operated at unit resolution in the multiple reac-
tion monitoring (MRM) mode, monitoring the transition of the pro-
tonated molecular ions to the product ions. Q1 was used from 150
and 600 amu in a mass-resolving mode to select the parent ion.
The ion source temperature was maintained at 350 C. The ion-
spray voltage was set at 5500 V. The curtain gas (CUR) (nitrogen)
was set at 15 and the collision gas (CAD) at 7. The collision energy
(CE), declustering potential (DP), focusing potential (FP) and en-
trance potential (EP) were set at 25, 75, 200 and 8 V, respectively.
The system was used in the MRM mode following selection of pre-
cursor ions, dissociating them with a collision gas and finally
detecting the fragment ions produced by dissociation. Use of this
mode results in high selectivity and sensitivity suitable for analysis
and detection of specific molecules. Two ion pairs (a = 226.4|135.1
and b = 550.3|194.2) were used in the MRM mode. Data acquisition
and processing were accomplished using the Applied Biosystems
Analyst version 1.4.1 software.
3.1.5. TLC
Diluent solution was a mixture of methanol and water (2:3 v/v).Developing solvent prepared as a mixture of ethyl acetate and
methanol (1:3 v/v) containing 0.25% v/v glacial acetic acid. Stan-
dard solution prepared by dissolving lactose in diluent solution.
At least 20 units of each brand tablet were weighed and the aver-
age tablet weight was calculated. Assuming that the whole excip-
ient content of the mean tablet weight is lactose, the equivalent of
25 mg lactose in powdered tablet was transferred to a 25-mL vol-
umetric flasks and diluted to yield Test solution. Separately, 2 lL
each of Standard solution and Test solutions were applied to a
thin-layer chromatographic plate (2020, Silica gel-60 F254,
0.25 mm thickness) (Merck, Germany). The spots were dried and
developed in a paper-lined chromatographic chamber equilibrated
with developing solvent for about 1 h prior to use. The chromato-
gram was developed until the solvent front had moved aboutthree-quarters of the length of the plate. The plate was removed
from the chamber, dried in a current of warm air, sprayed evenly
with staining solution and heated at 130 C for 10 min. The stain-
ing solution contained thymol (0.5 g) in a mixture of alcohol
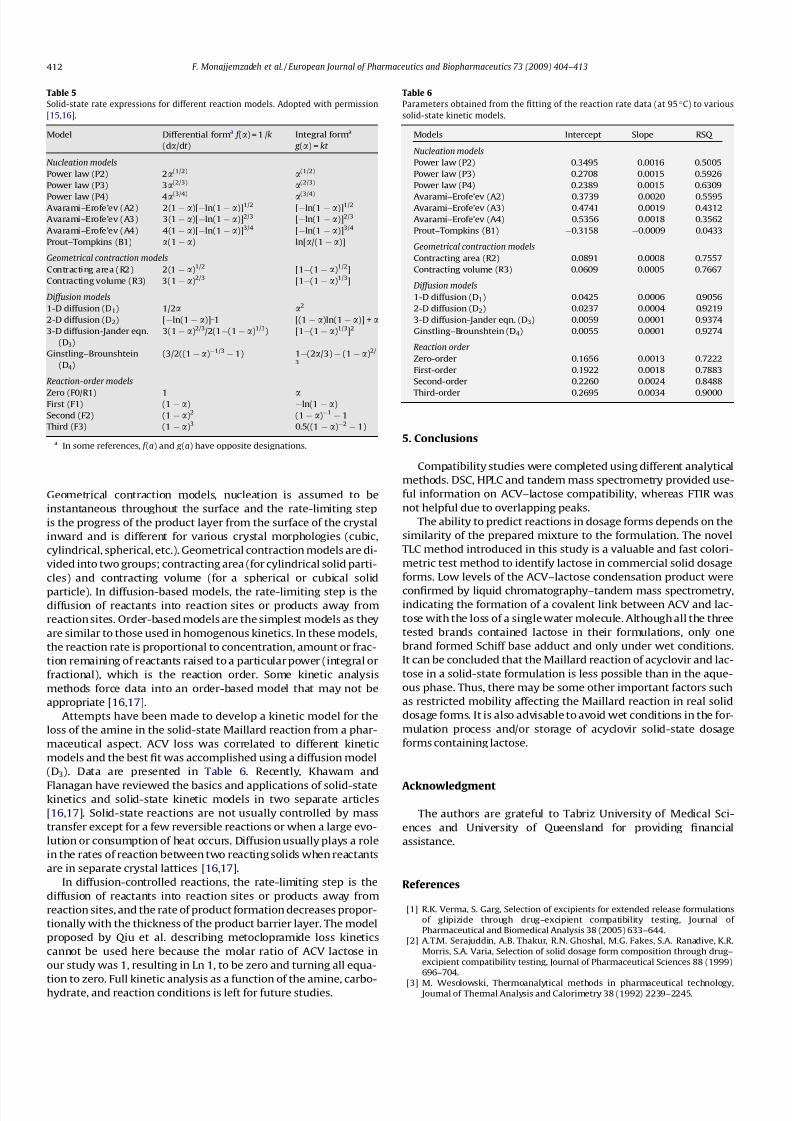
(95 mL) and sulfuric acid (5 mL). As shown in Fig. 7, the presence
of lactose was confirmed because the principal spot obtained from
each Test solution corresponds in appearance and Rf value to that
obtained from Standard solution.
3.2. Formulation methods
3.2.1. Preparation of ACV–lactose adduct mixture
ACV (0.5 g) and lactose monohydrate (3.3 g) were dissolved in
50 mL of United States Pharmacopoeia (USP) borate buffer(0.1 M, pH = 9.2) with the aid of stirring and ultrasound [26]. The
ionic strength of the solution was adjusted to 25 mM with sodium
chloride. Triethylamine was added in an equimolar ratio with ACV
to aid solubility. The clear solution was then refluxed at 60 C in a
water bath (Contherm Scientific Ltd., New Zealand) for 12 h and
dried overnight at the same temperature in an open PyrexTM beaker
using an oven. The dried mixture is referred to as the adduct mix-
ture. Adduct mixtures were dissolved in mobile phase to get a
200l
g/mL concentration with respect to the ACV, and this solution
was subjected to reversed-phase chromatography and LC–MS/MS.
The presence of brown color was also measured at 490 nm. Differ-
ent samples of ACV (solid state, solutions with pH = 9.2), aqueous
mixture of ACV and lactose (pH = 9.2) and commercial tablets were
heated in order to yield degradation products. All solid and liquid
samples were heated in a 90 C oven or in a 60 C water bath for
24 and 72 h, respectively.
3.2.2. Screening test and commercial tablets
For screening tests, an isothermal stress testing (IST) procedure
derived from Serajuddin et al. [27] and Sims et al. [9] with minor
modifications was employed to monitor the probable solid-state
interaction of drug with excipient in an accelerated manner.
Briefly, drug and excipients (Table 1) were weighed directly in4 mL glass vials (n = 2) and mixed in a 1:1 molar ratio on a vortex
mixer for 2 min. All samples were kept for 3 days at room temper-
ature in desiccators containing silica gel. After drying, whenever
needed, 1% w/w magnesium stearate and/or 20% v/w water were
added to the mixture. The total weight of drug: excipient blend
in a vial was kept at 200 mg. Each vial was tightly capped and
stored at 95 C in a hot-air oven. Controls samples were also pre-
pared (Table 1). These samples were examined after 24 h of storage
under the above-mentioned conditions using HPLC. Solid samples
were dissolved in the mobile phase to yield appropriate concentra-
tions and centrifuged. In each case, the supernatant was filtered
through a 0.45-lm nylon membrane filter and then injected onto
the HPLC system.
The presence of lactose in commercial tablets was initiallyexamined according to the British Pharmacopoeia (BP) by heating
a mixture of lactose (equivalent to 0.25 mg) with added ammonia
(5 mL) and water (5 mL). Development of a red color confirms the
presence of lactose in the formulations [17]. As some tablets were
already colored, a TLC method was used to check the color test re-
sults. Twenty commercial tablets of three different brands were fi-
nely powdered and assayed according to the United States
Pharmacopoeia (USP) and were then kept at 95 C for 24 h with
or without water (Table 1).
3.2.3. Solid-state kinetic study
Lactose and ACV were mixed (1:1 molar ratio) thoroughly with
a mortar and pestle, and 200 mg of the mixture was added to at
least 10 glass vials (4 mL). The vials were dried for 3 days in silicagel chambers and then capped and placed in an equilibrated oven
at 95 C. Samples of the solids were removed at 2, 6, 24, 48, 72 and
240 h and assayed. Pure ACV was also heated under the same con-
ditions as control samples.
4. Results and discussion
4.1. Analytical methods
4.1.1. DSC
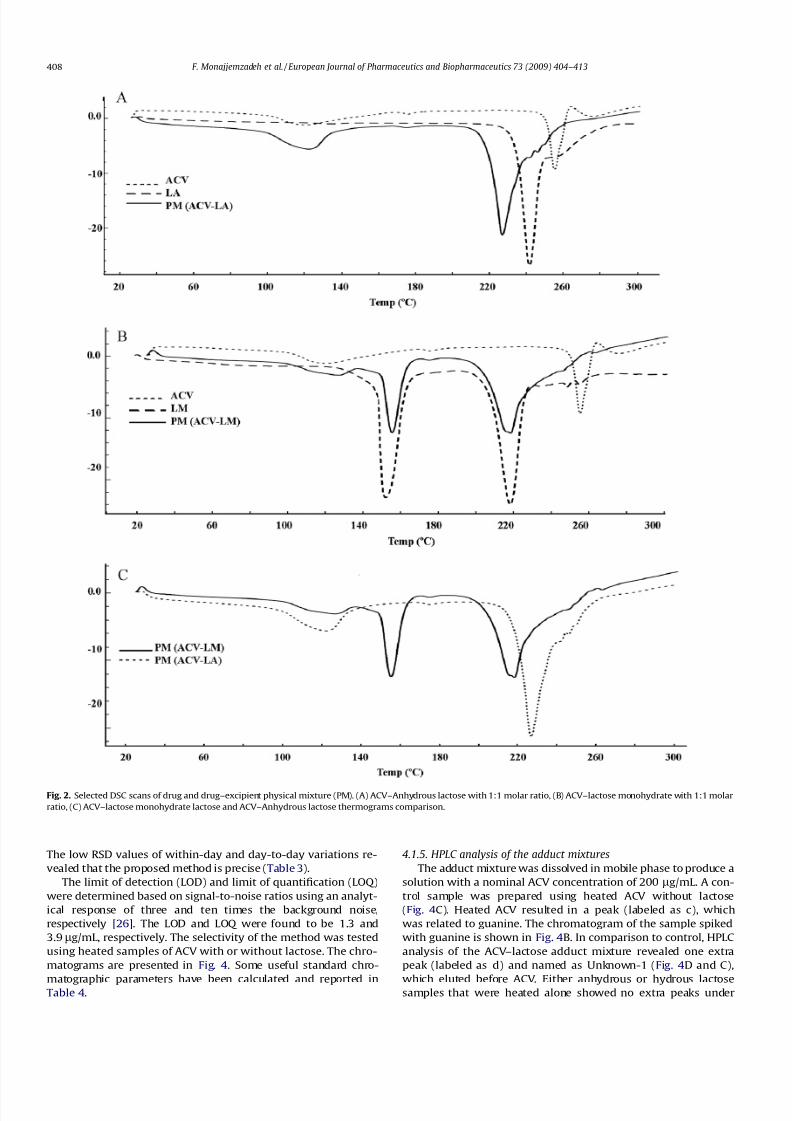
Selected DSC scans of drug, excipient and drug–excipient mix-
tures are shown in Fig. 2. The thermal behavior of pure drug,
respective excipient and the combination of drug and excipient iscompared in the DSC thermograms. The peak temperature and
406 F. Monajjemzadeh et al. / European Journal of Pharmaceutics and Biopharmaceutics 73 (2009) 404–413
8/11/2019 compatibility studies acyclovir and lactose physical mixtures.pdf
http://slidepdf.com/reader/full/compatibility-studies-acyclovir-and-lactose-physical-mixturespdf 4/10
heat of fusion or enthalpy values for drug, excipient and drug–
excipient mixture are summarized in Table 2.
The ACV presented its melting point at (255.27 C) and heat of
fusion of (46.75 J/g). The endothermic peak of anhydrous lactose
was at 241.72 C in the pure sample. The melting endothermic
peak of ACV was missing in the ACV–anhydrous lactose mixture,
which suggested incompatibility (Fig. 2A). A new endothermic
peak also appeared at 227 C (starting from 205.53 C and ending
at 259.34 C), which may be due to drug and excipient
incompatibility.The monohydrate lactose showed two peaks: one due to dehy-
dration at (152.7 C) and the second peak related to the melting
point at (218.38 C) (Fig. 2B). The lactose melting peak (218 C)
was characteristic of a monohydrate a-lactose form [6]. In the
DSC thermogram of ACV, in the presence of lactose monohydrate,
the ACV melting peak was missing, which can be related to the
drug and excipient interaction. It should be noted that the peak
at 277.04 C in the ACV and anhydrous lactose mixture was not ob-
served in this sample. The second peak in the ACV–lactose mono-
hydrate thermogram (Fig. 2B) at 218.58 C starts nearly at the
same point as the second peak of pure lactose monohydrate
(218.38 C), but ends almost differently at the later time
(253.57 C vs. 229.05 C). This finding indicates that the broad peak
that appeared at 218.58 C in the ACV–lactose monohydrate mix-ture is not the same as the peak in the pure lactose sample and
may conceal another peak (Fig. 2C). According to Table 2, this
can be proved as the DH value for this peak in the pure sample
is 137.68 J/g, but in the mixture increases to 314.62 J/g. Thus, it
can also be concluded that there is an incompatibility between
ACV and monohydrate lactose.
4.1.2. FTIR
The absorption pattern of ACV, lactose, ACV–lactose blends
immediately after mixing, and adducts mixture of drug and excip-
ientis shown in Fig. 3a–d, respectively. The possible interaction be-
tween ACV and lactose can be proposed to be a Maillard type
reaction, which would lead to imine band formation in the FTIR
spectrum. The C@
N stretching band appears at 1630–1650 cm1
in the infrared spectra of imine-containing compounds [26,28–
30] including the Schiff’s base, which would form in a Maillard
reaction. The absorption band at about 1723 cm1 in Fig. 3a and
c is consistent with the ACV carboxylic acid functional group vibra-
tion (Fig. 6b). The only difference seen between the adduct mixture
and pure drug is a visible shift of this band to 1688 cm1, which
can be related to intermolecular hydrogen bonding. Shepherd
et al. have reported a similar shift in IR spectra of ACV [31]. Accord-
ing to the FTIR results, no interaction between ACV and lactose can
be detected. This finding can be explained by common phenome-
non of peak overlapping in IR spectroscopy as the absorption re-gion of the expected imine and the carboxylic group overlaps.
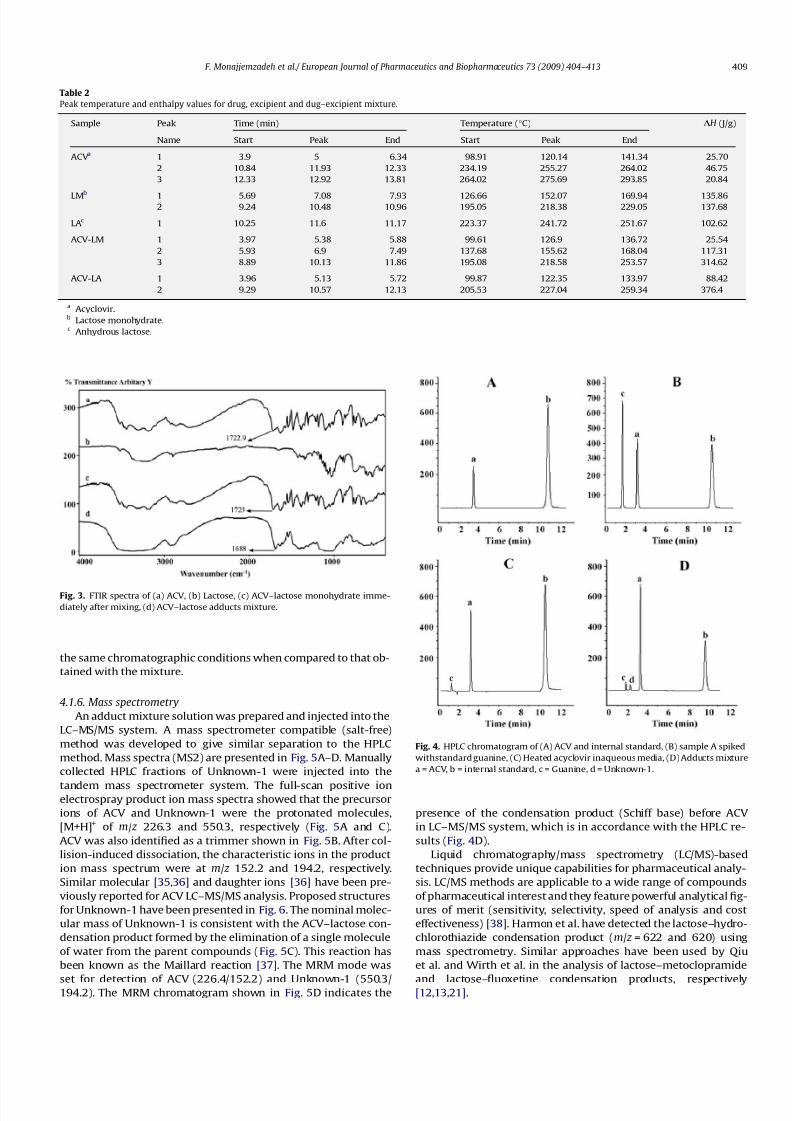
4.1.3. HPLC
Although different HPLC methods have been used in ACV iden-
tification, only a small number have been performed using an
internal standard. Guanine, vanillin and salicylic acid are used in
this study [32–34]. The previous methods using these internal
standards were not looking for the Maillardreaction productof lac-
tose and ACV, and our results also indicated that the Maillard reac-
tion product peak did not separate using these methods.
Acetaminophen was tried as a new internal standard and accept-
able results were produced. The ACV and internal standard chro-
matogram are presented in Fig. 4A.
4.1.4. HPLC method validation
The standard solutions for the linearity test were prepared five
times at different concentration levels. Peak area ratios of ACV to
internal standard were calculated and plotted versus respective
concentrations, and a linear regression analysis was performed.
The constructed calibration curve was linear over the concentra-
tion range of 0.98–250 lg/mL. The correlation coefficient was
found to be more than 0.999 with relative standard deviation
(RSD) values ranging from 0.21% to 2.08% within the concentration
ranges studied. Repeatability of measurement of the peak area was
carried out using seven replicates of the same concentration
(200 lg/mL). The RSD was found to be 0.23%.
Theintra-and inter-day precision of themethod were carriedoutat four different concentrations (31.25, 62.5, 125 and 250 lg/mL).
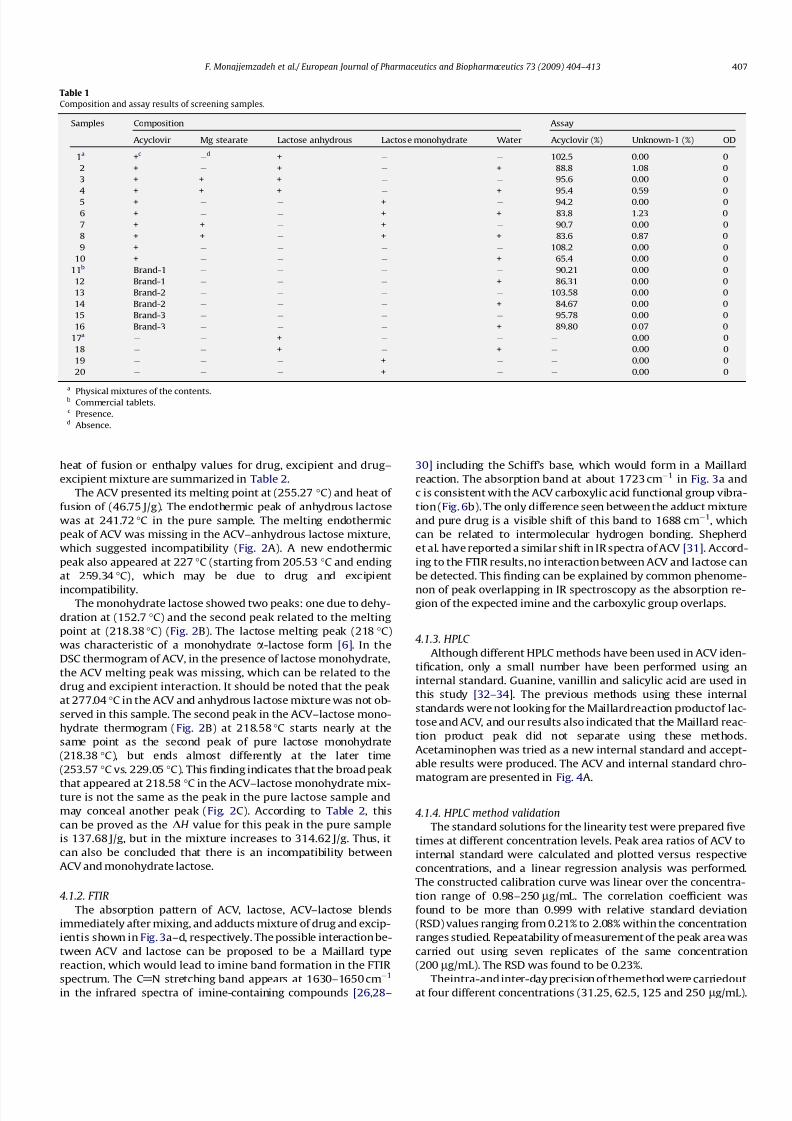
Table 1
Composition and assay results of screening samples.
Samples Composition Assay
Acyclovir Mg stearate Lactose anhydrous Lactose monohydrate Water Acyclovir (%) Unknown-1 (%) OD
1a +c
d + 102.5 0.00 0
2 + + + 88.8 1.08 0
3 + + + 95.6 0.00 0
4 + + + + 95.4 0.59 0
5 + + 94.2 0.00 0
6 + + + 83.8 1.23 0
7 + + + 90.7 0.00 0
8 + + + + 83.6 0.87 0
9 + 108.2 0.00 0
10 + + 65.4 0.00 0
11b Brand-1 90.21 0.00 0
12 Brand-1 + 86.31 0.00 0
13 Brand-2 103.58 0.00 0
14 Brand-2 + 84.67 0.00 0
15 Brand-3 95.78 0.00 0
16 Brand-3 + 89.80 0.07 0
17a + 0.00 0
18 + + 0.00 0
19 + 0.00 0
20 + 0.00 0
a
Physical mixtures of the contents.b Commercial tablets.c Presence.d Absence.
F. Monajjemzadeh et al./ European Journal of Pharmaceutics and Biopharmaceutics 73 (2009) 404–413 407
8/11/2019 compatibility studies acyclovir and lactose physical mixtures.pdf
http://slidepdf.com/reader/full/compatibility-studies-acyclovir-and-lactose-physical-mixturespdf 5/10
The low RSD values of within-day and day-to-day variations re-
vealed that the proposed method is precise (Table 3).
The limit of detection (LOD) and limit of quantification (LOQ)
were determined based on signal-to-noise ratios using an analyt-
ical response of three and ten times the background noise,
respectively [26]. The LOD and LOQ were found to be 1.3 and
3.9lg/mL, respectively. The selectivity of the method was tested
using heated samples of ACV with or without lactose. The chro-
matograms are presented in Fig. 4. Some useful standard chro-
matographic parameters have been calculated and reported inTable 4.
4.1.5. HPLC analysis of the adduct mixtures
The adduct mixture was dissolved in mobile phase to produce a
solution with a nominal ACV concentration of 200 lg/mL. A con-
trol sample was prepared using heated ACV without lactose
(Fig. 4C). Heated ACV resulted in a peak (labeled as c), which
was related to guanine. The chromatogram of the sample spiked
with guanine is shown in Fig. 4B. In comparison to control, HPLC
analysis of the ACV–lactose adduct mixture revealed one extra
peak (labeled as d) and named as Unknown-1 (Fig. 4D and C),
which eluted before ACV. Either anhydrous or hydrous lactosesamples that were heated alone showed no extra peaks under
Fig. 2. Selected DSC scans of drug and drug–excipient physical mixture (PM). (A) ACV–Anhydrous lactose with 1:1 molar ratio, (B) ACV–lactose monohydrate with 1:1 molar
ratio, (C) ACV–lactose monohydrate lactose and ACV–Anhydrous lactose thermograms comparison.
408 F. Monajjemzadeh et al. / European Journal of Pharmaceutics and Biopharmaceutics 73 (2009) 404–413
8/11/2019 compatibility studies acyclovir and lactose physical mixtures.pdf
http://slidepdf.com/reader/full/compatibility-studies-acyclovir-and-lactose-physical-mixturespdf 6/10
8/11/2019 compatibility studies acyclovir and lactose physical mixtures.pdf
http://slidepdf.com/reader/full/compatibility-studies-acyclovir-and-lactose-physical-mixturespdf 7/10
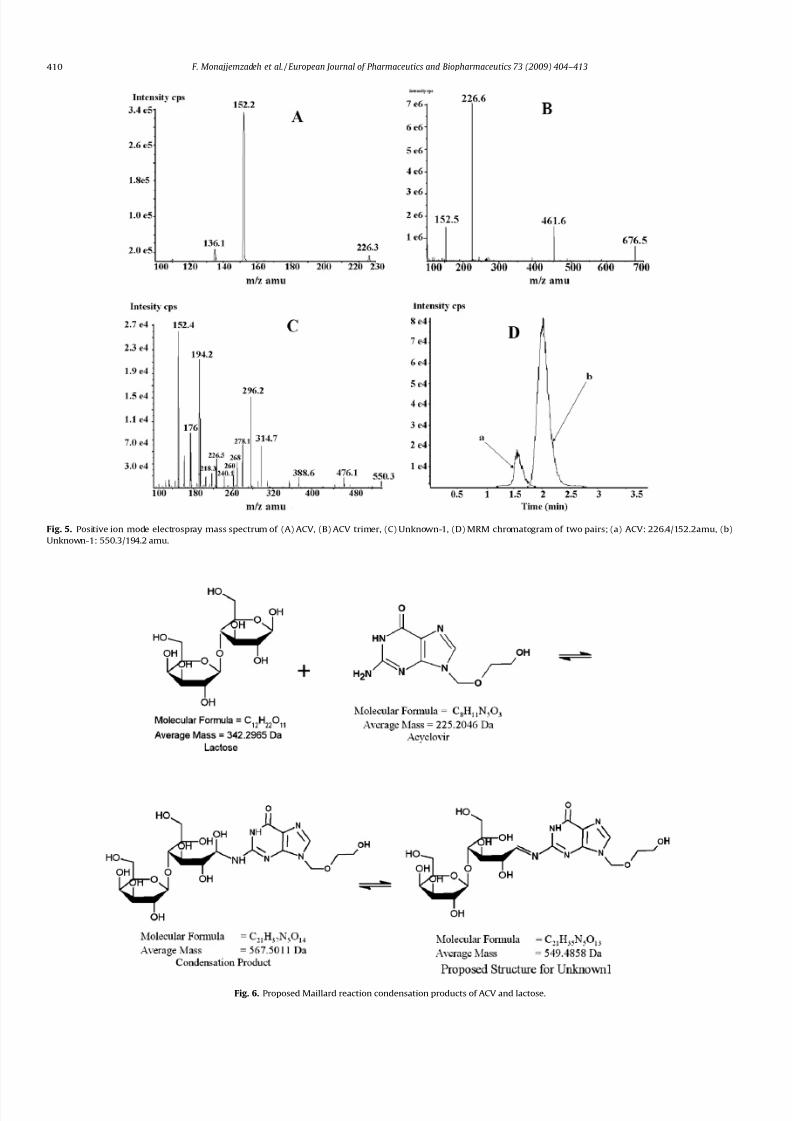
Fig. 5. Positive ion mode electrospray mass spectrum of (A) ACV, (B) ACV trimer, (C) Unknown-1, (D) MRM chromatogram of two pairs; (a) ACV: 226.4/152.2amu, (b)
Unknown-1: 550.3/194.2 amu.
Fig. 6. Proposed Maillard reaction condensation products of ACV and lactose.
410 F. Monajjemzadeh et al. / European Journal of Pharmaceutics and Biopharmaceutics 73 (2009) 404–413
8/11/2019 compatibility studies acyclovir and lactose physical mixtures.pdf
http://slidepdf.com/reader/full/compatibility-studies-acyclovir-and-lactose-physical-mixturespdf 8/10
4.2. Formulation methods
4.2.1. Screening tests and commercial tablets
For ease of comparison, the screening test results are shown in
Table 1. As expected [14,27], the presence of water promoted the
degradation reactions including the Maillard reaction (even sam-
ples except 20). An interesting finding was that Unknown-1 was
only detected in wet physical mixtures of drug and excipient under
the test conditions used here (samples 2, 4, 6 and 8). In addition, no
coloring was seen even in samples with detectable amounts of Un-
known-1 as a marker for the occurrence of the Maillard reaction.
These results may be explained by the fact that the end point of
the reaction has not been reached and no melanoidines, which
are responsible for brown color, have been produced [8]. This
may be due to the storage conditions used in this study. According
to Table 1, the reaction has been observed in wet physical mixtures
of drug and both excipients (monohydrate and anhydrous lactose)
even in the presence of magnesium stearate.
Although the red color test was a positive evidence for the pres-
ence of lactose in all commercial tablets, TLC was performed to
confirm this finding as some tablets had initial colors that inter-
fered with red color visualization. The method used for TLC is novel
and includes an agent to minimize tailing (glacial acetic acid) [39].
TLC results are shown in Fig. 7. It is clear that all the tested brands
did have lactose in their formulations. The amount of ACV remain-
ing in heated brands with or without water was analyzed using
HPLC. Unknown-1 or ACV–lactose condensation product (Schiff
base) was checked with HPLC and LC–MS/MS. It is interesting to re-port that Brand-1 and Brand-2 although containing lactose as
excipient did not show any evidence of the Maillard reaction even
under wet conditions. The only detectable reaction product was
seen in Brand-3 only under wet conditions. These findings indicate
that real formulations, which have different ingredients and/or dif-
ferent ACV:lactose ratios, may not undergo the Maillard reaction
even under the accelerated test conditions used in this study.
4.2.2. Kinetic study
Unlike rate laws in homogenous kinetics, which usually depend
on reaction order (i.e., first, second, etc.), a rate law for an elemen-
tary solid-state reactioncould depend on factors such as rate of nu-
clei formation, interface advance, diffusion, and/or geometricalshape of solid particles. These factors lead to several decomposi-
tion models that do not exist in homogenous kinetics and are sum-
marized in Table 5, where a (ranging from 0 to 1) is called the
conversion fraction and is a measure of reaction progress as a func-
tion of time or temperature, f (a) is the differential reaction model,
g (a) is the integral reaction model and (k) is the rate constant.
Based on the mechanistic assumptions, models are divided into
nucleation, geometrical contraction, diffusion and reaction order
(Table 5). The kinetic of many solid-state reactions have been de-
scribed by nucleation models, specifically the Avarami models.
These reactions include crystallization, crystallographic transition,
decomposition, adsorption, hydration and desolvation. The rate-
limiting step is assumed to be the formation and growth of nuclei,
which are finite quantities of product in the reactant lattice. After
formation, a nucleus grows and the nucleation rate is different
from that of the nuclei growth. Nucleation models (Power and
Avrami models) account for both nucleation and nuclei growth
rates. Prout–Tompkins model is also classified in this group. In
Fig. 7. TLC results of (a) Brand-1, (b) Brand-2, (c) Brand-3, and (d) lactose.
Table 3
Intermediate precision and accuracy of the HPLC method.
Actual concentration (lg/mL) Measured concentration (mg/ml), RSD (%) Accuracy (%)
Intra-day Inter-day Inter-day Intra-day
Measured concentration (mg/mL) RSD (%) Measured concentration (mg/mL) RSD (%)
31.25 31.8 1.06 32.1 0.1 101.8 102.8
62.5 65.1 0.34 65.8 0.19 104.1 105.2
125 129.1 0.41 129.9 0.24 103.3 103.9
250 247.3 0.53 246.7 0.23 98.9 98.7
Table 4
Some standard chromatographic parameters
Peak name Retention time Selectivity factora Resolutionb
Solvent front 0.2 – –
Internal standard 10.7 – –
ACV 3.2 4.409a 7.500a
Guanine 1.8 12.125 a 12.71a
Unknown-1 2.2 8.083a 14.17a
c–d 1.5b 1.33b
d–a 1.833c 1.00c
c–a 2.750d 1.27d
a Compared to internal standard.b Peak c compared to peak d.c Peak d compared to peak a.d Peak c compared to peak a.
F. Monajjemzadeh et al./ European Journal of Pharmaceutics and Biopharmaceutics 73 (2009) 404–413 411
8/11/2019 compatibility studies acyclovir and lactose physical mixtures.pdf
http://slidepdf.com/reader/full/compatibility-studies-acyclovir-and-lactose-physical-mixturespdf 9/10
Geometrical contraction models, nucleation is assumed to be
instantaneous throughout the surface and the rate-limiting step
is the progress of the product layer from the surface of the crystal
inward and is different for various crystal morphologies (cubic,
cylindrical, spherical, etc.). Geometrical contraction models are di-
vided into two groups; contracting area (for cylindrical solid parti-
cles) and contracting volume (for a spherical or cubical solid
particle). In diffusion-based models, the rate-limiting step is thediffusion of reactants into reaction sites or products away from
reaction sites. Order-based models are the simplest models as they
are similar to those used in homogenous kinetics. In these models,
the reaction rate is proportional to concentration, amount or frac-
tion remaining of reactants raised to a particular power (integral or
fractional), which is the reaction order. Some kinetic analysis
methods force data into an order-based model that may not be
appropriate [16,17].
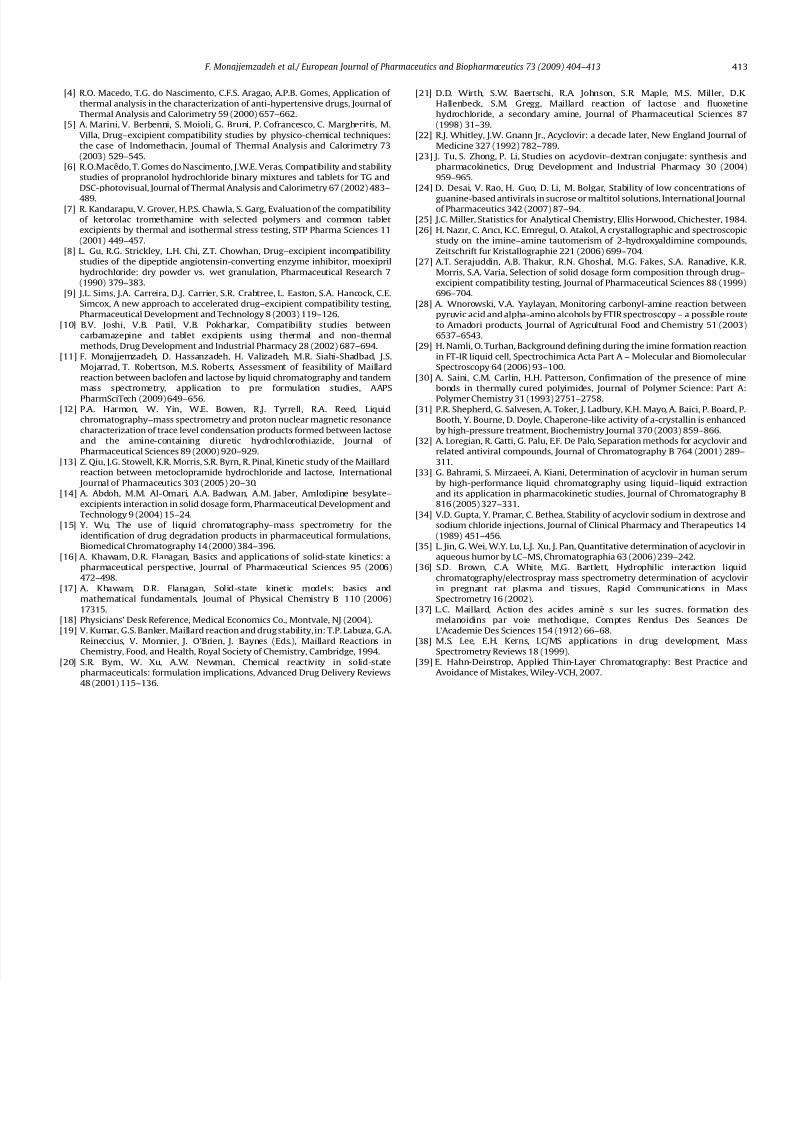
Attempts have been made to develop a kinetic model for the
loss of the amine in the solid-state Maillard reaction from a phar-
maceutical aspect. ACV loss was correlated to different kinetic
models and the best fit was accomplished using a diffusion model
(D3). Data are presented in Table 6. Recently, Khawam and
Flanagan have reviewed the basics and applications of solid-statekinetics and solid-state kinetic models in two separate articles
[16,17]. Solid-state reactions are not usually controlled by mass
transfer except for a few reversible reactions or when a large evo-
lution or consumption of heat occurs. Diffusion usually plays a role
in the rates of reaction between two reacting solids when reactants
are in separate crystal lattices [16,17].
In diffusion-controlled reactions, the rate-limiting step is the
diffusion of reactants into reaction sites or products away from
reaction sites, and the rate of product formation decreases propor-
tionally with the thickness of the product barrier layer. The model
proposed by Qiu et al. describing metoclopramide loss kinetics
cannot be used here because the molar ratio of ACV lactose in
our study was 1, resulting in Ln 1, to be zero and turning all equa-
tion to zero. Full kinetic analysis as a function of the amine, carbo-hydrate, and reaction conditions is left for future studies.
5. Conclusions
Compatibility studies were completed using different analytical
methods. DSC, HPLC and tandem mass spectrometry provided use-
ful information on ACV–lactose compatibility, whereas FTIR was
not helpful due to overlapping peaks.
The ability to predict reactions in dosage forms depends on the
similarity of the prepared mixture to the formulation. The novel
TLC method introduced in this study is a valuable and fast colori-
metric test method to identify lactose in commercial solid dosage
forms. Low levels of the ACV–lactose condensation product were
confirmed by liquid chromatography–tandem mass spectrometry,indicating the formation of a covalent link between ACV and lac-
tose with the loss of a single water molecule. Although all the three
tested brands contained lactose in their formulations, only one
brand formed Schiff base adduct and only under wet conditions.
It can be concluded that the Maillard reaction of acyclovir and lac-
tose in a solid-state formulation is less possible than in the aque-
ous phase. Thus, there may be some other important factors such
as restricted mobility affecting the Maillard reaction in real solid
dosage forms. It is also advisable to avoid wet conditions in the for-
mulation process and/or storage of acyclovir solid-state dosage
forms containing lactose.
Acknowledgment
The authors are grateful to Tabriz University of Medical Sci-
ences and University of Queensland for providing financial
assistance.
References
[1] R.K. Verma, S. Garg, Selection of excipients for extended release formulations
of glipizide through drug–excipient compatibility testing, Journal of
Pharmaceutical and Biomedical Analysis 38 (2005) 633–644.
[2] A.T.M. Serajuddin, A.B. Thakur, R.N. Ghoshal, M.G. Fakes, S.A. Ranadive, K.R.
Morris, S.A. Varia, Selection of solid dosage form composition through drug–
excipient compatibility testing, Journal of Pharmaceutical Sciences 88 (1999)
696–704.
[3] M. Wesolowski, Thermoanalytical methods in pharmaceutical technology, Journal of Thermal Analysis and Calorimetry 38 (1992) 2239–2245.
Table 6
Parameters obtained from the fitting of the reaction rate data (at 95 C) to various
solid-state kinetic models.
Models Intercept Slope RSQ
Nucleation models
Power law (P2) 0.3495 0.0016 0.5005
Power law (P3) 0.2708 0.0015 0.5926
Power law (P4) 0.2389 0.0015 0.6309
Avarami–Erofe’ev (A2) 0.3739 0.0020 0.5595Avarami–Erofe’ev (A3) 0.4741 0.0019 0.4312
Avarami–Erofe’ev (A4) 0.5356 0.0018 0.3562
Prout–Tompkins (B1) 0.3158 0.0009 0.0433
Geometrical contraction models
Contracting area (R2) 0.0891 0.0008 0.7557
Contracting volume (R3) 0.0609 0.0005 0.7667
Diffusion models
1-D diffusion (D1) 0.0425 0.0006 0.9056
2-D diffusion (D2) 0.0237 0.0004 0.9219
3-D diffusion-Jander eqn. (D3) 0.0059 0.0001 0.9374
Ginstling–Brounshtein (D4) 0.0055 0.0001 0.9274
Reaction order
Zero-order 0.1656 0.0013 0.7222
First-order 0.1922 0.0018 0.7883
Second-order 0.2260 0.0024 0.8488
Third-order 0.2695 0.0034 0.9000
Table 5
Solid-state rate expressions for different reaction models. Adopted with permission
[15,16].
Model Differential forma f (a) = 1 /k
(da/dt )
Integral forma
g (a) = kt
Nucleation models
Power law (P2) 2a(1/2)
a(1/2)
Power law (P3) 3a(2/3)
a(2/3)
Power law (P4) 4a(3/4) a(3/4)
Avarami–Erofe’ev (A2) 2(1 a)[ln(1 a)]1/2 [ln(1 a)]1/2
Avarami–Erofe’ev (A3) 3(1 a)[ln(1 a)]2/3 [ln(1 a)]2/3
Avarami–Erofe’ev (A4) 4(1 a)[ln(1 a)]3/4 [ln(1 a)]3/4
Prout–Tompkins (B1) a(1 a) ln[a/(1 a)]
Geometrical contraction models
Contracting area (R2) 2(1 a)1/2 [1(1 a)1/2]
Contracting volume (R3) 3(1 a)2/3 [1(1 a)1/3]
Diffusion models
1-D diffusion (D1) 1/2a a2
2-D diffusion (D2) [ln(1 a)]_1 [(1 a)ln(1 a)] + a
3-D diffusion-Jander eqn.
(D3)
3(1 a)2/3/2(1(1 a)1/3) [1(1 a)1/3]2
Ginstling–Brounshtein
(D4)
(3/2((1 a)1/3 1) 1(2a/3) (1 a)2/
3
Reaction-order models
Zero (F0/R1) 1 a
First (F1) (1 a) ln(1 a)
Second (F2) (1 a)2 (1 a)1 1
Third (F3) (1 a)3 0.5((1 a)2 1)
a In some references, f (a) and g (a) have opposite designations.
412 F. Monajjemzadeh et al. / European Journal of Pharmaceutics and Biopharmaceutics 73 (2009) 404–413
8/11/2019 compatibility studies acyclovir and lactose physical mixtures.pdf
http://slidepdf.com/reader/full/compatibility-studies-acyclovir-and-lactose-physical-mixturespdf 10/10
[4] R.O. Macedo, T.G. do Nascimento, C.F.S. Aragao, A.P.B. Gomes, Application of
thermal analysis in the characterization of anti-hypertensive drugs, Journal of
Thermal Analysis and Calorimetry 59 (2000) 657–662.
[5] A. Marini, V. Berbenni, S. Moioli, G. Bruni, P. Cofrancesco, C. Margheritis, M.
Villa, Drug–excipient compatibility studies by physico-chemical techniques:
the case of Indomethacin, Journal of Thermal Analysis and Calorimetry 73
(2003) 529–545.
[6] R.O.Macêdo, T. Gomes do Nascimento, J.W.E. Veras, Compatibility and stability
studies of propranolol hydrochloride binary mixtures and tablets for TG and
DSC-photovisual, Journal of Thermal Analysis and Calorimetry 67 (2002) 483–
489.[7] R. Kandarapu, V. Grover, H.P.S. Chawla, S. Garg, Evaluation of the compatibility
of ketorolac tromethamine with selected polymers and common tablet
excipients by thermal and isothermal stress testing, STP Pharma Sciences 11
(2001) 449–457.
[8] L. Gu, R.G. Strickley, L.H. Chi, Z.T. Chowhan, Drug–excipient incompatibility
studies of the dipeptide angiotensin-converting enzyme inhibitor, moexipril
hydrochloride: dry powder vs. wet granulation, Pharmaceutical Research 7
(1990) 379–383.
[9] J.L. Sims, J.A. Carreira, D.J. Carrier, S.R. Crabtree, L. Easton, S.A. Hancock, C.E.
Simcox, A new approach to accelerated drug–excipient compatibility testing,
Pharmaceutical Development and Technology 8 (2003) 119–126.
[10] B.V. Joshi, V.B. Patil, V.B. Pokharkar, Compatibility studies between
carbamazepine and tablet excipients using thermal and non-thermal
methods, Drug Development and Industrial Pharmacy 28 (2002) 687–694.
[11] F. Monajjemzadeh, D. Hassanzadeh, H. Valizadeh, M.R. Siahi-Shadbad, J.S.
Mojarrad, T. Robertson, M.S. Roberts, Assessment of feasibility of Maillard
reaction between baclofen and lactose by liquid chromatography and tandem
mass spectrometry, application to pre formulation studies, AAPS
PharmSciTech (2009) 649–656.
[12] P.A. Harmon, W. Yin, W.E. Bowen, R.J. Tyrrell, R.A. Reed, Liquid
chromatography–mass spectrometry and proton nuclear magnetic resonance
characterization of trace level condensation products formed between lactose
and the amine-containing diuretic hydrochlorothiazide, Journal of
Pharmaceutical Sciences 89 (2000) 920–929.
[13] Z. Qiu, J.G. Stowell, K.R. Morris, S.R. Byrn, R. Pinal, Kinetic study of the Maillard
reaction between metoclopramide hydrochloride and lactose, International
Journal of Pharmaceutics 303 (2005) 20–30.
[14] A. Abdoh, M.M. Al-Omari, A.A. Badwan, A.M. Jaber, Amlodipine besylate–
excipients interaction in solid dosage form, Pharmaceutical Development and
Technology 9 (2004) 15–24.
[15] Y. Wu, The use of liquid chromatography–mass spectrometry for the
identification of drug degradation products in pharmaceutical formulations,
Biomedical Chromatography 14 (2000) 384–396.
[16] A. Khawam, D.R. Flanagan, Basics and applications of solid-state kinetics: a
pharmaceutical perspective, Journal of Pharmaceutical Sciences 95 (2006)
472–498.
[17] A. Khawam, D.R. Flanagan, Solid-state kinetic models: basics andmathematical fundamentals, Journal of Physical Chemistry B 110 (2006)
17315.
[18] Physicians’ Desk Reference, Medical Economics Co., Montvale, NJ (2004).
[19] V. Kumar, G.S. Banker, Maillard reaction and drug stability, in: T.P. Labuza, G.A.
Reineccius, V. Monnier, J. O’Brien, J. Baynes (Eds.), Maillard Reactions in
Chemistry, Food, and Health, Royal Society of Chemistry, Cambridge, 1994.
[20] S.R. Byrn, W. Xu, A.W. Newman, Chemical reactivity in solid-state
pharmaceuticals: formulation implications, Advanced Drug Delivery Reviews
48 (2001) 115–136.
[21] D.D. Wirth, S.W. Baertschi, R.A. Johnson, S.R. Maple, M.S. Miller, D.K.
Hallenbeck, S.M. Gregg, Maillard reaction of lactose and fluoxetine
hydrochloride, a secondary amine, Journal of Pharmaceutical Sciences 87
(1998) 31–39.
[22] R.J. Whitley, J.W. Gnann Jr., Acyclovir: a decade later, New England Journal of
Medicine 327 (1992) 782–789.
[23] J. Tu, S. Zhong, P. Li, Studies on acyclovir–dextran conjugate: synthesis and
pharmacokinetics, Drug Development and Industrial Pharmacy 30 (2004)
959–965.
[24] D. Desai, V. Rao, H. Guo, D. Li, M. Bolgar, Stability of low concentrations of
guanine-based antivirals in sucrose or maltitol solutions, International Journalof Pharmaceutics 342 (2007) 87–94.
[25] J.C. Miller, Statistics for Analytical Chemistry, Ellis Horwood, Chichester, 1984.
[26] H. Nazır, C. Arıcı, K.C. Emregul, O. Atakol, A crystallographic and spectroscopic
study on the imine–amine tautomerism of 2-hydroxyaldimine compounds,
Zeitschrift fur Kristallographie 221 (2006) 699–704.
[27] A.T. Serajuddin, A.B. Thakur, R.N. Ghoshal, M.G. Fakes, S.A. Ranadive, K.R.
Morris, S.A. Varia, Selection of solid dosage form composition through drug–
excipient compatibility testing, Journal of Pharmaceutical Sciences 88 (1999)
696–704.
[28] A. Wnorowski, V.A. Yaylayan, Monitoring carbonyl-amine reaction between
pyruvic acid and alpha-amino alcohols by FTIR spectroscopy – a possible route
to Amadori products, Journal of Agricultural Food and Chemistry 51 (2003)
6537–6543.
[29] H. Namli, O. Turhan, Background defining during the imine formation reaction
in FT-IR liquid cell, Spectrochimica Acta Part A – Molecular and Biomolecular
Spectroscopy 64 (2006) 93–100.
[30] A. Saini, C.M. Carlin, H.H. Patterson, Confirmation of the presence of mine
bonds in thermally cured polyimides, Journal of Polymer Science: Part A:
Polymer Chemistry 31 (1993) 2751–2758.
[31] P.R. Shepherd, G. Salvesen, A. Toker, J. Ladbury, K.H. Mayo, A. Baici, P. Board, P.
Booth, Y. Bourne, D. Doyle, Chaperone-like activity of a-crystallin is enhanced
by high-pressure treatment, Biochemistry Journal 370 (2003) 859–866.
[32] A. Loregian, R. Gatti, G. Palu, E.F. De Palo, Separation methods for acyclovir and
related antiviral compounds, Journal of Chromatography B 764 (2001) 289–
311.
[33] G. Bahrami, S. Mirzaeei, A. Kiani, Determination of acyclovir in human serum
by high-performance liquid chromatography using liquid–liquid extraction
and its application in pharmacokinetic studies, Journal of Chromatography B
816 (2005) 327–331.
[34] V.D. Gupta, Y. Pramar, C. Bethea, Stability of acyclovir sodium in dextrose and
sodium chloride injections, Journal of Clinical Pharmacy and Therapeutics 14
(1989) 451–456.
[35] L. Jin, G. Wei, W.Y. Lu, L.J. Xu, J. Pan, Quantitative determination of acyclovir in
aqueous humor by LC–MS, Chromatographia 63 (2006) 239–242.
[36] S.D. Brown, C.A. White, M.G. Bartlett, Hydrophilic interaction liquid
chromatography/electrospray mass spectrometry determination of acyclovir
in pregnant rat plasma and tissues, Rapid Communications in MassSpectrometry 16 (2002).
[37] L.C. Maillard, Action des acides amine s sur les sucres. formation des
melanoidins par voie methodique, Comptes Rendus Des Seances De
L’Academie Des Sciences 154 (1912) 66–68.
[38] M.S. Lee, E.H. Kerns, LC/MS applications in drug development, Mass
Spectrometry Reviews 18 (1999).
[39] E. Hahn-Deinstrop, Applied Thin-Layer Chromatography: Best Practice and
Avoidance of Mistakes, Wiley-VCH, 2007.
F. Monajjemzadeh et al./ European Journal of Pharmaceutics and Biopharmaceutics 73 (2009) 404–413 413