Embed Size (px)
Citation preview
COMPAS Validation Study:
Final Report August 15, 2010
Prepared by
David Farabee (UCLA)
Sheldon Zhang (SDSU)
Robert E.L. Roberts (CSUSM)
Joy Yang (UCLA)
Semel Institute for Neuroscience and Human Behavior
University of California, Los Angeles 1640 S. Sepulveda, Suite 200
Los Angeles, California 90025
California Department of Corrections and Rehabilitation
Agreement No: C06.417
COMPAS Final Report 2010
UCLA/SDSU Page 2
PREFACE
The UCLA Integrated Substance Abuse Programs (UCLA ISAP) was funded by the California
Department of Corrections and Rehabilitation (CDCR) to conduct an evaluation of the
Correctional Offender Management and Profiling Alternative Sanctions (COMPAS)
assessment with regard to its ability to identify treatment needs and to predict various
types of recidivism. Through a subcontract, UCLA ISAP collaborated with Dr. Sheldon
Zhang at San Diego State University and Dr. Bob Roberts at California State University San
Marcos in this effort. The purpose of this report is to describe the final results of this three-
year evaluation.
COMPAS Final Report 2010
UCLA/SDSU Page 3
EXECUTIVE SUMMARY
COMPAS (Correctional Offender Management and Profiling Alternative Sanctions) is a
computerized database and analysis system designed to help criminal justice practitioners
determine the placement, supervision, and case-management of offenders in community
and secure settings. The California Department of Corrections and Rehabilitation
contracted with the University of California, Los Angeles (UCLA), and San Diego State
University (SDSU) to validate the instrument in terms of its ability to identify treatment
needs among inmates as well as predict various recidivism outcomes.
A total of 91,334 parolees who had been assessed with COMPAS prior to release were
included in the study sample. Of these, roughly 60,000 had been on parole for at least 12
months and the remainder had been on parole for at least 24 months. Characteristics of
the study subjects closely paralleled those of the general parolee population in California.
Validation of Needs Scales
The COMPAS needs scales were evaluated in terms of their reliability over time (test-
retest coefficients) and the extent to which their constituent scales correlated with
relevant counterparts on the Level of Service Inventory-Revised (LSI-R) scale (concurrent
validity). To accomplish this, the COMPAS was administered twice to 75 inmates at the
California Institute for Men (CIM) located in Chino, California, over a span of
approximately two weeks. To establish concurrent validity, the LSI-R was also
administered at the same time points.
The COMPAS scales showed extremely high test-retest reliability, ranging from .70 to
1.00. The perfect and near-perfect correlations obtained for many of the scales appear to
be driven by the fact that these scales were coded directly from the inmates’ Central
Files. Overall, the average test-retest correlation coefficient for the COMPAS scales was
.88.
Of the 18 scales making up the core of the COMPAS assessment, nine appeared to
measure identical or similar constructs with scales found in the LSI-R. For six of these
scales (Criminal Involvement, Criminal Associates/Peers, Substance Abuse, Financial,
Vocational/Educational, and Housing), significant and positive correlations were found
between the COMPAS and LSI-R. The correlations were marginally significant for two of
the scales, Family Criminality (COMPAS) with Family/Marital (LSI-R) and Criminal Attitudes
(COMPAS) with Attitudes/Orientation (LSI-R), and not significant for one, Leisure
(COMPAS) with Leisure/Recreation (LSI-R).
Validation of Risk Scales
Using official records data provided by the California Department of Corrections and
Rehabilitation (CDCR), two major outcome measures were examined: (1) any subsequent
arrest, and (2) a subsequent arrest for a violent offense. For the first measure, the overall
COMPAS Final Report 2010
UCLA/SDSU Page 4
re-arrest rate for the COMPAS sample was 56% for the first 12 months on parole and 70%
for those who had been released for two years. For violent offenses, the re-arrest rates
were approximately 13% and 21% in the 12- and 24-month periods following release,
respectively.
Receiver Operating Characteristic (ROC) curves were computed to assess the overall
accuracy of the COMPAS risk scales for recidivism and violence. The ROC curve (measured
in terms of the area under the curve or AUC) has become a primary measure of predictive
accuracy in research instrumentation. A value of .70 is generally considered minimally
acceptable.
The recidivism and violence COMPAS risk scales were examined with regard to how well
they predicted whether a parolee had been re-arrested (for any reason and for a violence
offense) within two years of being released from prison. Both risk scales achieved levels
of accuracy greater than chance, with the recidivism scale receiving an AUC value of .70,
and the violence scale receiving an AUC value of .65. The risk prediction resulting from
the COMPAS scales was comparable to our own risk prediction models using existing
electronic records maintained by CDCR.
We conclude that the COMPAS scales have high test-test retest reliability and moderate
concordance with select LSI-R scales (with significant or marginally significant associations
with eight of the nine scales that overlap with the LSI-R). With regard to the predictive
validity of the recidivism and violence COMPAS risk scales, the general recidivism risk
scale achieved an AUC value of .70, which is the conventional threshold for acceptability;
the violence scale, however, fell short of this threshold.
COMPAS Final Report 2010
UCLA/SDSU Page 5
TABLE OF CONTENTS
PREFACE ................................................................................................................................. 2
EXECUTIVE SUMMARY ........................................................................................................... 3
I. BACKGROUND ..................................................................................................................... 8
II. METHODS ........................................................................................................................... 8
II.A. Validation of COMPAS Needs Assessment Components............................................ 8
II.B. Validation of COMPAS Risk Scales .............................................................................. 9
II.B.1. Data Sources ...................................................................................................... 10
II.B.2. Sample ................................................................................................................ 10
III. IMPLEMENTATION OF COMPAS...................................................................................... 10
III.A. Parolee Services Administrator Survey .................................................................... 11
III.B. Perceived Benefits from PSA Interviews and Field Observations ............................ 12
III.C. Perceived Problems from PSA Interviews and Field Observations .......................... 12
III.D. Expanded Use of COMPAS in California .................................................................. 13
IV. ANALYSIS AND FINDINGS ................................................................................................ 13
IV.A. Test-Retest Reliability of Needs Scales .................................................................... 13
IV.B. Concurrent Validity of COMPAS Needs Scales with the LSI-R ................................. 15
IV.B.1. Criminal Involvement........................................................................................ 16
IV.B.2. Criminal Peers ................................................................................................... 16
IV.B.3. Substance Abuse ............................................................................................... 17
IV.B.4. Financial ............................................................................................................ 17
IV.B.5. Vocational/Education ....................................................................................... 18
IV.B.6. Family ................................................................................................................ 18
IV.B.7. Leisure/Recreation ........................................................................................... 19
IV.B.8. Housing ............................................................................................................. 19
IV.B.9. Criminal Thinking .............................................................................................. 20
IV.C. Predictive Validity of Risk Scales .............................................................................. 20
IV.C.1. Descriptive Statistics ......................................................................................... 21
IV.C.2. Receiver Operating Characteristics ................................................................. 24
IV.C.3. Logistic Regression and Comparative Predictive Power Analysis ................. 27
V. SUMMARY AND DISCUSSION ........................................................................................... 28
APPENDIX ............................................................................................................................. 30
COMPAS Final Report 2010
UCLA/SDSU Page 6
LIST OF TABLES
Table 1: Test-Retest Correlations for COMPAS Scales (N = 75) ...................................... 14
Table 2: Test-Retest Correlations for LSI-R Scales (N = 75) ............................................ 14
Table 3: Overlapping Constructs of the COMPAS and LSI-R Assessments ........................ 15
Table 4: Demographic Characteristics of Parolee Population, COMPAS Sample and
Subsamples with Increasing Post-Release Observation Periods ..................................... 21
Table 5. COMPAS Parolee Arrest Patterns during First and Second Years following Parole
Release ................................................................................................................... 22
Table 6: Spearman Rank-Order Correlations between Two COMPAS Recidivism Risk Scale
Scores (Deciles) and Arrest Type within Two Years of Release (25,009 Parolees with Two
Year Observation Period. .......................................................................................... 23
Table 7: Spearman Rank-Order Correlations between Two COMPAS Recidivism Risk Scale
Scores (Deciles) and Arrest Type within Two Years of Release (22,153 Male Parolees with
Two Year Observation Period) ................................................................................... 23
Table 8: Spearman Rank-Order Correlations between Two COMPAS Recidivism Risk Scale
Scores (Deciles) and Arrest Type within Two Years of Release (2,856 Female Parolees with
Two Year Observation Period) ................................................................................... 24
Table 9: Comparison of Odds-Ratios and Test Accuracy from Logistic Regression of Any
Arrest within Two Years on COMPAS Recidivism Risk Score Decile Or Select Parolee
Characteristics (Parolees with 24 Month Observation Period following Release) ............ 27
Table 10: Comparison of Odds-Ratios and Test Accuracy from Logistic Regression of
Violent Offense Arrest within Two Years on COMPAS Violent Recidivism Risk Score Decile
or Select Parolee Characteristics (Parolees with 24 Month Observation Period following
Release) .................................................................................................................. 27
COMPAS Final Report 2010
UCLA/SDSU Page 7
LIST OF FIGURES
Figure 1: Percentage of Inmates Categorized as Having High Levels of Criminal
Involvement ............................................................................................................ 16
Figure 2: Percentage of Inmates Categorized as having High Problem Levels of Criminal
Peers/Associates ..................................................................................................... 16
Figure 3: Percentage of Inmates Categorized as “High” on Substance Abuse Problems ... 17
Figure 4: Percentage of Inmates Categorized as “High” on Financial Problems ............... 17
Figure 5: Percentage of Inmates Categorized as Being in High Need of Vocational/
Educational Assistance ............................................................................................. 18
Figure 6: Percentage of Inmates Categorized as Having High Levels of Family Problems . 19
Figure 7: Percentage of Inmates Categorized as Having High Need for Assistance in
Leisure/Recreation ....... 19
Figure 8: Percentage of Inmates Categorized as Having High Need for Housing Assistance
.............................................................................................................................. 20
Figure 9: Percentage of Inmates Categorized as Having High Levels of Criminal Thinking 20
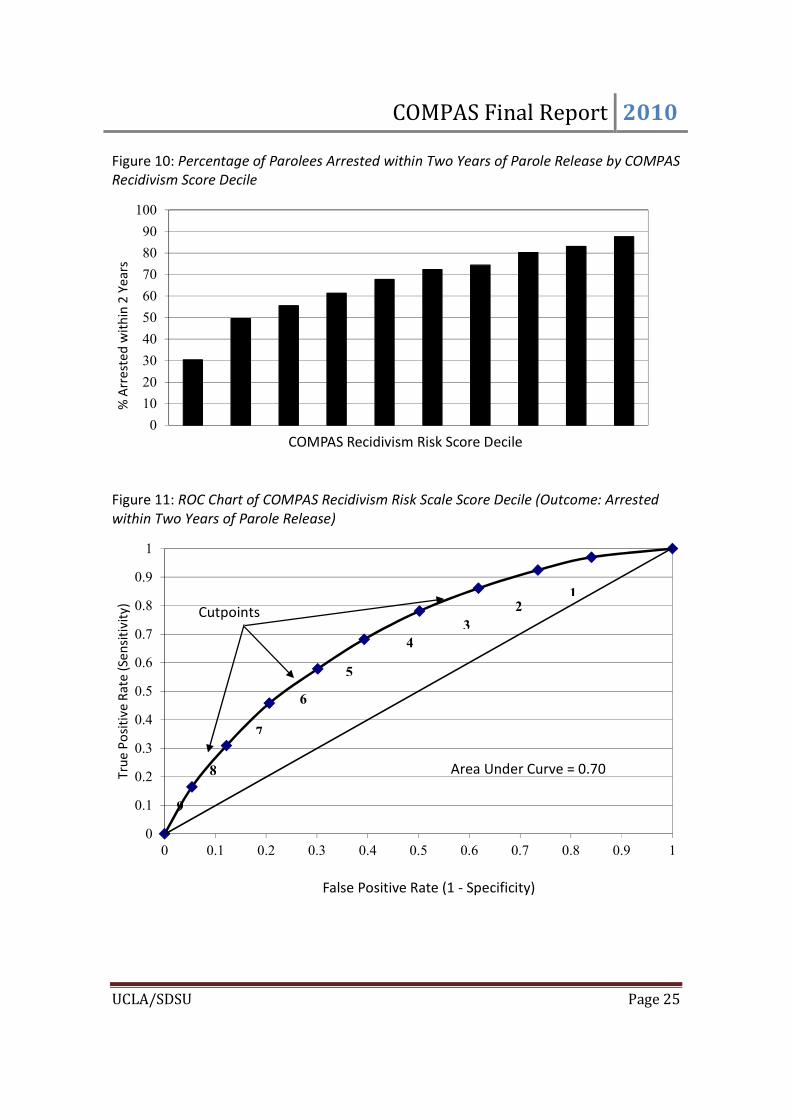
Figure 10: Percentage of Parolees Arrested within Two Years of Parole Release by COMPAS
Recidivism Score Decile ............................................................................................ 25
Figure 11: ROC Chart of COMPAS Recidivism Risk Scale Score Decile (Outcome: Arrested
within Two Years of Parole Release) .......................................................................... 25
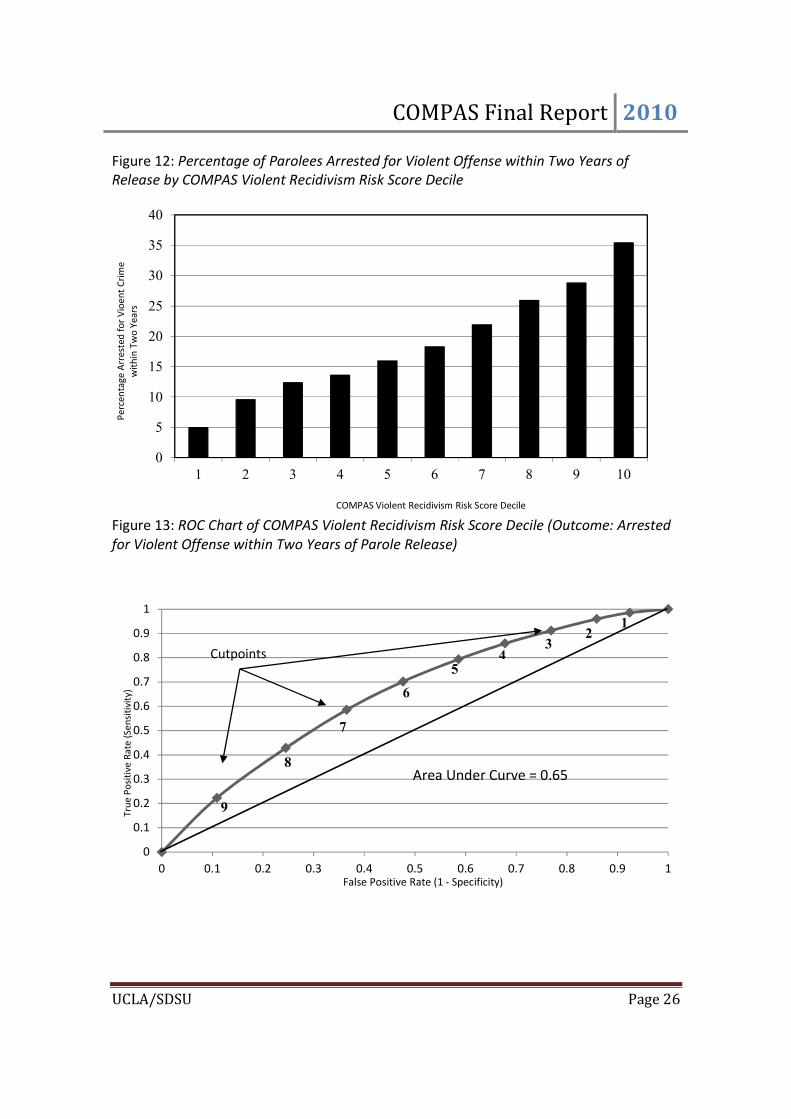
Figure 12: Percentage of Parolees Arrested for Violent Offense within Two Years of
Release by COMPAS Violent Recidivism Risk Score Decile ............................................. 26
Figure 13: ROC Chart of COMPAS Violent Recidivism Risk Score Decile (Outcome: Arrested
for Violent Offense within Two Years of Parole Release) .............................................. 26
Figure 14: Percentage of Parolees Returned To Custody within Two Years by COMPAS
Recidivism Risk Score Decile ...................................................................................... 30
Figure 15: ROC Chart of COMPAS Violent Recidivism Risk Scale Score Decile (Outcome:
Violent Parole Violation within Two Years of Parole Release). ...................................... 30
Figure 16: Percentage of Parolees that Committed A Violent Parole Violation within Two
Years of Parole Release by COMPAS Violent Recidivism Risk Score Decile ...................... 31
Figure 17: ROC Chart of COMPAS Violent Recidivism Risk Scale Score Decile (Outcome:
Violent Parole Violation within Two Years of Parole Release) ....................................... 31
COMPAS Final Report 2010
UCLA/SDSU Page 8
I. BACKGROUND
This report provides an assessment of the Correctional Offender Management and
Profiling Alternative Sanctions (COMPAS) as adopted and implemented by the California
Department of Corrections and Rehabilitation (CDCR). The focus of this study was on the
predictive validity of its risk scales and the validity of its needs assessment scale. This
report describes the background of the COMPAS and its current use in California,
followed by a summary of the needs validation study, and a set of analyses on how well
the COMPAS predicts general and violent recidivism.
COMPAS is a computerized database and analysis system designed to help criminal justice
practitioners determine the placement, supervision, and case-management of offenders
in community and secure settings. The data system includes several modules: risk/needs
assessment, criminal justice agency decision tracking, treatment and intervention
tracking, outcome monitoring, agency integrity, and programming implementation
monitoring. The risk-assessment component addresses four basic dimensions: violence,
recidivism, failure to appear, and community failure. Offenders are classified into three
categories of risk: low, medium, or high, based on cutpoints imposed on a 10-item scale.
The needs assessment component of the COMPAS categorizes inmates as having low,
medium, or high need for services or treatment in various areas, such as substance abuse,
criminal thinking, vocational training, etc.
The California Department of Corrections and Rehabilitation (CDCR) contracted with the
University of California, Los Angeles (UCLA), and San Diego State University (SDSU) to
conduct an extensive evaluation of both the implementation of the COMPAS and the
reliability/validity of its risk and needs scales. This evaluation spanned a three-year
period.1 This final report summarizes findings from the entire evaluation.
II. METHODS
II.A. Validation of COMPAS Needs Assessment Components
One of the primary goals of this study was to assess the test-retest reliability and
concurrent validity of the COMPAS needs scales. To accomplish this, the COMPAS was
administered twice to 75 inmates at the California Institute for Men (CIM) located in
Chino, California, over a span of two weeks (84% of those invited to participate agreed to
do so). To establish concurrent validity, the Level of Service Inventory-Revised (LSI-R)
scale (Andrews & Bonta, 2001) 2 was also administered and the obtained scores on this
1 Because of a work stoppage order during FY 2008-2009 due to a state budget impasse, this study was delayed for
three months from July through September 2008. Although all field activities were put on hold, the research team was
able to communicate with CDCR administrative staff in planning the validation of COMPAS needs assessment and
securing access to state prisons.
2 Andrews, D. A., & Bonta, J. (2001). Level of Service Inventory–Revised (LSI-R): User’s manual. North Tonawanda, NY:
Multi-Health Systems.
COMPAS Final Report 2010
UCLA/SDSU Page 9
assessment were compared to scores obtained on its counterpart scales on the COMPAS.
The LSI-R was also administered twice to demonstrate the consistency and reliability of
the instrument for the same population.
The procedures for this component of the evaluation were as follows:
1. UCLA researchers contacted CIM-based Parole Service Associates (PSAs) ahead of
time to schedule interview visits.
2. When UCLA researchers arrived at CIM, they met PSAs in their office and reviewed
their Central Files (or “C-files”) there.
3. Inmates who had not yet been given a COMPAS assessment and who had a
release date at least 12 weeks away were randomly selected to participate in the
study. The names and CDCR numbers of the selected participants were made
available to UCLA researchers, who assigned them a unique study ID number.
4. On the West (Level 1) Yard, potential subjects were ducated in groups of about 10
and invited to participate, using the study recruitment script. If inmates agreed to
participate, they were consented at this time. On subsequent visits, these subjects
were ducated two at a time. Before they were ducated, a classroom, or other
space was reserved for the interviews. One PSA and one UCLA researcher shared a
classroom whenever possible to interview participants. They conducted the
interviews on opposite sides of the room and did so in a way that preserved the
confidentiality of the participants. The PSAs administered the COMPAS and the
UCLA researchers administered the LSI-R. After the inmates were administered
the first assessment, they switched seats and proceeded to take the remaining
assessment. This counterbalanced design mitigated any potential ordering effects.
5. After the first administration of the COMPAS and LSI-R (Test), the UCLA
researchers scheduled the clients for their follow-up (Retest), approximately 10
days later.
6. Money orders in the amount of $10 were deposited into the subjects’ accounts
within one week of the test/retest.
These data were collected between March 2 and June 22, 2009.
II.B. Validation of COMPAS Risk Scales
The research team evaluated the degree to which the COMPAS risk scores predicted
future recidivism among California parolees. Two key outcomes were used to assess the
predictive power of COMPAS—(1) a subsequent arrest for any reason following release,
and (2) a subsequent arrest for a violent offense, including homicide, assault, sexual
assault, robbery, domestic violence, and kidnapping.
COMPAS Final Report 2010
UCLA/SDSU Page 10
II.B.1. Data Sources
There were three primary sources of data for the analyses. The first was a database
containing COMPAS scale decile scores collected from California inmates between
February 2006 and May 2009. All selected cases had completed the COMPAS Core Full
Assessment and/or Core Violence Assessment. Thus, each case had valid data to allow the
assessment of the Risk of Violence and Risk of Recidivism scales.
The second data source was a CDCR database that records the timing and location of
offender movements within and between prisons and parole. The key variables selected
pertained to dates of parole release, dates of prison returns, principal commitment
offenses, reasons for returns, and inmate/parolee background characteristics.
The third data source consisted of calculated variables derived from arrest records
maintained by the California Department of Justice. New variables were created from raw
arrest data by CDCR Adult Research Branch analysts and provided to the research team
under a data sharing agreement. Data collected from the two CDCR databases ran
through June 30, 2009.
II.B.2. Sample
The overall sample consisted of the 91,334 offenders who had completed the COMPAS
Core Full Assessment and/or Core Violence Assessment during the study period (February
2006 to May 2009). Subsamples of 60,793 and 25,009 parolees with sufficient post-
release observation times to support recidivism analyses over one and two years,
respectively, were then selected from the overall sample.
III. IMPLEMENTATION OF COMPAS
At the time of this evaluation, both the Institutional and Parole Division within CDCR
adopted the COMPAS for assessment purposes. The COMPAS instrument is used at the
reception centers across the state; inmates with new terms are assessed prior to their
prison placement and approximately six to eight months prior to their release as part of
the case planning for parole supervision.
As for prerelease planning, COMPAS remains an integral part of re-entry case planning.
Parole Service Associates (PSAs) are responsible for carrying out all case file reviews,
inmate interviews, and data entry. These PSAs first review inmates’ files (i.e., the C-files)
and then conduct interviews with these inmates.
Upon completion of the COMPAS data entry, PSAs print out needs profiles based on
algorithms programmed in the database. These printouts are then inserted in all re-entry
case planning packages forwarded to the field offices. The information provided by
COMPAS is intended to assist field agents in making service referrals and supervision
decisions based on a scientific rationale and programming prescriptions. The following
COMPAS Final Report 2010
UCLA/SDSU Page 11
sections provide survey and interview data that describe PSAs’ perceptions of the
COMPAS.
III.A. Parolee Services Administrator Survey
To assess PSAs’ perceptions of the COMPAS, UCLA staff e-mailed the survey to the Parole
Planning and Placement Supervisor, who printed copies for the seven PSAs who
administered the COMPAS at the California Men’s Institution (CIM).3 A large manila
envelope was placed in a location in the Parole Planning and Placement office where PSAs
could confidentially insert their completed surveys. All seven PSAs responded to the
survey.
All of the respondents reported that the COMPAS is easy to use (mean = 1.3 [SD = 0.5] on
a scale of 1 = “very easy” to 10 = “very difficult”) and all reported having received
COMPAS training before administering the COMPAS to inmates. The average time PSAs
reported spending in training was 10.6 hours (SD = 5.5). The PSAs generally believed that
the training prepared them well to administer the COMPAS (mean = 8.9 [SD = 1.2] on a
scale from 1 = “not at all” to 10 = “very well”). One respondent noted that in addition to
the initial COMPAS training, ongoing COMPAS training was also provided as issues and
needs arose.
Each PSA administered the COMPAS Re-entry an average of 67 times (SD = 42.7) each
month, and spent approximately 39 minutes (SD = 12.1) on each administration of the
COMPAS Re-entry assessment interview. In addition, PSAs reported spending an average
of 58 minutes (SD = 23.2) reviewing each inmate’s C-file and, on average, 24 minutes (SD
= 16.0) entering COMPAS data into the database system.
On average, the PSAs reported experiencing technical difficulties with the COMPAS data
system 1.4 times (SD = 0.5) each month. They reported not being able to access the
COMPAS system to either retrieve or enter data 33 minutes (SD = 26.9) per month, on
average.
Respondents indicated that virtually all (97.6%) of inmates on their caseloads were given
a list of referrals to various services (including employment, educational, transitional
housing, and substance abuse) before they were released from prison.
When asked how utilization of the COMPAS might be improved, two respondents wrote
that the COMPAS would be more effective if it could be used by custody staff (including
R&R, Control, and Visiting Sergeants/Lieutenants) in the prisons. One felt this should be
done for safety/security purposes and the other felt that the data would help the custody
staff understand each inmate better.
3 Due to its proximity to Los Angeles, CIM served as a “focus” site for all field data collection.
COMPAS Final Report 2010
UCLA/SDSU Page 12
III.B. Perceived Benefits from PSA Interviews and Field Observations
The COMPAS administrators who were interviewed indicated that they believed that this
process significantly improved parole supervision planning. Furthermore, the PSAs
indicated that because they were not viewed as correctional officers, the inmates tended
to be more open in responding to their questions. Therefore, PSAs believed that they
were able to elicit a broad range of critical information to inform re-entry planning, and
that such information was vital in identifying potential problems for supervision, such as
homelessness, unemployment, treatment arrangements, and transitional housing.
Another perceived benefit was the efficiency by which information was transferred from
the institution to the field parole units. Because the C-File reviews and file extractions
were conducted prior to the inmates’ release, the agent of record (AOR) could quickly
access the summary information in his first meeting with the parolee. Such preplanning
was not possible in the previous system, in which the AOR had very limited time and
information about a parolee he was about to supervise. The information gathered
through COMPAS far exceeds that of the regular CDC611 Form (the existing pre-release
form).
COMPAS also provided case planning intended to help inmates learn where to get help,
such as in obtaining a driver’s license, employment training, a temporary living
arrangement, and outpatient treatment providers. At the exit interview, PSAs provided
inmates with detailed recommendations regarding services available, operating hours,
and living arrangements. However, the present study did not assess the extent to which
parolees took advantage of these referrals upon release.
III.C. Perceived Problems from PSA Interviews and Field Observations
The PSAs interviewed in the course of this evaluation indicated that a number of the
COMPAS interview questions were confusing to the inmates. Several of the questions
contained double negatives, which the inmates found difficult to understand. As a result,
the interviewers were forced to choose between rephrasing the questions to express
their intent and strictly adhering to the interview protocol at the risk of collecting
unreliable responses.
Although information on community services in the exit interviews was perceived to be a
valuable feature of the COMPAS assessment (prerelease planning), the database
reflecting available services in different geographical locations must be expanded and
updated on a continuous basis to remain current and relevant to recommended parole
supervision. Currently state-funded services are few, and parole agents often rely on their
own informal network of services. It appears that a more systematic and uniform
database of parolee-relevant services may need to be developed to meet the evolving
needs of the supervising agents.
COMPAS Final Report 2010
UCLA/SDSU Page 13
III.D. Expanded Use of COMPAS in California
COMPAS has become the instrument of choice of CDCR major divisions as well as by an
increasing number of community-based correctional service providers in California. The
increasing popularity of the COMPAS over other risk and needs instruments (e.g., Level of
Service Inventory-Revised) by community service providers in California is a recent
development. Much of the impetus behind the adoption of COMPAS by community
agencies is due to the requirement by Parole to base correctional services on systematic
client assessment. According to service providers, cost is a major factor in their decision
to adopt COMPAS. The COMPAS costs less than the more widely used LSI-R.
But the proximal impact of the COMPAS could not be determined in the current study.
Specifically, the extent to which the assessment information generated by the instrument
has been used by parole agents in the field remains unclear. In our limited interactions
with field agents who have seen COMPAS reports, responses were less sanguine than
those of the PSAs regarding the utility of the instrument. Of those who expressed
somewhat positive attitudes toward the instrument, a common response was that the
information generated by COMPAS validated their own assessments and provided greater
confidence in their supervision and programming plans.
IV. ANALYSIS AND FINDINGS
This section summarizes the results of the two quantitative components of this
evaluation: (1) the validation of the COMPAS needs scales (including both test-retest and
concurrent validity with the LSI-R), and (2) an assessment of the predictive validity of the
COMPAS risk scales.
IV.A. Test-Retest Reliability of Needs Scales
Test-retest coefficients range from 0 to 1, with higher values indicating greater stability of
responses over time. Although high test-retest reliability alone does not constitute proof
that a scale is valid, it is important to note that a test cannot be considered valid unless it
demonstrates acceptable test-retest reliability.
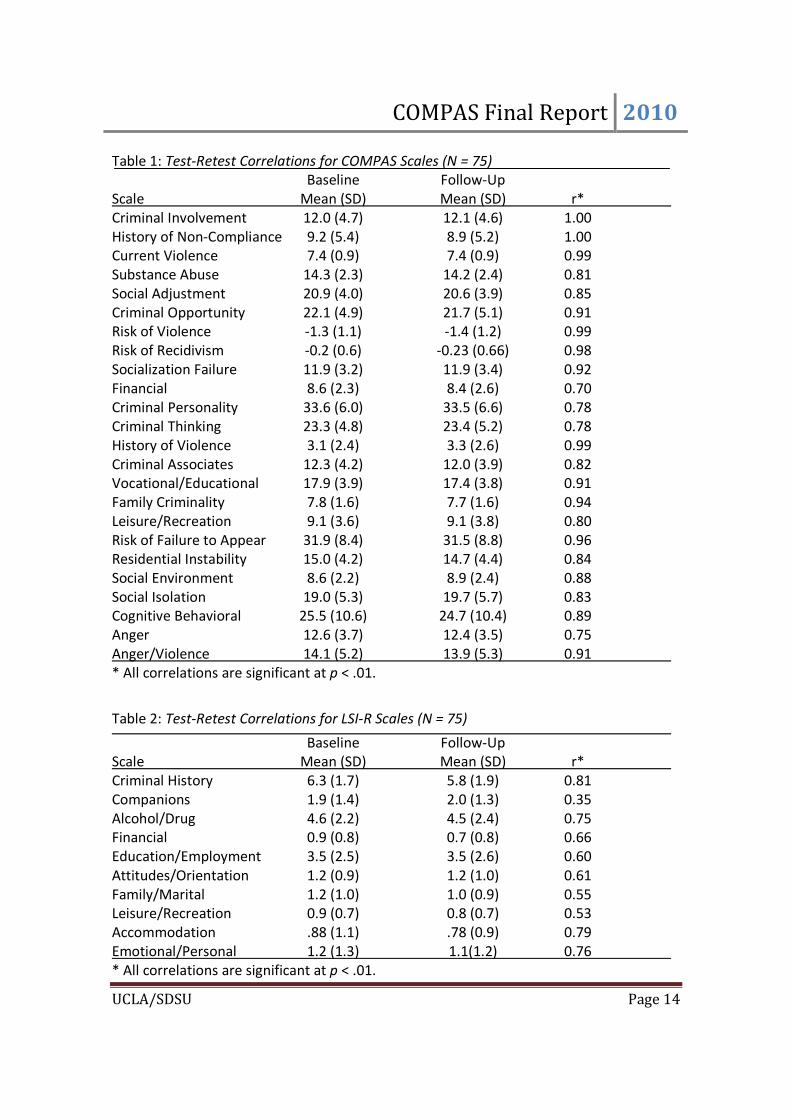
As seen in Table 1, the COMPAS scales showed high test-retest reliability, ranging from
.70 to 1.00. The perfect and near-perfect correlations obtained for many of the scales
appear to be driven by the fact that these scales were coded directly from the inmates’
Central Files. However, even the scales derived from inmates’ self-reports demonstrated
high reliability over time. Overall, the average test-retest correlation coefficient for the
COMPAS scales was .88; for LSI-R, it was .64.
COMPAS Final Report 2010
UCLA/SDSU Page 14
Table 1: Test-Retest Correlations for COMPAS Scales (N = 75)
Baseline Follow-Up
Scale Mean (SD) Mean (SD) r*
Criminal Involvement 12.0 (4.7) 12.1 (4.6) 1.00
History of Non-Compliance 9.2 (5.4) 8.9 (5.2) 1.00
Current Violence 7.4 (0.9) 7.4 (0.9) 0.99
Substance Abuse 14.3 (2.3) 14.2 (2.4) 0.81
Social Adjustment 20.9 (4.0) 20.6 (3.9) 0.85
Criminal Opportunity 22.1 (4.9) 21.7 (5.1) 0.91
Risk of Violence -1.3 (1.1) -1.4 (1.2) 0.99
Risk of Recidivism -0.2 (0.6) -0.23 (0.66) 0.98
Socialization Failure 11.9 (3.2) 11.9 (3.4) 0.92
Financial 8.6 (2.3) 8.4 (2.6) 0.70
Criminal Personality 33.6 (6.0) 33.5 (6.6) 0.78
Criminal Thinking 23.3 (4.8) 23.4 (5.2) 0.78
History of Violence 3.1 (2.4) 3.3 (2.6) 0.99
Criminal Associates 12.3 (4.2) 12.0 (3.9) 0.82
Vocational/Educational 17.9 (3.9) 17.4 (3.8) 0.91
Family Criminality 7.8 (1.6) 7.7 (1.6) 0.94
Leisure/Recreation 9.1 (3.6) 9.1 (3.8) 0.80
Risk of Failure to Appear 31.9 (8.4) 31.5 (8.8) 0.96
Residential Instability 15.0 (4.2) 14.7 (4.4) 0.84
Social Environment 8.6 (2.2) 8.9 (2.4) 0.88
Social Isolation 19.0 (5.3) 19.7 (5.7) 0.83
Cognitive Behavioral 25.5 (10.6) 24.7 (10.4) 0.89
Anger 12.6 (3.7) 12.4 (3.5) 0.75
Anger/Violence 14.1 (5.2) 13.9 (5.3) 0.91
* All correlations are significant at p < .01.
Table 2: Test-Retest Correlations for LSI-R Scales (N = 75) Baseline Follow-Up
Scale Mean (SD) Mean (SD) r*
Criminal History 6.3 (1.7) 5.8 (1.9) 0.81
Companions 1.9 (1.4) 2.0 (1.3) 0.35
Alcohol/Drug 4.6 (2.2) 4.5 (2.4) 0.75
Financial 0.9 (0.8) 0.7 (0.8) 0.66
Education/Employment 3.5 (2.5) 3.5 (2.6) 0.60
Attitudes/Orientation 1.2 (0.9) 1.2 (1.0) 0.61
Family/Marital 1.2 (1.0) 1.0 (0.9) 0.55
Leisure/Recreation 0.9 (0.7) 0.8 (0.7) 0.53
Accommodation .88 (1.1) .78 (0.9) 0.79
Emotional/Personal 1.2 (1.3) 1.1(1.2) 0.76
* All correlations are significant at p < .01.
COMPAS Final Report 2010
UCLA/SDSU Page 15
IV.B. Concurrent Validity of COMPAS Needs Scales with the LSI-R
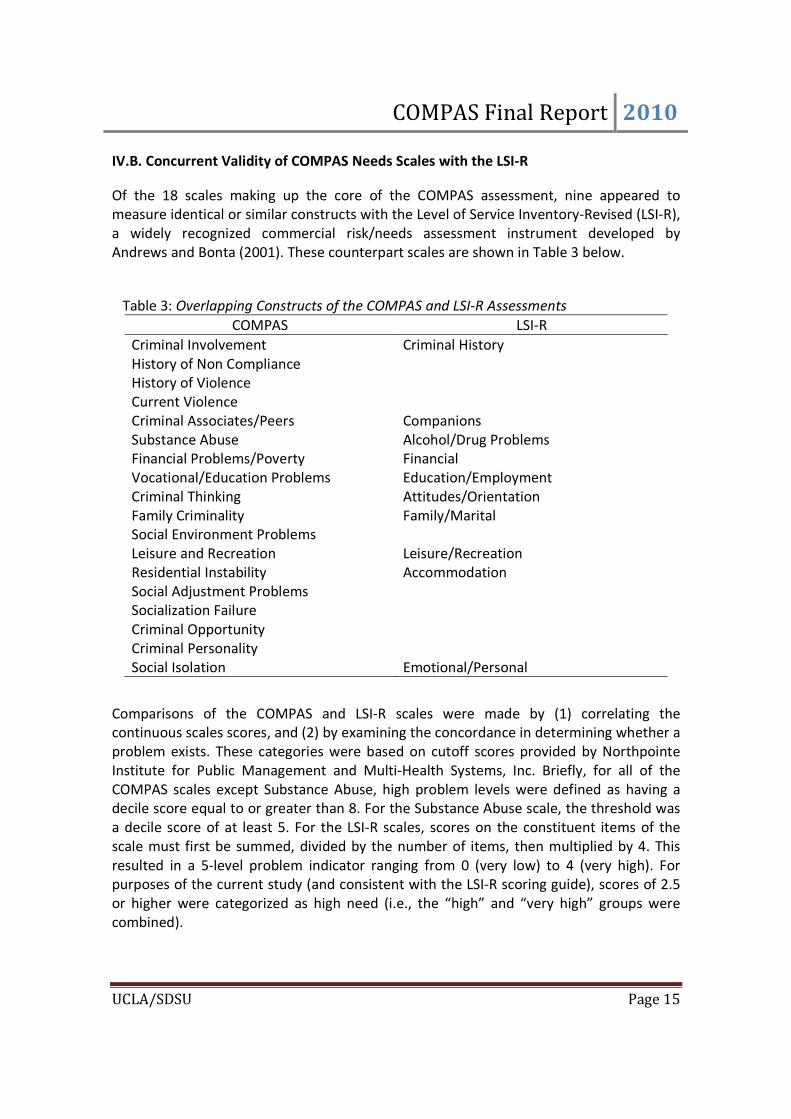
Of the 18 scales making up the core of the COMPAS assessment, nine appeared to
measure identical or similar constructs with the Level of Service Inventory-Revised (LSI-R),
a widely recognized commercial risk/needs assessment instrument developed by
Andrews and Bonta (2001). These counterpart scales are shown in Table 3 below.
Table 3: Overlapping Constructs of the COMPAS and LSI-R Assessments
COMPAS LSI-R
Criminal Involvement Criminal History
History of Non Compliance
History of Violence
Current Violence
Criminal Associates/Peers Companions
Substance Abuse Alcohol/Drug Problems
Financial Problems/Poverty Financial
Vocational/Education Problems Education/Employment
Criminal Thinking Attitudes/Orientation
Family Criminality Family/Marital
Social Environment Problems
Leisure and Recreation Leisure/Recreation
Residential Instability Accommodation
Social Adjustment Problems
Socialization Failure
Criminal Opportunity
Criminal Personality
Social Isolation Emotional/Personal
Comparisons of the COMPAS and LSI-R scales were made by (1) correlating the
continuous scales scores, and (2) by examining the concordance in determining whether a
problem exists. These categories were based on cutoff scores provided by Northpointe
Institute for Public Management and Multi-Health Systems, Inc. Briefly, for all of the
COMPAS scales except Substance Abuse, high problem levels were defined as having a
decile score equal to or greater than 8. For the Substance Abuse scale, the threshold was
a decile score of at least 5. For the LSI-R scales, scores on the constituent items of the
scale must first be summed, divided by the number of items, then multiplied by 4. This
resulted in a 5-level problem indicator ranging from 0 (very low) to 4 (very high). For
purposes of the current study (and consistent with the LSI-R scoring guide), scores of 2.5
or higher were categorized as high need (i.e., the “high” and “very high” groups were
combined).
COMPAS Final Report 2010
UCLA/SDSU Page 16
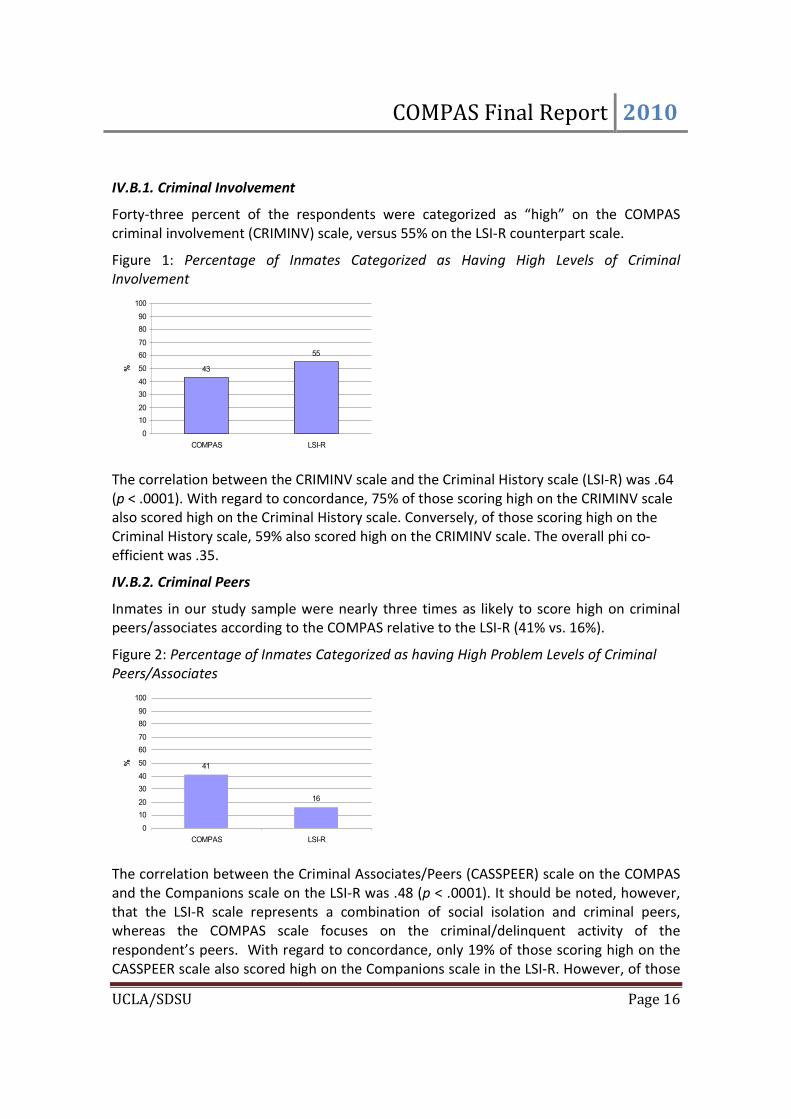
IV.B.1. Criminal Involvement
Forty-three percent of the respondents were categorized as “high” on the COMPAS
criminal involvement (CRIMINV) scale, versus 55% on the LSI-R counterpart scale.
Figure 1: Percentage of Inmates Categorized as Having High Levels of Criminal
Involvement
The correlation between the CRIMINV scale and the Criminal History scale (LSI-R) was .64
(p < .0001). With regard to concordance, 75% of those scoring high on the CRIMINV scale
also scored high on the Criminal History scale. Conversely, of those scoring high on the
Criminal History scale, 59% also scored high on the CRIMINV scale. The overall phi co-
efficient was .35.
IV.B.2. Criminal Peers
Inmates in our study sample were nearly three times as likely to score high on criminal
peers/associates according to the COMPAS relative to the LSI-R (41% vs. 16%).
Figure 2: Percentage of Inmates Categorized as having High Problem Levels of Criminal
Peers/Associates
The correlation between the Criminal Associates/Peers (CASSPEER) scale on the COMPAS
and the Companions scale on the LSI-R was .48 (p < .0001). It should be noted, however,
that the LSI-R scale represents a combination of social isolation and criminal peers,
whereas the COMPAS scale focuses on the criminal/delinquent activity of the
respondent’s peers. With regard to concordance, only 19% of those scoring high on the
CASSPEER scale also scored high on the Companions scale in the LSI-R. However, of those
43
55
0
10
20
30
40
50
60
70
80
90
100
COMPAS LSI-R
%
41
16
0
10
20
30
40
50
60
70
80
90
100
COMPAS LSI-R
%
COMPAS Final Report 2010
UCLA/SDSU Page 17
scoring high on the Companions scale, 50% also scored high on the CASSPEER. The overall
phi co-efficient was .08.
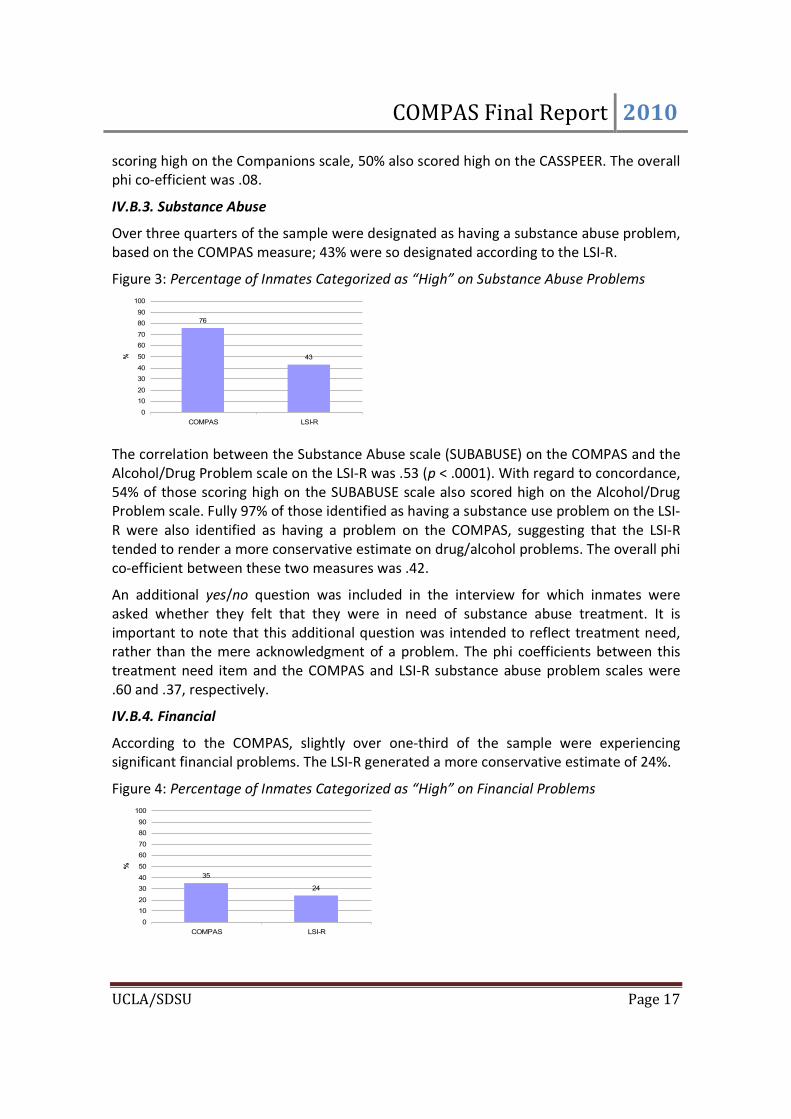
IV.B.3. Substance Abuse
Over three quarters of the sample were designated as having a substance abuse problem,
based on the COMPAS measure; 43% were so designated according to the LSI-R.
Figure 3: Percentage of Inmates Categorized as “High” on Substance Abuse Problems
The correlation between the Substance Abuse scale (SUBABUSE) on the COMPAS and the
Alcohol/Drug Problem scale on the LSI-R was .53 (p < .0001). With regard to concordance,
54% of those scoring high on the SUBABUSE scale also scored high on the Alcohol/Drug
Problem scale. Fully 97% of those identified as having a substance use problem on the LSI-
R were also identified as having a problem on the COMPAS, suggesting that the LSI-R
tended to render a more conservative estimate on drug/alcohol problems. The overall phi
co-efficient between these two measures was .42.
An additional yes/no question was included in the interview for which inmates were
asked whether they felt that they were in need of substance abuse treatment. It is
important to note that this additional question was intended to reflect treatment need,
rather than the mere acknowledgment of a problem. The phi coefficients between this
treatment need item and the COMPAS and LSI-R substance abuse problem scales were
.60 and .37, respectively.
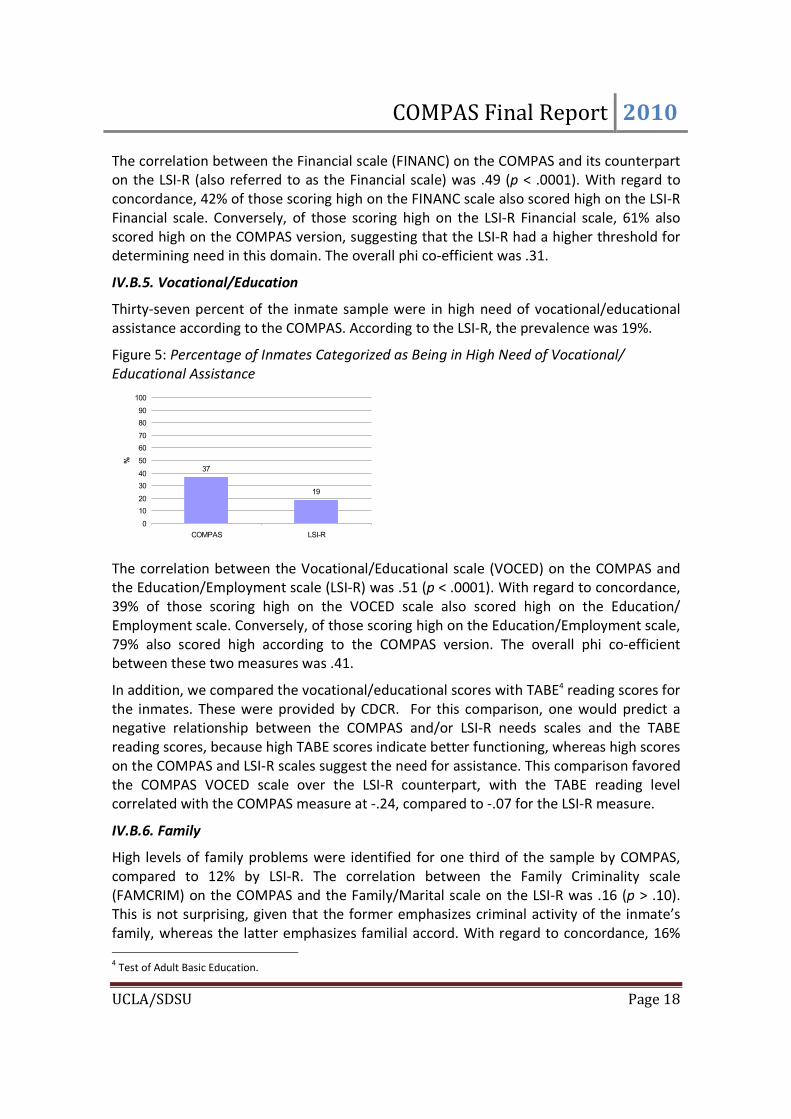
IV.B.4. Financial
According to the COMPAS, slightly over one-third of the sample were experiencing
significant financial problems. The LSI-R generated a more conservative estimate of 24%.
Figure 4: Percentage of Inmates Categorized as “High” on Financial Problems
76
43
0
10
20
30
40
50
60
70
80
90
100
COMPAS LSI-R
%
35
24
0
10
20
30
40
50
60
70
80
90
100
COMPAS LSI-R
%
COMPAS Final Report 2010
UCLA/SDSU Page 18
The correlation between the Financial scale (FINANC) on the COMPAS and its counterpart
on the LSI-R (also referred to as the Financial scale) was .49 (p < .0001). With regard to
concordance, 42% of those scoring high on the FINANC scale also scored high on the LSI-R
Financial scale. Conversely, of those scoring high on the LSI-R Financial scale, 61% also
scored high on the COMPAS version, suggesting that the LSI-R had a higher threshold for
determining need in this domain. The overall phi co-efficient was .31.
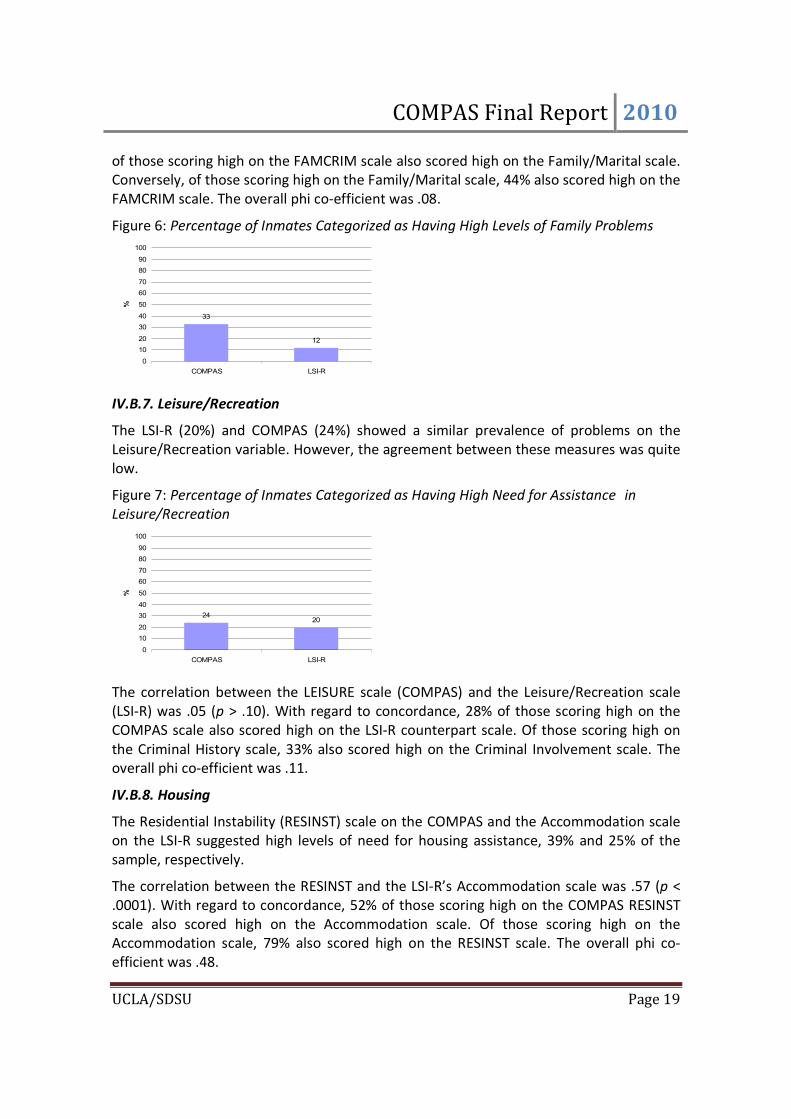
IV.B.5. Vocational/Education
Thirty-seven percent of the inmate sample were in high need of vocational/educational
assistance according to the COMPAS. According to the LSI-R, the prevalence was 19%.
Figure 5: Percentage of Inmates Categorized as Being in High Need of Vocational/
Educational Assistance
The correlation between the Vocational/Educational scale (VOCED) on the COMPAS and
the Education/Employment scale (LSI-R) was .51 (p < .0001). With regard to concordance,
39% of those scoring high on the VOCED scale also scored high on the Education/
Employment scale. Conversely, of those scoring high on the Education/Employment scale,
79% also scored high according to the COMPAS version. The overall phi co-efficient
between these two measures was .41.
In addition, we compared the vocational/educational scores with TABE4 reading scores for
the inmates. These were provided by CDCR. For this comparison, one would predict a
negative relationship between the COMPAS and/or LSI-R needs scales and the TABE
reading scores, because high TABE scores indicate better functioning, whereas high scores
on the COMPAS and LSI-R scales suggest the need for assistance. This comparison favored
the COMPAS VOCED scale over the LSI-R counterpart, with the TABE reading level
correlated with the COMPAS measure at -.24, compared to -.07 for the LSI-R measure.
IV.B.6. Family
High levels of family problems were identified for one third of the sample by COMPAS,
compared to 12% by LSI-R. The correlation between the Family Criminality scale
(FAMCRIM) on the COMPAS and the Family/Marital scale on the LSI-R was .16 (p > .10).
This is not surprising, given that the former emphasizes criminal activity of the inmate’s
family, whereas the latter emphasizes familial accord. With regard to concordance, 16%
4 Test of Adult Basic Education.
37
19
0
10
20
30
40
50
60
70
80
90
100
COMPAS LSI-R
%
COMPAS Final Report 2010
UCLA/SDSU Page 19
of those scoring high on the FAMCRIM scale also scored high on the Family/Marital scale.
Conversely, of those scoring high on the Family/Marital scale, 44% also scored high on the
FAMCRIM scale. The overall phi co-efficient was .08.
Figure 6: Percentage of Inmates Categorized as Having High Levels of Family Problems
IV.B.7. Leisure/Recreation
The LSI-R (20%) and COMPAS (24%) showed a similar prevalence of problems on the
Leisure/Recreation variable. However, the agreement between these measures was quite
low.
Figure 7: Percentage of Inmates Categorized as Having High Need for Assistance in
Leisure/Recreation
The correlation between the LEISURE scale (COMPAS) and the Leisure/Recreation scale
(LSI-R) was .05 (p > .10). With regard to concordance, 28% of those scoring high on the
COMPAS scale also scored high on the LSI-R counterpart scale. Of those scoring high on
the Criminal History scale, 33% also scored high on the Criminal Involvement scale. The
overall phi co-efficient was .11.
IV.B.8. Housing
The Residential Instability (RESINST) scale on the COMPAS and the Accommodation scale
on the LSI-R suggested high levels of need for housing assistance, 39% and 25% of the
sample, respectively.
The correlation between the RESINST and the LSI-R’s Accommodation scale was .57 (p <
.0001). With regard to concordance, 52% of those scoring high on the COMPAS RESINST
scale also scored high on the Accommodation scale. Of those scoring high on the
Accommodation scale, 79% also scored high on the RESINST scale. The overall phi co-
efficient was .48.
33
12
0
10
20
30
40
50
60
70
80
90
100
COMPAS LSI-R
%
2420
0
10
20
30
40
50
60
70
80
90
100
COMPAS LSI-R
%
COMPAS Final Report 2010
UCLA/SDSU Page 20
Figure 8: Percentage of Inmates Categorized as Having High Need for Housing Assistance
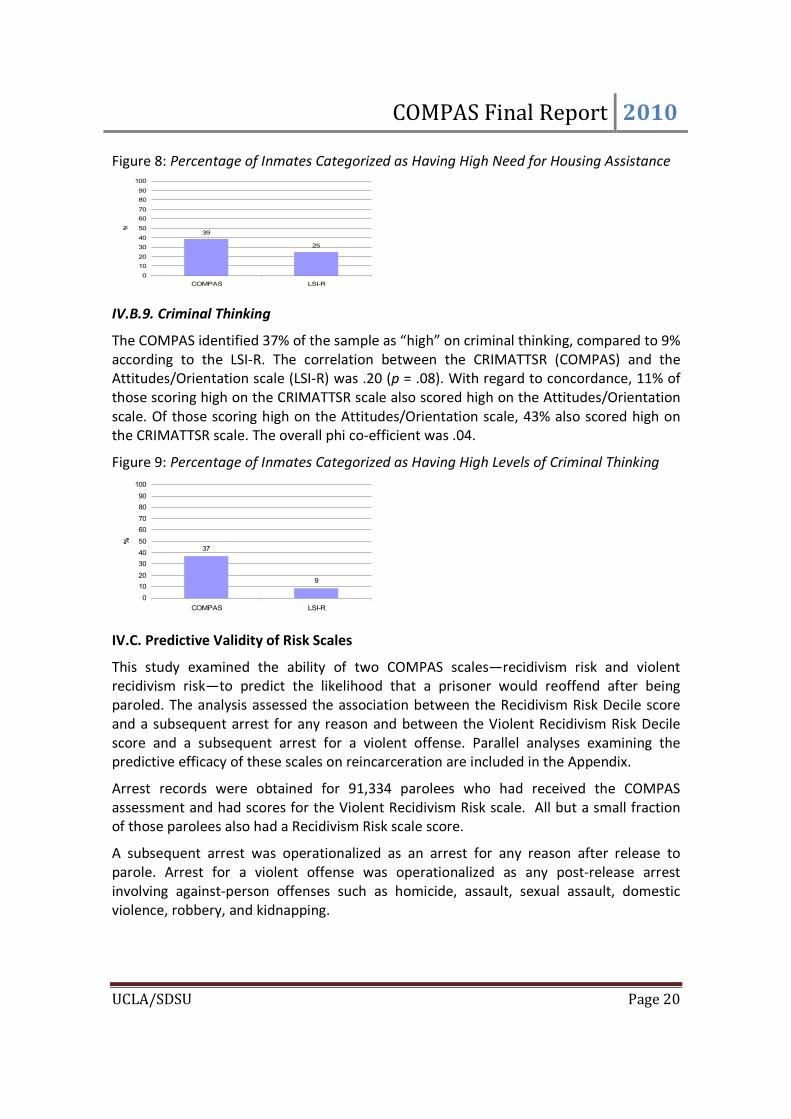
IV.B.9. Criminal Thinking
The COMPAS identified 37% of the sample as “high” on criminal thinking, compared to 9%
according to the LSI-R. The correlation between the CRIMATTSR (COMPAS) and the
Attitudes/Orientation scale (LSI-R) was .20 (p = .08). With regard to concordance, 11% of
those scoring high on the CRIMATTSR scale also scored high on the Attitudes/Orientation
scale. Of those scoring high on the Attitudes/Orientation scale, 43% also scored high on
the CRIMATTSR scale. The overall phi co-efficient was .04.
Figure 9: Percentage of Inmates Categorized as Having High Levels of Criminal Thinking
IV.C. Predictive Validity of Risk Scales
This study examined the ability of two COMPAS scales—recidivism risk and violent
recidivism risk—to predict the likelihood that a prisoner would reoffend after being
paroled. The analysis assessed the association between the Recidivism Risk Decile score
and a subsequent arrest for any reason and between the Violent Recidivism Risk Decile
score and a subsequent arrest for a violent offense. Parallel analyses examining the
predictive efficacy of these scales on reincarceration are included in the Appendix.
Arrest records were obtained for 91,334 parolees who had received the COMPAS
assessment and had scores for the Violent Recidivism Risk scale. All but a small fraction
of those parolees also had a Recidivism Risk scale score.
A subsequent arrest was operationalized as an arrest for any reason after release to
parole. Arrest for a violent offense was operationalized as any post-release arrest
involving against-person offenses such as homicide, assault, sexual assault, domestic
violence, robbery, and kidnapping.
39
25
0
10
20
30
40
50
60
70
80
90
100
COMPAS LSI-R
%
37
9
0
10
20
30
40
50
60
70
80
90
100
COMPAS LSI-R
%
COMPAS Final Report 2010
UCLA/SDSU Page 21
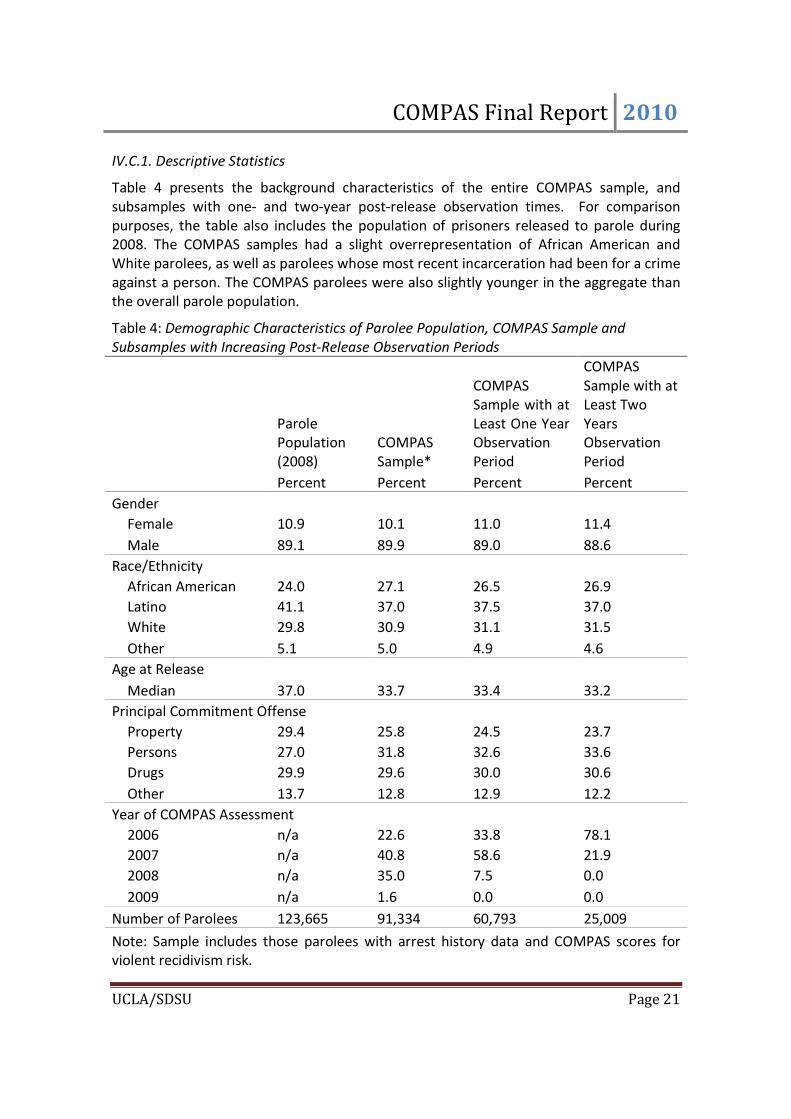
IV.C.1. Descriptive Statistics
Table 4 presents the background characteristics of the entire COMPAS sample, and
subsamples with one- and two-year post-release observation times. For comparison
purposes, the table also includes the population of prisoners released to parole during
2008. The COMPAS samples had a slight overrepresentation of African American and
White parolees, as well as parolees whose most recent incarceration had been for a crime
against a person. The COMPAS parolees were also slightly younger in the aggregate than
the overall parole population.
Table 4: Demographic Characteristics of Parolee Population, COMPAS Sample and
Subsamples with Increasing Post-Release Observation Periods
Parole
Population
(2008)
COMPAS
Sample*
COMPAS
Sample with at
Least One Year
Observation
Period
COMPAS
Sample with at
Least Two
Years
Observation
Period
Percent Percent Percent Percent
Gender
Female 10.9 10.1 11.0 11.4
Male 89.1 89.9 89.0 88.6
Race/Ethnicity
African American 24.0 27.1 26.5 26.9
Latino 41.1 37.0 37.5 37.0
White 29.8 30.9 31.1 31.5
Other 5.1 5.0 4.9 4.6
Age at Release
Median 37.0 33.7 33.4 33.2
Principal Commitment Offense
Property 29.4 25.8 24.5 23.7
Persons 27.0 31.8 32.6 33.6
Drugs 29.9 29.6 30.0 30.6
Other 13.7 12.8 12.9 12.2
Year of COMPAS Assessment
2006 n/a 22.6 33.8 78.1
2007 n/a 40.8 58.6 21.9
2008 n/a 35.0 7.5 0.0
2009 n/a 1.6 0.0 0.0
Number of Parolees 123,665 91,334 60,793 25,009
Note: Sample includes those parolees with arrest history data and COMPAS scores for
violent recidivism risk.
COMPAS Final Report 2010
UCLA/SDSU Page 22
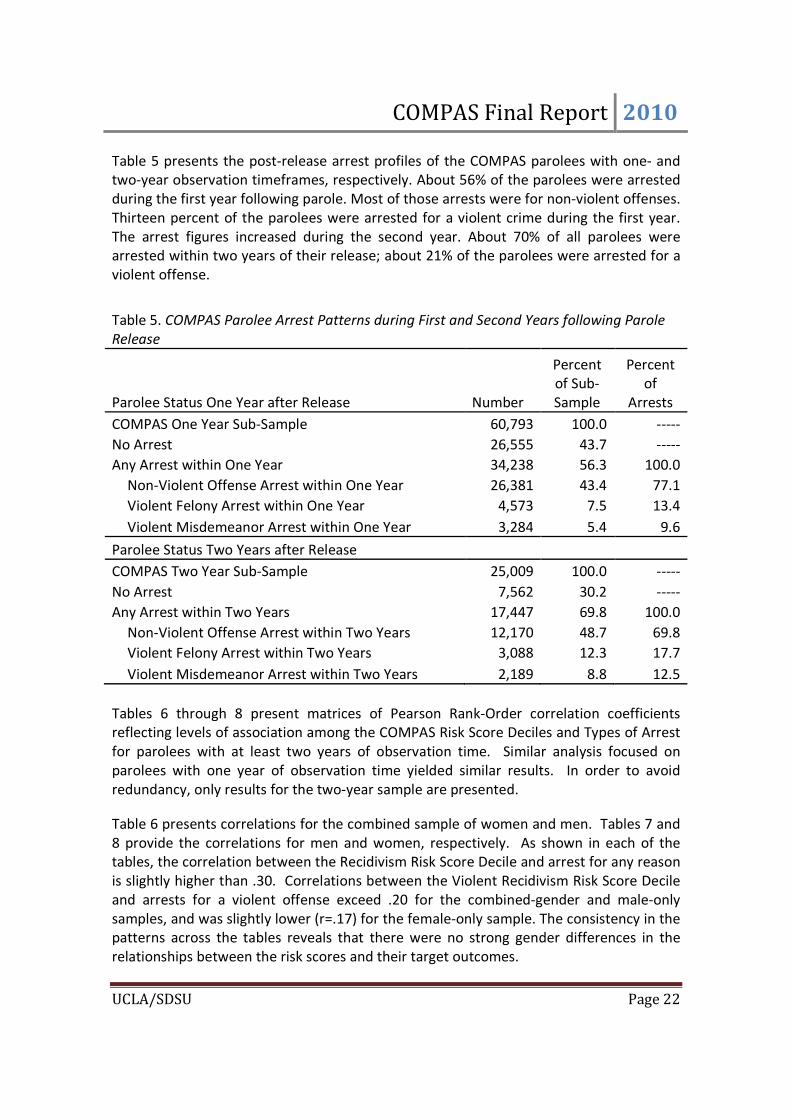
Table 5 presents the post-release arrest profiles of the COMPAS parolees with one- and
two-year observation timeframes, respectively. About 56% of the parolees were arrested
during the first year following parole. Most of those arrests were for non-violent offenses.
Thirteen percent of the parolees were arrested for a violent crime during the first year.
The arrest figures increased during the second year. About 70% of all parolees were
arrested within two years of their release; about 21% of the parolees were arrested for a
violent offense.
Table 5. COMPAS Parolee Arrest Patterns during First and Second Years following Parole
Release
Parolee Status One Year after Release Number
Percent
of Sub-
Sample
Percent
of
Arrests
COMPAS One Year Sub-Sample 60,793 100.0 -----
No Arrest 26,555 43.7 -----
Any Arrest within One Year 34,238 56.3 100.0
Non-Violent Offense Arrest within One Year 26,381 43.4 77.1
Violent Felony Arrest within One Year 4,573 7.5 13.4
Violent Misdemeanor Arrest within One Year 3,284 5.4 9.6
Parolee Status Two Years after Release
COMPAS Two Year Sub-Sample 25,009 100.0 -----
No Arrest 7,562 30.2 -----
Any Arrest within Two Years 17,447 69.8 100.0
Non-Violent Offense Arrest within Two Years 12,170 48.7 69.8
Violent Felony Arrest within Two Years 3,088 12.3 17.7
Violent Misdemeanor Arrest within Two Years 2,189 8.8 12.5
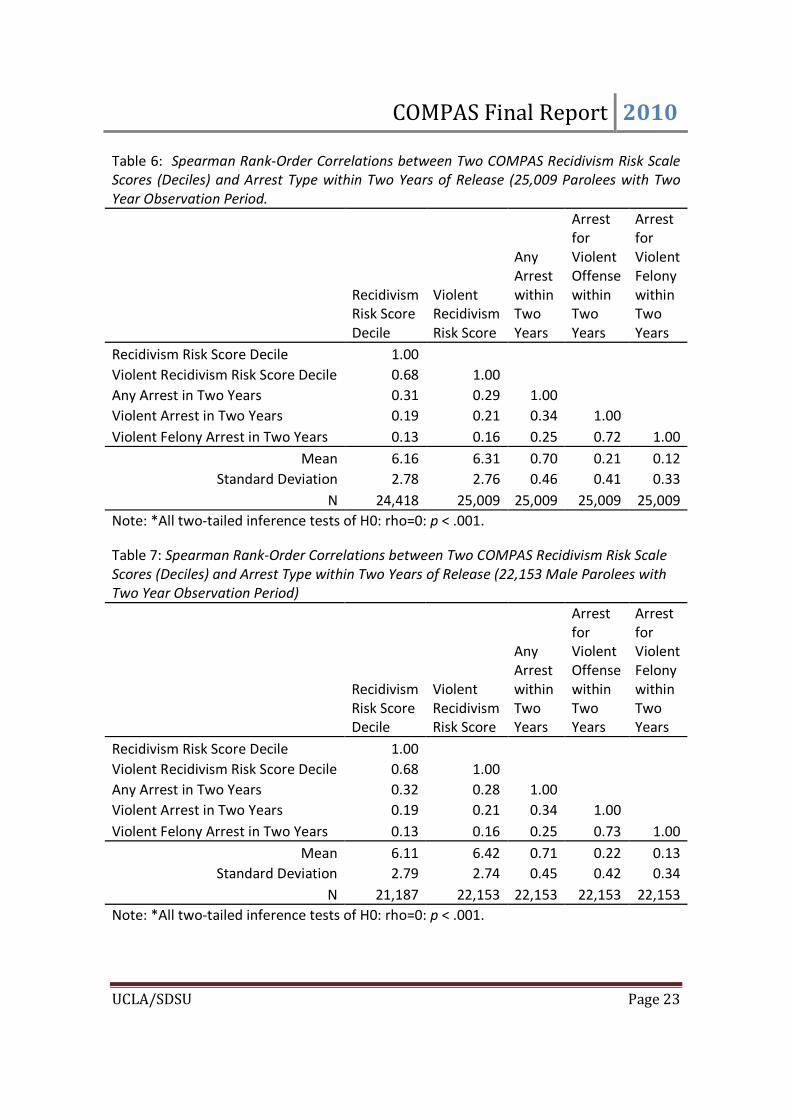
Tables 6 through 8 present matrices of Pearson Rank-Order correlation coefficients
reflecting levels of association among the COMPAS Risk Score Deciles and Types of Arrest
for parolees with at least two years of observation time. Similar analysis focused on
parolees with one year of observation time yielded similar results. In order to avoid
redundancy, only results for the two-year sample are presented.
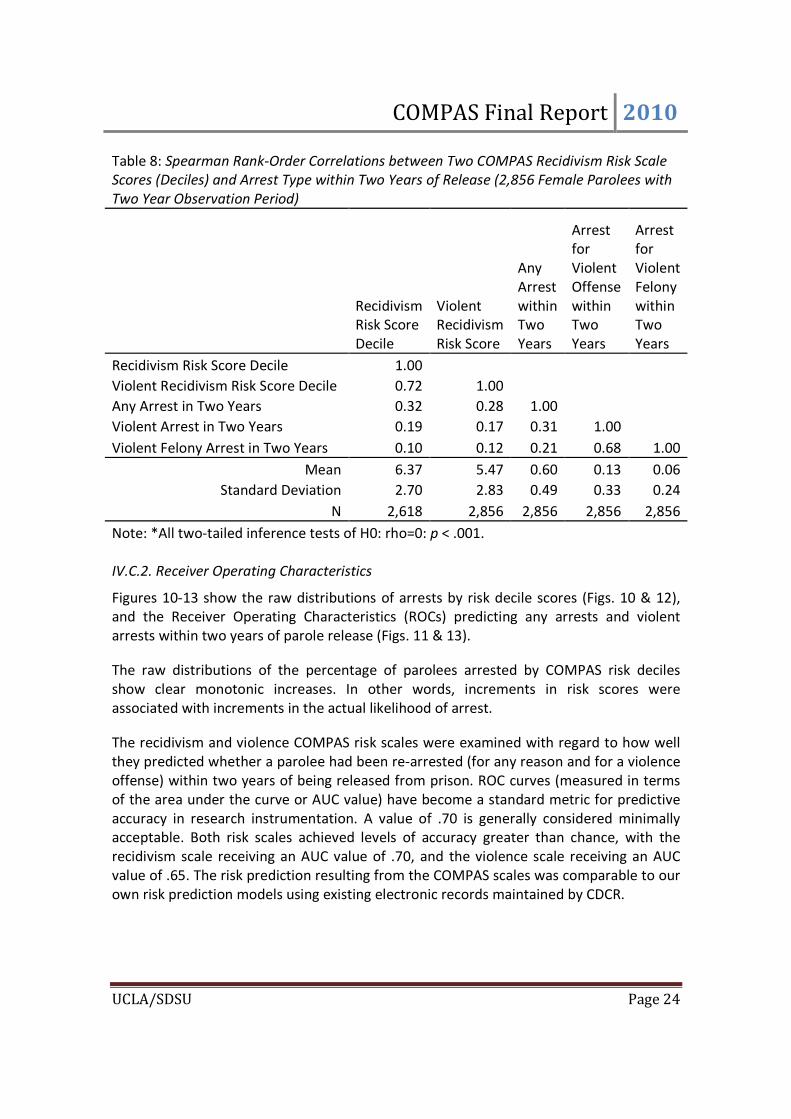
Table 6 presents correlations for the combined sample of women and men. Tables 7 and
8 provide the correlations for men and women, respectively. As shown in each of the
tables, the correlation between the Recidivism Risk Score Decile and arrest for any reason
is slightly higher than .30. Correlations between the Violent Recidivism Risk Score Decile
and arrests for a violent offense exceed .20 for the combined-gender and male-only
samples, and was slightly lower (r=.17) for the female-only sample. The consistency in the
patterns across the tables reveals that there were no strong gender differences in the
relationships between the risk scores and their target outcomes.
COMPAS Final Report 2010
UCLA/SDSU Page 23
Table 6: Spearman Rank-Order Correlations between Two COMPAS Recidivism Risk Scale
Scores (Deciles) and Arrest Type within Two Years of Release (25,009 Parolees with Two
Year Observation Period.
Recidivism
Risk Score
Decile
Violent
Recidivism
Risk Score
Any
Arrest
within
Two
Years
Arrest
for
Violent
Offense
within
Two
Years
Arrest
for
Violent
Felony
within
Two
Years
Recidivism Risk Score Decile 1.00
Violent Recidivism Risk Score Decile 0.68 1.00
Any Arrest in Two Years 0.31 0.29 1.00
Violent Arrest in Two Years 0.19 0.21 0.34 1.00
Violent Felony Arrest in Two Years 0.13 0.16 0.25 0.72 1.00
Mean 6.16 6.31 0.70 0.21 0.12
Standard Deviation 2.78 2.76 0.46 0.41 0.33
N 24,418 25,009 25,009 25,009 25,009
Note: *All two-tailed inference tests of H0: rho=0: p < .001.
Table 7: Spearman Rank-Order Correlations between Two COMPAS Recidivism Risk Scale
Scores (Deciles) and Arrest Type within Two Years of Release (22,153 Male Parolees with
Two Year Observation Period)
Recidivism
Risk Score
Decile
Violent
Recidivism
Risk Score
Any
Arrest
within
Two
Years
Arrest
for
Violent
Offense
within
Two
Years
Arrest
for
Violent
Felony
within
Two
Years
Recidivism Risk Score Decile 1.00
Violent Recidivism Risk Score Decile 0.68 1.00
Any Arrest in Two Years 0.32 0.28 1.00
Violent Arrest in Two Years 0.19 0.21 0.34 1.00
Violent Felony Arrest in Two Years 0.13 0.16 0.25 0.73 1.00
Mean 6.11 6.42 0.71 0.22 0.13
Standard Deviation 2.79 2.74 0.45 0.42 0.34
N 21,187 22,153 22,153 22,153 22,153
Note: *All two-tailed inference tests of H0: rho=0: p < .001.
COMPAS Final Report 2010
UCLA/SDSU Page 24
Table 8: Spearman Rank-Order Correlations between Two COMPAS Recidivism Risk Scale
Scores (Deciles) and Arrest Type within Two Years of Release (2,856 Female Parolees with
Two Year Observation Period)
Recidivism
Risk Score
Decile
Violent
Recidivism
Risk Score
Any
Arrest
within
Two
Years
Arrest
for
Violent
Offense
within
Two
Years
Arrest
for
Violent
Felony
within
Two
Years
Recidivism Risk Score Decile 1.00
Violent Recidivism Risk Score Decile 0.72 1.00
Any Arrest in Two Years 0.32 0.28 1.00
Violent Arrest in Two Years 0.19 0.17 0.31 1.00
Violent Felony Arrest in Two Years 0.10 0.12 0.21 0.68 1.00
Mean 6.37 5.47 0.60 0.13 0.06
Standard Deviation 2.70 2.83 0.49 0.33 0.24
N 2,618 2,856 2,856 2,856 2,856
Note: *All two-tailed inference tests of H0: rho=0: p < .001.
IV.C.2. Receiver Operating Characteristics
Figures 10-13 show the raw distributions of arrests by risk decile scores (Figs. 10 & 12),
and the Receiver Operating Characteristics (ROCs) predicting any arrests and violent
arrests within two years of parole release (Figs. 11 & 13).
The raw distributions of the percentage of parolees arrested by COMPAS risk deciles
show clear monotonic increases. In other words, increments in risk scores were
associated with increments in the actual likelihood of arrest.
The recidivism and violence COMPAS risk scales were examined with regard to how well
they predicted whether a parolee had been re-arrested (for any reason and for a violence
offense) within two years of being released from prison. ROC curves (measured in terms
of the area under the curve or AUC value) have become a standard metric for predictive
accuracy in research instrumentation. A value of .70 is generally considered minimally
acceptable. Both risk scales achieved levels of accuracy greater than chance, with the
recidivism scale receiving an AUC value of .70, and the violence scale receiving an AUC
value of .65. The risk prediction resulting from the COMPAS scales was comparable to our
own risk prediction models using existing electronic records maintained by CDCR.
COMPAS Final Report 2010
UCLA/SDSU Page 25
Figure 10: Percentage of Parolees Arrested within Two Years of Parole Release by COMPAS
Recidivism Score Decile
Figure 11: ROC Chart of COMPAS Recidivism Risk Scale Score Decile (Outcome: Arrested
within Two Years of Parole Release)
0
10
20
30
40
50
60
70
80
90
100
% A
rre
ste
d w
ith
in 2
Ye
ars
COMPAS Recidivism Risk Score Decile
0
0.1
0.2
0.3
0.4
0.5
0.6
0.7
0.8
0.9
1
0 0.1 0.2 0.3 0.4 0.5 0.6 0.7 0.8 0.9 1
Tru
e P
osi
tive
Ra
te (
Sen
siti
vity
)
False Positive Rate (1 - Specificity)
9
8
7
6
5
4
3
21
Area Under Curve = 0.70
Cutpoints
COMPAS Final Report 2010
UCLA/SDSU Page 26
Figure 12: Percentage of Parolees Arrested for Violent Offense within Two Years of
Release by COMPAS Violent Recidivism Risk Score Decile
Figure 13: ROC Chart of COMPAS Violent Recidivism Risk Score Decile (Outcome: Arrested
for Violent Offense within Two Years of Parole Release)
0
5
10
15
20
25
30
35
40
1 2 3 4 5 6 7 8 9 10
Pe
rce
nta
ge
Arr
est
ed
fo
r V
ioe
nt
Cri
me
wit
hin
Tw
o Y
ea
rs
COMPAS Violent Recidivism Risk Score Decile
0
0.1
0.2
0.3
0.4
0.5
0.6
0.7
0.8
0.9
1
0 0.1 0.2 0.3 0.4 0.5 0.6 0.7 0.8 0.9 1
Tru
e P
osi
tive
Ra
te (
Sen
siti
vity
)
False Positive Rate (1 - Specificity)
9
8
7
6
54
32
1
Area Under Curve = 0.65
Cutpoints
COMPAS Final Report 2010
UCLA/SDSU Page 27
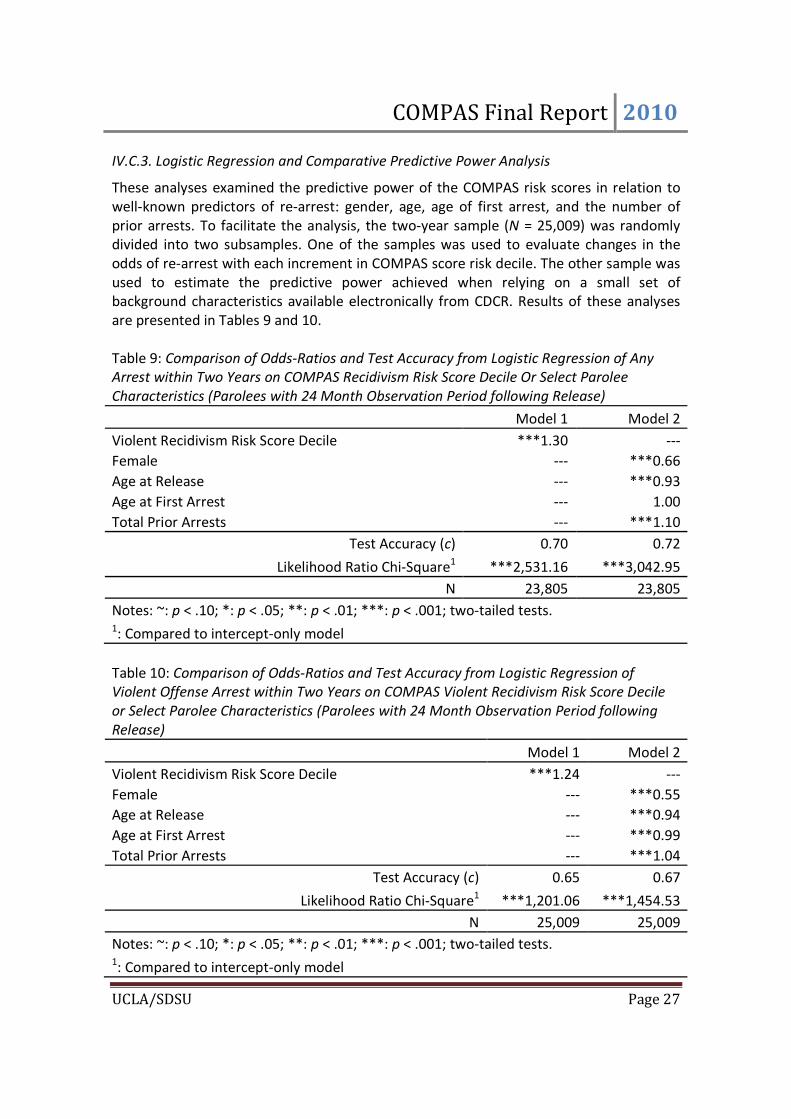
IV.C.3. Logistic Regression and Comparative Predictive Power Analysis
These analyses examined the predictive power of the COMPAS risk scores in relation to
well-known predictors of re-arrest: gender, age, age of first arrest, and the number of
prior arrests. To facilitate the analysis, the two-year sample (N = 25,009) was randomly
divided into two subsamples. One of the samples was used to evaluate changes in the
odds of re-arrest with each increment in COMPAS score risk decile. The other sample was
used to estimate the predictive power achieved when relying on a small set of
background characteristics available electronically from CDCR. Results of these analyses
are presented in Tables 9 and 10.
Table 9: Comparison of Odds-Ratios and Test Accuracy from Logistic Regression of Any
Arrest within Two Years on COMPAS Recidivism Risk Score Decile Or Select Parolee
Characteristics (Parolees with 24 Month Observation Period following Release)
Model 1 Model 2
Violent Recidivism Risk Score Decile ***1.30 ---
Female --- ***0.66
Age at Release --- ***0.93
Age at First Arrest --- 1.00
Total Prior Arrests --- ***1.10
Test Accuracy (c) 0.70 0.72
Likelihood Ratio Chi-Square1 ***2,531.16 ***3,042.95
N 23,805 23,805
Notes: ~: p < .10; *: p < .05; **: p < .01; ***: p < .001; two-tailed tests. 1: Compared to intercept-only model
Table 10: Comparison of Odds-Ratios and Test Accuracy from Logistic Regression of
Violent Offense Arrest within Two Years on COMPAS Violent Recidivism Risk Score Decile
or Select Parolee Characteristics (Parolees with 24 Month Observation Period following
Release)
Model 1 Model 2
Violent Recidivism Risk Score Decile ***1.24 ---
Female --- ***0.55
Age at Release --- ***0.94
Age at First Arrest --- ***0.99
Total Prior Arrests --- ***1.04
Test Accuracy (c) 0.65 0.67
Likelihood Ratio Chi-Square1 ***1,201.06 ***1,454.53
N 25,009 25,009
Notes: ~: p < .10; *: p < .05; **: p < .01; ***: p < .001; two-tailed tests. 1: Compared to intercept-only model
COMPAS Final Report 2010
UCLA/SDSU Page 28
The Model 1 estimate in Table 9 reflects the ROC finding that the Recidivism Risk Score
was a strong predictor of subsequent arrest. Each one-unit increase in the recidivism
decile score corresponded to a 30% increase in the odds of a subsequent arrest. The
Model 2 estimates indicate that parolee’s gender, age, and age of first arrest, and number
of prior arrests resulted in similar predictive accuracy (c = .72). Parallel contrasts shown in
Table 10 (predicting violence) also suggest that the predictive power of the background
factors obtained from CDCR’s electronic records produced comparable outcomes to the
COMPAS.
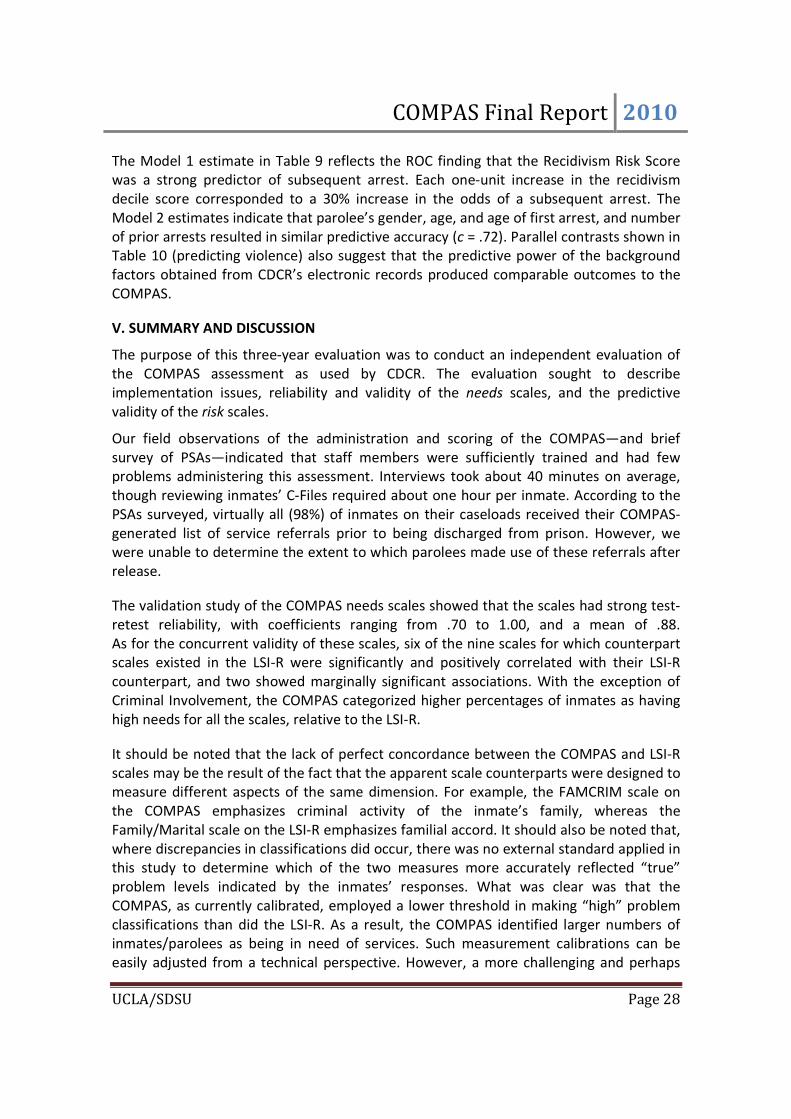
V. SUMMARY AND DISCUSSION
The purpose of this three-year evaluation was to conduct an independent evaluation of
the COMPAS assessment as used by CDCR. The evaluation sought to describe
implementation issues, reliability and validity of the needs scales, and the predictive
validity of the risk scales.
Our field observations of the administration and scoring of the COMPAS—and brief
survey of PSAs—indicated that staff members were sufficiently trained and had few
problems administering this assessment. Interviews took about 40 minutes on average,
though reviewing inmates’ C-Files required about one hour per inmate. According to the
PSAs surveyed, virtually all (98%) of inmates on their caseloads received their COMPAS-
generated list of service referrals prior to being discharged from prison. However, we
were unable to determine the extent to which parolees made use of these referrals after
release.
The validation study of the COMPAS needs scales showed that the scales had strong test-
retest reliability, with coefficients ranging from .70 to 1.00, and a mean of .88.
As for the concurrent validity of these scales, six of the nine scales for which counterpart
scales existed in the LSI-R were significantly and positively correlated with their LSI-R
counterpart, and two showed marginally significant associations. With the exception of
Criminal Involvement, the COMPAS categorized higher percentages of inmates as having
high needs for all the scales, relative to the LSI-R.
It should be noted that the lack of perfect concordance between the COMPAS and LSI-R
scales may be the result of the fact that the apparent scale counterparts were designed to
measure different aspects of the same dimension. For example, the FAMCRIM scale on
the COMPAS emphasizes criminal activity of the inmate’s family, whereas the
Family/Marital scale on the LSI-R emphasizes familial accord. It should also be noted that,
where discrepancies in classifications did occur, there was no external standard applied in
this study to determine which of the two measures more accurately reflected “true”
problem levels indicated by the inmates’ responses. What was clear was that the
COMPAS, as currently calibrated, employed a lower threshold in making “high” problem
classifications than did the LSI-R. As a result, the COMPAS identified larger numbers of
inmates/parolees as being in need of services. Such measurement calibrations can be
easily adjusted from a technical perspective. However, a more challenging and perhaps
COMPAS Final Report 2010
UCLA/SDSU Page 29
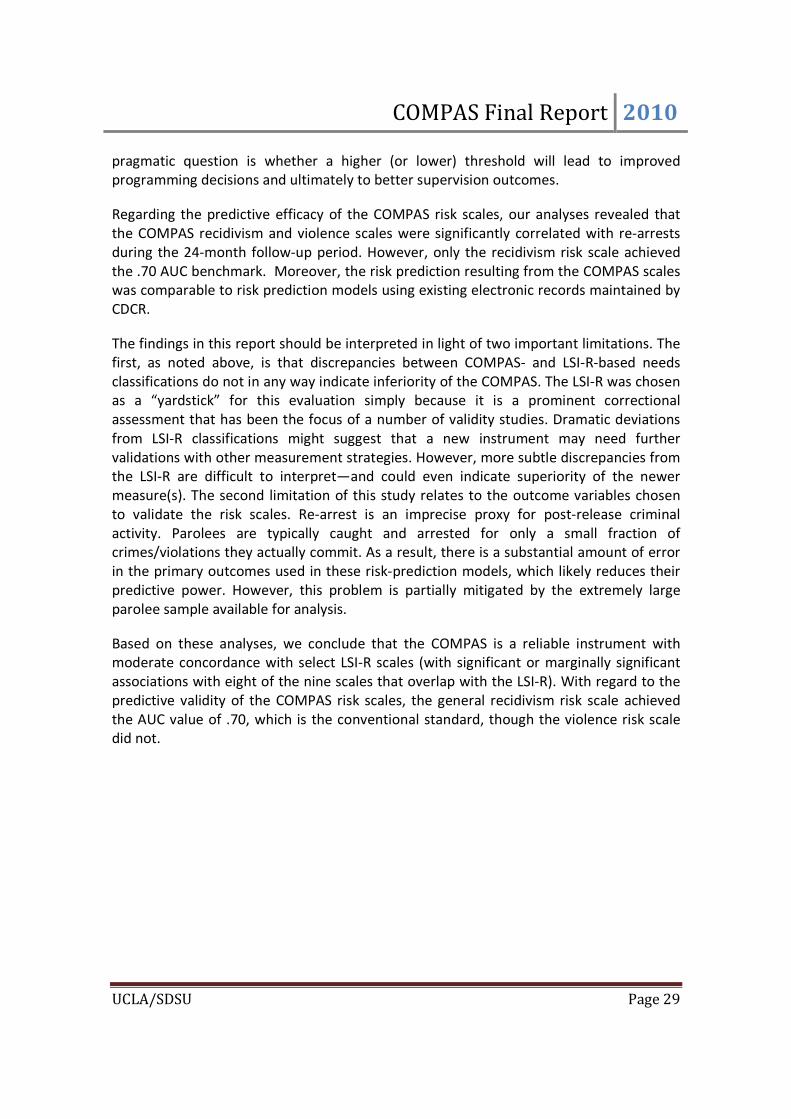
pragmatic question is whether a higher (or lower) threshold will lead to improved
programming decisions and ultimately to better supervision outcomes.
Regarding the predictive efficacy of the COMPAS risk scales, our analyses revealed that
the COMPAS recidivism and violence scales were significantly correlated with re-arrests
during the 24-month follow-up period. However, only the recidivism risk scale achieved
the .70 AUC benchmark. Moreover, the risk prediction resulting from the COMPAS scales
was comparable to risk prediction models using existing electronic records maintained by
CDCR.
The findings in this report should be interpreted in light of two important limitations. The
first, as noted above, is that discrepancies between COMPAS- and LSI-R-based needs
classifications do not in any way indicate inferiority of the COMPAS. The LSI-R was chosen
as a “yardstick” for this evaluation simply because it is a prominent correctional
assessment that has been the focus of a number of validity studies. Dramatic deviations
from LSI-R classifications might suggest that a new instrument may need further
validations with other measurement strategies. However, more subtle discrepancies from
the LSI-R are difficult to interpret—and could even indicate superiority of the newer
measure(s). The second limitation of this study relates to the outcome variables chosen
to validate the risk scales. Re-arrest is an imprecise proxy for post-release criminal
activity. Parolees are typically caught and arrested for only a small fraction of
crimes/violations they actually commit. As a result, there is a substantial amount of error
in the primary outcomes used in these risk-prediction models, which likely reduces their
predictive power. However, this problem is partially mitigated by the extremely large
parolee sample available for analysis.
Based on these analyses, we conclude that the COMPAS is a reliable instrument with
moderate concordance with select LSI-R scales (with significant or marginally significant
associations with eight of the nine scales that overlap with the LSI-R). With regard to the
predictive validity of the COMPAS risk scales, the general recidivism risk scale achieved
the AUC value of .70, which is the conventional standard, though the violence risk scale
did not.
COMPAS Final Report 2010
UCLA/SDSU Page 30
APPENDIX
Receiver Operator Characteristic and Area-Under-the-Curve
Values Predicting Prison Returns (Generally and for a Violent Offense)
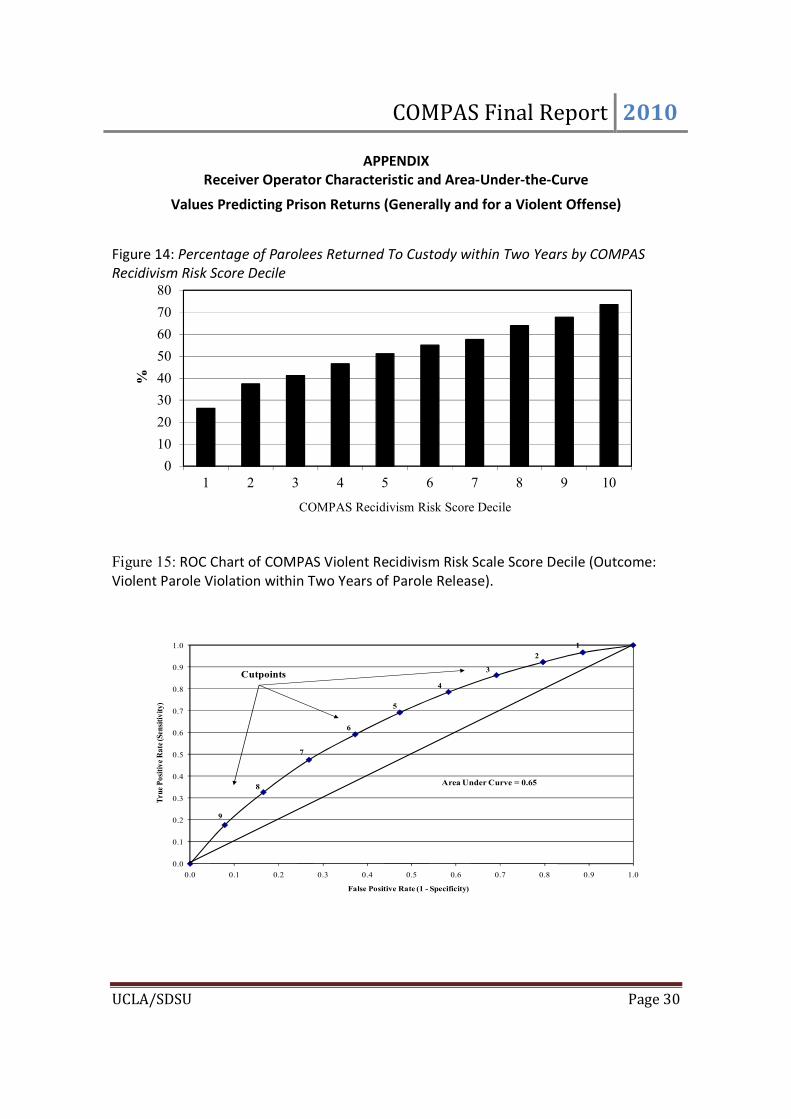
Figure 14: Percentage of Parolees Returned To Custody within Two Years by COMPAS
Recidivism Risk Score Decile
Figure 15: ROC Chart of COMPAS Violent Recidivism Risk Scale Score Decile (Outcome:
Violent Parole Violation within Two Years of Parole Release).
0
10
20
30
40
50
60
70
80
1 2 3 4 5 6 7 8 9 10
%
COMPAS Recidivism Risk Score Decile
0.0
0.1
0.2
0.3
0.4
0.5
0.6
0.7
0.8
0.9
1.0
0.0 0.1 0.2 0.3 0.4 0.5 0.6 0.7 0.8 0.9 1.0
True Positive Rate (Sensitivity)
False Positive Rate (1 - Specificity)
9
8
7
6
5
4
3
2
1
Area Under Curve = 0.65
Cutpoints
COMPAS Final Report 2010
UCLA/SDSU Page 31
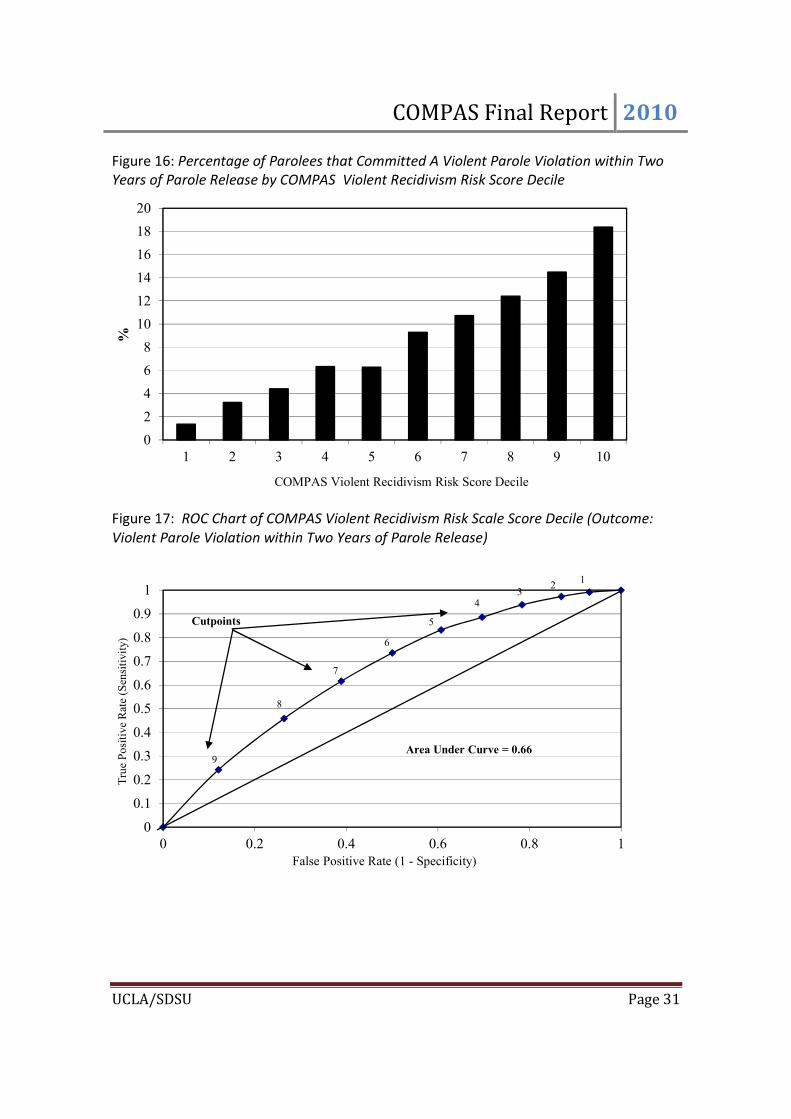
Figure 16: Percentage of Parolees that Committed A Violent Parole Violation within Two
Years of Parole Release by COMPAS Violent Recidivism Risk Score Decile
Figure 17: ROC Chart of COMPAS Violent Recidivism Risk Scale Score Decile (Outcome:
Violent Parole Violation within Two Years of Parole Release)
0
2
4
6
8
10
12
14
16
18
20
1 2 3 4 5 6 7 8 9 10
%
COMPAS Violent Recidivism Risk Score Decile
0
0.1
0.2
0.3
0.4
0.5
0.6
0.7
0.8
0.9
1
0 0.2 0.4 0.6 0.8 1
True Positive Rate (Sensitivity)
False Positive Rate (1 - Specificity)
9
8
7
6
5
43
21
Area Under Curve = 0.66
Cutpoints