Embed Size (px)
Citation preview

COMPARITIVE EXAMINATION OF HOW DIFFERENT PAYMENT
SYSTEMS AFFECT THE LEVEL OF MEDICAL CARE PROVIDED
Alena Marvin - Yakauchyts
Master thesis for the Master of Philosophy Degree in Economics
UNIVERSITETET I OSLO
November, 2009

Preface
I would like to express my gratitude to my supervisor, Kari Eika, for her invaluable
and effective guidance. She helped me a lot throughout the thesis.
I also want to thank my dear parents, my son Alexander, my relatives and my friends
for their immense patience, love and understanding. I would never be able to finish my
studies without their support.
All errors are mine.
Alena Marvin-Yakauchyts
Oslo, 16th of November 2009.

TABLE OF CONTENTS
1 Introduction - 1 -
2 General model of health care provision and consumption. - 7 -
2.1 Demand-side cost sharing - 14 -
3 Supply-Side Cost Reimbursement and Cost Sharing - 15 -
3.1 Fee-For-Services (FFS) - 16 -
3.2 Capitation and Prospective payment systems - 18 -
4 Mixed-Payment Systems - 23 -
5 Empirical evidence on health care system performance - 29 -
5.1 Health outcomes - 29 -
5.2 Determinants affecting health status across countries - 31 -
5.3 Empirical evidence on payment mechanisms - 35 -
5.4 Disparity in access to health care - 36 -
5.5 Health care system performance - 40 -
6 References: - 42 -

- 1 -
1 Introduction
Learning and understanding health economics is very important. First, health is
important to us as individuals and for society because health is essential for prosperity of a
society. The availability of health care can determine the quality of our lives and our
prospects for survival. Health affects time available to produce wealth. Thus, ill health
reduces people`s ability to earn money. Also, it affects one`s happiness. No one likes to
suffer from pain and be useless for society.
Secondly, the health care sector of the economy is very large. Governments
intervene in health care markets to a great degree by regulating who may provide services,
what providers can charge or what profits they may earn, subsidizing healthcare (partly or
fully) and/or directly providing health care (i.e. public hospitals) (Morris,2007). Public sector
pays a substantial proportion of expenditure on healthcare services in many countries all
over the world. Nowadays government expenditures on healthcare constitute an important
and rising share of Gross Domestic Product (GDP).
In this thesis my concern is with the relation between health care resources and
health care performance and physicians behaviour under three different systems: fee-for-
services (payments for every item of care provided), capitation (where healthcare providers
(physicians) are paid a predetermined amount for each person assigned or enrolled to their
practice, whether or not that person seeks care, per period of time.) and mixed payment
systems (which combine elements from both fee-for-services and capitation payment
system).
Health has an important impact on our welfare as human beings. Healthcare is one of
the inputs in achieving better health and is very substantial.
In health economics health care is considered as an economic good. Production of
health care, like production of any other good, requires human resources, capital and raw
materials. Nevertheless, healthcare has some specific characteristics which distinguish it
- 2 -
from other goods. First of all, it is impossible to physically observe the good (health care)
before buying it. Secondly, health care is untradeable. Being bought by one individual it
cannot be sold further to another one. It cannot be traded for some other goods. Thirdly, the
satisfaction (utility) of consuming health care is usually determined in a long run through its
effect on consumer`s health.
Moreover, one of the characteristics which are specific to the market for medical
care is uncertainty. To start with, there is uncertainty about demand of health care goods
and services because individuals cannot predict when and how much medical care they will
demand because of the nature of disease and its incidence are uncertain. There is as well an
uncertainty about access to the medical care required, i.e. there might be a need to travel
abroad in order to get an appropriate treatment. By “appropriate” I mean that healthcare
providers supply their patients with the right medical treatment, and handle them with
sympathy and understanding ect. I would refer to these aspects of care as the quality of
medical services provided. Besides that health care expenditures may require individuals to
spend a significant share of their available income illness may also reduce their ability to
work. As a result of uncertainty about timing and amount of medical treatment costs the
consumers of health care are influenced by financial risk at any time.
Risk averse consumers of medical care want to transfer the risk burden to a third-
party payer such as an insurance company or the government. In this case third-party payers
are responsible for managing the financial risk associated with the purchase of health care
treatment. An individual who dislikes risk, buys an insurance contract paying an agreed
price, premium, in exchange for a payout the insurance company is going to make if the
insured becomes ill. Thus, health insurance removes, in a way, uncertainty facing individuals
with respect to the magnitude of health care expenditure.
Health insurance changes the economic incentives facing both the consumers and
the providers of health care. One of these changes is moral hazard on demand side, which
means that being insured lots of consumers tend to use excess amount of medical services.
Another problem is incomplete coverage. This means that some low income groups of
population might find it difficult for them to afford health insurance.

- 3 -
Another specific characteristic of a medical care market is information asymmetry
between consumers, suppliers of medical care and a third-party (government, insurance
company etc.). To be able to provide medical care, suppliers must obtain a certain level of
medical knowledge. This means that in order to be able to participate on the medical care
market they need to obtain required medical license. Being better informed medical care
providers have an advantage over consumers in judging the quality of medical care.
Considering the fact that it is very difficult for patients to possess information about an
appropriate medical treatment for their condition and following professional norms and
ethics, care providers should make their specialist knowledge available to the patients thus
building a trustful relationship between them and maximizing consumer`s utility.
Nevertheless, the supply of health care can be dictated by the selfish interests of the
provider. In this case, health care providers are concerned only about maximizing their own
utility inducing patients to consume medical services at a level beyond needed or provide
quality below agreed standards. They are thus failing to maximize patient`s utility.
It worth mentioning the concept of a health care system because they are designed
to meet the health care needs of populations. The World Health Organization (WHO) defines
a health care system as the arrangement of all organizations, institutions and resources
devoted to produce actions whose primary intent is to improve health. Health care systems
vary in performance all over the world. Nevertheless, it is possible to illustrate the three
elements common to all health care systems: financing, reimbursement, and production or
delivery (see the Figure below).
Being different health care systems should still be orientated on how best to raise
sufficient funds for health, how to pool them together to spread the financial risks of ill
health, and how to ensure that they are used effectively, efficiently, and equitably.

- 4 -
Figure A basic model of health care system and its financing framework.
The WHO developed three primary goals for what a good health system
performance:
Good health: “making the health status of the entire population as good as possible”
across the whole life cycle (increasing the average health status, reducing health
inequalities etc.).
Responsiveness includes respect for patients and client orientation.
Fairness in financing: ensuring financial protection for everyone, with costs distributed
according to one`s ability to pay. Contribution to the health system should reflect the
difference in disposable income between rich and poor.
Trird-Party Payers
(privite insurers, government,social insurance funds)
Health care providers (hospitals, physicians)
Medical services
Out-of-pocket feesPatients (consumers)
FINANCING REIMBURSEMEN
T
PRODUCTION
(DELIVERY)

- 5 -
In this thesis my concern is with the relation between health care resources and
heath care performance and how different payment mechanism are likely to affect
provider behavior and patient`s consumption of health care treatment referring to the
literature on payment mechanisms.
In the first part of the thesis I will focus on the theoretical foundations of different
payment mechanisms used to finance healthcare providers (physicians), and incentives
they create for physician`s professional behavior and patient`s well-being. I specifically
discuss how as information asymmetry, provider altruism, competition between
providers, physician monitoring may change healthcare provider`s behavior.
In the empirical part I will investigate the theoretical results with relevant empirical
evidence available.
Theoretical part of the thesis is given in Chapter 2 till Chapter 4.
In the second chapter we presented on a general model of health care consumption
and provision. We showed that the demand for health care is determined by patient`s illness
severity and declining in prices for medical care. We also described that being budget
constrained individuals due to the uncertainty about the magnitude of health care
expenditure anxious about catastrophic future healthcare costs and thus enter the insurance
market to protect themselves from future financial losses. The theory showed that being
fully insured individuals face no cost of health treatment and thus wish to consume care
beyond efficient level. The problem of over-consumption is known as a moral hazard
problem. We mentioned one of the ways to illuminate moral hazard by make insurance
contract illness-contingent.
In the third chapter we showed that the excessive consumption can be also reduced
by making individuals pay a portion of their healthcare expenditures. Nevertheless, under
this mechanism patients lose some benefits that full insurance gives them because they face
greater financial risk when the co-payment rate increases due to uncertainty prevailing on
the healthcare market. We examined how information asymmetry alters physicians`
behavior about care provision. In particular, it creates incentives towards provision of

- 6 -
medical treatment beyond the efficient for patient`s health level due to information
asymmetry between care providers and consumers.
In the third chapter we introduced a payment mechanism named capitation and
showed that being paid under this payment mechanism generated opposite incentives than
fee-for-services payment mechanism does. That is, physicians are willing to under-provide
care in order to maximize their revenue. We discussed that under-provision of care can be,
nevertheless, limited by monitoring, medical malpractice litigation, competition between
providers as well as by physician`s altruism and future reputation.
In the forth chapter we discussed that a mix-payment mechanism, which combines
elements of both capitation and fee-for-services payment mechanisms, can do a better job
in promoting both social goals of risk protection and efficient care provision.
In the fifth chapter we were investigating the theoretical results reviewing some
empirical evidence. According to available data and Xe et al (2007) research, we were able to
see the correlation between the amount of people facing catastrophic health expenditure
and out-of-pocket payments, especially in low-income countries where people are tight in
their financial budget. In this part of the thesis we took into consideration the work of Or et
al (2005) who were trying to show the correlation between the amount of physicians
available and mortality based on her analysis of 21 OECD countries over 3 decades. We also
looked at some evidence about health care system performance across some countries in
achieving the main three goals set by the WHO.

- 7 -
2 General model of health care provision
and consumption.
Before trying to examine all three previously mentioned payment systems it would be
rational to study a general basic model of medical care provision and consumption to be able
to adapt this general framework to different physician payment mechanisms in order to
compare them (Lèger,2008).
In order to show the main principle of medical care provision we simplify the analysis
by making some assumptions. One of them is that we consider a situation with only one type
of provider of medical services, physicians. Another is that patients pay for all care services
with their own money, i.e. the first party system. Furthermore we let physicians have perfect
diagnostic abilities and we exclude prevention and innovation from the consideration.
As we all know people are born with a certain stock of health. Unfortunately not
everyone is born 100 percent healthy. Lots of people are allocated with a stock of health
below the “healthy” level, i.e. are born with some sickness or disability. Almost every single
member of the world`s population gets sick or injured through time. Every sickness that
comes along decreases the stock of one`s health. Besides that a stock of health allocated at
birth depreciates with age. Depreciated health can be augmented by investments in medical
services as well as due to personal effort in achieving better health (quality of one`s life,
which has an undeniable influence on health). By investments in medical services I mean
consumption of medical treatment which cost money. Due to a huge variety of diseases,
sicknesses and injures the level of necessary medical care required is different in each mishap.
Thus we can conclude that consumption of medical services depends on illness severity. A
person who seeks for and receives medical attention, care or treatment, including the one
who is visiting a physician for a routine check-up will be viewed as a patient. Thus the
patient`s health is a decreasing function of illness severity (𝛿) and an increasing function of
medical treatment 𝜏 . That is,
H = h(𝛿, 𝜏) (1.1)
- 8 -
Where 𝜕ℎ
𝜕𝛿< 0 reflects negative effect, i.e. decrease in person`s initial health stock
due to sickness, and 𝜕ℎ
𝜕𝜏> 0 reflects positive correlation between medical care and health.
We assume that patients in our model consume to types of goods, that is medical
services and non-medical goods like everyday utilities, which yield a certain level of
satisfaction, i.e. utility. Every person has some preferences over its health and consumption.
This means that the utility function is totally subjective. We can express patient`s utility as a
function of health and consumption:
𝑈 𝐻,𝐶𝑛𝑚 (1.2)
where (H) – health, (𝐶𝑛𝑚 ) – consumption of non-medical goods and 𝑈𝐻 > 0, 𝑈𝐻𝐻 < 0,
𝑈𝐶𝑛𝑚 > 0, 𝑈𝐶𝑛𝑚 𝐶𝑛𝑚 < 0 and 𝑈𝐻𝐶𝑛𝑚 > 0. This reflects the diminishing marginal utility of
consumption, which means that each additional visit to a doctor (as well as consumption of
non-medical goods) yields a smaller increase in total utility than the previous one.
It is not feasible to predict when the sickness will take place. On this base it will be
convenient to use a probability distribution to reflect the randomness (uncertainty) of bad
health occurrence. Let us assume that the probability to stay healthy is (d) and the probability
to get sick is (1-d).
Due to uncertainty about becoming ill and at what cost, patients receiving healthcare
services under the first party system (i.e. paid by patients, the first party) face financial risks at
any time. Thus, their consumption of medical services and non-medical goods will depend on
the illness severity that they might suffer. To be able to purchase medical-care services at a
per-unit price (p) the patient should have some income (I). We can now represent the
patient`s expected utility function by:
EU = d*U(𝐻0,𝐶𝑛𝑚 ) + (1-d)*U (h(𝛿, 𝜏), 𝐶𝑛𝑚 )
The amount of medical care and other goods which are feasible for every patient to
obtain is constrained by its income and the prices of healthcare and other goods.
I = 𝐶𝑛𝑚 + (1 − 𝑑) ∗ 𝑝𝜏 (1.3)

- 9 -
Equation (1.3) represents patient`s budget constraint, i.e. what the consumer can
afford to buy at prevailing prices and income available. Where we assume that the price of
consumption of non-medical goods (𝐶𝑛𝑚 ) is normalized to 1 (Lèger,2008).
As we mentioned above, medical care is one of the inputs in increasing health and
health itself generates utility. Individuals desire to remain healthy because they receive utility
from an overall improvement in the quality of life. Being healthy they have more time
available to work and enjoy leisure time activities. There is a positive correlation between an
individual`s stock of health and total utility. Nevertheless, each additional improvement in
health generates an ever smaller increase in utility (known in economics as a law of
diminishing marginal utility).Thus, given consumer`s available income each consumer will try
to choose a bundle of goods and services that maximizes his/her utility. The utility will be
maximized when the marginal utility gained from the last dollar spent on each product is
equal across all goods and services purchased, assuming that all prices are known and law of
diminishing marginal utility works for all goods. Thus, if a patient is ill he/she would like to
improve his/her health by buying a certain amount of medical services. A maximum utility for
a consumer who suffers from an illness of severity δ will be achieved by choosing a quantity
(τ) of medical services such that:
𝜕𝑈
𝜕ℎ
𝜕ℎ
𝜕𝜏 = 𝑝
𝜕𝑈
𝜕𝐶𝑛𝑚 (1.4)
or we can rearrange the equation to define the price
𝜕𝑈
𝜕ℎ
𝜕ℎ
𝜕𝜏
𝜕𝑈
𝜕𝐶𝑛𝑚
= 𝑝 (1.5)
This equation states that an individual is willing to sacrifice consumption of non-
medical goods in order to increase consumption of medical care until the point when
marginal rate of substitution equals to the price of health care.
The last function can be used to define a demand function of medical services if we
assume that there exists a unique utility-maximizing quantity of medical services for each
illness-severity price pair:
𝜏 = 𝜏 𝛿, 𝑝 (1.6)

- 10 -
According to demand theory the amount of medical services demanded will decrease
in their prices 𝜕𝜏
𝜕𝑝< 0 and increase in illness severity
𝜕𝜏
𝜕𝛿> 0 . In other words, the
demand curve is downward-sloping in prices, that is we move along the line when prices
change, and shifts outwards when illness severity increases. We can illustrate with a graph
how the demand function of medical services changes in prices and illness severity.
𝒑∗ = 𝒎𝒄
Fig. 1.1 Efficient consumption of medical services.
The intersection of the demand curve and the marginal-cost curve (𝑚𝑐) gives us the
efficient consumption level of medical services for a patient who suffers from illness severity
𝛿 and is denoted as 𝜏∗ 𝛿,𝑝∗ or just 𝜏∗ (Lèger,2008).
Being uninsured leads to significant financial risks due to uncertainty in the market of
medical care. Thus risk-averse patients would like to purchase health insurance in order to
increase their expected utility. Health insurance allows patients to receive medical services at
either reduced costs or free of charge in exchange for payments paid in advance.
Let assume that individuals can purchase an insurance policy which covers all medical
expenses. That is in order to get an insurance the customer must pay an up-front premium
Efficient consumption
Price per unit
Quantity of medical services
demanded
𝝉∗
Demand curve for given illness severity:
𝝉 𝒑

- 11 -
(𝛼) which exactly equals his/her expected medical expenses (income lost). The fair premium is
equal to the probability of becoming ill multiplied by the individual`s lost income if he/she
becomes ill (i.e. by the amount of income that they would expect to lose on average if they
were uninsured). Such a policy is called a fair premium policy. Mathematically, (𝛼) is defined
by:
α = 1 − 𝑑 𝑝∗𝜏 𝛿,𝑝 (1.6)
As a result of insurance policy existence, we can rewrite the patient’s budget
constraint previously given by the Eq. (1.3)
I = 𝐶𝑛𝑚 + α
Being insured our patients will not face financial risks any longer since after the
insurance premium is paid they will get full medical treatment free of charge. This will give
certainty to people about being able to receive medical care “as needed” when sickness
strikes them and they will keep the consumption of non-medical goods constant across illness
severity.
Furthermore, the insured patient will now choose the quantity of medical services to
satisfy the first order condition derived by Eq. (1.4) but now the price of medical services will
be set to zero to reflect the free of charge medical treatment that a patient receives:
𝜕𝑈
𝜕ℎ
𝜕ℎ
𝜕𝜏 = 0 (1.7)
This equation states that being fully-insured a patient will consume medical services
until the moment when the marginal benefit of health care services would equal zero. Thus,
the existence of an insurance policy at a fair premium alter consumer`s behavior and leads to
over-consumption of medical services. This situation is known as the moral-hazard problem
(McGuire, 1993).

- 12 -
It is very useful to illustrate and analyze this problem by graph:
𝒑∗ = 𝒎𝒄
Fig. 1.2 Consumption of medical services under a fair insurance policy.
It is obvious from the graph and the analysis above that fair health insurance results in
over-consumption of medical services. The actuarially fair insurance premium should take this
occurring overconsumption into account. Since the quantity of the care units consumed
under insurance policy 𝜏∗∗ is greater than the efficient amount 𝜏∗ , the fair insurance
premium will be also greater than the one the patient would have paid if he/she was forced
to consume and will be given by:
α** = 1 − 𝑑 𝑝∗𝜏∗∗ 𝛿,𝑝 > α* = 1 − 𝑑 𝑝∗𝜏∗ 𝛿,𝑝
The consumer’s expected utility would be greater under the efficient provision of care
𝜏∗ 𝛿,𝑝∗ and its corresponding insurance premium 𝛼∗ than it would be if he/she were
allowed to choose his/her own level of consumption of medical services 𝜏∗∗ 𝛿 but faced a
higher insurance premium 𝛼∗∗(Lèger,2008).
A transition from uninsured to insured changes the consumer`s behavior because they
no longer face the full cost of medical care received such leading to a moral hazard problem.
Efficient consumption
Quantity of medical services 𝝉∗
Demand curve for given illness
severity : 𝝉 𝒑
Price per
unit
𝝉∗∗
Over consumption

- 13 -
One of the ways to illuminate moral hazard is to make insurance contract illness-
contingent. That is, an insurance contract should specify a reimbursement schedule, which
means that a certain amount of money should be transferred to the patient depending on
his/her illness severity. i.e.
Reimbursement = 𝜏 𝛿
Arrow (1963) argues that it is possible to eliminate ex-post moral-hazard if a patient
with illness severity 𝛿 and receiving a reimbursement in the amount of 𝜏 𝛿 , could purchase
health care services at market price 𝑝∗. He means that such a policy would maintain the
benefits of full insurance (i.e., the consumer would not face any financial risk associated with
illness) while maintaining the correct incentives for consumption (i.e., eliminate the ex-post
moral-hazard) (Arrow ,1963).
From a theoretical stand point such an insurance contract would be an optimal form,
nevertheless in practice it is not feasible because it is almost impossible and very expensive
for an insurance provider to verify the patient’s illness severity with precision prior to
reimbursement.
Since illness-contingent contracts are not feasible, different polices were developed in
order to reduce the over-consumption of medical services. One of the ways is a demand-side
cost sharing such as co-payments.
In the next chapter we focus on how demand-side cost sharing mechanism
theoretically affects the provision of medical care units, incentives it creates for physician’s
referral decisions and patient selection.

- 14 -
2.1 Demand-side cost sharing
Since we allowed for an access to the insurance market and introduced a fair premium
policy we faced a problem of over consumption of medical care units. We showed that such a
policy creates incentives for consumption of medical services which exceeds the efficient
level. It was considered that it is possible to reduce consumption to more efficient level by
forcing patients to pay for a portion (𝛾𝑝) of their medical expenses, where 𝛾 is a percentage
of their healthcare expenditures. Thus we will try to illustrate by a graph how co-payments
might help to control consumption of medical treatment.
Let us look at the graph below:
Fig.1.3 Consumption of medical services under partial insurance.
We can see that being forced to pay some portion of medical costs patients will
consume less than under a full insurance 𝑤ℎ𝑒𝑛, 𝛾 = 0 . Nevertheless over consumption will
still take place.
Demand-side cost sharing has some disadvantages even though it may help to reduce
the over-consumption of health care units. Under this system patients lose some benefits that
full insurance gives them because they face greater financial risk when the co-payment rate
𝝉∗∗∗
𝒑∗ = 𝒎𝒄
Efficient consumption
Quantity of medical services 𝝉∗
Demand curve for given illness
severity : 𝝉 𝒑
Price per
unit
𝝉∗∗
Over consumption
𝛾𝑝
Co-payment
consumption

- 15 -
increases due to uncertainty about timing of illness occurrence and magnitude of future
medical expenses. Furthermore, even though a co-paid portion might rise it does not
necessarily mean that patients will decrease their consumption of medical units because they
might lack information about their illness severity and fully trust their physicians and delegate
their decision-making responsibilities to them.
3 Supply-Side Cost Reimbursement and
Cost Sharing
Reimbursement of healthcare services has undergone an evolutionary change. From
the very beginning health care services were reimbursed with the first party system. That is
by a pure fee-for services mechanism, when patients, the first party, were paying for all the
healthcare services with their own money when medical care was delivered. As our society
moved into the 1900`s, health care improved dramatically. More sophisticated surgical
techniques, drugs and effective treatments for severe diseases were developed. As a
consequence of these improvements prices for medical services increased significantly.
Medical services were no longer achievable for the average citizen. Low-income population
faced the threat of catastrophic illness. In order to limit the risk of severe sicknesses, health
care insurance was evolved. Thus health market moved to a third party reimbursement
system. Now insured individuals suffering from severe health problems could seek care ”as
needed” knowing that the cost of treatment will be covered by their insurance carrier.
- 16 -
3.1 Fee-For-Services (FFS)
Physicians in many countries all over the world are paid by a Fee-For-Services (FFS) or
out-of-pocket cost-reimbursement mechanism, when physicians are paid for each service
they provide such as office visit, test, procedure or others and bare no financial risk. Under
such a payment mechanism uninsured or not fully insured patients might face catastrophic
health expenditures because they are budget constrained and have to pay providers directly
for their services at a delivery point and then can submit claims to their insurance company
for reimbursement.
We will focus on how such a payment mechanism alters physicians` behavior. When
patients are paying for each medical service they receive incentive arise for the physicians to
provide as more services as possible in order to increase their own revenue taking into
consideration the existence of information asymmetry between care deliverers and
consumers.
Production of medical care is associated with costs. We assume that every physician
has some monetary cost of providing medical treatment that consists of fixed cost 𝐹 and
variable cost 𝑣 (Chalkley, 2000). Healthcare supplier bares fixed cost independently of the
amount of care provided while variable cost is increasing in number of patients treated 𝑛 and
the quality of treatment 𝑞 and decreasing with cost-reducing effort 𝜖. Thus we can express
the physician’s per-patient revenue by the following equation:
𝜋𝑓𝑓𝑠 = 𝑅𝜏 − 𝑣𝜏 − 𝐹 = 𝑅 − 𝑣 𝜏 − 𝐹 (1.8)
As we can see physicians’ revenue equals the difference between the fee paid by a
patient for a service 𝑅 and the variable cost per service 𝑣 times the amount of medical
units provided 𝜏 and fixed cost. In such a setting, as long as 𝐹 > 𝑣 every income-orientated
healthcare provider will be concerned about its financial surplus and would like to supply as
many services as possible in order to increase their revenue even though such an amount of
services brings no benefit to patient’s health (Evans, 1974).

- 17 -
Our interest of study is how physicians are able to persuade their patients to consume
excessive units of medical services in order to increase their own revenue.
In real world, due to asymmetry in information prevailing on a market for medical
services between consumers and providers of medical treatment, physicians have privileged
information about the sophisticated medical treatments available and expertise which they
can easily use to encourage patients to consume an inefficiently large amount of medical
services. A physician might manipulate with information about the patient’s illness severity
and the expected returns associated with medical treatment and thus influence the demand
for medical services. In other words, physicians may to alter the patient`s preferences
towards their own self interest in order to achieve higher revenue (Culyer, 2000), (Stano,
1989). This situation is known as supplier-induced demand (SID).
Patient do not have access or do not possess sufficient information about healthcare
services prevailing on the healthcare market and thus cannot evaluate what is appropriate
treatment for each of the sick outcomes. It is more likely that in this case an individual will
accept the physician’s diagnosis and treatment he prescribes. By manipulating information
about a patient’s health condition, physicians shift patient’s demand curve outwards thus
increasing physician’s income as shown on the graph below.
𝒑∗ = 𝒎𝒄
Fig. 1.4 Consumption of medical services with supplier-induces demand.
Price per unit
Efficient consumption
Quantity of medical services 𝝉∗
Demand curve for true illness severity 𝝉 𝒑
𝝉∗∗
Over consumption Supplier-induced demand
Demand curve for higher illness severity 𝝉 𝒑

- 18 -
As is shown in Fig. 1.4 a physician reports to his/her patient a diagnosis that does not
coincide with the patient’s true illness severity and thus by shifting patient’s demand curve up
the physician increases his/her income from 𝑅 − 𝑣 𝜏∗ to 𝑅 − 𝑣 𝜏∗∗ due to over
consumption.
Given that the physician’s revenue function is increasing in quantity of medical
services provided to their patients, a completely selfish physician would aim on getting
highest possible income by exaggerating the patient’s illness severity without limits.
Nevertheless, in practice such a desire is in fact limited. There are physicians that respect
professional norms and ethics and thus aware of the fact that excessive medical treatment
might be harmful to the patient’s health. Another reason is that manipulating information
requires some physician’s effort and the benefit from doing so might be less than the costs
associated with information manipulation (Van de Val, 2000). We cannot neglect the fact that
physicians might be cautious about a patient’s attempt to seek for a second opinion from
another physician and thus face a risk of losing their patients especially when patients have
access to information and communication technologies about medical care services. One of
the reasons for induced manipulation can also be anxiety about losing income. In other
words, when the supply of physicians is low and/or the demand for medical services is very
high physicians would not need to manipulate information in order to increase their income.
However, when there are many physicians working on the market and the demand for
services decreases, the benefits of inducing demand become greater (Blomqvist, 2005).
3.2 Capitation and Prospective payment systems
We mentioned above that in conditions of uncertainty third-party payers (the
government, social insurance funds or private insurance companies) play an essential role on
the medical care market. Under capitation health care providers (physicians) are prepaid by
the government a set amount of money for each patient assigned or enrolled to their
practice, referred to as "per-member-per-period" rate, regardless of the number or nature of

- 19 -
services provided, i.e. prior to the patient’s realization of illness. In return, healthcare
providers are obliged to supply all necessary care to their patients for the predetermined
period, without any extra cost reimbursement (Murray, 2000). This “per-member-per-period"
rate is based on the patient’s average expected medical utilization for a predetermined period
of time (more compensation for patients with medical history). Healthcare service providers
are remunerated whether or not the person enrolled in his/her practice seeks care. The
amount of that remuneration is usually adjusted for age, gender, illness, race, type of
employment and geographical location. The common upon these factors is age. The senior
population (above age 65) will be expected to utilize more health care services that the
population under this age. Since physicians are paid in advance for all future expenditures
associated with provision of medical services, they are responsible for all medical expenses
incurred by the patient. As a result, healthcare providers (physicians) face the entire financial
risk of healthcare provision and consequently will wish to control costs in order to increase
their income.
Providers of medical care working under capitation plans will probably practice more
on providing preventive healthcare services as it is less expensive to prevent diseases and
injuries that patients might get rather than curing them compared with the traditional fee-
for-service reimbursement, where there is a tendency to over-prescribe, over-diagnose, and
over-treat to secure more revenue since physicians earn a net profit on each visit, and
procedure (Selden, 1990).
To start the analysis of how capitation affects healthcare provider decisions associated
with provision of care we assume that patients are randomly assigned to physicians. This
means that healthcare provider has no effect on the type of individuals that he will treat
according to his/her preferences. Otherwise risky type of population will be left outside of
health system.
Suppose now that there is a probability 1 − 𝑑 that a patient gets sick with an illness
severity 𝛿 . We also assume that illness severity is bounded by 𝛿𝐿 and 𝛿𝐻 such that
𝛿 ∈ 𝛿𝐿;𝛿𝐻 and that there is a certain level of care for each illness severity 𝜏𝐸 𝛿 . Physician’s
expected cost associated with treating a patient will be:
𝐸 𝑣𝜏 = 1 − 𝑑 𝑣𝜏𝐸 𝛿 𝛿𝐻
𝛿𝐿

- 20 -
where 𝑣 as before denotes the per-unit variable cost of medical service`s provision.
A net per-patient payment that a physician who enlists a patient into their practice
receives equals:
𝜋𝑐𝑎𝑝𝑖𝑡𝑎𝑡𝑖𝑜𝑛 = 𝑅 − 𝑣𝜏 − 𝐹 (1.9)
where 𝑅 denotes the capitation payment per-patient.
The physician’s per-patient expected income under appropriate treatment is given by
𝐸 𝜋𝑐𝑎𝑝𝑖𝑡𝑎𝑡𝑖𝑜𝑛 = 𝑅 − 𝐸 𝑣𝜏 (1.10)
Looking at the equation above we can state that prospectively paid providers seek to
attract a low-cost group of patients since their income is depended on the amount of medical
units provided to the patients. This creates incentives for information manipulation about
patient’s illness severity in order to receive higher revenue. An optimal strategy for a purely
selfish physicians would be to tell their patients that they suffer from the lowest illness
severity 𝛿𝐿 and to recommend the corresponding level of treatment 𝜏𝐸 𝛿𝐿 . Consequently,
physicians will receive per-patient net payment such that
𝜋𝑐𝑎𝑝𝑖𝑡𝑎𝑡𝑖𝑜𝑛 = 𝑅 − 𝑐𝑣 𝛿𝐿 > 𝜋𝑐𝑎𝑝𝑖𝑡𝑎𝑡𝑖𝑜𝑛 = 𝑅 − 𝑣𝜏𝐸 𝛿𝑡𝑟𝑢𝑒 (1.11)
If we relax the assumption we made above about patients being randomly selected
and allow physicians to choose patients themselves then we can conclude the following. Since
physicians are medically educated they might observe some characteristics that are
unobservable to insurance provider and thus will try to attract (i.e. encourage to join) people
who are observably more healthy in order to receive more income while discouraging the
others from joining.
Although theoretical analysis suggests that under capitation physicians can under-
provide medical services drastically, in practice we can experience that physicians may
provide more services that our analysis predicted. Why is that?
There are both physicians that ignore their patient’s benefits from treatment in order
to increase income and physicians with altruistic motives or medical ethics. Nevertheless,
many have argued that physicians are likely to value both their own revenue and their

- 21 -
patient’s well-being. Many profit-maximizing suppliers are concern about their future
reputation. Thus by investing in higher quality/quantity of medical services now, they get
higher patient demand in the future (Chalkley, 2000).
A physician can be both altruistic and income orientated. It is hard to predict to which
extended a healthcare providers valuates his own benefits and/or is concentrated about
patients well-being thus provides them with care “as needed”. As a result we assume that the
degree of physician`s altruism is represented by 𝛽 ∈ 0,1 which denotes a weight that a
healthcare supplier puts on its revenue. We can rewrite the physician’s revenue function in
terms of utility, which is a function of both the physician’s net revenue and the patient’s
health:
𝑉 = 𝛽 𝑅 − 𝑣𝜏 − 𝐹 + 1 − 𝛽 ℎ 𝛿, 𝜏 (1.12)
As we can see from this equation, a physician with 𝛽 = 0 will be considered fully
altruistic, that is, a perfect physician who works only in the patient’s best interest. And
opposite, a purely selfish physician 𝑤𝑖𝑡ℎ 𝛽 = 1 is only orientated on income increase and
excessive provision of medical care. Thus we can conclude that the more physicians are
altruistic towards their patients, the less they will under-provide medical treatment.
Secondly, even though prepayment schemes encourage the under-provision of care
physicians may be cautious that medical malpractice litigation and physician monitoring may
be used in order to limit the under-provision of care. In the article by Blomqvist and Lèger
(2005) physicians are fined a given amount of money if their patient’s post-treatment health
outcome is different from his/her expected outcome (known as ”outcome-oriented” criteria).
Furthermore, each physician is subject to constant monitoring and post-treatment health is
costlessly observed.
Very close to capitation is a prospective payment system. The main difference
between prospective payments and capitation is that prospective payments are paid after the
realization of illness but prior to treatment and are based on the patient’s illness. According
to P.T Lèger (2008), physicians receive a prospective payment based on the patient’s
expected cost for his/her condition, but in return are responsible for providing care without
any further compensation. In other words, prospective reimbursement implies that payments
are agreed in advance and are not directly related to the actual costs incurred. This does not

- 22 -
mean that the payment is agreed in advance, only that the size of the payment is determined
in advance. In this case physicians being the residual claimants bear all financial risks
associated with care. Since payment is not directly related to the actual costs incurred,
incentives to reduce costs are greater, but payers may need to monitor the quality of care
provided and access to services. If the health care provider receives the same income
regardless of quality, there is a financial incentive to provide low-quality care minimum effort
and minimum cost (Morris, 2007).
Providers paid under a fully prospective system, would wish to ”dump” high-severity
patients. That is, they will turn away patients with high expected expenses. On the other
hand, they will over-provide care to low-severity patients in order to attract them (known as a
”cream-skimming” method) and provide too few services (skim) to relatively high-severity
patients.
To summary the chapter three, capitated physicians will provide fewer services to all
types of patients compared to the traditional cost-based reimbursement scheme such as FFS.
Blomqvist and Lèger (2005) allowed for different types of providers of medical care as
in their article. They predicted that physicians paid by capitation will downplay the patient’s
illness severity when patient’s illness is not serious enough to justify in-hospital specialty care
but exaggerate the patient’s illness severity if there is ambiguity as to whether or not the
patient should receive in-hospital care. These finding were consistent with empirical evidence
which suggests that physicians paid on the basis of FFS were less likely to refer patients to
other providers than physicians paid by capitation.

- 23 -
4 Mixed-Payment Systems
Resuming the analysis above, we were studying physicians behavior, i.e. incentives to
provide medical services under the payment mechanism which was either entirely based on a
Fee-For-Services (FFS) system, or a capitation or fully prospective system. We examined that
being paid under FFS, a form of retrospective payment system, physicians bared no financial
risk concerning with treatment provision and thus had incentives to over-provide medical
services in order to increase their income. On the other hand, self-centered physicians paid by
capitation faced incentives towards reduction of medical services because after receiving pre-
paid amount for expected medical expenses they were not further reimbursed when
treatment was taking place and thus were facing all extra costs associated with treatment.
In this chapter we look at a mixed-payment system which combines both prospective and
retrospective components and try to examine how being paid under this system may
encourage physicians to provide medical services.
To start with, we assume that the physician’s utility function is given by:
𝑉 = 𝛽 𝑇 + 𝑅𝜏 − 𝑣𝜏 − 𝐹 + 1 − 𝛽 ℎ 𝛿, 𝜏 (1.13)
where, as before 𝑇 stands for a capitation payment, 𝑅 - reimbursement (or FFS rate) per unit
of 𝜏 , 𝑣 – the variable cost of treatment, 𝐹 - fixed cost and 𝛽 - the physician’s altruism
parameter.
Then we will assume that the patient’s utility function diverts in to health and
consumption:
𝑈 𝐻,𝐶 = ℎ 𝛿, 𝜏 + 𝐶
and that a budget constraint is given as before in a case where insurance is absent:
𝐼 = 𝐶 + 𝑝𝜏
where 𝑝 is a price of medical services and is equal to the marginal cost.

- 24 -
In this case, a patient will consume health care until its marginal benefit equals to its
marginal cost:
𝜕ℎ
𝜕𝜏= 𝑣 = 𝑝 (1.14)
If we assume that the patients are fully insured, (i.e. = 𝐼 − 𝛼 ) and physicians are
moderately altruistic (i.e. 𝛽 ∈ 0,1 ) and can decide on patient’s behalf how much medical
care a patient should consume, then we can conclude that physicians will choose the quantity
that maximizes physician`s utility function 𝐸𝑞. (1.13) and satisfies the following condition:
𝛽 𝑅 − 𝑣 + 1 − 𝛽 𝜕ℎ
𝜕𝜏= 0 (1.15)
We can notice that the equation (1.15) will hold only when 𝜕ℎ
𝜕𝜏 is less than 0 given that
𝑅 > 𝑣. That is, physicians make the patient over consume to the point where the marginal
benefit of care is actually negative. The utility maximizing quantity equals 𝜕ℎ
𝜕𝜏= 0 when
physicians are fully altruistic (i.e. 𝛽 = 0). Either way, the physician’s utility maximizing
quantity is greater than the efficient level (Lèger, 2008).
In order for the quantity 𝐸𝑞. (1.15) that maximizes physician`s utility to coincide
with the efficient quantity 𝐸𝑞. (1.14) , the following condition must hold:
𝛽 𝑅 − 𝑣 + 1 − 𝛽 𝑣 = 0 (1.16)
which implies that 𝑅 < 𝑣. In other words, when physicians make a loss on every unit of
medical care provided, then physicians will provide the efficient level of medical services.
However, given that physicians will make negative profits under such a marginal policy,
physicians will need to receive an up-front payment to ensure their participation. Thus, when
𝑅 < 𝑣,𝑇 > 0. Also noticeable from 𝐸𝑞. (1.16) the difference between the marginal
payment and the marginal cost is increasing in physician’s altruism parameter. Therefore, in
order to stimulate the efficient provision of medical services, not self-centered physicians
must face a greater loss for each unit of medical care they provide (yet, must also receive a
larger up-front payment).
In the analysis above we considered medical services as unidimentional, which could
be obtained at a market price 𝑝. In reality, some types of care cannot be reimbursed on a per-

- 25 -
unit basis because they are just too difficult to monitor. To reflect the multidimensionality of
care, several recent reports have separated health care into medical services 𝜏 (for example,
actual treatments and procedures, diagnostic testing) and physician non-contractible effort 𝜖
(Lèger,2008).
To reflect the multidimensionality of care we augment the patient’s health production
function 𝐸𝑞. (1.2) :
H = h(𝛿, 𝜏, 𝜖)
As a result the following function presents the dependence of a patient`s health on the
degree of illness severity, units of medical treatment received and effort that physician puts
into healthcare provision as needed.
Patients appreciate physician`s effort that the last exert in services provided even
though physicians may not be compensated for it.
In the following analysis we will try to examine several models which integrate the
idea of multidimensional care.
First, we look at physicians decisions on medical care and effort.
In this model we assume that physicians choose the effort and the quantity of medical
units to provide and that the physician’s choice is assumed to be observable to the patients
prior to his/her choice of physician. As a result, 𝜏 𝑎𝑛𝑑 𝜖 directly effect the number of patients
that a physician will attract. In this case, a revenue-maximizing physician will choose 𝜏 𝑎𝑛𝑑 𝜖
to maximize 𝐸𝑞. (1.15) and the mixed-payment system 𝐸𝑞. (1.16)
In McGuire (2000), the number of patients 𝑛 that physician attracts is directly
related to the net benefit 𝑁𝐵 that they provide to their patients. Time costs,
inconveniences, and other costs and benefits of using medical care experienced by the
individual are incorporated in 𝐵 𝜏, 𝜖 (which is a function of the quantity of medical services
and effort received). Patient`s net benefit can be written as
𝑁𝐵 = 𝐵 𝜏, 𝜖 − 𝑝𝜏 (1.17)

- 26 -
Thus the net benefit received by a representative patient is assumed to be the difference
between the benefits 𝐵 of medical care received and the cost of treatment. In this equation
𝑝 stands for the price paid by the patient per-unit of medical care 𝜏 consumed
(McGuire,2000).
As a result, the physician’s net revenue 𝜋𝑡𝑜𝑡𝑎𝑙 is given by the number of patients
multiplied by the net per-patient revenue 𝜋𝑝𝑒𝑟 −𝑝𝑎𝑡𝑖𝑒𝑛𝑡 :
𝜋𝑡𝑜𝑡𝑎𝑙 = 𝑛 𝑁𝐵 ∗ 𝜋𝑝𝑒𝑟 −𝑝𝑎𝑡𝑖𝑒𝑛𝑡 (1.18)
The physician’s net per-patient revenue under a mixed-payment system which allows
for both a prospective 𝑇 and retrospective 𝑅𝜏 components is thus:
𝜋𝑝𝑒𝑟 −𝑝𝑎𝑡𝑖𝑒𝑛𝑡 = 𝑇 + 𝑅𝜏 − 𝑣𝜏 − 𝐹 (1.19)
where 𝑣 represent the per-unit variable cost of medical services. In such a setting, a fully
prospective payment, such as capitation, is given by 𝑇 > 0 𝑎𝑛𝑑 𝑅 = 0. A fully retrospective
payment, such as FFS is given by 𝑇 = 0 𝑎𝑛𝑑 𝑅 > 𝑐. A mixed-payment system will occur when
𝑇 > 0 𝑎𝑛𝑑 𝑅 < 𝑐.
In a fully prospective system, 𝑇 > 0 𝑎𝑛𝑑 𝑅 = 0 , the physician must provide enough
quantity and effort to attract patients. Although more quantity, 𝜏, increases the number of
patients they attract, they receive no marginal reimbursement for its provision. As a result,
physicians will provide too much cost-reducing effort and too little quantity and quality of
medical services.
Under a fully retrospective system 𝑇 = 0 𝑎𝑛𝑑 𝑅 > 𝑣 , the opposite will hold. That is,
physicians will not be interested in keeping the costs of treatment down and thus will under-
provide cost-reducing effort and over-provide medical services focusing on obtaining higher
revenue.
Using a mixed-system where 𝑇 > 0 𝑎𝑛𝑑 𝑅 < 𝑣 the level of effort physicians provide
can be increased when an increase in the prospective payment. Furthermore, by decreasing
the level of reimbursement, the amount of medical treatment will decrease. Thus we can
conclude, that by using these two instruments, it will be possible to achieve the targeted
levels of both observable and unobservable components of care.

- 27 -
The simplifying assumption that McGuire makes about potential patients ability to
perfectly observe each physician’s choice of quantity and effort prior to selecting their
provider is unlikely to hold in the reality.
In a seminal article, Ma and McGuire (1997) build a model in which the authors
assume that a patient chooses 𝜏 according to a physician’s choice of 𝜖 , and that the
reported quantity of medical services need not correspond to the true amount provided 10 .
In the model, a physician chooses effort to maximize his/her utility given by:
𝑉 = 1 − 𝑑 𝑇 + 𝑅𝜏𝑟𝑒𝑝𝑜𝑟𝑡𝑒𝑑 − 𝑐𝑣 − 𝛬 𝜖 − 𝐹 (1.20)
where 1 − 𝑑 denotes a patient’s illness probability, 𝑇 − the prospective payment, 𝑅 −
patient`s out of pocket payment per unit of reported treatment 𝜏𝑟𝑒𝑝𝑜𝑟𝑡𝑒𝑑 , 𝑣 − the per unit
variable cost of treatment, 𝜏𝑎𝑐𝑡𝑢𝑎𝑙 −the actual amount of treatment provided, 𝐹 − fixed
cost of treatment and 𝛬 𝜖 −the cost of providing 𝜖 units of effort. Finally, by allowing
𝑅 = 𝑣 + 𝑐, we can interpret 𝑐 to be the margin over cost which a physician receives per
unit of reported treatment.
A patient will choose treatment to maximize his/her expected utility given by:
𝐸𝑈 = 1 − 𝑑 𝑈 𝐼 − 𝛼 − 𝛾𝑝𝜏𝑟𝑒𝑝𝑜𝑟𝑡𝑒𝑑 − 𝛿 + 𝐵 𝜏𝑡𝑟𝑢𝑒 , 𝜖 + 𝑑𝑈 1 − 𝛼 (1.21)
where 𝐼 denotes as before a patient’s income, 𝛼 − the insurance premium, 𝛾 − the co-
payment rate, 𝛿 − the monetary equivalent of the health shock, 𝑝 − the price of a medical
care unit, 𝐵 𝜏𝑡𝑟𝑢𝑒 , 𝜖 denotes the benefit associated with treatment 𝜏 and effort 𝜖.
In this model, a physician announces his/her level of effort, which is followed by the
patient’s choice of treatment. Once these choices have been made, a patient and a physician
must agree on the level of treatment to report to the authorities. A physician who receives a
positive payment for each unit of treatment reported (i.e. 𝑣 + 𝑐 ≥ 0) would like to over-
report the quantity of care they actually provide (i.e. 𝜏𝑟𝑒𝑝𝑜𝑟𝑡𝑒𝑑 > 𝜏𝑡𝑟𝑢𝑒 ). However, such a
report would never be accepted by a patient, given the presence of a co-payment rate 𝛾(in
fact, a patient would like to under-report the true level of treatment). Thus, when 𝑣 + 𝑐 ≥ 0,
the true level of treatment will be reported (i.e. 𝜏𝑟𝑒𝑝𝑜𝑟𝑡 𝑒𝑑 = 𝜏𝑡𝑟𝑢𝑒 = 𝜏) and a physician’s
utility will be reduced to:

- 28 -
𝑉 = 1 − 𝑑 𝐹 + 𝑐𝜏 − 𝛬 𝜖
In order to derive the optimal payment mechanism Lèger (2008) examines two
distinct scenarios. First, a case where effort and treatment are complementary and second,
the case where they are substitutes. In the first case, where effort and treatment are
complementary and physicians make a positive return on each treatment they provide
(i.e. 𝜈 + 𝑐 ≥ 0) in order to increase their patient’s demand for treatment, a physician must
increase the level of effort they provide. Thus, by increasing the margin a social planner (or an
insurance provider) can induce a physician to provide valued, yet not remunerated effort. If
treatment and effort are substitutes, then physician would wish to decrease their level of
effort in order to induce positive consumption of treatment. To counteract this incentive,
physician cost-sharing would be necessary (i.e. 𝑐 < 0). Obviously, the level of physician cost-
sharing is limited by the truth-telling constraint (i.e. 𝑐 < 0 but must aslo satisfy 𝑐 ≥ −𝑣.
Thus we can conclude that mixed-payment systems can be used to encourage the
efficient level of “observable” types of care such as procedures, tests, while also encouraging
the efficient provision of unobservable types of care such as physician time and effort. Mixed-
payment systems appear to reduce the quantity of services provided while increasing the
quality of care provided (Lèger, 2008).

- 29 -
5 Empirical evidence on health care
system performance
5.1 Health outcomes
Being one of the main aspects of any healthcare system, financing is one of the main
concerns for people and government all over the world because, as we studied above, it
affects both providers of medical care and consumers and results in different health
outcomes not only across countries but within one country as well.
In the theoretical part of the thesis we were studying different payment mechanisms
and the effect they have on the health care provision and consequently on health care
outcomes. We also showed the necessity of the third-party payers in the health care market
due to people`s anxiety about future health expenditures. The third-party payers are the
people`s guardians against financial risk associated with obtaining health care when needed.
In the introduction the concept of health care system performance was defined with
respect to a set of fundamental goals for health systems:
Improving health status of population and reducing health inequalities.
Responsiveness includes respect for persons and client orientation.
Fairness of financial contribution means that every household pays a fair share of the
total health bill for a country (which may mean that very poor households pay nothing
at all). This implies that everyone is protected from financial risks due to health care.
However, estimating the efficiency or performance of each country`s health care
system is not straightforward. The most straightforward way to compare the impact of health
care across countries would be to examine health care outcomes. Health outcomes data are
not yet available at an international level. Meanwhile, the indicators of health status can be
used (life expectancy, mortality rate etc.) (Or et al, 2005).
It is assumed that the more the government invests into the health care system the
better health outcomes will be. Nevertheless, reality does not always prove such a conclusion.

- 30 -
Even though US has highest portion of its GDP spent on health sector 15.3 percent (WHO,
2009) it does not result in the best health outcomes having life expectancy at 78.11, infant
mortality rate at 6.26 (CIA World Factbook,2009) while its neighbor Canada spending 10.0
percent of its GDP on health (WHO, 2009) has the same indicators at 81.23 and 5.04
respectively (CIA World Factbook,2009), Norway dedicates 8.7 percent of its GDP to health
(WHO, 2009) and has mentioned indicators at 79.95 and 3.58 respectively (CIA World
Factbook,2009). Spending 8.1 percent of GDP on healthcare (WHO, 2009) Japan achieved
levels of life expectancy at 82.12 and infant mortality at 2.79 (CIA World Factbook,2009). The
reason for focusing on the percentage of GDP spent on health care is what economists call
opportunity costs: the larger the proportion of GDP spent on health care services, the smaller
the proportion that is available for other goods and services.
Variation in health outcomes across countries may not result only from different levels
of health sector recourses but also from differences in how efficiently these resources are
used. For example, health production may not be influenced only by the amount of doctors
but also by the technical support they are given, the way that doctors are motivated
financially, or the way that patient access to them is controlled (by out-of-pockets payments,
for instance). High health spending can mean that resources dedicated to health care are
inefficiently used, i.e. high administrative costs, rising costs of new medical technologies and
so on. Exogenous factors affecting health system performance are different between
countries. Thus, we cannot limit us to analyzing how much of GDP is involved into healthcare
sector but also include into consideration some other factors that are likely to affect health
outcomes.

- 31 -
5.2 Determinants affecting health status across
countries
Effect of health costs on health outcomes is affected by a number of both medical and
non-medical factors in a complex way:
- access to health care for groups differing in income, in geographical nearness to
physician services etc. and environmental factors such as
- access to water, air pollution etc.
- distribution of health care in a country, as a factor that might be as important for health
outcomes as the overall level of expenditure on, or consumption of health services (Or et al,
2005).
Collecting and combing information about health status of the population, access to
care, equity and quality of service provision, and financial protection is not simple. That is why
Or et al (2005) adopt in their paper a partial approach concentrating on one aspect of health
(mortality reduction) and one specific health resource (number of doctors).
Assessing health system performance requires distinguishing the effect of health care
from the effect of other determinants.
Income contributes to improve health status because people can afford better
nutrition, sanitation and housing and safer physical and work environment. That is why low-
income individuals are considered as a high-risk group because they acquire bad health with a
higher probability than high-income population. Without public financing of health care, low
income groups may be left without medical care due to their budget constraint and prices for
achieving treatment and insurance security.
Education is a strong determinant of health in developed and developing countries.
Indeed, the studies reviewed by Grossman and Kaestner (1997) suggest that years of formal

- 32 -
schooling completed have strong correlation with good health (measured by mortality rates,
morbidity rates, self-evaluation of health status, or physiological indicators of health).More
educated persons are more efficient producers of health. This means that they can obtain a
larger health output from given amount of endogenous (choice) inputs. This is known as a
productive efficiency from schooling. Allocative efficiency means that schooling increases
information about the true effects of the inputs in health. That is, educated person has more
knowledge about the harmful effects smoking or about constitutes of appropriate diet.
Allocative efficiency will improve health to the extent that leads to the selection of a better
input mix. (Culyer and Newhouse, 2003).
Education allows for more informed and better choices to be made about the
importance of good health and the appropriate measures to achieve it. Education brings you
to awareness about the importance of personal input in the form of “life style” in achieving
better health. There is, indeed, a strong relationship between health and life styles. By “life
style” I mean all the factors over which individuals have some control, such as alcohol,
tobacco and drugs consumption, physical exercise, personal hygiene, healthy diet etc.
Education brings to knowledge about different disease and how to prevent them thus
reducing the probability of illness occurrence and leading to better health outcomes as well as
reducing health care costs.
Moreover, education helps to reduce the information gap between health providers
and consumers (prevailing due to information asymmetry), what is very important in order to
reduce the possibility of being a target for supplier-induced demand.
Doctors are a key input for the production of health care. Health care systems vary
widely in their performance all over the world. One of the determinants of health care system
performance is how health systems use health care resources to improve health. The
variation in health status can be explained by country-specific variation in efficiency with
respect to a specific health input. Health expenditure series can be used as a measure of total
resources spent on health care.
Or et al (2000) were trying to estimate the determinants of health outcomes across
countries and over time. In particular, they were taking into consideration the effect of such

- 33 -
variable as total health expenditure per capita for medical consumption, share of public
expenditure in total health expenditure, GDP per capita, share of white-collar workers in total
work force, pollution per capita (𝑁𝑂𝑥 emissions), consumption of alcoholic beverages, liters
per head of population, consumption expenditure on tobacco per head of population, butter
consumption per head (kg), sugar consumption per head (kg) on the PYLLs, which were
calculated from unpublished mortality statistics provided by WHO and cover deaths from all
causes except suicides. They were looking at the data set consisting of a pooled sample of 21
OECD countries for the period 1970-1992. In total of 483 observations.
They found that in terms of the actual reduction in premature mortality, there is a
considerable variation across countries. In most countries, the rise in the employment share
of white-collar workers plays the greatest role in reduction of premature mortality. The
improvement in health due to the rise in “work status” is more than double the contribution
from the rise in per capita income. The second most important factor behind improvements
in health outcomes appeared to be the rise in per capita income. It is reasonable to think that
economic development would improve housing conditions, road quality, public hygiene,
which has a direct impact on health. There appeared to be a significant positive relation
between the health expenditure and health, particularly for women. That the way health
expenditure is financed also appears to affect health outcomes. Lower rates of premature
mortality for both sexes were associated with a larger share of public financing of health care.
Environmental factor included in their regression (air pollution) had a positive and significant
relation with premature mortality as well as both alcohol and tobacco consumption, sugar
and butter consumption. The result of their study strongly suggest that environmental factors
are more important than medical inputs in explaining variations in premature mortality in
industrialized countries. Among these, occupational status appeared to play the most
important role (Or, 2000).
Usage of expenditure series is limited given the absence of reliable price indices to
obtain equivalent measures of health expenditures across countries.
Doctor numbers are the second best choice and are a reliable measure of health care
resources in a country. One of the Or (2001) earlier findings were that physician numbers are
an important determinant of mortality across OECD countries. Or et at (2005) in their paper

- 34 -
aim to examine if the cross-country variation in health status can be attributed to variation in
efficiency of health care as provided by medical doctors. In particular, the effect of the
number of physicians on the mortality rate because preventing premature death is an
important aspect of health. Their research was based on cross-country analysis of 21 OECD
countries over 3 decades and assumption that the impact of doctors on health status is linear.
The finding of their study in 2005 suggests that there is a margin for improvement in
physician "efficiency" in certain countries. One of the results of their study is that the
availability of advanced medical technology appears to play a significant role in improving the
efficiency of health care provided by doctors (to reduce mortality) across countries.
Grubaugh and Santerre (1994) also find that there is a positive impact on health of the
number of doctors and hospital beds inputs.
The good example confirming this statement is Cuba`s achievement in this area. Cuba
has one of the highest life expectancy rates in the region, with the average citizen living in
2006 to 78 years. Cuba's infant mortality rate is just seven in a thousand - better than in many
American cities. Only 7.1 per 1000 children died before the age of five. Cuba has the best
doctor to patient ratio in the world, while about 10% of annual state spending goes on health.
Cuba now has one doctor per 200 citizens, compared to one per 400 in the US (Bulletin of the
World Health Organization, 2009). Cuba has achieved these results despite significant
economic difficulties - GDP per capita is 2006 was only $362. While in the US per capita
spending of health equals $6719 (World Health Statistics, 2009).

- 35 -
5.3 Empirical evidence on payment mechanisms
It is difficult to investigate the relation between payment mechanisms and aggregate
health outcomes.
In the second level of analysis Or et at (2005) question of interest was the relationship
between major system characteristics and the "efficiency". In particular, what is the effect (if
any) of different payment systems for doctors and hospitals, and the public-private mix of
funding in the country. They were using following dummy variables: fee-for-services as
dominant means of payment in primary care, fee-for-services as dominant means of payment
in hospital care, capitation as dominant means of payment in primary care, wage/salary as
dominant means of payment in primary care and a dummy variable of physicians acting as
gatekeepers.
The result from their analysis suggests that the public/private mix does not play a
significant role in improving medical-care efficiency, although it has a direct effect on female
life expectancy.
They also found that there is a positive relationship between fee-for-services impact of
physician efficiency on reducing mortality. The reliability of their results is a subject to the
quality of underlying data and few numbers of observations (21 countries). Medical
technology has an impact on improving the efficiency of health care provided by doctors (to
reduce mortality) across countries. But because of the measurement problems which
frequently arise when using aggregate cross-country data it remains unclear whether both
variables are associated with better performance or just fee-for-services is driving the uptake
of technology.

- 36 -
5.4 Disparity in access to health care
Describing the general model of health care provision and consumption we learned
that individuals are budget constrained and can face significant financial risks concerning
healthcare consumption due to uncertainty prevailing on the health care market about timing
of illness occurrence and magnitude of health expenditure. Risk-averse individuals would like
to purchase health insurance to reduce future catastrophic expenditure. According to this
conclusion it will be rational to look at the data that reflects how people are protected from
catastrophic health expenditure due to access to insurance. One of the indicators we can look
at is the proportion of uninsured individuals. According to the U.S. Census Bureau (2009),
nearly 47 million Americans (46.34 million) or 15.4 percent of the population under the age of
65 were without health insurance in 2008. Even though government of USA dedicates a lot to
health care systems there are many unprotected individuals in the country. Norway, Sweden,
Denmark, Finland, Australia, Czech Republic, Korea, Luxembourg, Poland, Portugal,
Switzerland, United Kingdom and Canada, for instance, have 100.0 percent of population with
government-insured health insurance. Only 33 percent of the US population (43.0 million) had
health insurance coverage assured by the government at that time (OECH Health data 98).
We can see from figure 1 above that even in year 2000 the US was still the last one with
public expenditure on health representing only 44 percent of total health care expenditure
while being the country with the highest per capita health expenditure at $4570. Nowadays
the US is still on the top spending $6719 per capita (in 2006) and having only 45.8 percent of
government expenditure on health. (World Health Statistics, 2009).
We showed in theoretical the part that having insurance alters consumer`s behavior
towards consumption of excessive amount of medical treatment because they no longer face
the actual cost of treatment (figure 1.2). In order to reduce over-consumption insurance
companies developed illness-contingent policies. Moreover, insurers may have such a policy
when in order to get health reimbursement when bad event happens insured has to pay a
certain part of cost themselves (co-payments) (egenandel) thus reducing incentives to over
consume just like theory we studied predicts (figure 1.3). Even though insurance companies
are very important third-party payers on the health market due to their role of protecting
- 37 -
people from future health expenses, promoting the delivery of high-quality care and reducing
excessive consumption of medical treatment not everyone can afford purchase of insurance,
beside insurance not always provides full coverage from medical expenses. As a result, there
exist differences in access to care.
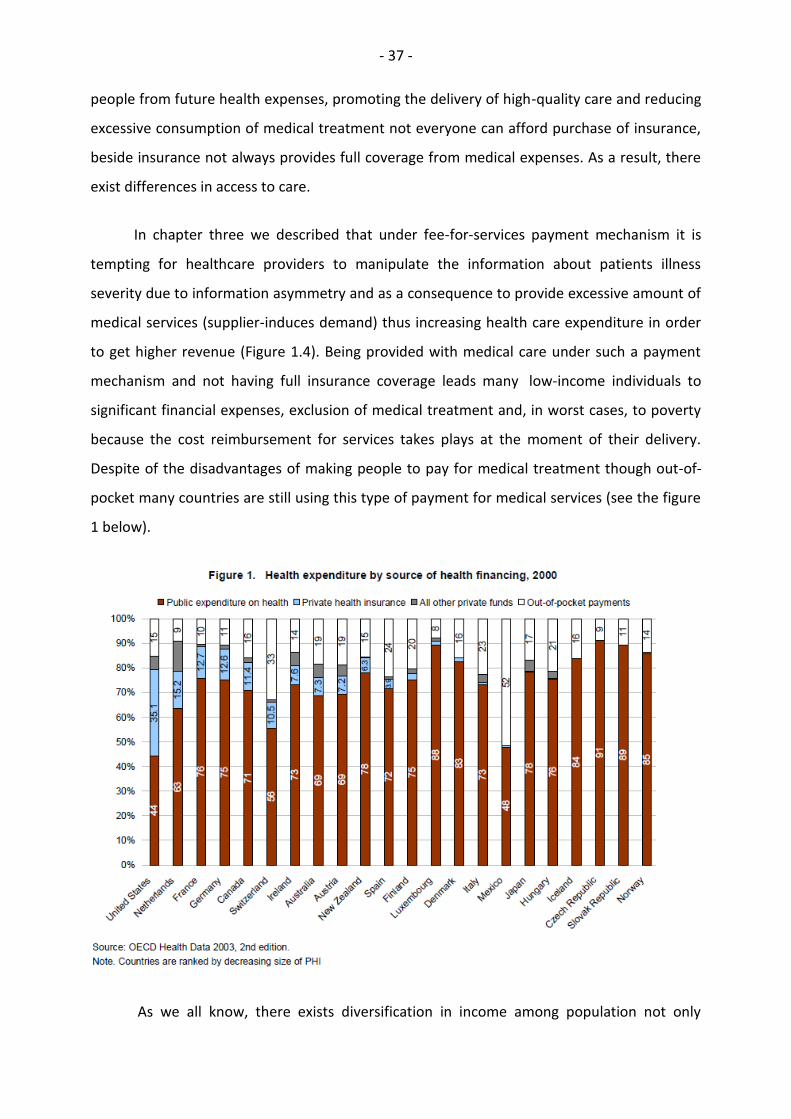
In chapter three we described that under fee-for-services payment mechanism it is
tempting for healthcare providers to manipulate the information about patients illness
severity due to information asymmetry and as a consequence to provide excessive amount of
medical services (supplier-induces demand) thus increasing health care expenditure in order
to get higher revenue (Figure 1.4). Being provided with medical care under such a payment
mechanism and not having full insurance coverage leads many low-income individuals to
significant financial expenses, exclusion of medical treatment and, in worst cases, to poverty
because the cost reimbursement for services takes plays at the moment of their delivery.
Despite of the disadvantages of making people to pay for medical treatment though out-of-
pocket many countries are still using this type of payment for medical services (see the figure
1 below).
As we all know, there exists diversification in income among population not only

- 38 -
worldwide but among population of the same country as well and thus many low-income
individuals being budget constrained cannot afford having such a luxury as insurance because
having insurance obligates them to pay insurance premium in advance before illness
occurrence and on this base leads to exclusion of many low-income and high-risk individuals
from access to health care.
Consequently, low-income population cannot in many cases get basic health
treatment needed because otherwise they will be pushed into deeper poverty or bankruptcy.
Thus, the problem associated with having incomplete insurance we just described
(exclusion of medical treatment for some groups of population) in line with out-of-pocket
payments leads to catastrophic health expenditures faced by many households across the
world. Catastrophic health expenditure does not to coincide with high health care cost. Even a
relatively small payment can mean financial catastrophe to a poor person, forcing him/her to
reduce other basic expenses such as food, shelter, education and so on. Even having
insurance but being not fully covered by it.
Figure 2. Catastrophic expenditure related to out-of-pocket payment at the point of service
Source: The World Health Report 2008

- 39 -
The figure shows that there is a positive correlation between the proportion of
households with catastrophic health expenditures and the share of out-of-pocket payments in
total health expenditure. As the volume of total health expenditure met by out-of-pocket
payment increases, the range of catastrophic payments also increases.
Xe et al (2003) explored variables associated with catastrophic health expenditure in
59 countries. The defined expenditure as being catastrophic if a household`s financial
contributions to the health system exceed 40% of income remaining after subsistence needs
have been met.
In their analysis health expenditures requiring out-of-pocket payments included all
types of health-related expenses incurred at the time the household received the service,
including consultation fees, purchase of medications, and hospital bills. They deducted any
reimbursement from health insurance schemes.
Their findings were: the proportion of households facing catastrophic payments from
out-of-pocket health expenses varied widely between countries; that catastrophic payments
are, unfortunately, common in middle-income countries, countries in transition, and in
several low-income countries. They also identified three key preconditions for catastrophic
payments were identified: the availability of health services requiring payment, low capacity
to pay, and the lack of prepayment or health insurance.

- 40 -
5.5 Health care system performance
A health care system consists of the organizational arrangement and processes though
which a society makes choices concerning the production, consumption and distribution of
health care services. (Santerre, 2007).
We are talking a lot about numbers and how they reflect the health care systems
performance. But one of the most important points of consideration is how individuals
evaluate the existing in their country healthcare system, how well it satisfies people`s
expectations about meeting their health care needs. Because those who live in that country
might have a different insight on the concept of a “good” performance than the WHO experts
have according statistics and parameters.
Blendon et al (2001) were looking at seventeen industrialized countries for which data
were available in order to find the level of people`s satisfaction with the existing health
system in their country. They compared rankings of citizens` satisfaction with their own
health care systems to the rankings awarded by the WHO expert panels (according to an
overall measure based on weights (25 percent level of health, 25 percent distribution of
health, 12.5 percent level of responsiveness, 12.5 percent distribution of responsiveness, and
25 percent fairness of financial contribution).
They were focusing on a single question of how people in general satisfied or
dissatisfied with the care system that runs in their country.
Indeed, the practice showed a striking difference between peoples view on the
prevailing health care system in their country and ranking by WHO. Among the seventeen
countries in this comparison, Italy is ranked second by WHO. But only 20 percent of its
citizens say they are satisfied with their health care system. Denmark is ranked sixteenth in
the WHO overall performance measure, yet 91 percent of Danish citizens say they are
satisfied with their health system.
According to Blendon et al (2001), that there is a gap in what is seen as important by

- 41 -
one group versus the other. The general public has a basis for informed opinion, particularly
in areas relating to barriers to care, financial difficulties, unresponsiveness of a health system,
shortages of services, lack of respect for patients by professionals and administrators,
inefficiencies, and corruption within the health care system. Citizens in each country are in a
better position to assess these issues in their own countries than experts are.
We mentioned in the first chapter that fairness in financing in one three important
goals of any health care system. Fairness in financing means that everyone is protected from
financial risk due to the cost of health care paying for medical treatment received according
to their means. This may imply that poor individuals do not pay anything at all. This is why
fairness in financing has very important consequences for much of the population, especially
for those who are uninsured or underinsured, and for the poor, who can be driven even
deeper into to the poverty due to the lack of financial protection against ill-health. We
mentioned above that there is a high portion of uninsured population in the US (15.4
percent), still a wide usage of out-of-pockets payments. Not surprisingly the US was the
lowest (least fair) of all the OECD countries according to WHO`s international comparison in
1997 tied for place (having the number of uninsured population at 42.6 million, what is not
significantly different from the latest data available at 46.34 million in year 2008), while
Denmark was on place, Norway place, Sweden place.
Summarizing the information above we can conclude that health systems vary widely
in performance, and countries with similar levels of income, education and health
expenditure differ in their ability to attain key health goals, which are good health,
responsiveness and fare in financing, what lead to health inequalities not only in across-
countries dimension but within population of a country as well leaving many in need out of
care.

- 42 -
6 References:
Arrow, K. (1963): Uncertainty and the Welfare Economics of Medical Care. American
Economic Review 53, 941-969.
Blendon, R. and M. Kim, J.M. Benson (2001): The Public Versus The World Health
Organization Health System Performance, Health Affairs, vol.20, No.3.
Blomquist, A. and P.Th. L´eger (2005): Information asymmetry, insurance, and the decision
to hospitalize, Journal of Health Economics 24, 775–793.
Burea of Labor Education (2001): The U.S. Health care System: Best in the World, or Just
the Most Expensive?, The University of Maine.
Carrin, G., C. James and DB Evans (2005): Achieving universal health coverage: developing
the health financing system, World Health Organization, Department of Health Systems
Financing, Geneva, Technical Briefs for Policy Makers No. 1.
Chalkley, M. and J.M. Malcomson (2000): Government Purchasing of Health Services,
Handbook of Health Economics, Volume 1.
Culyer, A.J. and J.P. Newhouse (2003): Handbook of Health Economics, Vol. 1A, Elsevier,
North Holland, 395-405.
Ellis, R. and Th. G. McGuire (1993): Supply-Side and Demand-Side Cost Sharing in Health
Care, Journal of Economic Perspectives- Volume 7, Number 4, 135-151.
Evans, R.G. (1974): Supplier-induced demand: some empirical evidence and implications.
The Economics of Health and Medical Care, Perlman, MacMillan, London, 162-173.
Gosden, T., F. Forland F, and I.S. Kristiansen, M. Sutton, B. Leese, A. Giuffrida, M. Sergison,
L. Pedersen (2006): Capitation, salary, fee-for-service and mixed systems of payment:
effects on the behavior of primary care physicians, Cochrane Database of Systematic
Reviews , The Cochrane Library, Issue 3.

- 43 -
Grossman, M. and R. Kaestner (1997): Effects of education on health, in J.R. Behrman and
N.Stacey, eds., The social Benefits Of Education, 69-123.
Grubaugh, S.G. and R.E. Santerre (1994): Comparing the performance of health care
systems: an alternative approach, Southern Economic Journal 60 (4), 1030-1042.
Iatridis, DS. (1990): Cuba's health care policy: prevention and active community
participation (1990), Graduate School of Social Work, Boston College, Chestnut Hill, Soc
Work, 35(1), 29-35.
Lèger, P.Th. (2000): Quality Control Mechanisms under Capitation Payment for Medical
Services, The Canadian Journal of Economics, Vol. 33, No. 2, 564-586.
Lèger, P.Th. (2008): Physician Payment Mechanisms, in M. Lu and E.Jonsson (eds.)
Financing Health Care: New Ideas for a Changing Society, 149-176.
Ma, C.T.A and Th.G. McGuire (1997): Optimal Health Insurance and Provider Payment, The
American Economic Review, Vol. 87, No. 4, 685-704.
McGuire, Th. (2000): Physician Agency, in A.J.Culyer and J.P.Newhouse (eds.), Handbook
of Health Econimics, Volume 1, 2000.
Mechanic, D. and D. A. Rochefort (1996): Comparative Medical Systems. Annual Review of
Sociology, Vol. 22, 239-270.
Morris, S. and N. Devlin, D. Parkin (2007), Economic Analysis in Health Care.
Or, Z. (2000): Determinants of Health Outcomes in Industrialized Countries: A Pooled
Cross-Country, Time Series Analysis, OECD Economic Studies, No 30, 53-77.
Or, Z. (2001): Exploring the Effect of Health Care on Mortality Across OECD Countries,
Labour Market and Social Policy Occasional Papers, No 46, OECD, Paris.
Or, Z., J. Wang, and D. Jamison (2005): International differences in the impact in health: a
multilevel analysis of OECD countries, Journal of Health Economics 24, 531-560.
Santerre, R.E. and S. P. Neun (2007): Health Economics: theories, insights, and industry
studies, fourth edition, 74-92.

- 44 -
Selden, T.M. (1990): A Model of Capitation, Journal of Health Economics 9, 397-409.
North-Holland.
Stano, M. (1989): A further analysis of the physician inducement controversy. Journal of
Health Economics 6, pp. 229-238.
The Central Intelligence Agency: CIA World Factbook.
http://en.wikipedia.org/wiki/List_of_countries_by_infant_mortality_rate_(2005),
http://en.wikipedia.org/wiki/List_of_countries_by_life_expectancy,
downloaded 09/11-2009
The World Health Organization, http://www.who.int, doanloaded 28/10-2009
The World Health Report 2008: Primary Health Care Now More Than Ever.
http://www.searo.who.int/LinkFiles/Reports_whr08_en.pdf, downloaded 8/11-2009
US Census Bureau (2009): Income, Poverty, and Health Insurance Coverage in the United
States:2008, U.S. Department of Commerce, Economics and Statistics Administration
Van de Val, W.P.M.M. Ellis, P. Randall (2000): Risk adjustment in Competitive Health Plan
Market, in A. J. Culyer and J. P. Newhouse (eds.), The Handbook of Health Economics, Vol.
34, Amsterdam.
Xu, K., D. B. Evans, and K. Kawabata, R. Zeramdini, J. Klavus, Ch. J L Murra (2003):
Household Catastrophic Health Expenditure: a Multicountry Analysis, The Lancet, vol. 362
Xu, K., D.B. Evans, G. Carrin, A.M. Aguilar-Rivera, Ph. Musgrove and T. Evans (2007):
Protecting households from catastrophic health spending, Health Affairs, vol. 26, No 4,
972-983.
World Health Organization (2009): Bulletin of the World Health Organization,
http://www.scielosp.org/scielo.php?script=sci_arttext&pid=S0042-
96862008000500006&lng=en&nrm=iso, downloaded 5/11-2009
World Health Statistics 2009, The World Health Organization,
http://www.who.int/whosis/whostat/EN_WHS09_Full.pdf, downloaded 8/11-09