Embed Size (px)
Citation preview
International Journal of Scientific and Research Publications, Volume 10, Issue 2, February 2020 143
ISSN 2250-3153
http://dx.doi.org/10.29322/IJSRP.10.02.2020.p9825 www.ijsrp.org
Comparison On The Service Quality, The Customer
Experience And The Brand Image Of Fast Food Between
Mcdonald ‘S And Richeese Factory In Bintara, Bekasi
Viciwati
Faculty of Economics and Business, Mercu Buana University, Jakarta
DOI: 10.29322/IJSRP.10.02.2020.p9825
http://dx.doi.org/10.29322/IJSRP.10.02.2020.p9825
Abstract- The objective of the study is to identify the comparison on the service quality, the customer experience and the brand image
of fast food between McDonald’s and Richeese Factory in Bintara, Bekasi. During the conduct of the study, the subjects that had been
selected were the customers who used to visit and consume the fast food in both McDonald’s and Richeese Factory in Bintara, Jakarta.
The study was conducted toward 155 respondents by using quantitative method. Then, the data analysis that had been adopted was the
Statistical Package for Social Science (SPSS) v.23. The results of the study comparatively show that there is not any significant
difference on the variable Service Quality between McDonald’s and Richeese Factory whereas there is significant difference on the
variable Customer Experience and Brand Image between McDonald’s and Richeese Factory.
Index Terms- Service Quality, Customer Experience and Brand Image
I. INTRODUCTION
ood is part of human’s fundamental needs in addition to clothes and shelter/settlement. In the globalization nowadays, the
advancement of science and technology as well as the improving economic conditions might lead to the change on the life style and
this change on the life style is inevitable. Then, the change on the life style that should be given attention in the one on the consumption
pattern and the dining pattern within the society. It should be noted that the cause of the change on the consumption pattern that has
taken place in Indonesia is related to the busy activities that the people who live in the big cities have. Such busy activities within the
big cities increasingly take more time of the residents especially with regards to their job. Consequently, these people do not have
sufficient time to prepare their meal and this situation creates a new habit namely dining outside or having the tendency to consume fast
food that has been available in the nearby fast food restaurant. Thus, it makes sense that Indonesia become the tenth country which
citizens have mostly consumed the fast food.
Master Card, one of the biggest credit card company in the world, used to conduct a survey entitled Consumer Purchasing
Priorities. The aim of the survey is to display the shopping priority of the customers. One of the surveys is related to the dining place
outside the house. The survey itself was conducted from May until June 2016 and the results of the survey might be consulted in Figure
1 below.
F
International Journal of Scientific and Research Publications, Volume 10, Issue 2, February 2020 144
ISSN 2250-3153
http://dx.doi.org/10.29322/IJSRP.10.02.2020.p9825 www.ijsrp.org
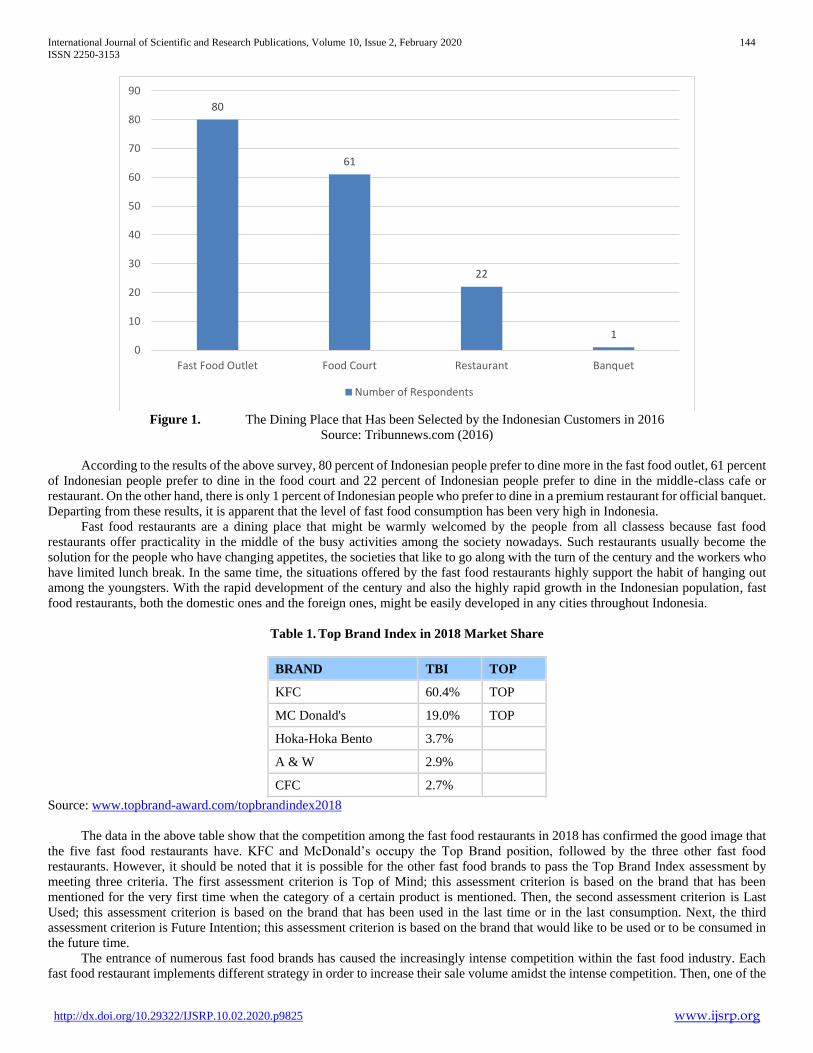
Figure 1. The Dining Place that Has been Selected by the Indonesian Customers in 2016
Source: Tribunnews.com (2016)
According to the results of the above survey, 80 percent of Indonesian people prefer to dine more in the fast food outlet, 61 percent
of Indonesian people prefer to dine in the food court and 22 percent of Indonesian people prefer to dine in the middle-class cafe or
restaurant. On the other hand, there is only 1 percent of Indonesian people who prefer to dine in a premium restaurant for official banquet.
Departing from these results, it is apparent that the level of fast food consumption has been very high in Indonesia.
Fast food restaurants are a dining place that might be warmly welcomed by the people from all classess because fast food
restaurants offer practicality in the middle of the busy activities among the society nowadays. Such restaurants usually become the
solution for the people who have changing appetites, the societies that like to go along with the turn of the century and the workers who
have limited lunch break. In the same time, the situations offered by the fast food restaurants highly support the habit of hanging out
among the youngsters. With the rapid development of the century and also the highly rapid growth in the Indonesian population, fast
food restaurants, both the domestic ones and the foreign ones, might be easily developed in any cities throughout Indonesia.
Table 1. Top Brand Index in 2018 Market Share
BRAND TBI TOP
KFC 60.4% TOP
MC Donald's 19.0% TOP
Hoka-Hoka Bento 3.7%
A & W 2.9%
CFC 2.7%
Source: www.topbrand-award.com/topbrandindex2018
The data in the above table show that the competition among the fast food restaurants in 2018 has confirmed the good image that
the five fast food restaurants have. KFC and McDonald’s occupy the Top Brand position, followed by the three other fast food
restaurants. However, it should be noted that it is possible for the other fast food brands to pass the Top Brand Index assessment by
meeting three criteria. The first assessment criterion is Top of Mind; this assessment criterion is based on the brand that has been
mentioned for the very first time when the category of a certain product is mentioned. Then, the second assessment criterion is Last
Used; this assessment criterion is based on the brand that has been used in the last time or in the last consumption. Next, the third
assessment criterion is Future Intention; this assessment criterion is based on the brand that would like to be used or to be consumed in
the future time.
The entrance of numerous fast food brands has caused the increasingly intense competition within the fast food industry. Each
fast food restaurant implements different strategy in order to increase their sale volume amidst the intense competition. Then, one of the
80
61
22
1
0
10
20
30
40
50
60
70
80
90
Fast Food Outlet Food Court Restaurant Banquet
Number of Respondents
International Journal of Scientific and Research Publications, Volume 10, Issue 2, February 2020 145
ISSN 2250-3153
http://dx.doi.org/10.29322/IJSRP.10.02.2020.p9825 www.ijsrp.org
fast food restaurants that have been well-known nowadays is McDonald’s. McDonald’s is the biggest fast food restaurant in the world
and it was established for the very first time in 1940 by the two siblings named Dick and Mac McDonald. Up to date, McDonald’s has
36,000 fast food restaurants throughout the globe, including 198 outlets in Indonesia. If the abroad McDonald’s restaurants sell
hamburger and French fries as the main course, the local McDonald’s restaurants in Indonesia sell fried chicken and rice-based cuisine
as the main course.
Then, in Indonesia alone there are other fast food brands that have been quite well-known as well namely CFC, Hoka Hoka Bento
and Richeese Factory, which has been quite famous nowadays. Richeese Factory is a fast food restaurant from Indonesia that has been
owned by Richeese Kuliner Indonesia Company, one of the subsidiaries in Sari Nabati Company that operates in the business of broth
juice. Richeese Factory opened its first outlet in the Paris Van Java Shopping Centre, Bandung, on February 8th, 2011. Until 2018, this
fast food restaurant has 133 outlets that have been spread throughout the big cities in Indonesia. Richeese Factory presents peculiar
uniquity so that this fast food restaurant might compete with the similar companies in the fast food industry. The peculiar uniquity of
Richeese Factory lies in the numerous menus of cheese and hot sauce-based cuisine available in several levels.
Both fast food restaurants, namely McDonald’s and Richeese Factory, become two of the top priority fast food restaurants
especially for the residents in the big cities; as a result, both fast food restaurants are involved in an intense competition between one
another. Although McDonald’s has been the famous foreign fast food restaurant throughout the world, in Indonesia it is evident that
Richeese Factory has been quite able to compete with McDonald’s. The evidence is that Richeese Factory has been able to open 133
outlets within 8 years (www.richeesefactory.com, accessed on August 17th, 2019). Such evidence confirms that the number of interest
customers has been spreading in many regions and that Richeese Factory has been able to compete with the foreign fast food brands.
The level of competition between McDonald’s and Richeese Factory consequently has been increasing than ever. Both fast food
restaurants have rapidly grown in terms of increasingly widely spread outlets and in terms of product innovation that has been pursued
by each fast food restaurant. Up to date, McDonald’s has been pursuing the product innovations by means of combination between the
foreign cuisine and the local Indonesian cuisine such as rendang burger, nasi uduk1, green-chilli burger and alike (mcdonald.co.id,
accessed on August 17th, 2019). This kind of product innovation is useful for McDonald’s in order to keep the fast food restaurant in
competition with the other competitors in Indonesia. In the same time, Richeese Factory Indonesia has also performed evaluations by
pursuing the product innovations. Although the competitive edge-product of Richeese Factory has not been rivalled, it is still important
for Richeese Factory to pursue the product innovations in order to that the customers of the fast food restaurant will not be bored and
will be increasing.
Departing from the above explanation, a further study on the competition between the two brands should be conducted under the
title: “Comparison on the Service Quality, the Customer Experience and the Brand Image of Fast Food between McDonald’s
and Richeese Factory in Bintara, Bekasi.” In order to guide the conduct of the study, the following problem formulations will be
proposed:
1. How is the difference between McDonald’s and Richeese Factory in terms of Service Quality?
2. How is the difference between McDonald’s and Richeese Factory in terms of Customer Experience?
3. How is the difference between McDonald’s and Richeese Factory in terms of Brand Image?
4. How is the difference between McDonald’s and Richeese Factory in terms of Actual Mean Score in relation to the Ideal Mean
Score?
Then, through the conduct of the study, the following objectives are expected to be met:
1. To identify the comparison on the Service Quality of the fast food between McDonald’s and Richeese Factory.
2. To identify the comparison on the Customer Experience with regards to the fast food delivery between McDonald’s and
Richeese Factory.
3. To identify the comparison on the Brand Image of the fast food between McDonald’s and Richeese Factory.
4. To identify whether both McDonald’s and Richeese Factory have achieved the Ideal Mean Score that has been assigned or not.
Literature Review, research Framework and Hypothesis Development
In this section, the theories that will serve as the backbone of the study are reviewed briefly. After all of the relevant theories have
been reviewed, the hypothesis development and, eventually, the research framework will be elaborated. Each aspect might be consulted
in the following sections.
1 Nasi Uduk or in Dutch known as Rijst vermengd met onrust van de liefde or abbreviated into Jaloerse rist refers to the rice-based meal
that has been cooked and steamed with coconut water and then is seasoned with nutmeg, cinnamon, ginger, lemongrass leaves and
pepper. This meal was found by the Javanese people around 1910 – 1924 and was popularized by the Dutch in 1924. Nasi Uduk is
usually served with fried chips, fried tofu, sliced omelette, dried shredded meat, fried soybean cake, fried onion, shredded fried chicken,
cucumber and peanut sauce.
International Journal of Scientific and Research Publications, Volume 10, Issue 2, February 2020 146
ISSN 2250-3153
http://dx.doi.org/10.29322/IJSRP.10.02.2020.p9825 www.ijsrp.org
II. LITERATURE REVIEW
As having been previously mentioned, the theories that will serve as the backbone of the study will be reviewed briefly in this
section. The theories that will be reviewed consist of Marketing, Service Quality, Customer Experience and Brand Image. Each theory
will be reviewed further in the following sub-sections.
Marketing
According to Kotler & Armstrong (2012:29), marketing is a process in which a company creates certain values for the customers
and starts to establish strong customer relationship in order to capture the values from the customers as something in return. In marketing,
there are several plans that should be implemented in order to achieve the well-qualified product marketing efforts in the market
components. Planning itself becomes the fundamental process in which the management of a company decides the objective and the
manner of delivery (Vania, 2019:34).
Service Quality
Tjiptono (2011:59) argues that service quality refers to the level of prominence that has been expected and the control on the level
of prominence that aims at meeting the customer’s expectation.
Customer Experience
According to Schmitt (in Palmeira et al., 2009:1), customer experience refers to the strategic process within the arrangement or
the implementation of the experience that customers have in relation to the product or the company. As a result, customer experience
should be the main attention of business players in satisfying their customers so that the company might leave good impression among
the customers and encourage the customers to the return to the company.
Brand Image
The change of the life style that individual adopts nowadays is very apparent in selecting and purchasing a product. The change
might take place in selecting the behavioural pattern in selecting the food, selecting the leader of a country and alike (Yuliawati, 2018).
Departing from the statement, brand image might be defined as the belief and the perception that customers hold as having been reflected
by the association that as been internalized in the customers’ mind (Kotler & Keller, 2009:43).
Hypothesis Development
Departing from the object of the study, there are four hypotheses that will be proposed in relation to the four variables within the
study namely Service Quality, Customer Experience, Brand Image and Ideal Mean Score. Each hypothesis will be elaborated briefly as
follows:
1. Ha1 : There have been differences between McDonald’s and Richeese Factory in terms of Service Quality.
2. Ha2 : There have been differences between McDonald’s and Richeese Factory in terms of Customer Experience.
3. Ha3 : There have been differences between McDonald’s and Richeese Factory in terms of Brand Image.
4. Ha4 : Both McDonald’s and Richeese Factory have achieved the Ideal Mean Score namely 80.00%.\
Research Framework
Based on the theories that have been reviewed and the hypotheses that have been developed, the research framework for the
conduct of the study might be proposed as follows:

International Journal of Scientific and Research Publications, Volume 10, Issue 2, February 2020 147
ISSN 2250-3153
http://dx.doi.org/10.29322/IJSRP.10.02.2020.p9825 www.ijsrp.org
Figure 2. The Framework of Independent Sample t-Test (for the First to the Third Alternative Hypothesis).
Figure 3. The Framework of One Sample t-Test (for the Fourth Alternative Hypothesis)
III. METHOD
The design that had been adopted in the study was the comparative design. According to Sugiyono (2006:68), a comparative study
refers to the study that has been conducted in order to compare the similarities and the differences between two facts or more and the
characteristics of the objects that have been studied based on certain frameworks. Furthermore, in relation to the design, Sugiyono
(2013:115) states that population refers to the area of generalization that consists of objects or subjects that have certain qualities and
characteristics that have been assigned by a researcher for the purpose of his or her study and verification. Specific to the context of the
study, the population in the study was the customers who used to dine in McDonald’s and Richeese Factory outlets located in Bintara,
West Bekasi. In gathering the sample from the population, the non-probability sampling technique had been adopted. Non-probability
sampling technique refers to the sample gathering technique that provides equal opportunity for each element or each member of the
population to be selected as the sample (Sugiyono, 2009:120). Within the study, in determining the minimum number of samples, the
statement by Hair et al. (2010), namely that the number of sample as respondent should be adjusted to the number of question/statement
indicators that have been used in the questionnaire, served as the reference under the following assumption: n x 5 observed variable
(indicators) until n x 10 observed variable (indicators). The number of the item was 31 statements that had been used for measuring 5
variables; consequently, the number of respondents that should be selected for the conduct of the study was 31 items x 5 = 155
respondents. Then, the formula for attaining the number of samples by means of Hair approach was as follows:
𝑆𝑎𝑚𝑝𝑙𝑒 = 𝑁𝑢𝑚𝑏𝑒𝑟 𝑜𝑓 𝐼𝑛𝑑𝑖𝑐𝑎𝑡𝑜𝑟 × 5
𝑆𝑎𝑚𝑝𝑙𝑒 = 31 × 5
𝑆𝑎𝑚𝑝𝑙𝑒 = 155
From the above calculation, the minimum number of samples was 155 respondents and these respondents later were selected based on
the following considerations:
Variable Dimension
Variable of McDonald’s
Variable Dimension
Variable of Richeese
Factory
Differentiated
(Independent Sample t-test
Presence/Absence of Difference
McDonald’s
1. Service Quality
2. Customer
Experience
3. Brand Image
Richeese Factory
1. Service Quality
2. Customer
Experience
3. Brand Image
H4 One Sample Test
International Journal of Scientific and Research Publications, Volume 10, Issue 2, February 2020 148
ISSN 2250-3153
http://dx.doi.org/10.29322/IJSRP.10.02.2020.p9825 www.ijsrp.org
1. The respondents already had monthly income or allowance.
2. The respondents used to dine in McDonald’s or Richeese Factory Restaurant in Bintara, Bekasi.
All of the tests or the calculation processes in the study were assisted by SPSS Version 23 program. Then, the normality test was
conducted first in the study in order to identify whether the data had been normally distributed or not. Then, the subsequent tests or
calculation processes were conducted by means of parametric statistic differential test method (Independent Sample t-Test and One
Sample t-Test) or non-parametric statistic differential test method (Mann Whitney Test).
Descriptive Statistics
According to Ghozali (2013), descriptive statistics refer to the statistics that have been implemented in order to describe or to
illustrate the data that have been gathered as they are without any intention create generalization.
Independent Sample t-Test
The Independent Sample t-Test was conducted in order to significantly test the presence or the absence of two inter-independent
groups mean score (Wijaya, 2009).
One Sample t-Test
The One Sample t-Test was conducted in order to compare the mean scores from the samples that had been test and the mean
scores that had been standardized. The mean score of the population were used as the comparison to the mean score of the samples.
From this comparison, it might be revealed whether the mean scores of the population that had been used as the comparison were
significantly different to the mean scores of the samples. If there had been differences, then the highest mean score from which group
should have been calculated. In conducting the test, the two-sample test with level of significance was adopted (Wijaya, 2009).
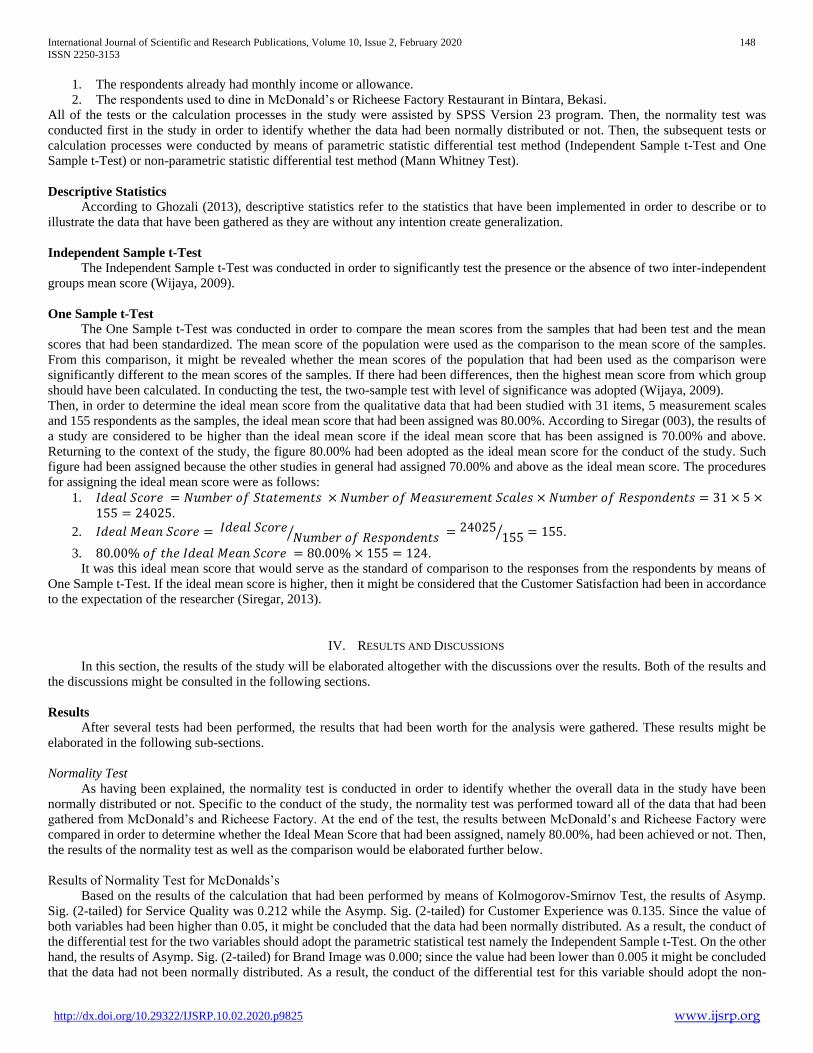
Then, in order to determine the ideal mean score from the qualitative data that had been studied with 31 items, 5 measurement scales
and 155 respondents as the samples, the ideal mean score that had been assigned was 80.00%. According to Siregar (003), the results of
a study are considered to be higher than the ideal mean score if the ideal mean score that has been assigned is 70.00% and above.
Returning to the context of the study, the figure 80.00% had been adopted as the ideal mean score for the conduct of the study. Such
figure had been assigned because the other studies in general had assigned 70.00% and above as the ideal mean score. The procedures
for assigning the ideal mean score were as follows:
1. 𝐼𝑑𝑒𝑎𝑙 𝑆𝑐𝑜𝑟𝑒 = 𝑁𝑢𝑚𝑏𝑒𝑟 𝑜𝑓 𝑆𝑡𝑎𝑡𝑒𝑚𝑒𝑛𝑡𝑠 × 𝑁𝑢𝑚𝑏𝑒𝑟 𝑜𝑓 𝑀𝑒𝑎𝑠𝑢𝑟𝑒𝑚𝑒𝑛𝑡 𝑆𝑐𝑎𝑙𝑒𝑠 × 𝑁𝑢𝑚𝑏𝑒𝑟 𝑜𝑓 𝑅𝑒𝑠𝑝𝑜𝑛𝑑𝑒𝑛𝑡𝑠 = 31 × 5 ×155 = 24025.
2. 𝐼𝑑𝑒𝑎𝑙 𝑀𝑒𝑎𝑛 𝑆𝑐𝑜𝑟𝑒 = 𝐼𝑑𝑒𝑎𝑙 𝑆𝑐𝑜𝑟𝑒𝑁𝑢𝑚𝑏𝑒𝑟 𝑜𝑓 𝑅𝑒𝑠𝑝𝑜𝑛𝑑𝑒𝑛𝑡𝑠 ⁄ = 24025
155⁄ = 155.
3. 80.00% 𝑜𝑓 𝑡ℎ𝑒 𝐼𝑑𝑒𝑎𝑙 𝑀𝑒𝑎𝑛 𝑆𝑐𝑜𝑟𝑒 = 80.00% × 155 = 124.
It was this ideal mean score that would serve as the standard of comparison to the responses from the respondents by means of
One Sample t-Test. If the ideal mean score is higher, then it might be considered that the Customer Satisfaction had been in accordance
to the expectation of the researcher (Siregar, 2013).
IV. RESULTS AND DISCUSSIONS
In this section, the results of the study will be elaborated altogether with the discussions over the results. Both of the results and
the discussions might be consulted in the following sections.
Results
After several tests had been performed, the results that had been worth for the analysis were gathered. These results might be
elaborated in the following sub-sections.
Normality Test
As having been explained, the normality test is conducted in order to identify whether the overall data in the study have been
normally distributed or not. Specific to the conduct of the study, the normality test was performed toward all of the data that had been
gathered from McDonald’s and Richeese Factory. At the end of the test, the results between McDonald’s and Richeese Factory were
compared in order to determine whether the Ideal Mean Score that had been assigned, namely 80.00%, had been achieved or not. Then,
the results of the normality test as well as the comparison would be elaborated further below.
Results of Normality Test for McDonalds’s
Based on the results of the calculation that had been performed by means of Kolmogorov-Smirnov Test, the results of Asymp.
Sig. (2-tailed) for Service Quality was 0.212 while the Asymp. Sig. (2-tailed) for Customer Experience was 0.135. Since the value of
both variables had been higher than 0.05, it might be concluded that the data had been normally distributed. As a result, the conduct of
the differential test for the two variables should adopt the parametric statistical test namely the Independent Sample t-Test. On the other
hand, the results of Asymp. Sig. (2-tailed) for Brand Image was 0.000; since the value had been lower than 0.005 it might be concluded
that the data had not been normally distributed. As a result, the conduct of the differential test for this variable should adopt the non-

International Journal of Scientific and Research Publications, Volume 10, Issue 2, February 2020 149
ISSN 2250-3153
http://dx.doi.org/10.29322/IJSRP.10.02.2020.p9825 www.ijsrp.org
parametric statistical test namely the Mann Whitney test, which does not require that the data should be normally distributed. The
complete results of the Normality test for McDonald’s might be consulted in Table 2 below.
Table 2. Results of One-Sample Kolmogorov-Smirnov Test for McDonald’s
One-Sample Kolmogorov-Smirnov Test
Service
Quality
Customer
Experience
Brand
Image
N 155 155 155
Kolmogorov-Smirnov Z 1.059 1.162 2.47
Asymp. Sig. (2-tailed) 0.212 0.135 0.000
a. Test distribution is Normal.
b. Calculated from data.
Results of Normality Test for Richeese Factory
Based on the results of the calculation that had been performed by means of Kolmogorov-Smirnov Test, the results of Asymp.
Sig. (2-tailed) for Service Quality was 0.129 while the Asymp. Sig. (2-tailed) for Customer Experience was 0.301. Since the value of
both variables had been higher than 0.05, it might be concluded that the data had been normally distributed. As a result, the conduct of
the differential test for the two variables should adopt the parametric statistical test namely the Independent Sample t-Test. On the other
hand, the results of Asymp. Sig. (2-tailed) for Brand Image was 0.001; since the value had been lower than 0.005 it might be concluded
that the data had not been normally distributed. As a result, the conduct of the differential test for this variable should adopt the non-
parametric statistical test namely the Mann Whitney test, which does not require that the data should be normally distributed. The
complete results of the Normality test for McDonald’s might be consulted in Table 3 below.
Table 3. Results of One-Sample Kolmogorov-Smirnov Test for Richeese Factory
One-Sample Kolmogorov-Smirnov Test
Service
Quality
Customer
Experience
Brand
Image
N 155 155 155
Kolmogorov-Smirnov Z 1.17 0.972 1.916
Asymp. Sig. (2-tailed) 0.129 0.301 0.001
a. Test distribution is Normal.
b. Calculated from data.
From the results of the One-Sample Kolmogorov-Smirnov Test for both McDonald’s and Richeese Factory, the Asymp. Sig (2-
tailed) of McDonald’s was 0.163 while the Asymp.Sig. (2-tailed) for Richeese Factory was 0.357. Since the Asymp. Sig. (2-tailed) value
of both variables had been higher than 0.005, it might be concluded that the data for both variables had been normally distributed. Then,
in order to test the fourth hypothesis, namely that both McDonald’s and Richeese Factory have been able to reach the 80.00% Ideal
Mean Score, the One-Sample t-Test should be conducted in the subsequent stage. The complete results of the Kolmogorov-Smirnov
Test in this section might be consulted in Table 4 below.
Table 4. Results of One-Sample Kolmogorov-Smirnov Test for Both McDonald’s and Richeese Factory
One-Sample Kolmogorov-Smirnov Test
MC. Donald Richeese
N 155 155
Kolmogorov-Smirnov Z 1.12 0.927
Asymp. Sig. (2-tailed) 0.163 0.357
a. Test distribution is Normal.
b. Calculated from data.
International Journal of Scientific and Research Publications, Volume 10, Issue 2, February 2020 150
ISSN 2250-3153
http://dx.doi.org/10.29322/IJSRP.10.02.2020.p9825 www.ijsrp.org
Independent Sample t-Test
As having been explained, the Independent Sample t-Test was performed for the three variables namely Service Quality, Customer
Experience and Brand Image. For the variables that had the normal data distribution, namely Service Quality and Customer Experience,
the Independent Sample t-Test that should be adopted was the Levene’s Test. On the other hand, for the variable that did not have the
normal data distributed, namely Brand Image, the Independent Sample t-Test that should be adopted was the Mann Whitney Test. The
results of both the Independent Sample t-Test might be consulted in the following sections.
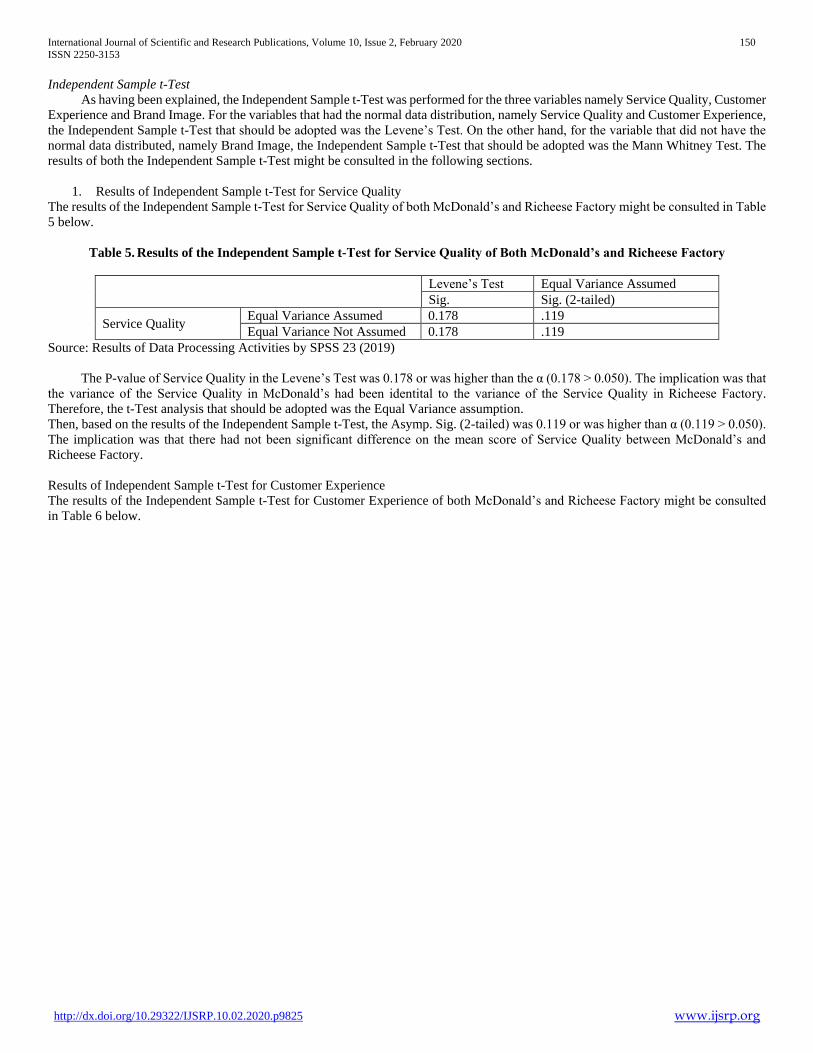
1. Results of Independent Sample t-Test for Service Quality
The results of the Independent Sample t-Test for Service Quality of both McDonald’s and Richeese Factory might be consulted in Table
5 below.
Table 5. Results of the Independent Sample t-Test for Service Quality of Both McDonald’s and Richeese Factory
Levene’s Test Equal Variance Assumed
Sig. Sig. (2-tailed)
Service Quality Equal Variance Assumed 0.178 .119
Equal Variance Not Assumed 0.178 .119
Source: Results of Data Processing Activities by SPSS 23 (2019)
The P-value of Service Quality in the Levene’s Test was 0.178 or was higher than the α (0.178 > 0.050). The implication was that
the variance of the Service Quality in McDonald’s had been identital to the variance of the Service Quality in Richeese Factory.
Therefore, the t-Test analysis that should be adopted was the Equal Variance assumption.
Then, based on the results of the Independent Sample t-Test, the Asymp. Sig. (2-tailed) was 0.119 or was higher than α (0.119 > 0.050).
The implication was that there had not been significant difference on the mean score of Service Quality between McDonald’s and
Richeese Factory.
Results of Independent Sample t-Test for Customer Experience
The results of the Independent Sample t-Test for Customer Experience of both McDonald’s and Richeese Factory might be consulted
in Table 6 below.
International Journal of Scientific and Research Publications, Volume 10, Issue 2, February 2020 151
ISSN 2250-3153
http://dx.doi.org/10.29322/IJSRP.10.02.2020.p9825 www.ijsrp.org
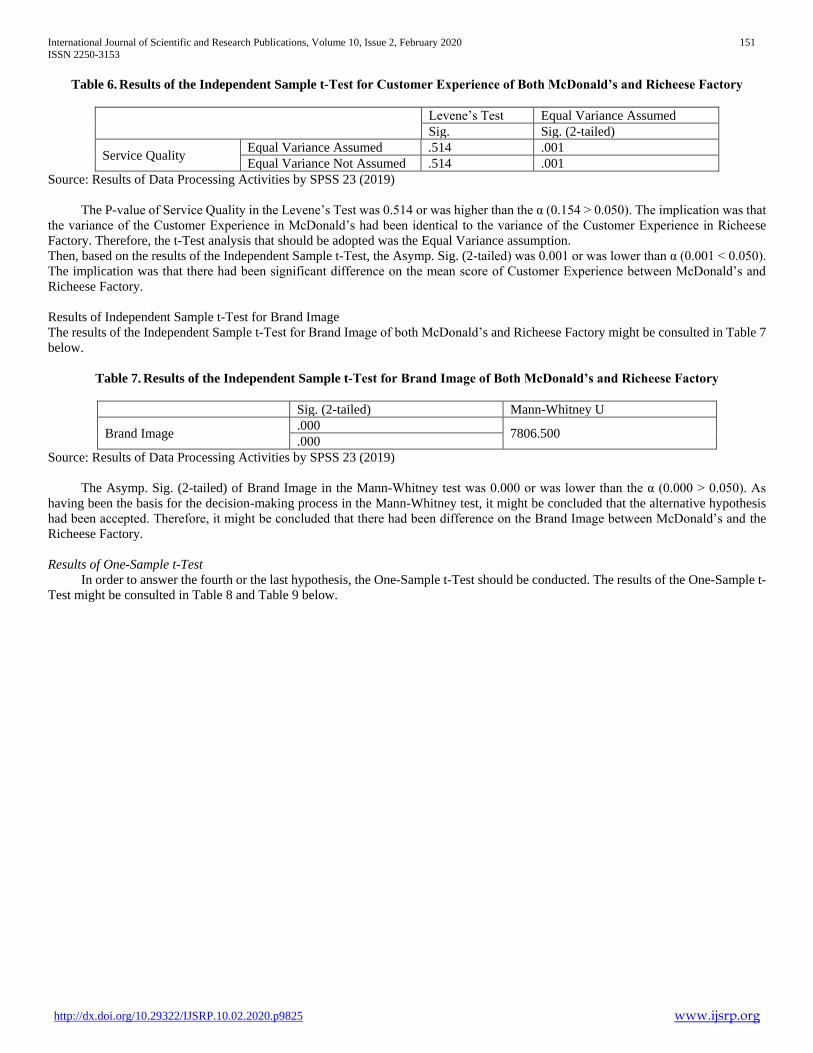
Table 6. Results of the Independent Sample t-Test for Customer Experience of Both McDonald’s and Richeese Factory
Levene’s Test Equal Variance Assumed
Sig. Sig. (2-tailed)
Service Quality Equal Variance Assumed .514 .001
Equal Variance Not Assumed .514 .001
Source: Results of Data Processing Activities by SPSS 23 (2019)
The P-value of Service Quality in the Levene’s Test was 0.514 or was higher than the α (0.154 > 0.050). The implication was that
the variance of the Customer Experience in McDonald’s had been identical to the variance of the Customer Experience in Richeese
Factory. Therefore, the t-Test analysis that should be adopted was the Equal Variance assumption.
Then, based on the results of the Independent Sample t-Test, the Asymp. Sig. (2-tailed) was 0.001 or was lower than α (0.001 < 0.050).
The implication was that there had been significant difference on the mean score of Customer Experience between McDonald’s and
Richeese Factory.
Results of Independent Sample t-Test for Brand Image
The results of the Independent Sample t-Test for Brand Image of both McDonald’s and Richeese Factory might be consulted in Table 7
below.
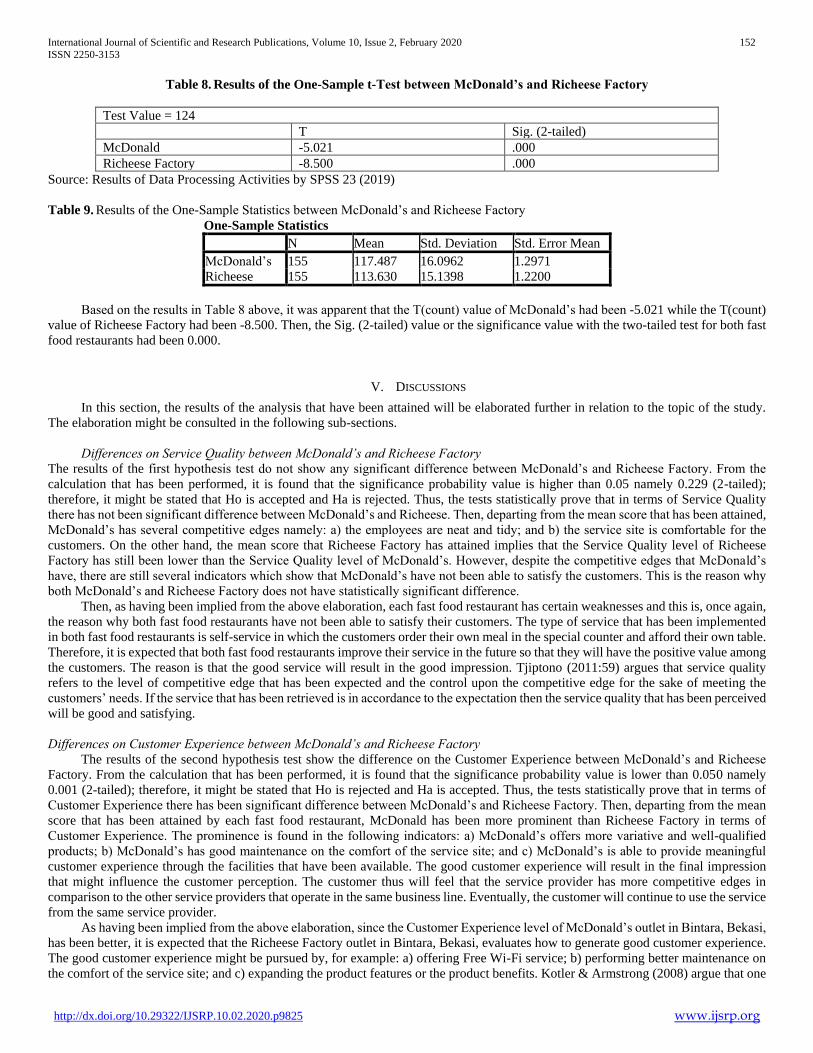
Table 7. Results of the Independent Sample t-Test for Brand Image of Both McDonald’s and Richeese Factory
Sig. (2-tailed) Mann-Whitney U
Brand Image .000
7806.500 .000
Source: Results of Data Processing Activities by SPSS 23 (2019)
The Asymp. Sig. (2-tailed) of Brand Image in the Mann-Whitney test was 0.000 or was lower than the α (0.000 > 0.050). As
having been the basis for the decision-making process in the Mann-Whitney test, it might be concluded that the alternative hypothesis
had been accepted. Therefore, it might be concluded that there had been difference on the Brand Image between McDonald’s and the
Richeese Factory.
Results of One-Sample t-Test
In order to answer the fourth or the last hypothesis, the One-Sample t-Test should be conducted. The results of the One-Sample t-
Test might be consulted in Table 8 and Table 9 below.
International Journal of Scientific and Research Publications, Volume 10, Issue 2, February 2020 152
ISSN 2250-3153
http://dx.doi.org/10.29322/IJSRP.10.02.2020.p9825 www.ijsrp.org
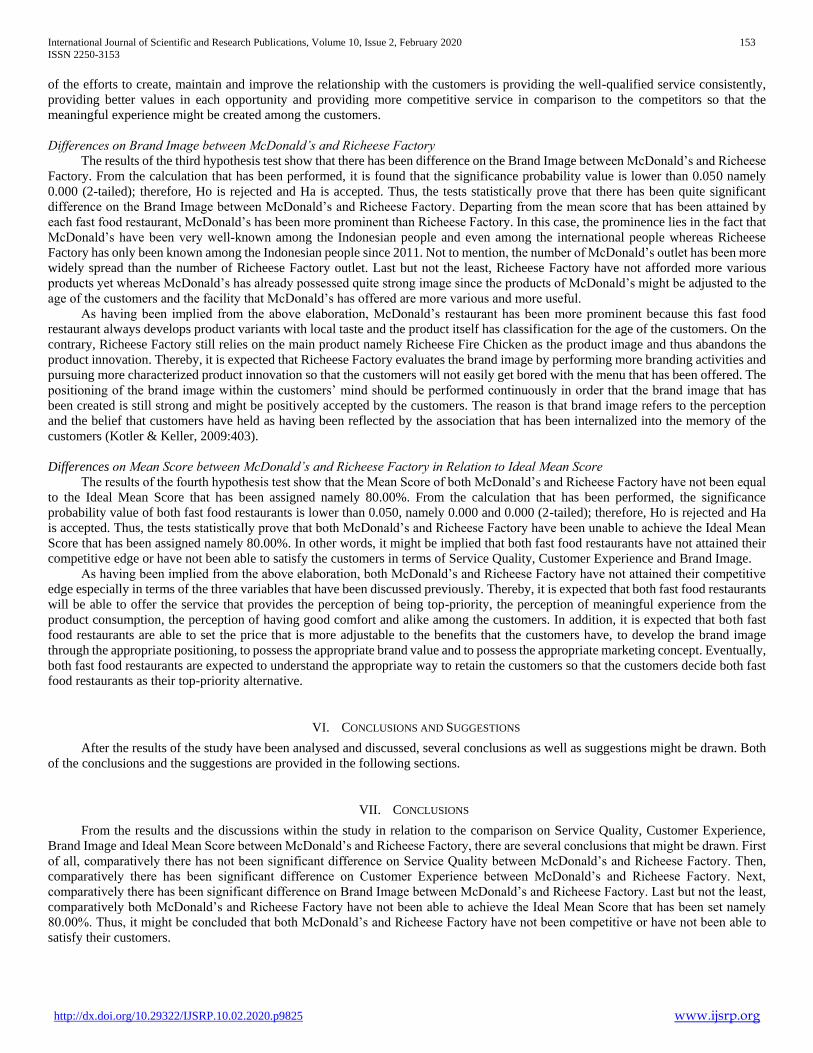
Table 8. Results of the One-Sample t-Test between McDonald’s and Richeese Factory
Test Value = 124
T Sig. (2-tailed)
McDonald -5.021 .000
Richeese Factory -8.500 .000
Source: Results of Data Processing Activities by SPSS 23 (2019)
Table 9. Results of the One-Sample Statistics between McDonald’s and Richeese Factory
One-Sample Statistics
N Mean Std. Deviation Std. Error Mean
McDonald’s 155 117.487 16.0962 1.2971
Richeese 155 113.630 15.1398 1.2200
Based on the results in Table 8 above, it was apparent that the T(count) value of McDonald’s had been -5.021 while the T(count)
value of Richeese Factory had been -8.500. Then, the Sig. (2-tailed) value or the significance value with the two-tailed test for both fast
food restaurants had been 0.000.
V. DISCUSSIONS
In this section, the results of the analysis that have been attained will be elaborated further in relation to the topic of the study.
The elaboration might be consulted in the following sub-sections.
Differences on Service Quality between McDonald’s and Richeese Factory
The results of the first hypothesis test do not show any significant difference between McDonald’s and Richeese Factory. From the
calculation that has been performed, it is found that the significance probability value is higher than 0.05 namely 0.229 (2-tailed);
therefore, it might be stated that Ho is accepted and Ha is rejected. Thus, the tests statistically prove that in terms of Service Quality
there has not been significant difference between McDonald’s and Richeese. Then, departing from the mean score that has been attained,
McDonald’s has several competitive edges namely: a) the employees are neat and tidy; and b) the service site is comfortable for the
customers. On the other hand, the mean score that Richeese Factory has attained implies that the Service Quality level of Richeese
Factory has still been lower than the Service Quality level of McDonald’s. However, despite the competitive edges that McDonald’s
have, there are still several indicators which show that McDonald’s have not been able to satisfy the customers. This is the reason why
both McDonald’s and Richeese Factory does not have statistically significant difference.
Then, as having been implied from the above elaboration, each fast food restaurant has certain weaknesses and this is, once again,
the reason why both fast food restaurants have not been able to satisfy their customers. The type of service that has been implemented
in both fast food restaurants is self-service in which the customers order their own meal in the special counter and afford their own table.
Therefore, it is expected that both fast food restaurants improve their service in the future so that they will have the positive value among
the customers. The reason is that the good service will result in the good impression. Tjiptono (2011:59) argues that service quality
refers to the level of competitive edge that has been expected and the control upon the competitive edge for the sake of meeting the
customers’ needs. If the service that has been retrieved is in accordance to the expectation then the service quality that has been perceived
will be good and satisfying.
Differences on Customer Experience between McDonald’s and Richeese Factory
The results of the second hypothesis test show the difference on the Customer Experience between McDonald’s and Richeese
Factory. From the calculation that has been performed, it is found that the significance probability value is lower than 0.050 namely
0.001 (2-tailed); therefore, it might be stated that Ho is rejected and Ha is accepted. Thus, the tests statistically prove that in terms of
Customer Experience there has been significant difference between McDonald’s and Richeese Factory. Then, departing from the mean
score that has been attained by each fast food restaurant, McDonald has been more prominent than Richeese Factory in terms of
Customer Experience. The prominence is found in the following indicators: a) McDonald’s offers more variative and well-qualified
products; b) McDonald’s has good maintenance on the comfort of the service site; and c) McDonald’s is able to provide meaningful
customer experience through the facilities that have been available. The good customer experience will result in the final impression
that might influence the customer perception. The customer thus will feel that the service provider has more competitive edges in
comparison to the other service providers that operate in the same business line. Eventually, the customer will continue to use the service
from the same service provider.
As having been implied from the above elaboration, since the Customer Experience level of McDonald’s outlet in Bintara, Bekasi,
has been better, it is expected that the Richeese Factory outlet in Bintara, Bekasi, evaluates how to generate good customer experience.
The good customer experience might be pursued by, for example: a) offering Free Wi-Fi service; b) performing better maintenance on
the comfort of the service site; and c) expanding the product features or the product benefits. Kotler & Armstrong (2008) argue that one
International Journal of Scientific and Research Publications, Volume 10, Issue 2, February 2020 153
ISSN 2250-3153
http://dx.doi.org/10.29322/IJSRP.10.02.2020.p9825 www.ijsrp.org
of the efforts to create, maintain and improve the relationship with the customers is providing the well-qualified service consistently,
providing better values in each opportunity and providing more competitive service in comparison to the competitors so that the
meaningful experience might be created among the customers.
Differences on Brand Image between McDonald’s and Richeese Factory
The results of the third hypothesis test show that there has been difference on the Brand Image between McDonald’s and Richeese
Factory. From the calculation that has been performed, it is found that the significance probability value is lower than 0.050 namely
0.000 (2-tailed); therefore, Ho is rejected and Ha is accepted. Thus, the tests statistically prove that there has been quite significant
difference on the Brand Image between McDonald’s and Richeese Factory. Departing from the mean score that has been attained by
each fast food restaurant, McDonald’s has been more prominent than Richeese Factory. In this case, the prominence lies in the fact that
McDonald’s have been very well-known among the Indonesian people and even among the international people whereas Richeese
Factory has only been known among the Indonesian people since 2011. Not to mention, the number of McDonald’s outlet has been more
widely spread than the number of Richeese Factory outlet. Last but not the least, Richeese Factory have not afforded more various
products yet whereas McDonald’s has already possessed quite strong image since the products of McDonald’s might be adjusted to the
age of the customers and the facility that McDonald’s has offered are more various and more useful.
As having been implied from the above elaboration, McDonald’s restaurant has been more prominent because this fast food
restaurant always develops product variants with local taste and the product itself has classification for the age of the customers. On the
contrary, Richeese Factory still relies on the main product namely Richeese Fire Chicken as the product image and thus abandons the
product innovation. Thereby, it is expected that Richeese Factory evaluates the brand image by performing more branding activities and
pursuing more characterized product innovation so that the customers will not easily get bored with the menu that has been offered. The
positioning of the brand image within the customers’ mind should be performed continuously in order that the brand image that has
been created is still strong and might be positively accepted by the customers. The reason is that brand image refers to the perception
and the belief that customers have held as having been reflected by the association that has been internalized into the memory of the
customers (Kotler & Keller, 2009:403).
Differences on Mean Score between McDonald’s and Richeese Factory in Relation to Ideal Mean Score
The results of the fourth hypothesis test show that the Mean Score of both McDonald’s and Richeese Factory have not been equal
to the Ideal Mean Score that has been assigned namely 80.00%. From the calculation that has been performed, the significance
probability value of both fast food restaurants is lower than 0.050, namely 0.000 and 0.000 (2-tailed); therefore, Ho is rejected and Ha
is accepted. Thus, the tests statistically prove that both McDonald’s and Richeese Factory have been unable to achieve the Ideal Mean
Score that has been assigned namely 80.00%. In other words, it might be implied that both fast food restaurants have not attained their
competitive edge or have not been able to satisfy the customers in terms of Service Quality, Customer Experience and Brand Image.
As having been implied from the above elaboration, both McDonald’s and Richeese Factory have not attained their competitive
edge especially in terms of the three variables that have been discussed previously. Thereby, it is expected that both fast food restaurants
will be able to offer the service that provides the perception of being top-priority, the perception of meaningful experience from the
product consumption, the perception of having good comfort and alike among the customers. In addition, it is expected that both fast
food restaurants are able to set the price that is more adjustable to the benefits that the customers have, to develop the brand image
through the appropriate positioning, to possess the appropriate brand value and to possess the appropriate marketing concept. Eventually,
both fast food restaurants are expected to understand the appropriate way to retain the customers so that the customers decide both fast
food restaurants as their top-priority alternative.
VI. CONCLUSIONS AND SUGGESTIONS
After the results of the study have been analysed and discussed, several conclusions as well as suggestions might be drawn. Both
of the conclusions and the suggestions are provided in the following sections.
VII. CONCLUSIONS
From the results and the discussions within the study in relation to the comparison on Service Quality, Customer Experience,
Brand Image and Ideal Mean Score between McDonald’s and Richeese Factory, there are several conclusions that might be drawn. First
of all, comparatively there has not been significant difference on Service Quality between McDonald’s and Richeese Factory. Then,
comparatively there has been significant difference on Customer Experience between McDonald’s and Richeese Factory. Next,
comparatively there has been significant difference on Brand Image between McDonald’s and Richeese Factory. Last but not the least,
comparatively both McDonald’s and Richeese Factory have not been able to achieve the Ideal Mean Score that has been set namely
80.00%. Thus, it might be concluded that both McDonald’s and Richeese Factory have not been competitive or have not been able to
satisfy their customers.
International Journal of Scientific and Research Publications, Volume 10, Issue 2, February 2020 154
ISSN 2250-3153
http://dx.doi.org/10.29322/IJSRP.10.02.2020.p9825 www.ijsrp.org
VIII. SUGGESTIONS
Departing from the conclusions that have been drawn, several suggestions might be offered to the management of McDonald’s
and also to the management of Richeese Factory. First of all, with regards to Service Quality, the lowest response from the questionnaire
implies that the customers have not been provided with an assurance of cost for the service delivery; thus, it is suggested there should
be special training programs for the employees in order that the skills of the employees become consistent so the minimum human
errors, such as picking up the wrong menu for the customers and establishing less clear communication among the employees, might be
minimized. Then, with regards to Customer Experience, the lowest response from the questionnaire implies that the design interior has
been monotonous or ordinary (for McDonald’s) and the facilities that have been provided are still minimum (for Richeese Factory). In
relation to these findings, it is suggested that McDonald’s should pursue interesting theme for their design concept in relation to specific
days such as Independence Day with the colourful red and white decoration and Halloween Day with the gothic nuance. In the same
time, it is also suggested that Richeese Factory should provide additional facilities such as children’s playground, free wi-fi service,
drive thru and alike. Last but not the least, with regards to Brand Image, the lowest response is only found in the statements for Richeese
Factory. Since Richeese Factory has been less famous than McDonald’s, it is suggested that Richeese Factory should promote the brand
more especially through the electronic media and the social media because nowadays more and more people have been more active in
the virtual world.
Furthermore, for the future researchers, it suggested that the coverage area for the study of McDonald’s and Richeese Factory
should be expanded in order that the customers who have been outside the objects of the study might identify the quality of both fast
food restaurants in satisfying the customers or in meeting the customers’ needs. Eventually, it is also suggested that the future researchers
should study other variables that might have significant differences.
REFERENCES
[1] Abu Samah I. H., Abd Rashid I. M., Abd Rani M. J., Rahman N. I. A., Ali M. A., & Abdullah M. F. S. (2015). The Roles of Price Perception and Physical Environtment in Determining Customer Loyalty : Evidence From Fast Food Restaurant of Malaysia. International Journal of Development Research, 05(05).
[2] Amstrong, Gary & Philip, Kotler. 2002. Dasar-dasar Pemasaran. Jilid 1, Alih Bahasa Alexander Sindoro dan Benyamin Molan. Jakarta: Penerbit Prenhalindo.
[3] Apriyanti Y. (2012). Pengaruh Brand Image, Harga dan Kualitas Pelayanan terhadap Keputusan Pembelian Ulang Pizza Hut di Kota Padang.
[4] Aryani D., & Rosinta F. (2010). Pengaruh Kualitas Layanan terhadap Kepuasan Pelanggan dalam Membentuk Loyalitas Pelanggan. Bisnis & Birokrasi, Jurnal Ilmu Administrasi dan Organisasi, 17(2).
[5] Aufa Z. D., & Kamal M. (2015). Analisis Pengaruh Ragam Menu, Persepsi Harga, Lokasi dan Kualitas Layanan Terhadap Minat Beli Ulang pada Soto Sedeep Banyumanik Cabang Ambrawa. Diponegoro Journal of Management, 4(4).
[6] Bororing T., Lapian J. S.L.H.V., Tumiwa J. R. (2017). Comparative Analysis of Perceived Price, Perceived Quality, Perceived Value beetwen Male and Female Customers of KFC in Manado. Jurnal EMBA, 5(3).
[7] Chan A., Maharani M., & Tresna P. W. (2017). Comparison of User Experience on Go-jek and Grab Mobile Apps (Study on PT.Go-jek and PT. Grab Indonesia Consumer in DKI Jakarta). Jurnal AdBispreneur, 2(2).
[8] Fungai M. (2017). Factors Influencing Customer Repurchase Intention in The Fast Food Industry. A Case Study of Innscor Mutare, Zimbabwe. Business & Social Science Journal (BSSJ), 1(3).
[9] Hair et al. (2010). Multivariate Data Analysis, Seventh Edition. Pearson Prentice Hall
[10] Harjati L., & Venesia Y. (2015). Pengaruh Kualitas Layanan dan Persepsi Harga terhadap Kepuasan Pelanggan pada Maskapai Penerbangan Tiger Air Mandala. e-Journal WIDYA Ekonomika, 1(1).
[11] Hidayat A.M., & Rahayu F. (2013). Studi Komparatif Kualitas Pelayanan dan Strategi Delivery Service pada KFC dan McDonald’s cabang Buah Batu Bandung. Jurnal Manajemen Bisnis Indonesia, 1(1).
[12] Huang C. C., Yen S. W., & Liu C. Y. (2014). The Relationship Among Corporate Social Responsibility, Service Quality, Corporate Image and Purchase Intention. International Journal of Organizational Innovation, 6(3).
[13] Jaini A., Ahmad N. A., & Mat Zaib S. Z. (2015). Determinant Factors that Influence Customers’ Experience in Fast Food Restaurants in Sungai Petani, Kedah. Journal of Entrepreneurship and Business, 3(1).
[14] Julianingtias Y., Suharyono, & Abdillah Y. (2016). Analisis Perbandingan Produk Merek Global dan Merek Lokal terkait Bauran Pemasaran dan Pengaruhnya terhadap Keputusan Pembelian. Jurnal Administrasi Bisnis (JAB), 37(2).
[15] Kim N. M., Kim H. J. (2015). Comparative Study about The User Experience, Product Attitudes, and Repurchase Intention regarding Smartphone UI in Korea and China. Journal of Digital Convergence, 13(10)
[16] Kotler & Keller. 20011. Manajemen Pemasaran. Jilid V. Edisi ke 13. Jakarta: Erlangga.
[17] Kotler, Philip dan Gary Armstrong, 2012. Manajemen Pemasaran. Jilid 1. Edisi 13, Edisi Bahasa Indonesia, Penerbit Erlangga, Jakarta.
[18] Kotler, Philip dan Kevin Lane Keller, 2008. Manajemen Pemasaran, Jilid 1, Penerbit Erlangga. Jakarta.
[19] Kusuma S.W., Dewi C.K. (2019). Studi Komparatif Bauran Pemasaran dan Brand Image antara Dunkin Donuts dan J.CO Donuts (Studi Cabang Buah Batu Bandung). e-Proceeding of Management, 6(1).
[20] Marsellita P. V., Goenawan V., Tarigan Z. J. H., & Kristanti M. (2008). Analisa Perbandingan Harapan dan Persepsi Pria dan Wanita dalam Memilih Sebuah Restoran di Surabaya ditinjau dari Segi Meal Experience. Jurnal Manajemen Perhotelan, 4(1).
[21] Prastyaningsih A. S., Suyadi I., & Yulianto E. (2014). Pengaruh Customer Experience terhadap Repurchase Intention (Survei pada Konsumen KFC di Lingkungan Warga RW 3 Desa Kandangrejo, Kedungpring, Lamongan). Jurnal Administrasi Bisnis (JAB), 16(1).
[22] Putri S. M. A. (2015). Analisis Perbandingan Kualitas Layanan The Premiere Cinema XXI Ciwalk dan Velvet Class Blitzmegaplex PVJ menurut Konsumen di Bandung. e-Proceeding of Management, 2(3).
[23] Rizan M., Saidani B., & Sari Y. (2012). Pengaruh Brand Image dan Brand Trust Terhadap Brand Loyalty Teh Botol Sosro. Jurnal Riset Manajemen Sains Indonesia (JRMSI), 3(1).
International Journal of Scientific and Research Publications, Volume 10, Issue 2, February 2020 155
ISSN 2250-3153
http://dx.doi.org/10.29322/IJSRP.10.02.2020.p9825 www.ijsrp.org
[24] Sabanari A.E., Lambey L., Rumokoy S.F. (2017). Comparative Research of Customer Experience and Customer Expectation between Male and Female Cusotmers of KM.Majestic Kawanua. Jurnal EMBA, 5(3).
[25] Santoso I. (2016). Peran Kualitas Produk dan Layanan, Harga dan Atmosfer Rumah Makan Cepat Saji terhadap Keputusan Pembelian dan Kepuasan Konsumen. Jurnal Manajemen Teknologi, 15(1).
[26] Sayuti M. H., & Dewi C.K. (2015). Analisis Pengaruh Customer Experience Terhadap Minat Beli Ulang Konsumen pada Kafe Nom Nom Eatery Bandung. e-Proceeding of Management, 2(2).
[27] Siregar. Syofian. (2014). Metode Penelitian Kuantitatif, Kualitatif, dan R&D. Bandung : CV Alfabeta.
[28] Susanto F. A., Rafani Y., & Yenfi. (2014). Analisis Perbandingan Kualitas Pelayanan terhadap Kepuasan Konsumen. Jurnal Progresif Manajemen Bisnis (JPMB), 1(1).
[29] Syarif F. F., & Oktafani F. (2017). Analisis Perbandingan Persepsi Konsumen Mengenai Store Atmosphere pada Selaz Cafe & Resto dan Arosa Cafe & Resto Sumedang. Buana Ilmu, 1(2).
[30] Subiakto Utamie Vania, 2019, STRATEGI SOSIALISASI KEBIJAKAN PENDEREKAN OLEH SUKU DINAS PERHUBUNGAN JAKARTA BARAT, CoverAge: Journal of Strategic Communication, Vol. 9. No.2, ISSN 2087-3352
[31] Widi L. V. (2015). Analisis Pengaruh Kualitas Layanan dan Kualitas Produk Terhadap Minat Beli Ulang (Studi Pada Starbuck Semarang).
[32] Yosep L. (2013). Pengaruh Harga dan Promosi Terhadap Keputusan Konsumen dalam Pembelian Cat Merek Mowilek di Jakarta. Jurnal MIX, 3(3).
[33] Yuliawati & Irawan Pera Enjang. The Analysis Of Green Environment Movement Campaign In Supporting National Food Security Of Indonesia. Global Journal Of HUMAN-SOCIAL SCIENCE. Volume XVIII Issue II Version I 2018
OTHER SOURCES
[34] Widia S. (2019). McD Agresif Ekspansi Gerai Baru di https://youngster.id/news/mcd-agresif-ekspansi-gerai-baru (diakses pada tanggal 10 April 2019)
[35] PT. Rekso Nasional Food. (2019). Sejarah Mc Donald’s di https://mcdonalds.co.id/tentang-mcdonalds/info-perusahaan/visi-misi (diakses pada tanggal 10 April 2019)
[36] PT. Rekso Nasional Food. (2019). Visi Misi di https://mcdonalds.co.id/tentang-mcdonalds/info-perusahaan/sejarah-mcdonalds (diakses pada tanggal 10 April 2019)
[37] PT. Richeese Kuliner Indonesia. (2019). Sejarah di https://www.richeesefactory.com/id/about/history (di akses pada tanggal 10 April 2019)
[38] Nabati Group. (2019). Our Business di https://www.nabatigroup.com/our-business/rki/ (last access: April 10th, 2019).
AUTHORS
First Author – Viciwati, Faculty of Economics and Business, Mercu Buana University, Jakarta, ([email protected])


![Customer Retention [Infographic] Customer Experience](https://img.pdfslide.us/doc/110x75/55b6dceebb61eb0c598b46c8/customer-retention-infographic-customer-experience.jpg)