Embed Size (px)
Citation preview
arX
iv:h
ep-e
x/97
0201
5v1
25
Feb
1997
Comparison of ZEUS Data
with Standard Model Predictions
for e+p → e+X Scattering at High x and Q2
ZEUS Collaboration
Abstract
Using the ZEUS detector at HERA, we have studied the reaction e+p → e+X forQ2 > 5000GeV2 with a 20.1 pb−1 data sample collected during the years 1994 to1996. For Q2 below 15000 GeV2, the data are in good agreement with StandardModel expectations. For Q2 > 35000 GeV2, two events are observed while 0.145±0.013 events are expected. A statistical analysis of a large ensemble of simulatedStandard Model experiments indicates that with probability 6.0%, an excess atleast as unlikely as that observed would occur above some Q2 cut. For x > 0.55and y > 0.25, four events are observed where 0.91 ± 0.08 events are expected.A statistical analysis of the two-dimensional distribution of the events in x and y
yields a probability of 0.72% for the region x > 0.55 and y > 0.25 and a probabilityof 7.8% for the entire Q2 > 5000GeV2 data sample. The observed excess aboveStandard Model expectations is particularly interesting because it occurs in apreviously unexplored kinematic region.
Submitted for publication in Zeitschrift fur Physik C
DESY 97-025 ISSN 0418-9833
The ZEUS Collaboration
J. Breitweg, M. Derrick, D. Krakauer, S. Magill, D. Mikunas, B. Musgrave, J. Repond,R. Stanek, R.L. Talaga, R. Yoshida, H. ZhangArgonne National Laboratory, Argonne, IL, USA p
M.C.K. MattinglyAndrews University, Berrien Springs, MI, USA
F. Anselmo, P. Antonioli, G. Bari, M. Basile, L. Bellagamba, D. Boscherini, A. Bruni,G. Bruni, G. Cara Romeo, G. Castellini1, L. Cifarelli2, F. Cindolo, A. Contin, M. Corradi,S. De Pasquale, I. Gialas3, P. Giusti, G. Iacobucci, G. Laurenti, G. Levi, A. Margotti,T. Massam, R. Nania, F. Palmonari, A. Pesci, A. Polini, G. Sartorelli, Y. Zamora Garcia4,A. ZichichiUniversity and INFN Bologna, Bologna, Italy f
C. Amelung, A. Bornheim, I. Brock, K. Coboken, J. Crittenden, R. Deffner, M. Eck-ert, L. Feld5, M. Grothe, H. Hartmann, K. Heinloth, L. Heinz, E. Hilger, H.-P. Jakob,U.F. Katz, E. Paul, M. Pfeiffer, Ch. Rembser, J. Stamm, R. Wedemeyer6
Physikalisches Institut der Universitat Bonn, Bonn, Germany c
D.S. Bailey, S. Campbell-Robson, W.N. Cottingham, B. Foster, R. Hall-Wilton, M.E. Hayes,G.P. Heath, H.F. Heath, D. Piccioni, D.G. Roff, R.J. TapperH.H. Wills Physics Laboratory, University of Bristol, Bristol, U.K. o
M. Arneodo7, R. Ayad, M. Capua, A. Garfagnini, L. Iannotti, M. Schioppa, G. SusinnoCalabria University, Physics Dept.and INFN, Cosenza, Italy f
J.Y. Kim, J.H. Lee, I.T. Lim, M.Y. Pac8
Chonnam National University, Kwangju, Korea h
A. Caldwell9, N. Cartiglia, Z. Jing, W. Liu, J.A. Parsons, S. Ritz10, S. Sampson, F. Sciulli,P.B. Straub, Q. ZhuColumbia University, Nevis Labs., Irvington on Hudson, N.Y., USA q
P. Borzemski, J. Chwastowski, A. Eskreys, Z. Jakubowski, M.B. Przybycien, M. Zachara,L. ZawiejskiInst. of Nuclear Physics, Cracow, Poland j
L. Adamczyk, B. Bednarek, K. Jelen, D. Kisielewska, T. Kowalski, M. Przybycien,E. Rulikowska-Zarebska, L. Suszycki, J. ZajacFaculty of Physics and Nuclear Techniques, Academy of Mining and Metallurgy, Cracow,
Poland j
Z. Dulinski, A. KotanskiJagellonian Univ., Dept. of Physics, Cracow, Poland k
1
G. Abbiendi11, L.A.T. Bauerdick, U. Behrens, H. Beier, J.K. Bienlein, G. Cases, O. Deppe,K. Desler, G. Drews, D.J. Gilkinson, C. Glasman, P. Gottlicher, J. Große-Knetter, T. Haas,W. Hain, D. Hasell, H. Heßling, Y. Iga, K.F. Johnson12, M. Kasemann, W. Koch, U. Kotz,H. Kowalski, J. Labs, L. Lindemann, B. Lohr, M. Lowe13, J. Mainusch14, O. Manczak,J. Milewski, T. Monteiro15, J.S.T. Ng16, D. Notz, K. Ohrenberg14, A. Pellegrino, F. Peluc-chi, K. Piotrzkowski, M. Roco17, M. Rohde, J. Roldan, A.A. Savin, U. Schneekloth,W. Schulz18, F. Selonke, B. Surrow, E. Tassi, T. Voß19, D. Westphal, G. Wolf, U. Wollmer,C. Youngman, A.F. Zarnecki, W. ZeunerDeutsches Elektronen-Synchrotron DESY, Hamburg, Germany
B.D. Burow, H.J. Grabosch, A. Meyer, S. SchlenstedtDESY-IfH Zeuthen, Zeuthen, Germany
G. Barbagli, E. Gallo, P. PelferUniversity and INFN, Florence, Italy f
G. Maccarrone, L. VotanoINFN, Laboratori Nazionali di Frascati, Frascati, Italy f
A. Bamberger, S. Eisenhardt, P. Markun, T. Trefzger20, S. WolfleFakultat fur Physik der Universitat Freiburg i.Br., Freiburg i.Br., Germany c
J.T. Bromley, N.H. Brook, P.J. Bussey, A.T. Doyle, D.H. Saxon, L.E. Sinclair, E. Strick-land, M.L. Utley21, R. Waugh, A.S. WilsonDept. of Physics and Astronomy, University of Glasgow, Glasgow, U.K. o
I. Bohnet, N. Gendner, U. Holm, A. Meyer-Larsen, H. Salehi, K. WickHamburg University, I. Institute of Exp. Physics, Hamburg, Germany c
L.K. Gladilin22, R. Klanner, E. Lohrmann, G. Poelz, W. Schott23, F. ZetscheHamburg University, II. Institute of Exp. Physics, Hamburg, Germany c
T.C. Bacon, I. Butterworth, J.E. Cole, V.L. Harris, G. Howell, B.H.Y. Hung, L. Lamberti24,K.R. Long, D.B. Miller, N. Pavel, A. Prinias25, J.K. Sedgbeer, D. Sideris, A.F. Whitfield26
Imperial College London, High Energy Nuclear Physics Group, London, U.K. o
U. Mallik, S.M. Wang, J.T. WuUniversity of Iowa, Physics and Astronomy Dept., Iowa City, USA p
P. Cloth, D. FilgesForschungszentrum Julich, Institut fur Kernphysik, Julich, Germany
S.H. An, S.B. Lee, S.W. Nam, H.S. Park, S.K. ParkKorea University, Seoul, Korea h
F. Barreiro, J.P. Fernandez, R. Graciani, J.M. Hernandez, L. Hervas, L. Labarga, M. Martinez,J. del Peso, J. Puga, J. Terron, J.F. de TroconizUniver. Autonoma Madrid, Depto de Fısica Teorıca, Madrid, Spain n
F. Corriveau, D.S. Hanna, J. Hartmann, L.W. Hung, J.N. Lim, W.N. Murray, A. Ochs,M. Riveline, D.G. Stairs, M. St-Laurent, R. UllmannMcGill University, Dept. of Physics, Montreal, Quebec, Canada a, b
T. TsurugaiMeiji Gakuin University, Faculty of General Education, Yokohama, Japan
2
V. Bashkirov, B.A. Dolgoshein, A. StifutkinMoscow Engineering Physics Institute, Mosocw, Russia l
G.L. Bashindzhagyan, P.F. Ermolov, Yu.A. Golubkov, V.D. Kobrin, I.A. Korzhavina,V.A. Kuzmin, O.Yu. Lukina, A.S. Proskuryakov, L.M. Shcheglova, A.N. Solomin, N.P. Zo-tovMoscow State University, Institute of Nuclear Physics, Moscow, Russia m
C. Bokel, M. Botje, N. Brummer, F. Chlebana17, J. Engelen, M. de Kamps, P. Kooijman,A. Kruse, A. van Sighem, H. Tiecke, W. Verkerke, J. Vossebeld, M. Vreeswijk, L. Wiggers,E. de WolfNIKHEF and University of Amsterdam, Netherlands i
D. Acosta, B. Bylsma, L.S. Durkin, J. Gilmore, C.M. Ginsburg, C.L. Kim, T.Y. Ling,P. Nylander, T.A. Romanowski27
Ohio State University, Physics Department, Columbus, Ohio, USA p
H.E. Blaikley, R.J. Cashmore, A.M. Cooper-Sarkar, R.C.E. Devenish, J.K. Edmonds,N. Harnew, M. Lancaster28, J.D. McFall, C. Nath, V.A. Noyes25, A. Quadt, J.R. Tickner,H. Uijterwaal, R. Walczak, D.S. Waters, T. YipDepartment of Physics, University of Oxford, Oxford, U.K. o
A. Bertolin, R. Brugnera, R. Carlin, F. Dal Corso, U. Dosselli, S. Limentani, M. Morandin,M. Posocco, L. Stanco, R. Stroili, C. VociDipartimento di Fisica dell’ Universita and INFN, Padova, Italy f
J. Bulmahn, R.G. Feild29, B.Y. Oh, J.R. Okrasinski, J.J. WhitmorePennsylvania State University, Dept. of Physics, University Park, PA, USA q
G. Marini, A. NigroDipartimento di Fisica, Univ. ’La Sapienza’ and INFN, Rome, Italy f
J.C. Hart, N.A. McCubbin, T.P. ShahRutherford Appleton Laboratory, Chilton, Didcot, Oxon, U.K. o
E. Barberis28, T. Dubbs, C. Heusch, M. Van Hook, W. Lockman, J.T. Rahn, H.F.-W. Sadrozinski, A. Seiden, D.C. WilliamsUniversity of California, Santa Cruz, CA, USA p
O. Schwarzer, A.H. Walenta, G. ZechFachbereich Physik der Universitat-Gesamthochschule Siegen, Germany c
H. Abramowicz, G. Briskin, S. Dagan30, T. Doeker, S. Kananov, A. Levy31
Raymond and Beverly Sackler Faculty of Exact Sciences, School of Physics, Tel-Aviv
University, Tel-Aviv, Israel e
T. Abe, J.I. Fleck32, M. Inuzuka, T. Ishii, M. Kuze, K. Nagano, M. Nakao, I. Suzuki,K. Tokushuku, K. Umemori, S. Yamada, Y. YamazakiInstitute for Nuclear Study, University of Tokyo, Tokyo, Japan g
R. Hamatsu, T. Hirose, K. Homma, S. Kitamura33, T. Matsushita, K. YamauchiTokyo Metropolitan University, Dept. of Physics, Tokyo, Japan g
R. Cirio, M. Costa, M.I. Ferrero, S. Maselli, V. Monaco, C. Peroni, M.C. Petrucci, R. Sac-chi, A. Solano, A. StaianoUniversita di Torino, Dipartimento di Fisica Sperimentale and INFN, Torino, Italy f
3
M. DardoII Faculty of Sciences, Torino University and INFN - Alessandria, Italy f
D.C. Bailey, M. Brkic, C.-P. Fagerstroem, G.F. Hartner, K.K. Joo, G.M. Levman, J.F. Mar-tin, R.S. Orr, S. Polenz, C.R. Sampson, D. Simmons, R.J. Teuscher32
University of Toronto, Dept. of Physics, Toronto, Ont., Canada a
J.M. Butterworth, C.D. Catterall, T.W. Jones, P.B. Kaziewicz, J.B. Lane, R.L. Saunders,J. Shulman, M.R. SuttonUniversity College London, Physics and Astronomy Dept., London, U.K. o
B. Lu, L.W. MoVirginia Polytechnic Inst. and State University, Physics Dept., Blacksburg, VA, USA q
J. Ciborowski, G. Grzelak34, M. Kasprzak, K. Muchorowski35, R.J. Nowak, J.M. Pawlak,R. Pawlak, T. Tymieniecka, A.K. Wroblewski, J.A. ZakrzewskiWarsaw University, Institute of Experimental Physics, Warsaw, Poland j
M. AdamusInstitute for Nuclear Studies, Warsaw, Poland j
C. Coldewey, Y. Eisenberg30, D. Hochman, U. Karshon30, D. Revel30
Weizmann Institute, Nuclear Physics Dept., Rehovot, Israel d
W.F. Badgett, D. Chapin, R. Cross, S. Dasu, C. Foudas, R.J. Loveless, S. Mattingly,D.D. Reeder, W.H. Smith, A. Vaiciulis, M. WodarczykUniversity of Wisconsin, Dept. of Physics, Madison, WI, USA p
S. Bhadra, W.R. Frisken, M. Khakzad, W.B. SchmidkeYork University, Dept. of Physics, North York, Ont., Canada a
4
1 also at IROE Florence, Italy2 now at Univ. of Salerno and INFN Napoli, Italy3 now at Univ. of Crete, Greece4 supported by Worldlab, Lausanne, Switzerland5 now OPAL6 retired7 also at University of Torino and Alexander von Humboldt Fellow8 now at Dongshin University, Naju, Korea9 also at DESY and Alexander von Humboldt Fellow10 Alfred P. Sloan Foundation Fellow11 supported by an EC fellowship number ERBFMBICT 95017212 visitor from Florida State University13 now at ALCATEL Mobile Communication GmbH, Stuttgart14 now at DESY Computer Center15 supported by European Community Program PRAXIS XXI16 now at DESY-Group FDET17 now at Fermi National Accelerator Laboratory (FNAL), Batavia, IL, USA18 now at Siemens A.G., Munich19 now at NORCOM Infosystems, Hamburg20 now at ATLAS Collaboration, Univ. of Munich21 now at Clinical Operational Research Unit, University College, London22 on leave from MSU, supported by the GIF, contract I-0444-176.07/9523 now a self-employed consultant24 supported by an EC fellowship25 PPARC Post-doctoral Fellow26 now at Conduit Communications Ltd., London, U.K.27 now at Department of Energy, Washington28 now at Lawrence Berkeley Laboratory, Berkeley29 now at Yale University, New Haven, CT30 supported by a MINERVA Fellowship31 partially supported by DESY32 now at CERN33 present address: Tokyo Metropolitan College of Allied Medical Sciences, Tokyo 116,Japan34 supported by the Polish State Committee for Scientific Research, grant No. 2P03B0930835 supported by the Polish State Committee for Scientific Research, grant No. 2P03B09208
5
a supported by the Natural Sciences and Engineering Research Council ofCanada (NSERC)
b supported by the FCAR of Quebec, Canadac supported by the German Federal Ministry for Education and Science,
Research and Technology (BMBF), under contract numbers 057BN19P,057FR19P, 057HH19P, 057HH29P, 057SI75I
d supported by the MINERVA Gesellschaft fur Forschung GmbH, the GermanIsraeli Foundation, and the U.S.-Israel Binational Science Foundation
e supported by the German Israeli Foundation, and by the Israel ScienceFoundation
f supported by the Italian National Institute for Nuclear Physics (INFN)g supported by the Japanese Ministry of Education, Science and Culture (the
Monbusho) and its grants for Scientific Researchh supported by the Korean Ministry of Education and Korea Science and Engi-
neering Foundationi supported by the Netherlands Foundation for Research on Matter (FOM)j supported by the Polish State Committee for Scientific Research, grant
No. 115/E-343/SPUB/P03/120/96k supported by the Polish State Committee for Scientific Research (grant No. 2
P03B 083 08) and Foundation for Polish-German Collaborationl partially supported by the German Federal Ministry for Education and Science,
Research and Technology (BMBF)m supported by the German Federal Ministry for Education and Science, Re-
search and Technology (BMBF), and the Fund of Fundamental Research ofRussian Ministry of Science and Education and by INTAS-Grant No. 93-63
n supported by the Spanish Ministry of Education and Science through fundsprovided by CICYT
o supported by the Particle Physics and Astronomy Research Councilp supported by the US Department of Energyq supported by the US National Science Foundation
6
1 Introduction
Deep–inelastic scattering (DIS) of leptons on nucleons has been an important tool forunderstanding nucleon structure and many elements of the Standard Model, includingboth the electroweak interaction and quantum chromodynamics (QCD). At the HERAcollider, DIS processes are being studied at a center of mass energy
√s = 300GeV and
at Q2 (the negative of the square of the four-momentum transfer) exceeding the squaresof the weak vector boson masses. In this regime, lepton–nucleon scattering allows uniqueand sensitive tests of the Standard Model as well as of certain extensions to it [1].
This paper presents results from e+p running with the ZEUS detector during the years1994 to 1996, at proton and positron beam energies of Ep = 820GeV and Ee = 27.5GeV.With the integrated luminosity of 20.1 pb−1 collected in this period, it has become possibleto study the reaction e+p → e+X in the region where the expected DIS cross section isin the subpicobarn range. This region of high Q2 and x (the Bjorken scaling variable)has never before been explored. The above reaction is understood to be a positron–quark collision with center–of–mass energy
√xs. Initial cross section measurements by
the ZEUS [2] and H1 [3] collaborations are in good agreement with Standard Modelexpectations for Q2 up to about 104GeV2. In this paper, we report on a more sensitivesearch for deviations from Standard Model predictions in the region Q2 > 5000GeV2.
2 Neutral Current Deep–Inelastic Scattering
The reaction studied is:e+ + p → e+ +X (1)
where X represents the final state hadronic system. In the high Q2 regime, the StandardModel neutral current (NC) cross section for (1) depends on well–measured electroweakparameters and on the parton densities in the proton. Though the latter have not yet beenmeasured at high Q2, perturbative Quantum Chromodynamics (pQCD) predicts theirvalues through evolution from high–precision measurements made at lower Q2 values.
The Born cross section [4] for the NC DIS reaction (1) with unpolarized beams is1
d2σ
dx dQ2=
2πα2
xQ4
{
Y+(y)F2(x,Q2)− Y−(y) xF3(x,Q
2)}
, (2)
where α is the electromagnetic coupling. The cross section is given in terms of Q2 and theDIS scaling variables x and y = Q2/sx. In the region of large x and Q2 studied here, theparity–violating xF3 term substantially reduces the e+p cross section, while increasing thecross section for e−p scattering (where the second term has positive sign). The explicity–dependence, which is due to the helicity dependence of electroweak interactions, iscontained in the functions
Y±(y) = 1± (1− y)2 , (3)
1We neglect the contribution to the cross section (2) of the longitudinal structure function, FL, whichwe estimate from pQCD and the parton densities[5] to be less than 1% in the kinematic range understudy.
7
while the dependence on the quark structure of the proton, and on the Z0 propagator isabsorbed in the (positive) structure functions:
(
F2(x,Q2)
xF3(x,Q2)
)
= x∑
q=quarks
(
Cq2(Q
2)[q(x,Q2) + q(x,Q2)]Cq
3(Q2)[q(x,Q2)− q(x,Q2)]
)
(4)
written in terms of the quark densities in the proton (q = u, d, c, s, t, b) and thecorresponding antiquark densities q. For e+p scattering, the Q2–dependent coefficientfunctions, Cq
2 and Cq3 , are given by:
Cq2(Q
2) = e2q −2eqvqveχZ + (v2q + a2q)(v2e + a2e)χ
2Z
Cq3(Q
2) = −2eqaqaeχZ + (2vqaq)(2veae)χ2Z
(5)
with
χZ =1
4 sin2 θw cos2 θw
Q2
Q2 +M2Z
. (6)
In eqs. 5 and 6, MZ is the Z0 mass, eq is the quark charge in units of the positron charge,vq = (T3q−2eq sin
2 θw) and aq = T3q are the vector and axial vector couplings of the quarkto the Z0, ve and ae are the corresponding electron couplings, θw is the weak mixing angle,and T3 is the third component of the weak isospin. All relevant electroweak parametershave been measured to high precision [6].
The QCD–evolved structure functions [7] of equation (4), evaluated at a given x at highQ2, depend on quark and gluon densities in the proton measured at lower values of Q2
and higher values of x. At high x, u quarks give the dominant contribution to the crosssection because they have the largest density [8] and because eu = 2/3. In addition, theantiquark (q) density is small [9].
Uncertainties in the Born-level e+p DIS cross section predictions in this region of high xand Q2 are estimated to be about 6.5% (see Section 8), mainly due to uncertainties inthe evolved quark densities.
It should be noted that an anomalously high cross section for the production of jets withhigh transverse energy in pp collisions, as recently reported by the CDF collaboration[10], can be explained by adjusting the gluon density in the proton [11] (which raisesthe rate of gluon–quark collisions at high x), rather than by adjusting quark densities.This variation of the gluon density, however, has only a small effect on the cross sectionpredictions relevant to this paper (see Section 8).
3 ZEUS Detector and Monte–Carlo Simulation
3.1 Experimental Setup
A description of the ZEUS detector can be found in references [12, 13]. The primarycomponents used in this analysis were the compensating uranium–scintillator calorimeter,the central tracking detector, and the luminosity detector.
8
The calorimeter [14] is divided into three parts, forward (FCAL) covering the polar angle2
interval 2.6◦<θ<37◦, barrel (BCAL: 37◦<θ<129◦) and rear (RCAL: 129◦<θ<176.1◦). Thecalorimeters are subdivided into towers which each subtend solid angles from 0.006 to0.04 steradians. Each tower is longitudinally segmented into an electromagnetic (EMC)section and two hadronic (HAC) sections (one in RCAL). Each HAC section consists ofa single cell, while the EMC section of each tower is further subdivided transversely intofour cells (two in RCAL). In test beam conditions, for particle energies up to 120GeV,
energy resolutions of σE/E=18%/√
E(GeV) for electrons and σE/E=35%/√
E(GeV) forhadrons have been measured. The cell-to-cell variations in the energy calibration areapproximately 2% for the EMC cells and 3% for HAC cells. The FCAL and BCALenergy scales are presently understood to an accuracy of 3%. The time resolution isbelow 1 ns for energy deposits greater than 4.5GeV. The impact point of the scatteredpositron at the calorimeter, determined using pulse height sharing, has a resolution ofabout 1 cm.
In the physics analysis, only those calorimeter cells with energy deposits above thresholdsof 60MeV and 110MeV for EMC and HAC cells respectively were used.
The central tracking chamber (CTD) [15] operates in a 1.43T solenoidal magnetic field.It is a drift chamber consisting of 72 cylindrical layers, organized into 9 superlayers. Amomentum measurement requires a track to pass through at least two superlayers, cor-responding to a polar angle region of 15◦<θ<164◦. The transverse momentum resolutionis σ(pt)/pt = [0.005pt(GeV)] ⊕ 0.016 for full length tracks. For full length tracks withmomenta p > 5 GeV the vertex resolution is 0.1 cm in the transverse plane and 0.4 cmalong Z.
Events were filtered online by a three–level trigger system [13]. The trigger criteria used inthis analysis relied primarily on the energies measured in the calorimeter. The first leveltrigger decision was based on electromagnetic energy and total transverse energy (Et).The second level trigger rejected backgrounds (mostly p–gas interactions) for which thecalorimeter timing was inconsistent with an ep interaction. In addition, the second leveltrigger applied increased Et thresholds and also required a minimum value of E− pZ (seeSection 5), where E and pZ are the summed energy and Z-component of the momentummeasured in the calorimeter. The third level trigger applied more stringent timing cutsas well as increased energy and E − pZ thresholds. In all cases, the requirements wereless stringent than those imposed by the offline event selection.
The luminosity was measured by the rate of high energy photons from the processep → epγ detected in a lead–scintillator calorimeter [16] located at Z = −107m. Theuncertainty associated with luminosity measurements is addressed in section 8.
3.2 Monte Carlo Simulation
NC DIS events were simulated using the meps option of lepto [17] interfaced to her-
acles [18] via django [19] and the MRSA parton distribution set [20]. The event sim-ulation included electroweak radiative corrections, leading order QCD effects and partonshowers. Hadronization was simulated with jetset[21].
2The right-handed ZEUS coordinate system is centered on the nominal interaction point (Z = 0)and defined with the Z axis pointing in the proton beam direction, and the horizontal X axis pointingtowards the center of HERA.
9
Large samples of simulated photoproduction events[22] were used for background studies.Samples of both direct and resolved photoproduction events (including the production ofcc and bb pairs) were generated using both pythia [21] and herwig [23]. Direct andresolved photoproduction of events with prompt photons were simulated with herwig.Production of W and Z bosons was studied using the epvec [24] generator. Finally, theprocesses γγ → e+e− and γγ → τ+τ− were simulated using zlpair [25].
All MC events were passed through a geant [26] based simulation of the ZEUS detectorand trigger, and analyzed with the same reconstruction and offline selection proceduresas the data.
4 Positron Identification and Event Kinematics
A key signature of high Q2 e+p → e+X events is an isolated high transverse momentumpositron. In order to identify and reconstruct this positron, while rejecting events inwhich other final state particles mimic a positron, an algorithm was used which combinescalorimeter and CTD information.
In a first step, the calorimeter cells are clustered by joining each cell to the highest energycell among its adjacent neighbours. All clusters are evaluated as positron candidates. Thecluster energy, Eclu, is the sum of the cell energies belonging to the cluster. The clusterangle, θclu, is set equal to the polar angle obtained by joining the energy-weighted meanposition of the cluster with the event vertex obtained from the tracks measured withthe CTD. For candidates with polar angle3 within the CTD acceptance (θclu > 17.2◦),a matching track is required. A track is considered to match if the distance of closestapproach (DCA) between the extrapolation of the track into the calorimeter and theposition of the cluster center is less than 10 cm, where the r.m. s. resolution on the DCAis 1.8 cm.
In the second step, several quantities, ξi, are calculated for each positron candidate: thefraction of the cluster energy in the HAC sections of the calorimeter, the parametersrelated to lateral energy profiles, and the total energy (Econe) in all calorimeter cellsnot associated with the cluster but lying within an η, φ (pseudorapidity,azimuth) cone ofradius 0.8 centered on the cluster. If a matching track is present, we also evaluate thepolar and azimuthal angle differences between the track and the cluster position, and thequantity 1/Eclu − 1/Ptrk, where Ptrk is the track momentum.
Finally, we transform each ξi into a quality factor Q(ξi). Candidates are accepted aspositrons if the product of the Q(ξi) exceeds a threshold determined from Monte Carlostudies. The efficiency for finding positrons in a neutral current DIS sample with Q2 >5000GeV2 is 91%. In accepted events, the positron energy, E ′
e, is set equal to the clusterenergy, Eclu, and the positron angle, θe, is set equal to θclu. The resolution in θe is typicallybetter than 0.3◦.
For each event with an accepted positron, the following global event quantities were
3We do not consider candidates with θclu > 164◦ (which are also beyond the CTD acceptance limit),since they correspond to Q2 values below the range of this analysis.
10
calculated from the energy deposits in the calorimeter:
pt =
√
√
√
√
(
∑
i
piX
)2
+
(
∑
i
piY
)2
,
E − pZ =∑
i
(
Ei − piZ)
,
Et =∑
i
√
(piX)2 + (piY )
2 , (7)
(pt)had =
√
√
√
√
(
∑
i
′
piX
)2
+
(
∑
i
′
piY
)2
,
(E − pZ)had =∑
i
′(
Ei − piZ)
,
where the sums run over all calorimeter cells with energy deposits above threshold andthe ~p i are the momenta assigned to each calorimeter cell (calculated assuming zero masswith the direction obtained from the cell center and the measured vertex position). Theprimed sums exclude the cells associated with the positron.
To describe the hadronic system, we use the angle, γraw, and energy, Eq, defined as
cos γraw =(pt)
2had − (E − pZ)
2had
(pt)2had + (E − pZ)
2had
and Eq =(pt)hadsin γraw
. (8)
Resolution effects and systematic shifts of γraw have been studied with MC simulations.The reconstructed γraw is systematically higher than the generated value by about 2.7◦.To remove this bias, we compute a corrected value, γ, which depends on γraw and θe. Ther.m. s. resolution of γ is about 2.5◦ for x > 0.55 and Q2 > 5000GeV2.
In the quark–parton model, for a perfect detector, γ and Eq are interpreted as the scat-tering angle and energy of the massless quark q in the reaction eq → eq.
At a given value of s, the kinematic variables (x, y, and Q2) can be reconstructed fromany two of the four measured quantities: E ′
e, θe, Eq, and γ. Different combinations havebeen used by the HERA experiments. At high x and Q2 where the calorimeter energyresolution functions are narrow, the dominant uncertainties in energy measurements aredue to systematic effects such as energy loss in inactive material in front of the calorime-ter, nonuniformities and nonlinearities in the calorimeter response, longitudinal energyleakages, and energy carried away by neutrinos and muons. For the hadronic system, theraw measured energies are typically 15% less than the true energies. For positrons, theraw measured energies are typically 4% less than the true values.
We choose the double–angle method [27] because it is least sensitive to uncertainties inthe energy measurement. In this scheme, the kinematic variables are obtained from θeand γ as follows:
xDA =Ee
Ep
sin γ
(1− cos γ)
sin θe(1− cos θe)
,
yDA =sin θe(1− cos γ)
sin γ + sin θe − sin(γ + θe), (9)
Q2DA
= s xDA yDA .
11
For y > 0.25 and x > 0.45, the resolution in xDA is 9%; it improves to 6% for y > 0.5.The resolution in Q2
DAis typically 5% at large x and y.
For selected events with high x and high Q2 we also present the kinematic variablescalculated from the scattered positron energy E ′
e and angle θe using the equations:
xe =Ee
Ep
E ′e(1 + cos θe)
2Ee − E ′e(1− cos θe)
,
ye = 1− E ′e
2Ee
(1− cos θe) , (10)
Q2e = s xe ye .
We apply a test–beam based correction to E ′e to account for energy loss in inactive material
and nonuniformities of the calorimeter response.
5 Event Selection
Important characteristics of reaction (1) that distinguish it from background processesinclude (i) the presence of an energetic isolated positron, (ii) pt balance, and (iii) E−pZ ≈2Ee = 55GeV. In addition, at large Q2, the transverse energy Et typically exceeds100GeV.
About 106 events were accepted by the trigger requirements described in section 3.1. Theoffline event selection criteria are described below.
• E − pZThe net E − pZ as measured in the calorimeter is required to be in the range40GeV < E − pZ < 70GeV (44GeV < E − pZ < 70GeV) for θe > 17.2◦ (θe <17.2◦). The lower cut rejects backgrounds such as photoproduction or e+p → e+Xevents with a hard initial state photon, for which energy escapes through the rearbeam hole (see below). The 70GeV cut removes a small number of events with amisreconstructed vertex position.
• Longitudinal vertex positionThe event vertex reconstructed from CTD tracks must have a Z position (Zvtx)within 50 cm of the nominal interaction point. The Zvtx distribution of the data isroughly Gaussian with 〈Zvtx〉 = −2 cm. The r.m. s. spread in Zvtx, 12 cm, is largelydue to the length of the proton beam bunches.
• Positron requirementsAn isolated positron candidate with energy E ′
e > 20GeV and Econe < 5GeV mustbe found by the algorithm described in section 4. Additional requirements dependon the polar angle of the positron:
For θe > 17.2◦, where the positron candidates are within the CTD acceptance,a matching track with momentum above 2 GeV is required.
12
For θe < 17.2◦, where the positron either misses the CTD altogether or is onthe edge of the CTD acceptance, the number of fake positron candidates islarge. These have a sharply falling transverse momentum spectrum. To reducethis background, we require positron candidates in this angular range to havetransverse momenta above 30GeV.
To remove Compton scattering events (ep → eγX), we reject any event which hastwo isolated electromagnetic clusters in the calorimeter, each with Eclu > 8GeV andEcone < 2GeV.
• Momentum transferWe require Q2
DAto exceed 5000GeV2.
The overall selection efficiency, estimated using Monte Carlo NC events generated withQ2 > 5000GeV2, is 81%. For the 191 events which pass all cuts, the mean measuredE − pZ is 51.9GeV with an r.m. s. width of 4.2GeV, in good agreement with the MonteCarlo e+p NC simulation which predicts a mean of 51.8GeV and an r.m. s. of 4.0GeV.While no cut was applied to the net transverse momentum (pt), the surviving events havea mean pt of 7.5GeV, again in good agreement with the e+p NC Monte Carlo predictionof 7.1GeV.
6 Data and Expectations at Large x and Q2
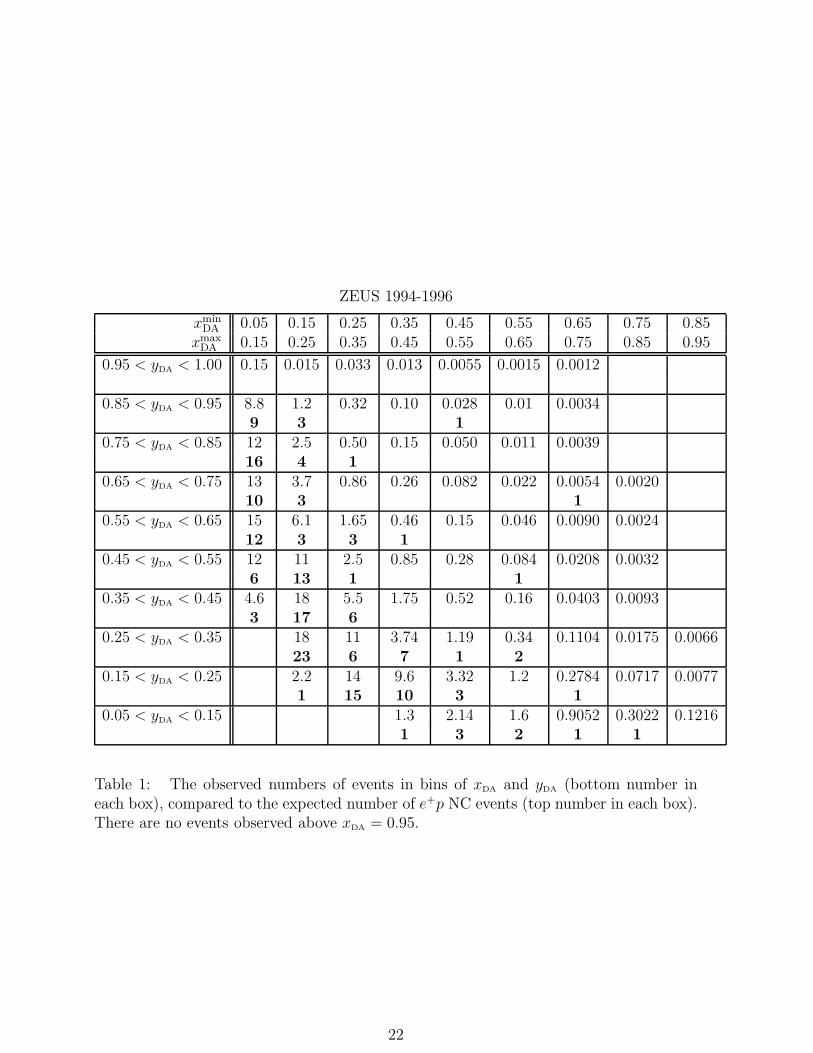
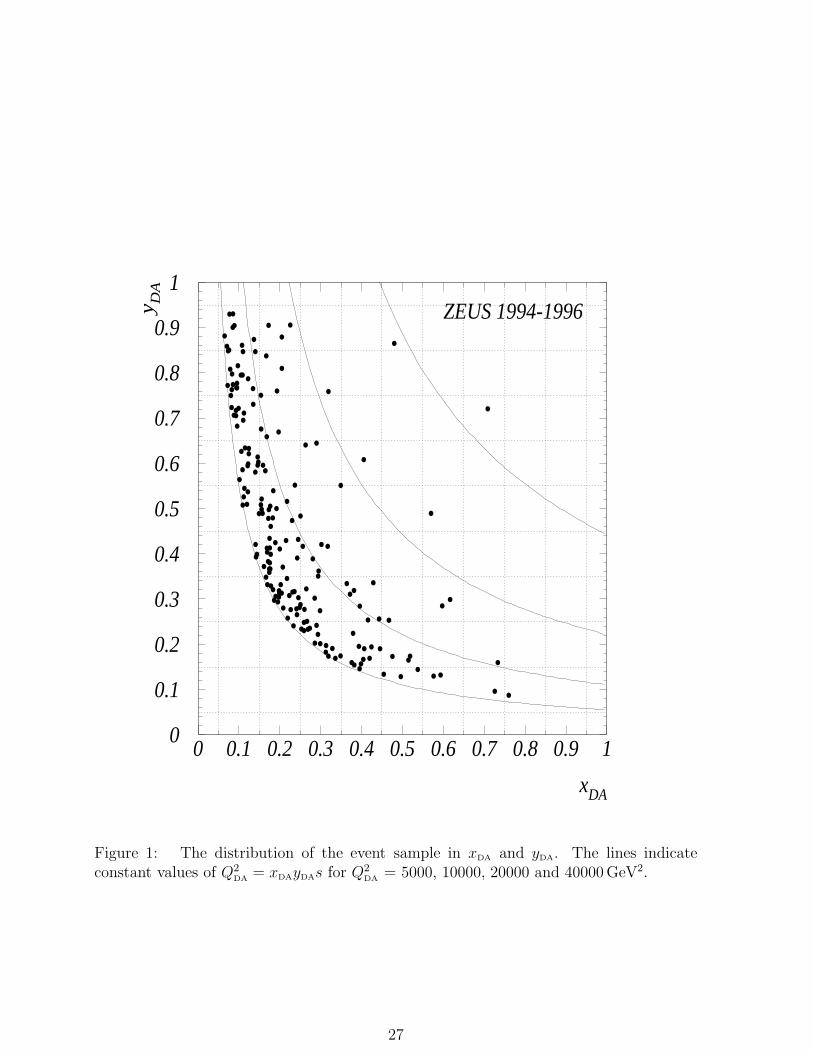
Figure 1 shows the distribution in the (xDA, yDA) plane of the 191 events satisfying theselection criteria. In Table 1, the numbers of observed events are compared with theStandard Model expectations in bins of xDA and yDA. In general, the agreement betweenthe data and the Standard Model expectations is good. However, five events, in four(xDA, yDA) bins occur at high xDA and Q2
DAwhere the expected numbers of events are
small. Four lie in the region xDA > 0.55 and yDA > 0.25, while the fifth has xDA = 0.48and a very high Q2
DA. These five events are selected for more detailed discussion below.
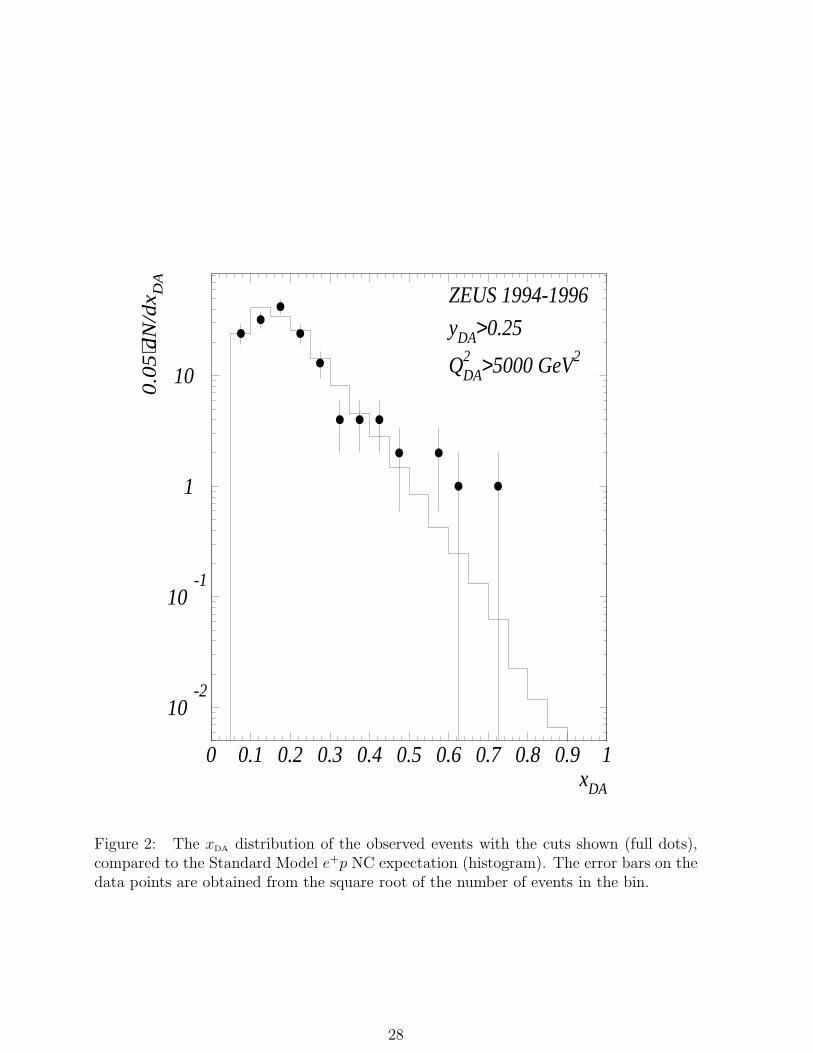
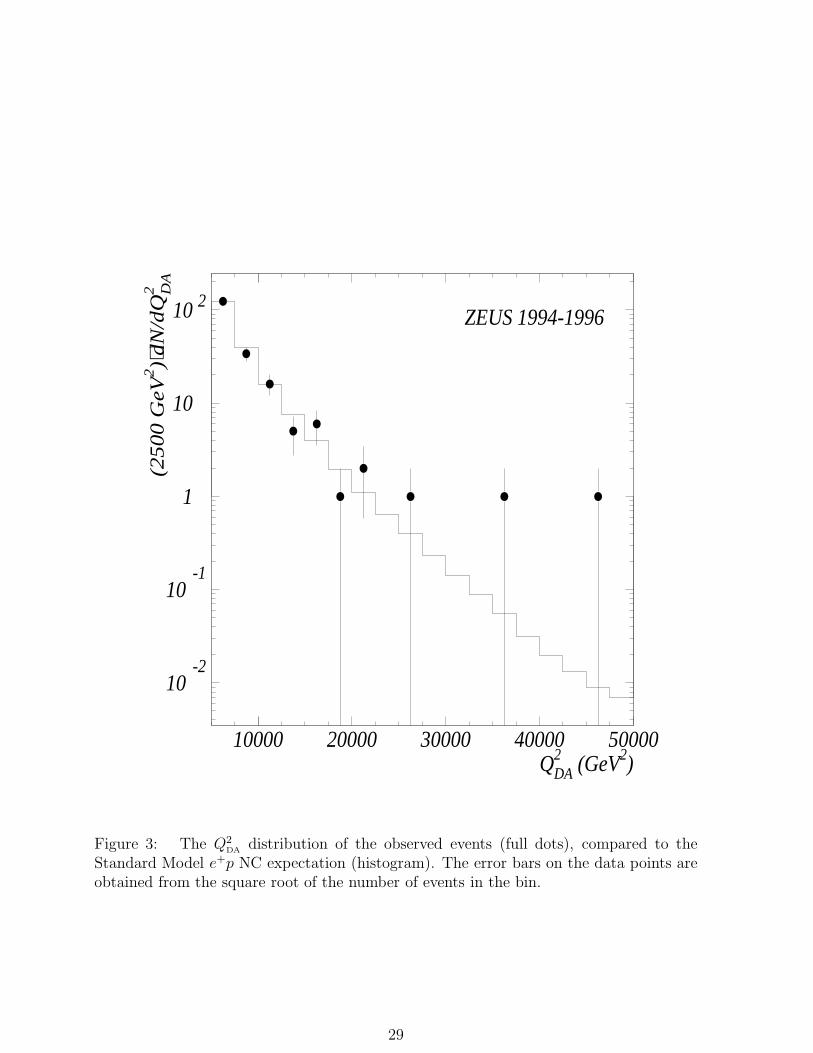
Figures 2 and 3 show the xDA (for yDA > 0.25) and Q2DA
distributions of the final eventsample. In both figures, the e+p NC prediction for the same integrated luminosity issuperimposed as a solid histogram. Again, the agreement with the Standard Model isgood at lower values of xDA and Q2
DA, but an excess is observed at high xDA and at high
Q2DA.
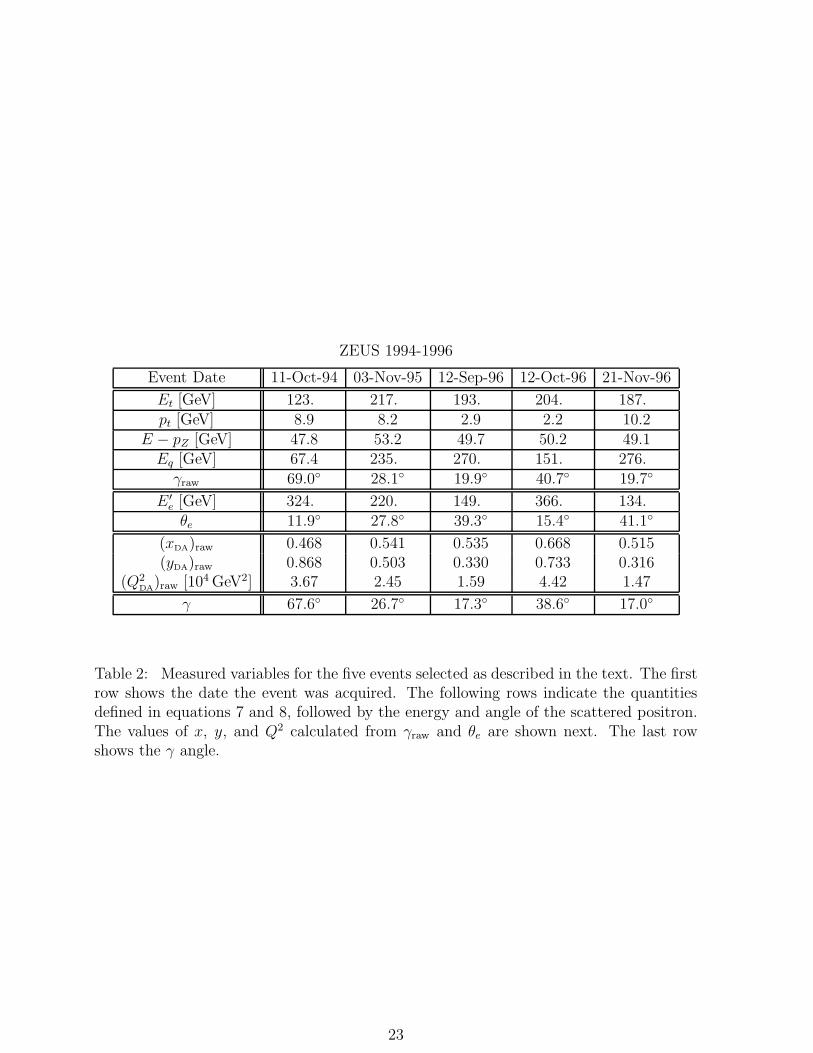
Table 2 shows the kinematic variables, before applying the corrections discussed in section4, associated with the five selected events. Included are the uncorrected values of xDA,yDA, and Q2
DA(calculated using γraw) as well as the corrected value of γ. Table 3 gives
the kinematic variables and their estimated uncertainties obtained using the double–angleand electron methods. The uncertainties have been estimated from the resolutions in γand θe, as well as estimates of the systematic uncertainty in the γ–correction procedurediscussed in Section 4. The quoted r.m. s. errors on the electron variables include theuncertainty in θe, the calorimeter energy resolution, the uncertainty associated with thecalorimeter nonlinearity, and the uncertainty on corrections applied for inactive materialand nonuniformities. Though θe is used in both the DA and electron methods, it makes
13
only a small contribution to each error. Hence the errors on the two measurements areessentially independent.
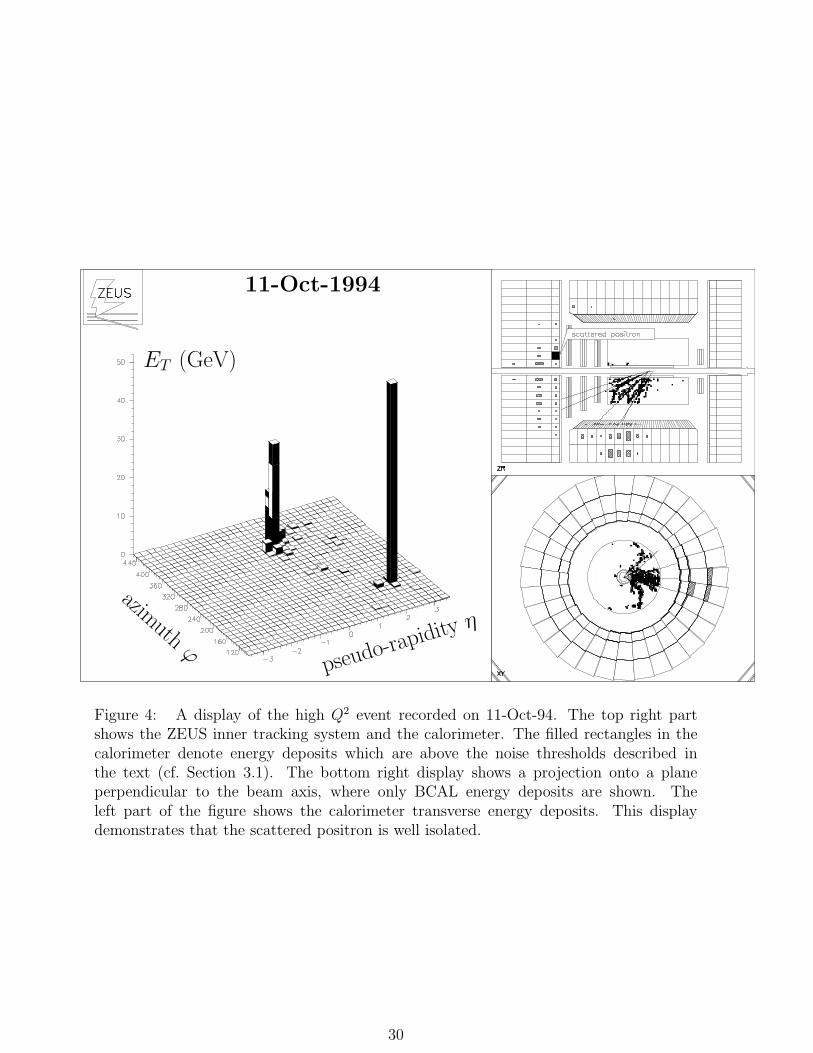
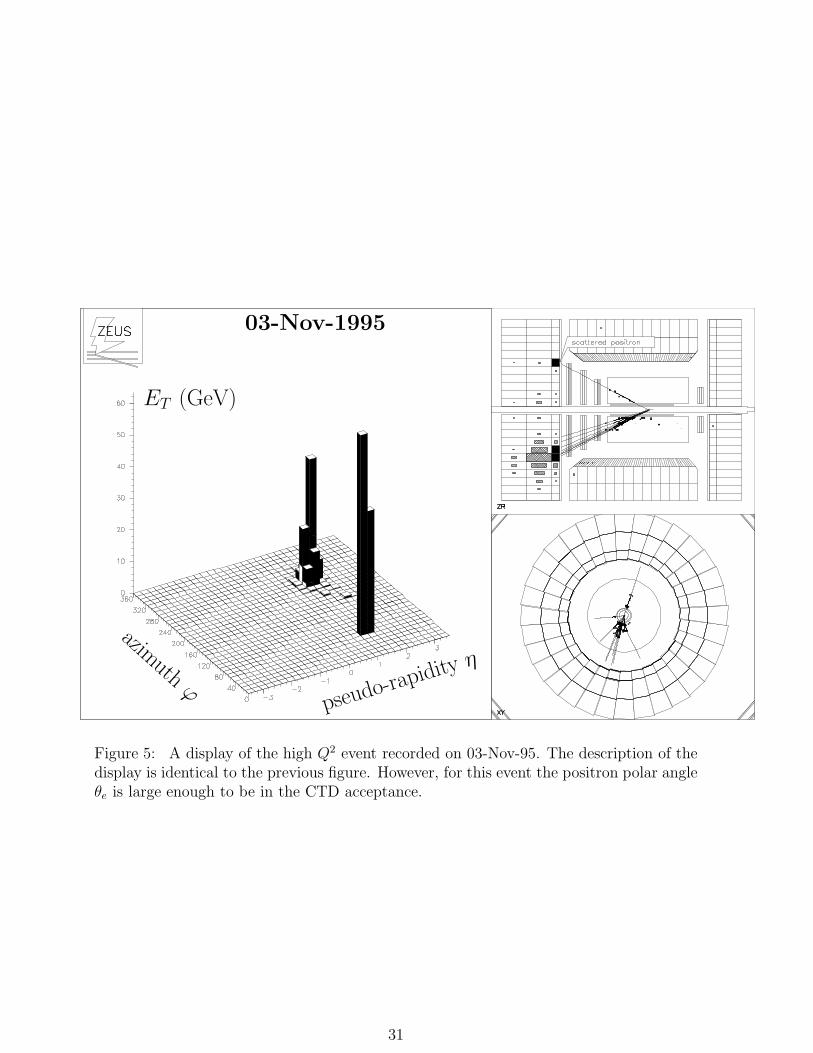
All events listed in Tables 2 and 3, except the first, have a track matching the electromag-netic shower of the scattered positron in the calorimeter. In these events, the positrontrack momentum is consistent with the calorimeter energy within measurement errors4.The first event (11-Oct-94) has a positron candidate at too small an angle to produce anobservable track in the CTD.5 We show event displays of the first two events in Figs. 4and 5.
The five events have clean, well-identified and isolated positrons and jets in the final state.None lie close to any of the selection cuts described in the previous section. For theseevents, the scattering angles and energies of the final state positrons and jets are measuredwith good precision, making it unlikely that resolution smearing has moved any of theseevents from low Q2 to the measured Q2
DA.
Initial state radiation (ISR) from the incoming positron, where the radiated photon es-capes through the rear beam hole is a possible source of uncertainty in the determinationof the event kinematics. Since ISR affects the DA and electron variables differently, it ispossible to estimate the energy Eγ of the radiated photon. For each of the five events,Eγ is consistent with zero within resolution and the measured values of E − pZ limitEγ <∼ 3GeV.
7 Background Estimation
Potential backgrounds to e+p DIS events at large x and y are those processes which yieldan isolated positron or electron of high transverse energy, or a photon or π0 which couldbe misidentified as a scattered positron. The latter event class contributes predominantlyto the background of events in which the positron is very forward (θe <∼ 17.2◦) and no
track information is available for the positron candidate (e.g. the first event in Tables 2and 3). At larger angles, photon conversions in inactive material between the interactionpoint and the CTD can also mimic positron candidates with matching tracks, but thiseffect, which is included in the detector simulation, is much smaller.
In the following, we describe the physical processes studied as possible sources of back-ground. Limits are quoted at 90% confidence level.
• Prompt photon photoproduction (γp → γX) has been studied using herwig. Wegenerated an event sample with the final state photon transverse momentum ex-ceeding 20GeV. The cross section is 1.6 pb, of which 86% (14%) is due to direct(resolved) photoproduction. The observed cross section due to this process in theregion xDA > 0.45 and yDA > 0.25 is 0.28 fb (0.006 events).
• Photoproduction of high Et jets can contribute to the background if a jet is misiden-tified as a positron. Using herwig, we have generated event samples for both direct
4 It should be noted that the positron energies in table 2 are so large that the tracking error does notallow an unambiguous determination of the particle charge.
5There are hits in the innermost layer of the CTD, aligned in azimuth with this positron candidate.However, the hits are too few to qualify as a track according to our standard criteria.
14
and resolved processes which include heavy quark production and decay. In thesesamples, no event satisfies the selection criteria for xDA > 0.45 and yDA > 0.25,providing an upper limit of 1.8 fb (0.04 events).
• QED Compton scattering (ep → eγX) could produce background if one of theelectromagnetic showers is not recognized as such. Monte Carlo studies show thatthis probability is negligible, with an upper limit on the contribution to the observedcross section of 0.2 fb (0.004 events).
• Two photon production of lepton pairs (γγ → ℓℓ) was studied using zlpair. Noevents from the process γγ → e+e− were found after the selections. For γγ → τ+τ−,where one τ decays via τ → eν, the quantity E−pZ as well as the electron transverseenergy are typically much lower than for high Q2 NC events. We obtain the upperlimit on the contribution to the observed cross section of 0.1 fb (0.002 events).
• Leptonic decays of W bosons have been studied using a Monte Carlo sample gen-erated with epvec. The total cross section for production of W± bosons and theirsubsequent decay via W → eνe is approximately 0.1 pb. The final state contains a(anti)neutrino with high transverse momentum (of order 40GeV), which typicallyresults in large missing E − pZ (as well as pt). We estimate the accepted crosssection for this process to be less than 0.5 fb (0.01 events). Decays of the neutralboson, Z0 → e+e−, are rejected by the cut on two electromagnetic clusters and areexpected to contribute a negligible background.
The estimated cross sections from these background sources are listed in Table 4 alongwith the e+p NC cross section. The backgrounds are much smaller than the DIS signalin the region of interest, and are neglected.
8 Uncertainties of the Standard Model Predictions
The predicted numbers of e+p NC DIS events depend on (i) the measured luminosity, (ii)the electroweak parameters, (iii) electroweak radiative corrections, mainly due to initialstate radiation (ISR), (iv) the quark densities in the relevant region of x and Q2 and (v)the Monte Carlo simulation of the detector. We now discuss the precision to which thesequantities are known and describe the studies performed to determine the uncertaintiesof the predictions.
• Luminosity measurementThe luminosity is measured to a precision of about 1.5 % using the ZEUS luminositymonitor. The recent 1996 running period has a larger uncertainty due to effects frombeam satellite bunches. Also, the offline calibration of the luminosity detector isnot yet finalized. Including these uncertainties from recent data, the uncertainty forthe full data sample is 2.3%.
• Electroweak parametersThe relevant electroweak parameters have been measured to high accuracy [6] and
15
contribute a small uncertainty in the predicted cross section over the HERA kine-matic range [28]. The heracles program calculates NC DIS cross sections to firstorder using input values for the Fermi constant Gµ, MZ , the top mass mt, and theHiggs mass. Varying MZ = 91.187±0.007GeV and mt = 180±12GeV within theirexperimental errors [6] changes the predicted cross section in the kinematic rangereported in this paper by only 0.25%.
• Radiative correctionsThe program hector [29], which includes the effects of second order QED radiativecorrections was used to check the cross sections computed using heracles. Thedifferences were found to be about 1.5% for the integrated cross sections in theregion xDA > 0.5 and yDA > 0.25.
The luminosity monitor records data for all triggered events, and so measures di-rectly, with an acceptance of about 30%, the ISR spectrum for accepted events. Theexperimental data are in quantitative agreement with the ISR spectrum calculatedfor the accepted sample.
Corrections due to initial state radiation convoluted with the experimental resolu-tion, based on studies [30] made for lower values of x, produce uncertainties of lessthan 2% in the accepted cross sections. This number is used as the estimate of theuncertainty due to radiative corrections.
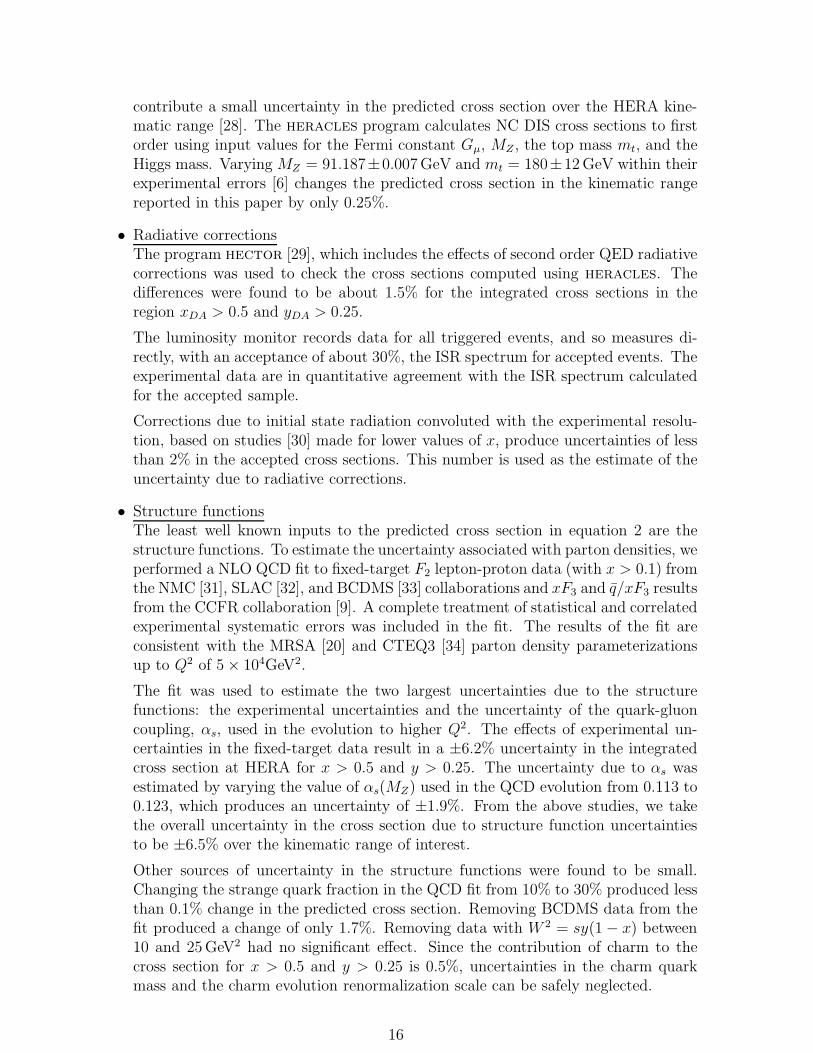
• Structure functionsThe least well known inputs to the predicted cross section in equation 2 are thestructure functions. To estimate the uncertainty associated with parton densities, weperformed a NLO QCD fit to fixed-target F2 lepton-proton data (with x > 0.1) fromthe NMC [31], SLAC [32], and BCDMS [33] collaborations and xF3 and q/xF3 resultsfrom the CCFR collaboration [9]. A complete treatment of statistical and correlatedexperimental systematic errors was included in the fit. The results of the fit areconsistent with the MRSA [20] and CTEQ3 [34] parton density parameterizationsup to Q2 of 5× 10⁴GeV2.
The fit was used to estimate the two largest uncertainties due to the structurefunctions: the experimental uncertainties and the uncertainty of the quark-gluoncoupling, αs, used in the evolution to higher Q2. The effects of experimental un-certainties in the fixed-target data result in a ±6.2% uncertainty in the integratedcross section at HERA for x > 0.5 and y > 0.25. The uncertainty due to αs wasestimated by varying the value of αs(MZ) used in the QCD evolution from 0.113 to0.123, which produces an uncertainty of ±1.9%. From the above studies, we takethe overall uncertainty in the cross section due to structure function uncertaintiesto be ±6.5% over the kinematic range of interest.
Other sources of uncertainty in the structure functions were found to be small.Changing the strange quark fraction in the QCD fit from 10% to 30% produced lessthan 0.1% change in the predicted cross section. Removing BCDMS data from thefit produced a change of only 1.7%. Removing data with W 2 = sy(1− x) between10 and 25GeV2 had no significant effect. Since the contribution of charm to thecross section for x > 0.5 and y > 0.25 is 0.5%, uncertainties in the charm quarkmass and the charm evolution renormalization scale can be safely neglected.
16
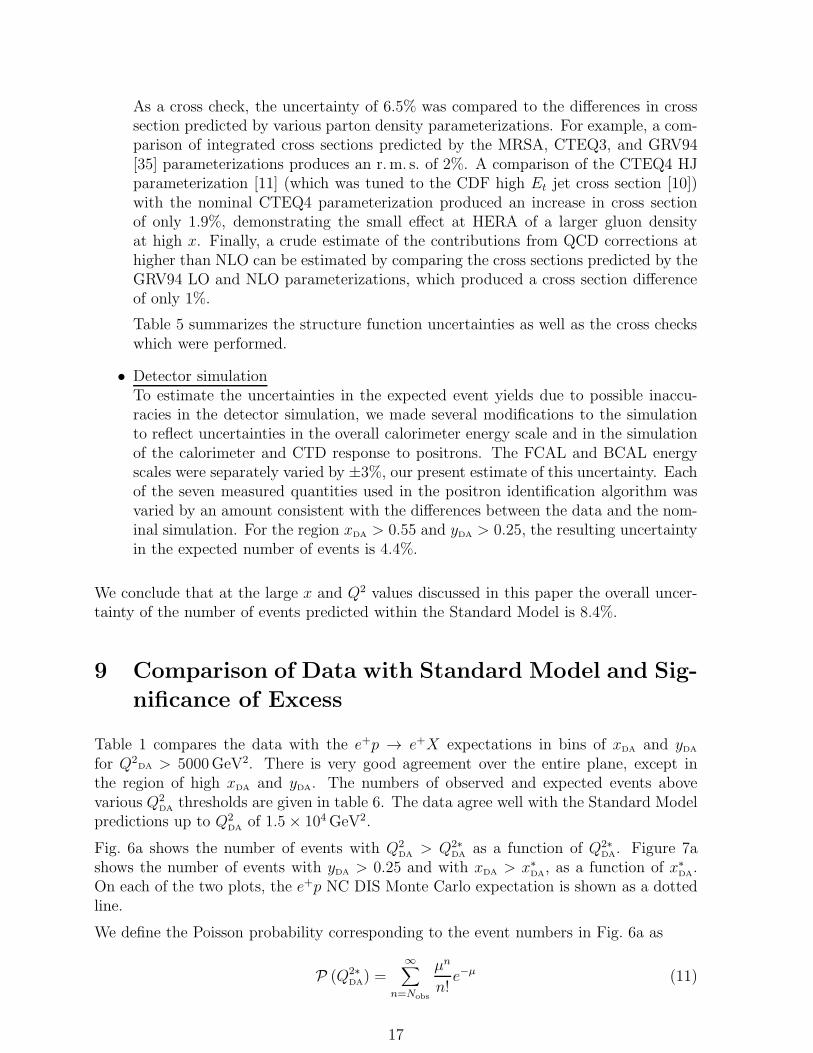
As a cross check, the uncertainty of 6.5% was compared to the differences in crosssection predicted by various parton density parameterizations. For example, a com-parison of integrated cross sections predicted by the MRSA, CTEQ3, and GRV94[35] parameterizations produces an r.m. s. of 2%. A comparison of the CTEQ4 HJparameterization [11] (which was tuned to the CDF high Et jet cross section [10])with the nominal CTEQ4 parameterization produced an increase in cross sectionof only 1.9%, demonstrating the small effect at HERA of a larger gluon densityat high x. Finally, a crude estimate of the contributions from QCD corrections athigher than NLO can be estimated by comparing the cross sections predicted by theGRV94 LO and NLO parameterizations, which produced a cross section differenceof only 1%.
Table 5 summarizes the structure function uncertainties as well as the cross checkswhich were performed.
• Detector simulationTo estimate the uncertainties in the expected event yields due to possible inaccu-racies in the detector simulation, we made several modifications to the simulationto reflect uncertainties in the overall calorimeter energy scale and in the simulationof the calorimeter and CTD response to positrons. The FCAL and BCAL energyscales were separately varied by ±3%, our present estimate of this uncertainty. Eachof the seven measured quantities used in the positron identification algorithm wasvaried by an amount consistent with the differences between the data and the nom-inal simulation. For the region xDA > 0.55 and yDA > 0.25, the resulting uncertaintyin the expected number of events is 4.4%.
We conclude that at the large x and Q2 values discussed in this paper the overall uncer-tainty of the number of events predicted within the Standard Model is 8.4%.
9 Comparison of Data with Standard Model and Sig-
nificance of Excess
Table 1 compares the data with the e+p → e+X expectations in bins of xDA and yDA
for Q2DA > 5000GeV2. There is very good agreement over the entire plane, except in
the region of high xDA and yDA. The numbers of observed and expected events abovevarious Q2
DAthresholds are given in table 6. The data agree well with the Standard Model
predictions up to Q2DA
of 1.5× 10⁴GeV2.
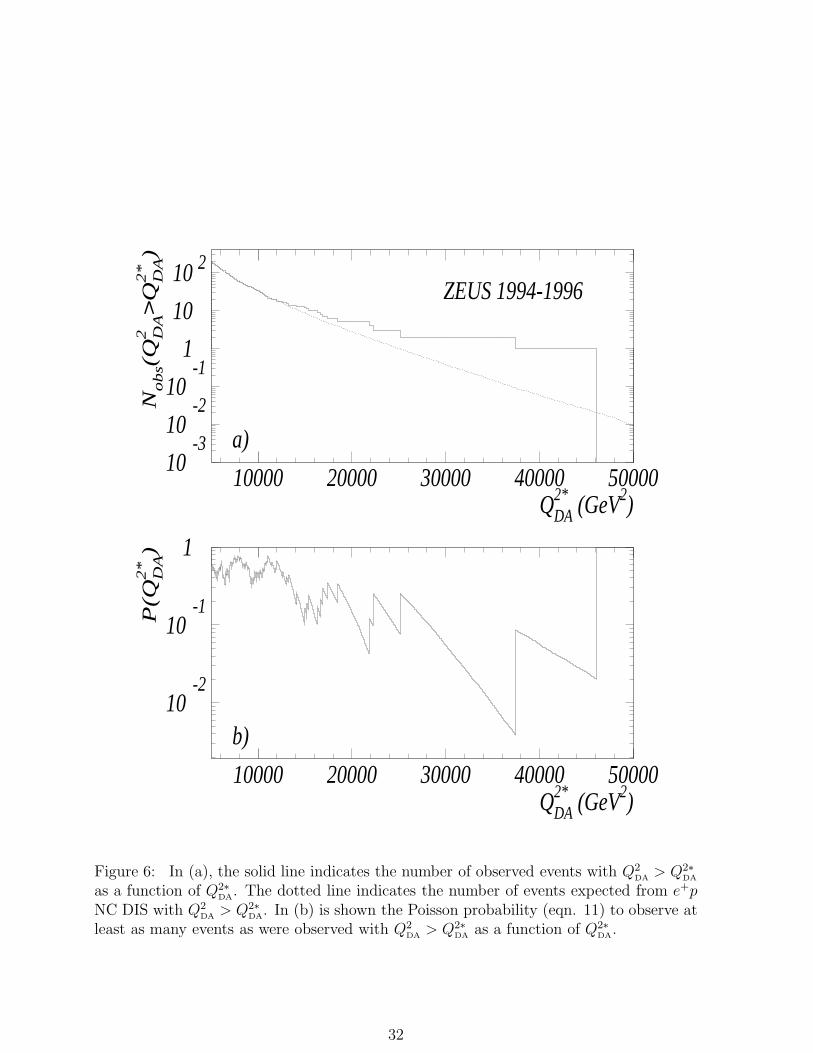
Fig. 6a shows the number of events with Q2DA
> Q2∗DA
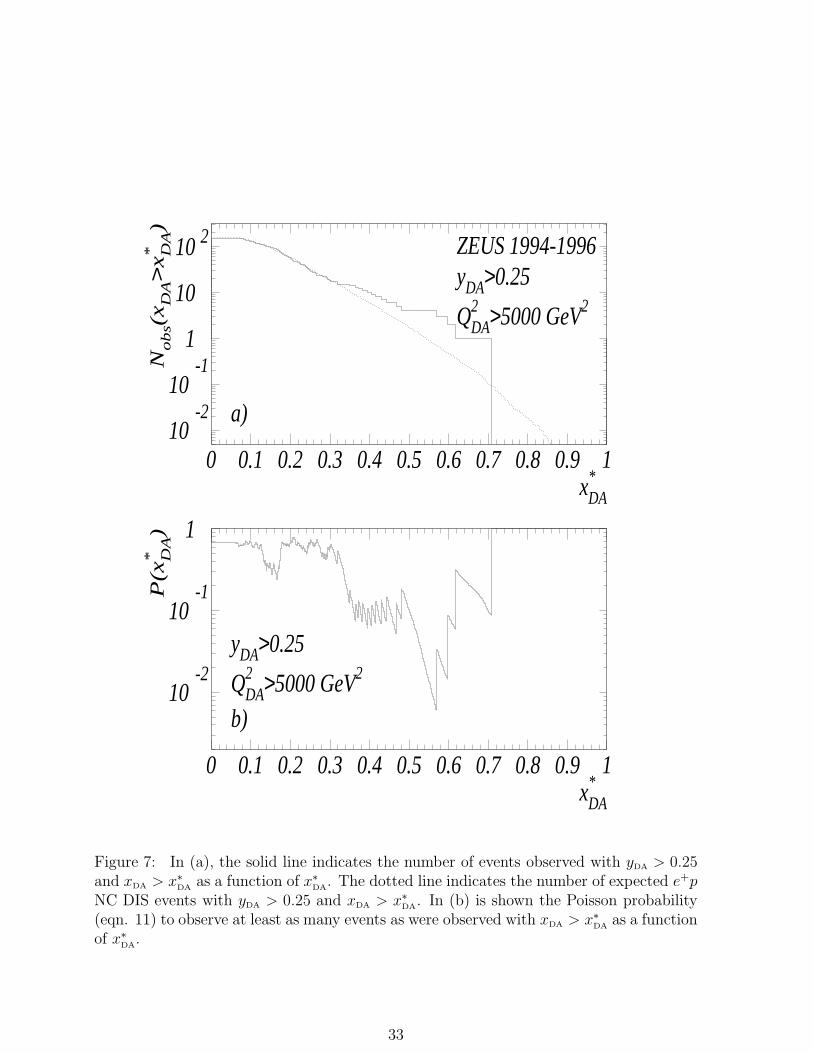
as a function of Q2∗DA. Figure 7a
shows the number of events with yDA > 0.25 and with xDA > x∗DA, as a function of x∗
DA.
On each of the two plots, the e+p NC DIS Monte Carlo expectation is shown as a dottedline.
We define the Poisson probability corresponding to the event numbers in Fig. 6a as
P (Q2∗DA) =
∞∑
n=Nobs
µn
n!e−µ (11)
17
where Nobs is the number of observed events with Q2DA
> Q2∗DA, and µ is the number
of events expected from NC DIS in the same region. In Fig. 6b P(Q2∗DA) is shown as a
function of Q2∗DA. The minimum probability of P(Q2∗
DA) = 0.39% (corresponding to 2.7
Gaussian standard deviations) occurs at Q2DA
= 3.75 × 10⁴GeV2 where two events areobserved while 0.091± 0.010 are expected. If the expected number of events is increasedby its error, P(Q2∗
DA) increases to 0.47%.
We have performed a similar analysis of the xDA spectrum in the region yDA > 0.25. Theprobability P(x∗
DA) is shown as a function of x∗
DAin Fig. 7b. Here the minimum value
P(x∗DA) = 0.60% (corresponding to 2.5 Gaussian standard deviations) occurs at x∗
DA= 0.57
where four events are observed and 0.71 ± 0.06 are expected. If the expected number ofevents is increased by its error, P(x∗
DA) increases to 0.79%. The corresponding results for
different yDA cuts appear in Table 7.
To gauge the significance of these probabilities, one must consider that it is possibleto observe a statistical fluctuation above any Q2∗
DAor x∗
DAwithin the region studied.
We generated a large ensemble of simulated experiments according to Standard Modelassumptions, each with a luminosity of 20.1 pb−1 and asked how often an experimentwould have a probability P(Q2∗
DA) < 0.39% for any Q2∗
DA. The resulting probability to
find such a fluctuation was 6.0%. Similarly, we determined that the probability for anexperiment to have P (x∗
DA) < 0.60% in the region yDA > 0.25 for any xDA was 7.2%. The
same analysis was applied for other yDA cuts and the results appear in Table 7.
Finally, we have performed a statistical analysis which computes a probability for the two–dimensional distribution of the events in the (xDA, yDA) plane (with Q2
DA> 5000GeV2).
Here the data from each simulated experiment were binned as in Table 1. Over a givenregion R of the (xDA, yDA) plane, which is defined as a subset of the bins shown in Table 1,we compute the likelihood for a given experiment as
LR =∏
i∈R
e−µiµNi
i
Ni!,
where Ni is the number of events observed and µi is the number of events expected in bini. For region R, we denote by Lobs
R the value of LR obtained from the data.
Using the ensemble of simulated experiments, we determined the probability that LR <Lobs
R for several choices of the region R. If R is the entire (xDA, yDA) plane, the probabilitythat LR < Lobs
R is 7.8%. If R consists of the entire (xDA, yDA) plane, except for xDA > 0.55and yDA > 0.25, the probability that LR < Lobs
R is 50.2%, indicating that the data are ingood agreement with the Standard Model in this region. In contrast, the probability thatLR < Lobs
R in the region R defined by xDA > 0.55 and yDA > 0.25 is 0.72%.
10 Conclusions
Using the ZEUS detector at HERA, we have studied the reaction e+p → e+X for Q2 >5000GeV2 with a 20.1 pb−1 data sample collected during the years 1994 to 1996.
For Q2 below 15000GeV2, the data are in good agreement with Standard Model expec-tations. For Q2 > 35000GeV2, two events are observed while 0.145 ± 0.013 events are
18
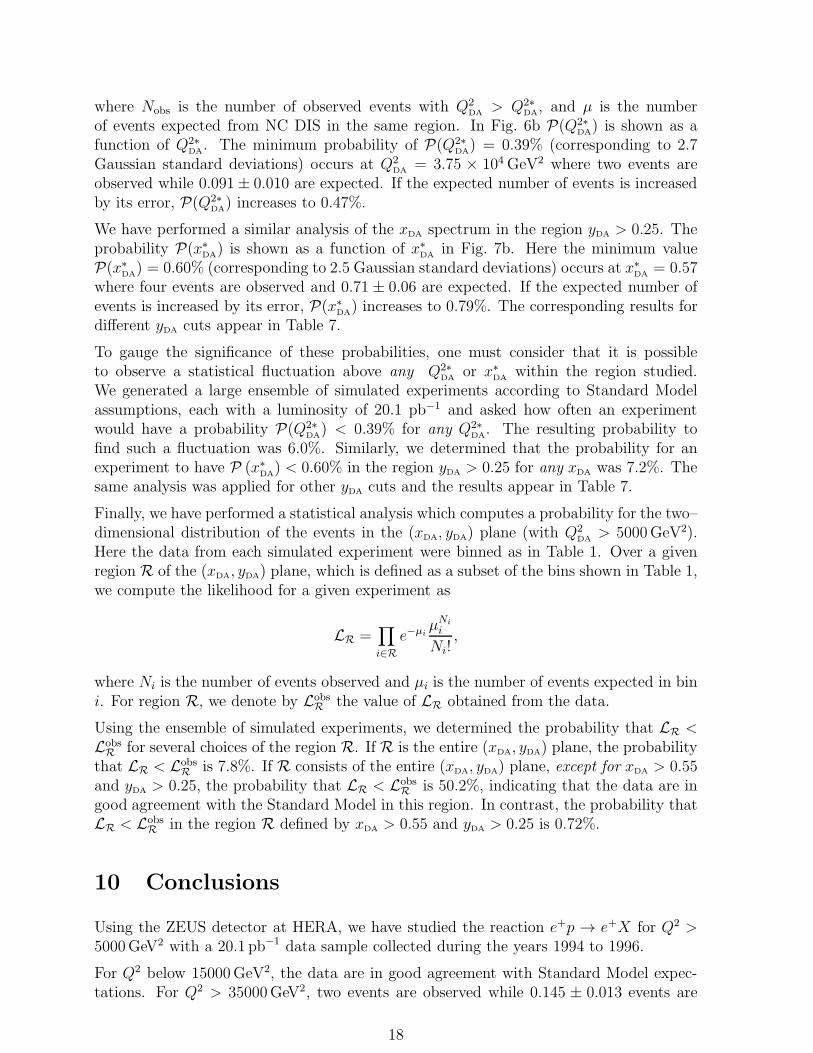
expected. A statistical analysis of a large ensemble of simulated Standard Model experi-ments indicates that with probability 6.0%, an excess at least as unlikely as that observedwould occur above some Q2 cut.
For x > 0.55 and y > 0.25, four events are observed where 0.91±0.08 events are expected.A statistical analysis which assigns a probability to the two-dimensional distribution ofthe events in x and y yields a probability of 0.72% for the region x > 0.55 and y > 0.25and a probability of 7.8% for the entire Q2 > 5000GeV2 data sample.
The observed excess above Standard Model expectations is particularly interesting be-cause it occurs in a previously unexplored kinematic region.
Acknowledgements
We appreciate the contributions to the construction and maintenance of the ZEUS de-tector by many people who are not listed as authors. We thank the DESY computingstaff for providing the data analysis environment. The HERA machine group is especiallyacknowledged for the outstanding operation of the collider. Finally, we thank the DESYdirectorate for strong support and encouragement.
19
References
[1] Future Physics at HERA, ed. G.Ingelman, A.De Roeck and R.Klanner, (DESY, Ham-burg 1996), and references therein;R.Cashmore et al., Phys. Reports 122 (1985) 275.
[2] ZEUS Collab., M.Derrick et al., Phys. Rev. Lett. 75 (1995) 1006.
[3] H1 Collab., S.Aid et al., Phys. Lett. B379 (1996) 319.
[4] E.Derman, Phys. Rev. D7 (1973) 2755;G.Ingelman and R.Ruckl, Phys. Lett. B201 (1988) 369.
[5] G.Altarelli and G.Martinelli, Phys. Lett. B76 (1978) 89.
[6] Particle Data Group, R.M. Barnett et al., Phys. Rev. D54 (1996) 1.
[7] H.Plothow–Besch, PDFLIB User’s Manual–Version 7.07, W5051 PDFLIB,1996.12.09, CERN–PPE, and references therein;Int. J. Mod. Phys. A10 (1995) 2901.
[8] NMC Collab., M.Arneodo et al., Phys. Lett. B309 (1993) 222, and references therein.
[9] CCFR Collab., P.Z.Quintas et al., Phys. Rev. Lett. 71 (1993) 1307.
[10] CDF Collab., F.Abe et al., Phys. Rev. Lett. 77 (1996) 438;Phys. Rev. Lett. 77 (1996) 5336;D0 Collab., S.Abachi et al., FERMILAB Conf. 96/280-E, Paper submitted to theXXVIII International Conference on High Energy Physics, Warsaw.
[11] J.Huston et al., Phys. Rev. Lett 77(1996)444.
[12] ZEUS Collab., M.Derrick et al., Phys. Lett. B293 (1992) 465;ZEUS Collab., M.Derrick et al., Z. Phys. C63 (1994) 391.
[13] ZEUS Collab., The ZEUS Detector, Status Report 1993, DESY 1993.
[14] M.Derrick et al., Nucl. Inst. Meth. A309 (1991) 77;A.Andresen et al., Nucl. Inst. Meth. A309 (1991) 101;A.Bernstein et al., Nucl. Inst. Meth. A336 (1993) 23.
[15] N.Harnew et al., Nucl. Inst. Meth. A279 (1989) 290;B.Foster et al., Nucl. Phys. B (Proc. Suppl.) 32 (1993) 181;B.Foster et al., Nucl. Inst. Meth. A338 (1994) 254.
[16] J.Andruszkow et al., DESY 92–066 (1992).
[17] lepto 6.5 with the matrix element plus parton shower option: G.Ingelman, inPhysics at HERA, ed. W.Buchmuller and G.Ingelman (DESY, Hamburg 1991), vol. 3,1366.
20
[18] heracles 4.5.2: A.Kwiatkowski, H.Spiesberger, and H.–J.Mohring, Physics atHERA, ibid., vol. 3, 1294;A. Kwiatkowski, H. Spiesberger, and H.-J. Mohring, Z. Phys. C50 (1991) 165.
[19] django 1: G.Schuler and H.Spiesberger, Physics at HERA, ibid., vol. 3, 1419.
[20] MRS: A.D.Martin, W.J. Stirling, and R.G. Roberts, Phys. Rev. D50 (1994) 6734;A.D. Martin, W.J. Stirling, and R.G. Roberts, Int. J. Mod. Phys. A10 (1995) 2885.
[21] pythia 5.7: T.Sjostrand, Comp. Phys. Comm. 82 (1994) 74.
[22] ZEUS Collab., M.Derrick et al., Phys. Lett. B322 (1994) 287.
[23] herwig 5.2: G.Marchesini et al., Comp. Phys. Comm. 67 (1992) 465.
[24] epvec: U.Baur, J.A.M.Vermaseren, and D.Zeppenfeld, Nucl.Phys. B375 (1992) 3.
[25] zlpair: A generator based on J.A.M. Vermaseren, Nucl. Phys. B229 (1983) 347.
[26] geant 3.13: R. Brun et al., CERN DD/EE–84–1 (1987).
[27] S.Bentvelsen,J.Engelen, and P.Kooijman, Physics at HERA, ibid., vol. 1, 23.
[28] W.Hollik et al., Physics at HERA, ibid., vol. 2, 923.
[29] hector: A. Arbuzov et al., DESY 95-185 (1995).
[30] ZEUS Collab., M.Derrick et al., Z. Phys. C72 (1996) 399.
[31] NMC Collab., M.Arneodo et al., hep-ph/9610231, October 1996 (subm. toNucl. Phys).
[32] L.W.Whitlow et al., Phys. Lett. B282 (1992) 475.
[33] BCDMS Collab., A.C.Benvenuti et al., Phys. Lett. B223 (1989) 485;Phys. Lett. B237 (1990) 592.
[34] CTEQ: H.L. Lai et al. Phys. Rev. D51 (1995) 4763.
[35] GRV: M. Gluck, E. Reya, and A. Vogt,Z. Phys. C67 (1995) 433.
21
ZEUS 1994-1996
xminDA 0.05 0.15 0.25 0.35 0.45 0.55 0.65 0.75 0.85
xmaxDA 0.15 0.25 0.35 0.45 0.55 0.65 0.75 0.85 0.95
0.95 < yDA < 1.00 0.15 0.015 0.033 0.013 0.0055 0.0015 0.0012
0.85 < yDA < 0.95 8.8 1.2 0.32 0.10 0.028 0.01 0.00349 3 1
0.75 < yDA < 0.85 12 2.5 0.50 0.15 0.050 0.011 0.003916 4 1
0.65 < yDA < 0.75 13 3.7 0.86 0.26 0.082 0.022 0.0054 0.002010 3 1
0.55 < yDA < 0.65 15 6.1 1.65 0.46 0.15 0.046 0.0090 0.002412 3 3 1
0.45 < yDA < 0.55 12 11 2.5 0.85 0.28 0.084 0.0208 0.00326 13 1 1
0.35 < yDA < 0.45 4.6 18 5.5 1.75 0.52 0.16 0.0403 0.00933 17 6
0.25 < yDA < 0.35 18 11 3.74 1.19 0.34 0.1104 0.0175 0.006623 6 7 1 2
0.15 < yDA < 0.25 2.2 14 9.6 3.32 1.2 0.2784 0.0717 0.00771 15 10 3 1
0.05 < yDA < 0.15 1.3 2.14 1.6 0.9052 0.3022 0.12161 3 2 1 1
Table 1: The observed numbers of events in bins of xDA and yDA (bottom number ineach box), compared to the expected number of e+p NC events (top number in each box).There are no events observed above xDA = 0.95.
22
ZEUS 1994-1996
Event Date 11-Oct-94 03-Nov-95 12-Sep-96 12-Oct-96 21-Nov-96
Et [GeV] 123. 217. 193. 204. 187.pt [GeV] 8.9 8.2 2.9 2.2 10.2
E − pZ [GeV] 47.8 53.2 49.7 50.2 49.1Eq [GeV] 67.4 235. 270. 151. 276.
γraw 69.0◦ 28.1◦ 19.9◦ 40.7◦ 19.7◦
E ′e [GeV] 324. 220. 149. 366. 134.θe 11.9◦ 27.8◦ 39.3◦ 15.4◦ 41.1◦
(xDA)raw 0.468 0.541 0.535 0.668 0.515(yDA)raw 0.868 0.503 0.330 0.733 0.316
(Q2DA)raw [104GeV2] 3.67 2.45 1.59 4.42 1.47
γ 67.6◦ 26.7◦ 17.3◦ 38.6◦ 17.0◦
Table 2: Measured variables for the five events selected as described in the text. The firstrow shows the date the event was acquired. The following rows indicate the quantitiesdefined in equations 7 and 8, followed by the energy and angle of the scattered positron.The values of x, y, and Q2 calculated from γraw and θe are shown next. The last rowshows the γ angle.
23
ZEUS 1994-1996
Event Date 11-Oct-94 03-Nov-95 12-Sep-96 12-Oct-96 21-Nov-96
xDA 0.480 0.570 0.617 0.709 0.597δxDA 0.035 0.029 0.054 0.034 0.053yDA 0.865 0.490 0.299 0.721 0.285δyDA 0.008 0.010 0.017 0.008 0.017
Q2DA
[104GeV2] 3.75 2.52 1.66 4.61 1.54δQ2
DA[104GeV2] 0.26 0.07 0.05 0.16 0.04
xe 0.525 0.536 0.562 0.605 0.443δxe 0.048 0.048 0.102 0.060 0.063ye 0.854 0.505 0.319 0.752 0.350δye 0.018 0.024 0.039 0.021 0.032
Q2e [10
4GeV2] 4.05 2.44 1.62 4.10 1.40δQ2
e [104GeV2] 0.31 0.11 0.09 0.30 0.07
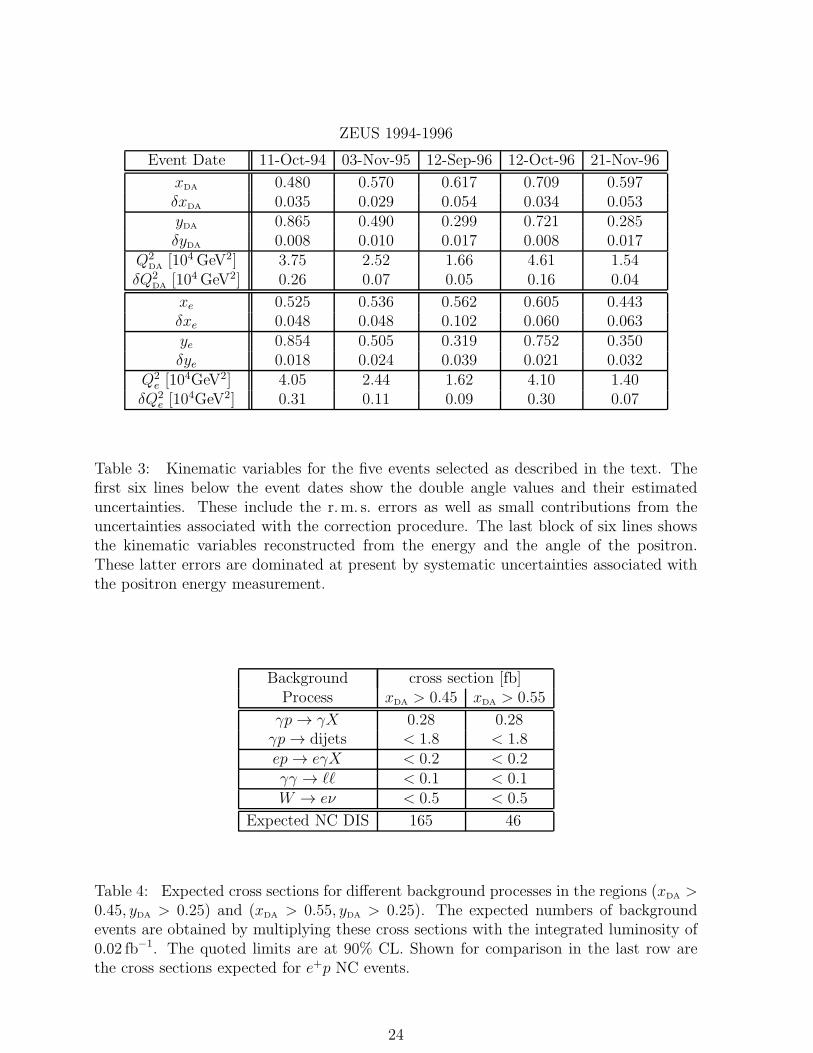
Table 3: Kinematic variables for the five events selected as described in the text. Thefirst six lines below the event dates show the double angle values and their estimateduncertainties. These include the r.m. s. errors as well as small contributions from theuncertainties associated with the correction procedure. The last block of six lines showsthe kinematic variables reconstructed from the energy and the angle of the positron.These latter errors are dominated at present by systematic uncertainties associated withthe positron energy measurement.
Background cross section [fb]Process xDA > 0.45 xDA > 0.55
γp → γX 0.28 0.28γp → dijets < 1.8 < 1.8ep → eγX < 0.2 < 0.2γγ → ℓℓ < 0.1 < 0.1W → eν < 0.5 < 0.5
Expected NC DIS 165 46
Table 4: Expected cross sections for different background processes in the regions (xDA >0.45, yDA > 0.25) and (xDA > 0.55, yDA > 0.25). The expected numbers of backgroundevents are obtained by multiplying these cross sections with the integrated luminosity of0.02 fb−1. The quoted limits are at 90% CL. Shown for comparison in the last row arethe cross sections expected for e+p NC events.
24
Systematic errors
fixed-target experimental uncertainties ±0.062
0.113 < αs < 0.123 ±0.019
overall assumed r.m. s. uncertainty ±0.065
Cross checks
10% < strange fraction < 30% < 0.001
uncertainties in charm evolution < 0.005
GRV94, MRSA, CTEQ3 comparison ±0.020
GRV94 NLO versus LO +0.010
High-x gluon (CDF inspired, CTEQ4 HJ) +0.019
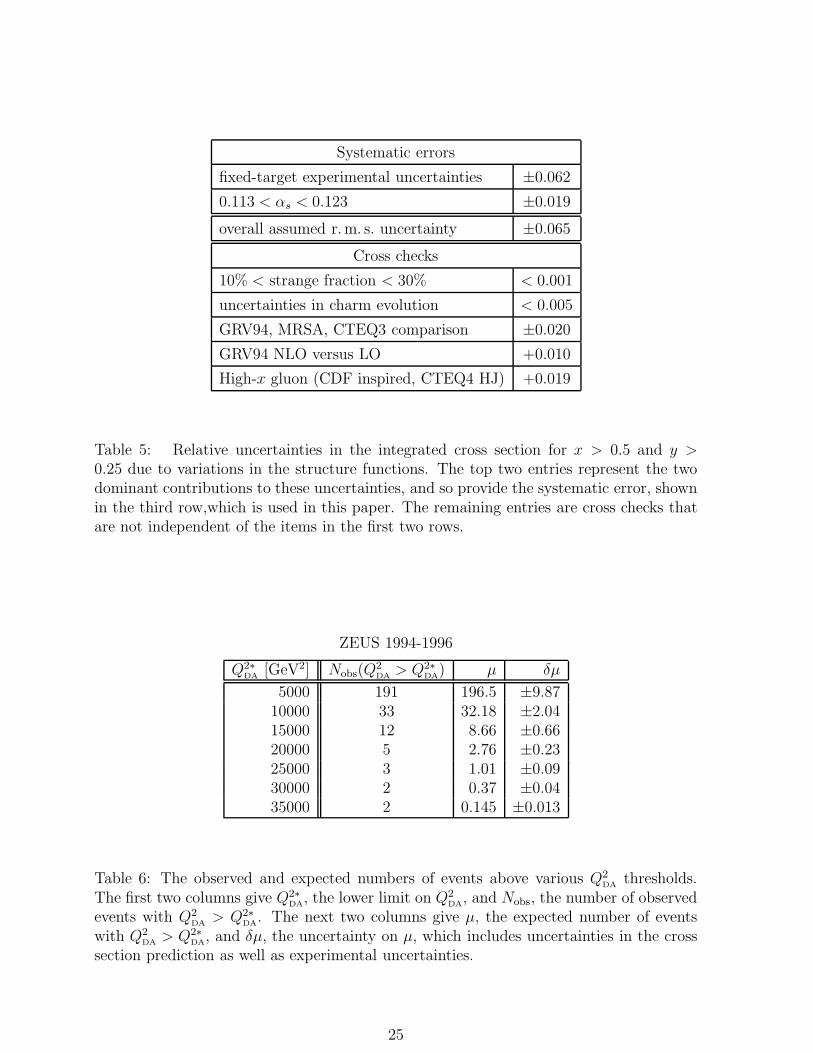
Table 5: Relative uncertainties in the integrated cross section for x > 0.5 and y >0.25 due to variations in the structure functions. The top two entries represent the twodominant contributions to these uncertainties, and so provide the systematic error, shownin the third row,which is used in this paper. The remaining entries are cross checks thatare not independent of the items in the first two rows.
ZEUS 1994-1996
Q2∗DA
[GeV2] Nobs(Q2DA
> Q2∗DA) µ δµ
5000 191 196.5 ±9.8710000 33 32.18 ±2.0415000 12 8.66 ±0.6620000 5 2.76 ±0.2325000 3 1.01 ±0.0930000 2 0.37 ±0.0435000 2 0.145 ±0.013
Table 6: The observed and expected numbers of events above various Q2DA
thresholds.The first two columns give Q2∗
DA, the lower limit on Q2
DA, and Nobs, the number of observed
events with Q2DA
> Q2∗DA. The next two columns give µ, the expected number of events
with Q2DA
> Q2∗DA, and δµ, the uncertainty on µ, which includes uncertainties in the cross
section prediction as well as experimental uncertainties.
25
ZEUS 1994-1996
yDA range Pmin(x∗DA) x∗
DANobs(xDA > x∗
DA) µ PSM
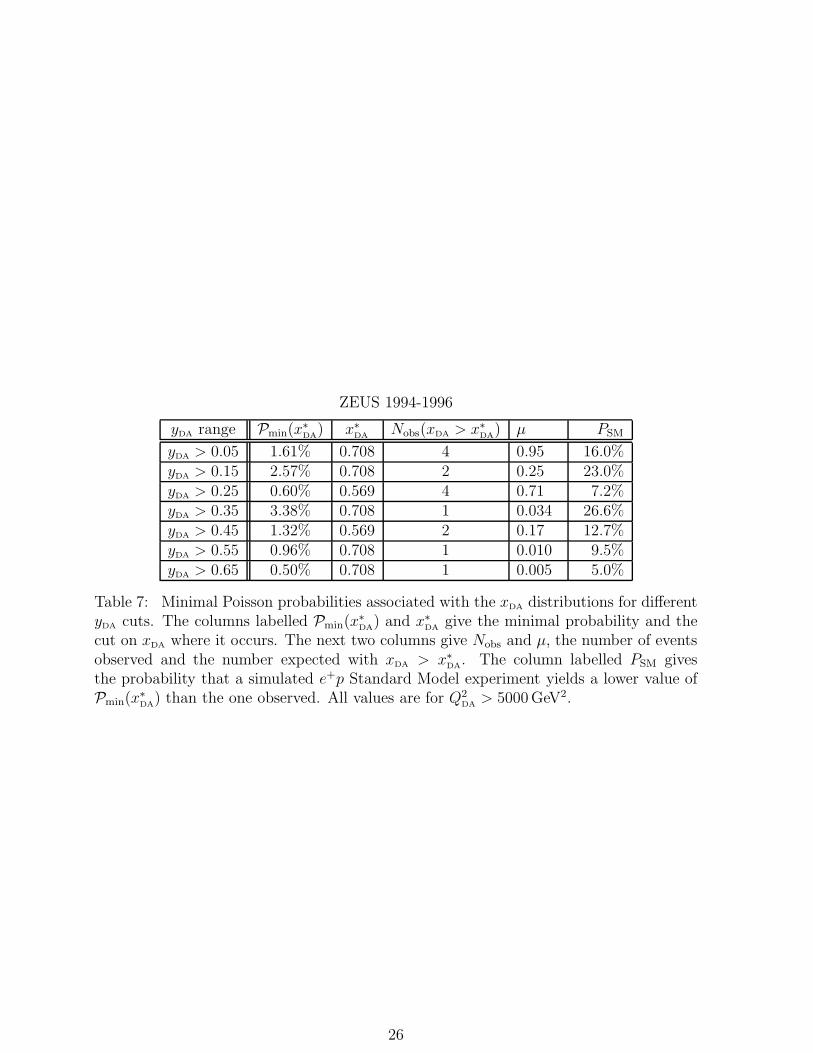
yDA > 0.05 1.61% 0.708 4 0.95 16.0%yDA > 0.15 2.57% 0.708 2 0.25 23.0%yDA > 0.25 0.60% 0.569 4 0.71 7.2%yDA > 0.35 3.38% 0.708 1 0.034 26.6%yDA > 0.45 1.32% 0.569 2 0.17 12.7%yDA > 0.55 0.96% 0.708 1 0.010 9.5%yDA > 0.65 0.50% 0.708 1 0.005 5.0%
Table 7: Minimal Poisson probabilities associated with the xDA distributions for differentyDA cuts. The columns labelled Pmin(x
∗DA) and x∗
DAgive the minimal probability and the
cut on xDA where it occurs. The next two columns give Nobs and µ, the number of eventsobserved and the number expected with xDA > x∗
DA. The column labelled PSM gives
the probability that a simulated e+p Standard Model experiment yields a lower value ofPmin(x
∗DA) than the one observed. All values are for Q2
DA> 5000GeV2.
26
0
0.1
0.2
0.3
0.4
0.5
0.6
0.7
0.8
0.9
1
0 0.1 0.2 0.3 0.4 0.5 0.6 0.7 0.8 0.9 1
xDA
y DA
ZEUS 1994-1996
Figure 1: The distribution of the event sample in xDA and yDA. The lines indicateconstant values of Q2
DA= xDAyDAs for Q2
DA= 5000, 10000, 20000 and 40000GeV2.
27
10-2
10-1
1
10
0 0.1 0.2 0.3 0.4 0.5 0.6 0.7 0.8 0.9 1xDA
0.0
5⋅d
N/d
x DA
ZEUS 1994-1996
yDA>0.25
Q2DA>5000 GeV2
Figure 2: The xDA distribution of the observed events with the cuts shown (full dots),compared to the Standard Model e+p NC expectation (histogram). The error bars on thedata points are obtained from the square root of the number of events in the bin.
28
10-2
10-1
1
10
10 2
10000 20000 30000 40000 50000Q2
DA (GeV2)
(2500 G
eV2)⋅
dN
/dQ
DA
2
ZEUS 1994-1996
Figure 3: The Q2DA
distribution of the observed events (full dots), compared to theStandard Model e+p NC expectation (histogram). The error bars on the data points areobtained from the square root of the number of events in the bin.
29
11-Oct-1994
ET (GeV)
azimuthϕ
pseudo-ra
pidity η
Figure 4: A display of the high Q2 event recorded on 11-Oct-94. The top right partshows the ZEUS inner tracking system and the calorimeter. The filled rectangles in thecalorimeter denote energy deposits which are above the noise thresholds described inthe text (cf. Section 3.1). The bottom right display shows a projection onto a planeperpendicular to the beam axis, where only BCAL energy deposits are shown. Theleft part of the figure shows the calorimeter transverse energy deposits. This displaydemonstrates that the scattered positron is well isolated.
30
03-Nov-1995
ET (GeV)
azimuthϕ
pseudo-ra
pidity η
Figure 5: A display of the high Q2 event recorded on 03-Nov-95. The description of thedisplay is identical to the previous figure. However, for this event the positron polar angleθe is large enough to be in the CTD acceptance.
31
10-3
10-2
10-1
1
10
10 2
10000 20000 30000 40000 50000Q2*
DA (GeV2)
No
bs(
Q2 D
A>
Q2
*D
A)
a)
ZEUS 1994-1996
10-2
10-1
1
10000 20000 30000 40000 50000Q2*
DA (GeV2)
P(Q
2*
DA)
b)
Figure 6: In (a), the solid line indicates the number of observed events with Q2DA
> Q2∗DA
as a function of Q2∗DA. The dotted line indicates the number of events expected from e+p
NC DIS with Q2DA
> Q2∗DA. In (b) is shown the Poisson probability (eqn. 11) to observe at
least as many events as were observed with Q2DA
> Q2∗DA
as a function of Q2∗DA.
32
10-2
10-1
1
10
10 2
0 0.1 0.2 0.3 0.4 0.5 0.6 0.7 0.8 0.9 1x*
DA
No
bs(
xD
A>
x* D
A)
a)
ZEUS 1994-1996yDA>0.25
Q2DA>5000 GeV2
10-2
10-1
1
0 0.1 0.2 0.3 0.4 0.5 0.6 0.7 0.8 0.9 1x*
DA
P(x
* DA)
b)
yDA>0.25
Q2DA>5000 GeV2
Figure 7: In (a), the solid line indicates the number of events observed with yDA > 0.25and xDA > x∗
DAas a function of x∗
DA. The dotted line indicates the number of expected e+p
NC DIS events with yDA > 0.25 and xDA > x∗DA. In (b) is shown the Poisson probability
(eqn. 11) to observe at least as many events as were observed with xDA > x∗DA
as a functionof x∗
DA.
33