Embed Size (px)
Citation preview
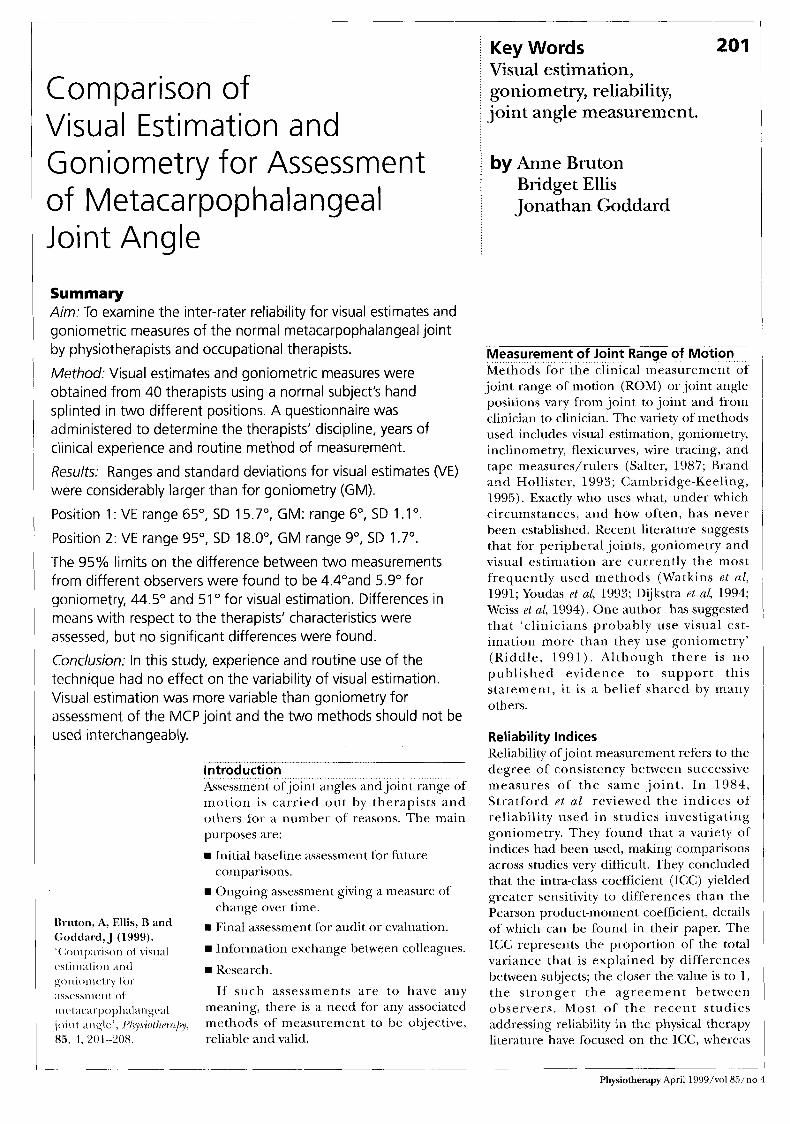
Comparison ot Visual Estimation and Goniometry for Assessment of Metacarpophalangea Joint Angle
Summary Aim: To examine the inter-rater reliability for visual estimates and goniometric measures of the normal metacarpophalangeal joint by physiotherapists and occupational therapists.
Method: Visual estimates and goniometric measures were obtained from 40 therapists using a normal subject's hand splinted in two different positions. A questionnaire was administered to determine the therapists' discipline, years o clinical experience and routine method of measurement.
Results: Ranges and standard deviations for visual estimates (VE) were considerably larger than for goniometry (GM).
Position 1 : VE range 65", SD 15.7", GM: range 6", SD 1 .I".
Position 2: VE range 95", SD 18.0", GM range 9", SD 1.7".
The 95% limits on the difference between two measurements from different observers were found to be 4.4"and 5.9" for goniometry, 44.5" and 51 O for visual estimation. Differences in rneans with respect to the therapists' characteristics were assessed, but no significant differences were found.
Conclusion: In this study, experience and routine use of the technique had no effect on the variability of visual estimation. Visudl estimation was more variable than goniometry for dssessment of the MCP joint and the two methods should not be used inlcrchangeably.
introduction
Key Words 201 Visual estimation, goniometry, reliability, joint angle measurement.
by Anne Bruton Bridget Ellis Jonathan Goddard
Assessment ofjoint angles andjoint range of motion is carried out by therapists and ochers for a number of reasons. The main purposes are:
Initial baseline assessment for fiiture comparisons.
change over time. H Ongoing assessment giving a measure of
w Final assessnierit for audit or evaluation.
w Information exchange between colleagues.
rn Research.
If such assessments are to have any meaning, there is a need for any associated methods of measurement to be objective, reliable and valid.
-~
Measurement of Joint Range of Motion Methods for the clinical measurement of joint range of motion (ROM) or joint angle positions vary from joint to joint and from clinician to clinician. The variety of methods used includes visual estimation, goniometry, inclinometry, flexicurves, wire tracing, and tape measures/rulers (Salter, 1987; Brand and Hollister, 1993; Cambridge-Keeling, 1995). Exactly who uses what, under which circumstances, and how often, has never been established. Recent literature suggests that for peripheral joints, goniometry and visual estimation are currently the most frequently used methods (Watkins et al, 1991; Youdas et nl, 1993; Dijkstra et nl, 1994; Weiss et at, 1994). Oiie author has suggested that 'clinicians probably use visual est- imation more than they use goniometry' (Kiddle, 1991) . Although there is n o published evidence to support this statement, it is a belief shared by many others.
Re1 i a bi I ity Indices Reliability of joint measurement refers to the degree of consistency between successive measures of the same joint . In 1984, Stratford ~1 a1 reviewed the indices of reliability used in studies investigating qoniometry. They found that a variety of indices had been used, making comparisons across studies very difficult. They concluded that the intra-class coefficient (ICC) yielded greater sensitivity to differences than the Pearson product-moment coefficient, details of which can be found in their paper. The ICC represents the proportion of the total variance that is explained by differences between subjects; the closer the value is to 1, the stronger the agreement between observers. Most of the recent studies addressing reliability in the physical therapy literature have focused on the ICC, whereas
202
other indices of reliability, such as the standard error of measurement, have been used less frequently (Stratford and Goldsmith, 1997). Although such coefficients are freqnently applied to reliability studies, Bland and Altman (1986) discuss the limitations of these methods and suggest an alternative technique t.hat is now the accepted method for assessing agreement between methods of measure- ment.
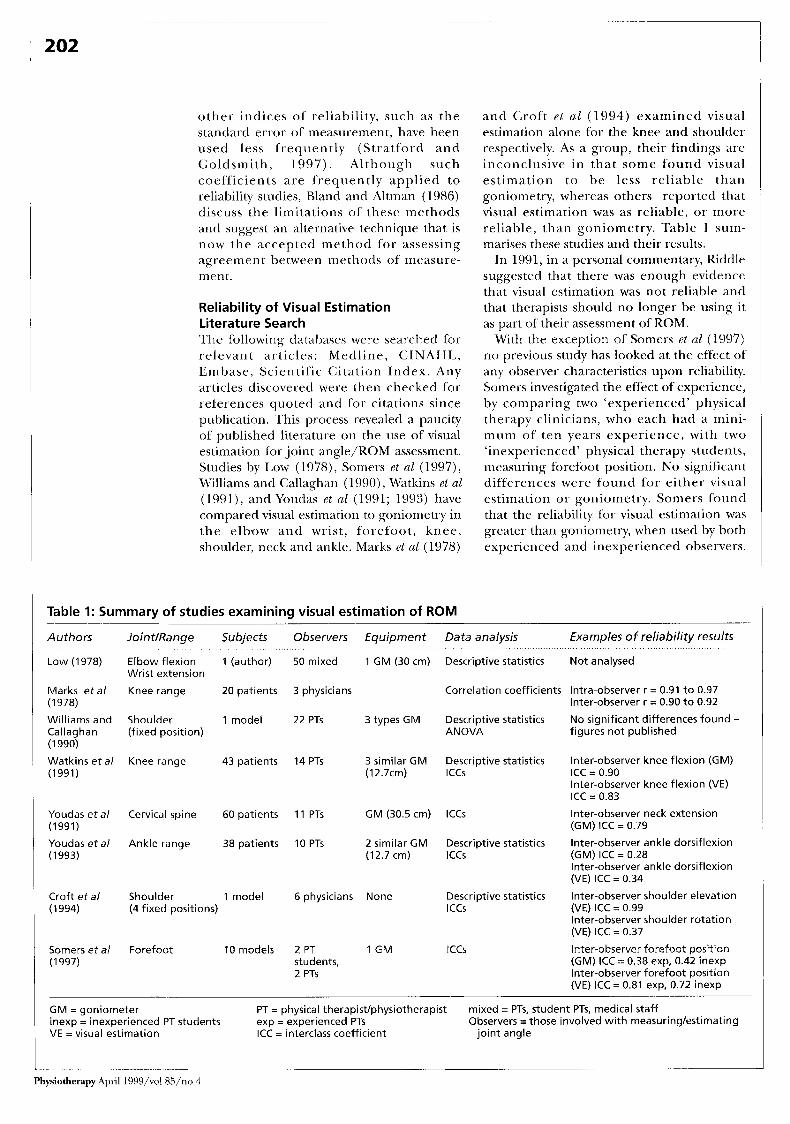
Reliability of Visual Estimation Literature Search The following databases were searched for relevant articles: Medline, CINAHL, Emhase, Scientific Citation Index. Any articles discovered were then checked for references quoted and for citations since publication. This process revealed a paucity of published literature on the use of visual estimation for .joint angle/KOM assessment. Studies by Low (1978), Somers et a1 (1997), Williams arid Callagkian (1 990), watkins el a1 (1991), and Youdas et a1 (1991; 1993) have compared visual estimation to goniometry in the elbow and wrist, forefoot, knee, shoulder, neck and ankle. Marks et a1 (1978)
and Croft e l a1 (1994) examined visual estimation alone for the knee and shoulder respectively. As a group, their findings are inconclusive in that some found visual estimation to be less reliable than goniometry, whereas others reported that visual estimation was as reliable, or more reliable, than goniometry. Table 1 sum- marises t.hese studies and their results.
In 1991, in a personal commentary, Riddle suggested that there was enough evidence that visual estimation was not reliable and that therapists should no longer be using it as part of their assessment of ROM.
With the exception of Somers et (11 (1997) no previous study has looked at the effect o f any observer characteristics upon reliability. Somers investigated the effect of experience, by comparing two ‘experienced’ physical therapy clinicians, who each had a mini- mum of ten years experience, with two ‘inexperienced’ physical therapy students, measuring forefoot position. N o significant differences were found for either visual estimation or goniometry. Somers found that the reliability for visual estimation was greater than goniometry, when used by both experienced and inexperienced observers.
Table I: Summary of studies examining visual estimation of ROM
Authors JointlRange Subjects Observers Equipment Data analysis Examples of reliability results
Low (1978) Elbow flexion 1 (author) 50 mixed 1 GM (30 cm) Descriptive statistics Not analysed Wrist extension
Marks e t a / Knee range 20 patients 3 physicians (1 978)
Correlation coefficients Intra-observer r = 0.91 t o 0.97 Inter-observer r = 0.90 t o 0.92
Williams and Shoulder 1 model 22 PTs 3 types GM Descriptive statistics No significant differences found - Callaghan (fixed position) ANOVA figures not published (1 990)
Watkins e t a / Knee range 43 patients 14 PTs 3 similar GM Descriptive statistics Inter-observer knee flexion (GM) (1991) (12.7cm) ICCS ICC = 0.90
Inter-observer knee flexion (VE) ICC = 0.83
Youdas e t a / Cervical spine 60 patients 11 PTs GM (30.5 cm) lCCs (1991)
Inter-observer neck extension (GM) ICC = 0.79
Youdas e t a / Ankle range 38 patients 10 PTs 2 similar GM Descriptive statistics Inter-observer ankle dorsiflexion (1993) (12.7 cm) ICCS (GM) ICC = 0.28
Inter-observer ankle dorsiflexion (VE) ICC = 0.34
Croft e t a / Shoulder 1 model 6 physicians None Descriptive statistics Inter-observer shoulder elevation (1994) (4 fixed positions) ICCS (VE) ICC = 0.99
Inter-observer shoulder rotation (VE) ICC = 0.37
Somers e t a / Forefoot 10models 2 PT 1 GM ICCS Inter-observer forefoot position (1 997) students, (GM) ICC = 0.38 exp, 0.42 inexp
2 PTs Inter-observer forefoot position (VE) ICC = 0.81 exp, 0.72 inexp
G M = goniometer inexp = inexperienced PT students VE = visual estimation ICC = interclass coefficient joint angle
PT = physical therapistlphysiotherapist exp = experienced PTs
mixed = PTs, student PTs, medical staff Observers =those involved with measuringlestimating
Physiotherapy April l999/vol 85/11o 4
Professional articles 203
T h e inexper ienced observers, however, received training in both visual estimation and goniometry for measuring the position of the forefoot, whereas the experienced clinicians received no such training.
N o studies have been identified which invcstigate the reliability of visual estimation for smaller joints or the prevalence of the use of visual estimation by therapists. The aims of this study, therefore, were:
To determine the routine method ofjoint angle measurement by hand therapists and others. 'lo determine the inter-rater reliability of rrietacarpophalangeal (MCP) joint measurement using visual estimation and goniometry. To compare the reliability of t.hese two methods. To examine the effects of profession, experience and routine method of measurement upon reliability.
Methodoloav Subject A healthy subject had the middle finger of cach hand fixed in two different positions using removable splints that had been made for this study. A healthy subject was chosen because it was thought that any pathology would have the potential to change over time, and the aim was to ensure that the same angle was being measured on each o c c as i o n dur ing this m ul t i-c e n t re study. The two positions were chosen to mimic common clinical limitations of movement, position 1 with the MCP joint in flexion, position 2 with the MCP joint close to full cxtension. The 'real' angles produced by these splints are not known because there is no gold s tandard measurement. For the purposes o f this study, however, this was unimpor tan t . The study was examining reliability, not validity. The splints held the hand firmly in position and it is believed that possible variation in fingcr position was rriiriimised by the splinting.
Forty volunteer observers were recruited from nine different sites, I'our of which specialised in hand therapy. 'They were 'LO q u a1 i f i ed p h y s i o t h c ra pi s ts and 2 0 oc c LI-
pational therapists with clinical experience ranging from < 1 to 16t years, 25 (62.5%) of them having at least one year's specialist experience in hand therapy. All observers completed a short questionnaire indicating their discipline, experience and rout ine method(s) for assessing ROM of the hand (observer questionnaire).
Instrumentation The goniometer chosen for the study was a Rolyan" flexion/hyper-extension finger gon- ionieter, which permits measurement f rom SO" of hyper-extension to 120" of flexion and has the benefit of measuring in one-degree increments.
The goniometer was covered with contact paper so the observers could not read the scale, but the recorder (one of the authors) could do s o from the reverse side.
The same goniometer was used through- out the study.
Procedure In an attempt to standardise measurement technique, all observers received a written goniometry measurement protocol prior to the day of testing. No protocol was given for visual estimation. This was felt to reflect therapists' training, as while goniometry is regularly taught du r ing undergraduate programmes , t he au tho r s believe tha t visual estimation is not covered in the same way.
To ensure consistency, the observers were advised to use a dorsal measu remen t approach as recommended by Hamilton and Lachenbruch (1969) who found it to be as reliable as lateral placement. The wrist and forearm of the sub.ject were he ld in a standard manner for each test. The subject was seated with the upper arm supported by a table, the elbow flexed to 90".
On the day of testing, after completing the observer ques t ionnai re , each observer visually estimated the MCP joint in position 1 and the recorder noted their estimate. The observers then measured the same jo in t using the goniometer. When the arms of the goniometer were aligned to the observer's satisfaction, the recorder read and recorded the value. This process was repeated for the MCP joint in position 2.
As this was part of a wider study comparing three different measurement techniques (Ellis et al, 1997), measurement of the MCP joint using the goniometer was actually carried out three times, but for the study reported here, only the first measure was used for comparison with visual estimation.
Visual estimation was carried out once only, as it was thought that the intervening use of the goniometer and the observer's memory of previous est,imates would affect subsequent estimates. For similar reasons visual estimation was always carried out prior to goniometry.
At n o poin t dur ing the measurement
Authors During this study Anne Bruton MA MCSP and Bridget Ellis MSc MCSP were lecturers in physiotherapy at the School of Occupational Therapy and Physiotherapy; and Jonathan Goddard MSc was a statistician in medical statistics and computing, all at the University of Southampton.
Anne Bruton is currently undertaking a full-time PhD at the University of Southampton.
Acknowledgement Part of this material was presented at the annual conference of the British Association of Hand Therapists in Birmingham, November 1996.
This article was received on March 5,1998, and accepted on November 12, 1998.
Address for Correspondence Ms A Bruton, School of Occupational Therapy and Physiotherapy, University of Southampton, Highfield, Southampton SO17 1BJ.
*Manufacturers: Smith and Nephew, Hull.
Physiotherapy April 1999/vol 85/no 4
phase were observers permitted to view any of their results. The same recorder was used o n each occasion for recording all measurements.
Analysis of Data The observer characteristics, visual estimates and goniometric measures were analysed using SPSS and SAS.
In a study like this, the vdriances are of more interest than the means, especially as there is no gold standard measurement method. In most reliability studies the observations are made on different subjects, whereas here each observer measured the same fixed angle, so that the standard reliability coefficients were not appropriate.
Measurements and estimates were therefore summarised using descriptive statistics, looking particularly at ranges and variances. Subsequently the variance for each measurement and estimate was separated into components due to within- and between-observer variation. Repeata- bility coefficients for different observers were calculated from these. The repeatability coefficient is the 95% limit on the difference between two measurements (BSI, 1979) and is calculated as:
(Healy, 1989) Analysis of variance models were used to
test for inter-rater reliability and for differences in variability due to a number of observer characteristics, ie profession (occupational therapist or physiotherapist), years of' clinical experience (5 + or less), hand experience (1 + or less), routine use of the method of measurement (yes or no).
The model used for inter-rater reliability was:
2 4 2 x -d (2 \,!I I1 , 1 1 1 0 h
(y, = p + 0, + E~~ (Healy, 1989)
where y and o refer to.joint angle and observer respectively, and i = 1,2, ..., 40 observers,j = 1,2,3 repeat measurements (goniometry only, as visual estimation had no repcat measurements).
The models for observer charac,tcristics wcre: (a) Goniometry ylk = p f CI + OI(I) f rk + (CO) 4- ElIk (Healy, 1989) (where y, c, o and 1- refer tojoint angle, characteristic level, observer and repeat number respectively i = 1,2 characteristic levels, j = 1, 2 ,..., n, observers, k = 1,2,3 repeats.
(b) Visual estimation (which had no repeat measurements)
(yl = p + c, + E,, (Healy, 1989) where y and c refer tojoint angle and characteristic level respectively i = 1,2 characteristic levels, j = 1,2 ,..., 40 observers.
Results Routine Method of Measurement The results of the observer questionnaire indicate that the most common method of measurement for j o in t angles was goniometry (used by 50% of observers). Some observers reported using more than o n e method of measurement. Visual estimation was used by 40% of the observers and half of these reported using no other form of assessment.
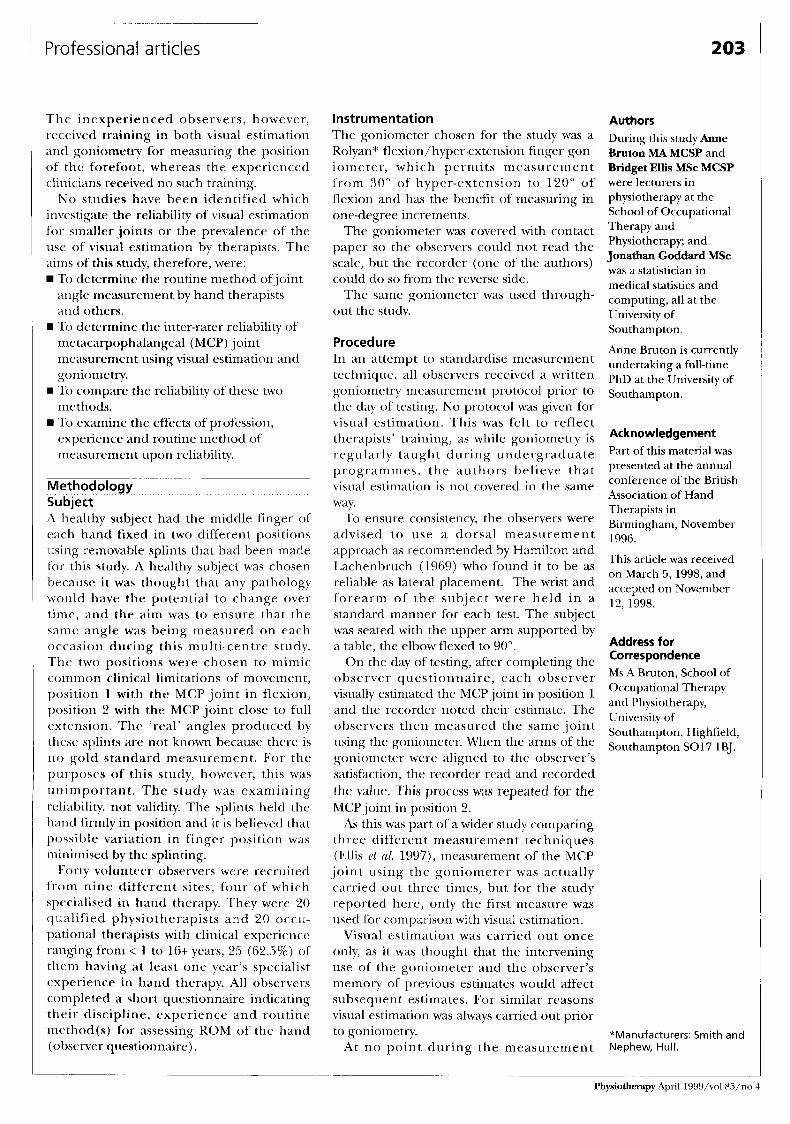
Visual Estimation and Goniometry Data Table 2 shows the visual estimates and the means of the three measures of the same joint using goniometry, with their standard deviations and ranges. Table 2: Descriptive statistics of visual estimation and goniometry for positions 1 and 2 ("1
Methodl Mean Standard Range Position deviation
VE 1 42.1 15.7 65 G M I 44.5 1.1 6
VE2 9.4 18.0 95 GM2 7.8 1.7 9
VE =Visual estimation
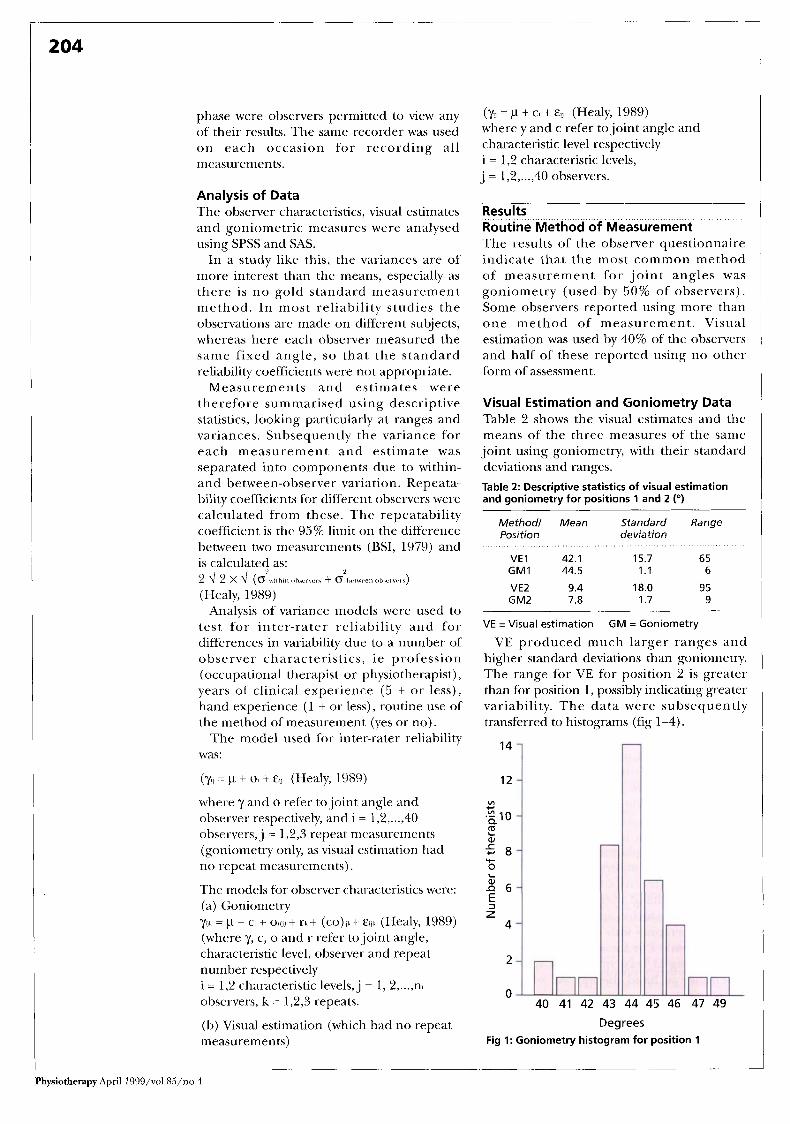
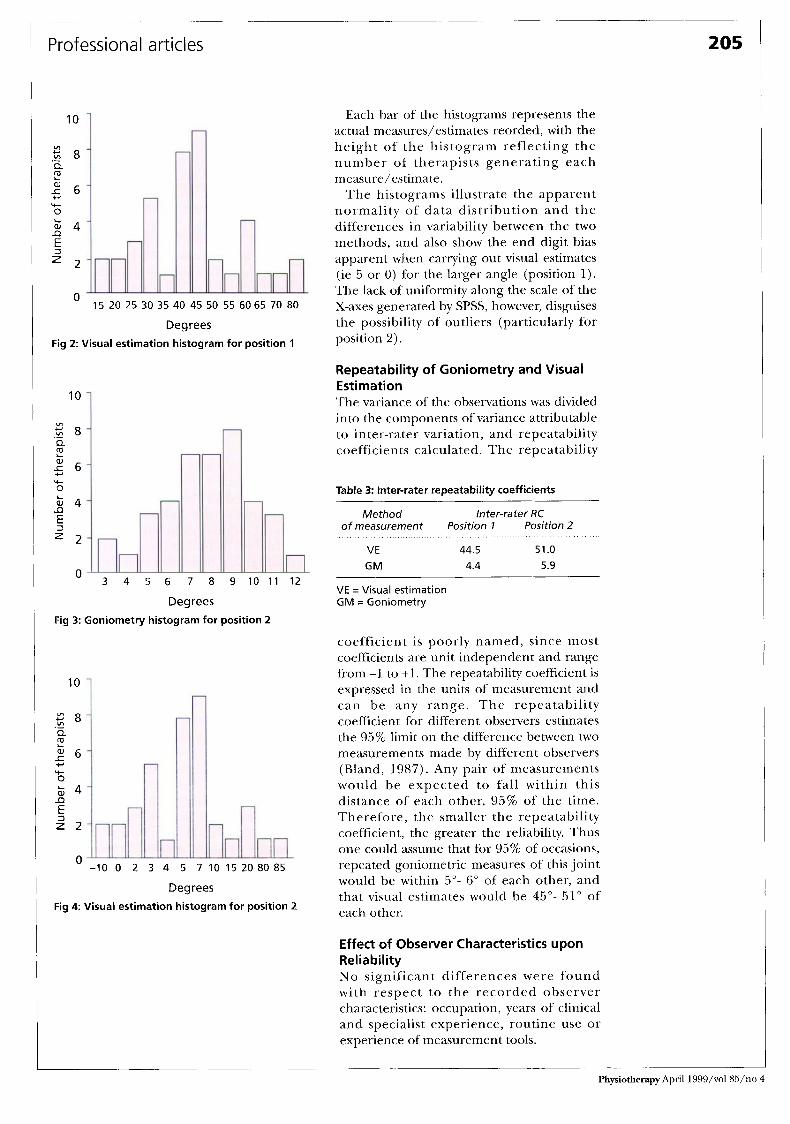
VE produced much larger ranges and higher standard deviations than goniometry. The range for VE for position 2 is greater than for position 1, possibly indicating greater variability. The data were subsequently transferred to histograms (fig 1-4).
GM = Goniometry
14
12
v) + v)
.,I0 2 5 8
z n 6 E
aJ
+ 0
3 z 4
2
0 40 41 42 43 44 45 46 47 49
Degrees Fig 1: Goniometry histogram for position 1
Physiotherapy April 1999/vol M/no 4
Professiona I articles 205 1
10
6 4
z 2
D
5
15 20 25 30 35 40 45 50 55 60 65 70 80
Degrees Fig 2: Visual estimation histogram for position 1
10
v)
._ Z 8
E 5 6
Q
a,
+ 0
k 4 I) E
$ 2
3 4 5 6 7 8 9 1 0 1 1 1 2
Degrees Fig 3: Goniometry histogram for position 2
10
8 8 vl
E a , 6 5
.- a
Y- O b 4 a E 2 2
-10 0 2 3 4 5 7 1 0 1 5 2 0 8 0 8 5
Degrees Fig 4 Visual estimation histogram for position 2
Each bar of the histograms represents the actual measures/estimates reorded, with the height of the histogram reflecting the number of therapists generating each measure/estimate.
The histograms illustrate the apparent normality of data distribution and the differences in variability between the two methods, and also show the end digit bias apparent when carrying out visual estimates (ie 5 or 0) for the larger angle (position 1). The lack of uniformity along the scale of the X-axes generated by SPSS, however, disguises the possibility of outliers (particularly for position 2).
Repeatability of Goniometry and Visual Estimation The variance of the observations was divided into the components of variance attributable to inter-rater variation, and repeatability c o e ffici e n ts calculated . The repeatability
Table 3: Inter-rater repeatability coefficients
Method Inter-rater RC of measurement Position 1 Position 2
VE 44.5 51 .O GM 4.4 5.9
VE =Visual estimation G M = Goniometry
coefficient is poorly named, since most coefficients are unit independent and range from -1 to +l. The repeatability coefficient is expressed in the units of measurement and can be any range. The repeatability coefficient for different observers estimates the 95% limit on the difference between two measurements made by different observers (Bland, 1987). Any pair of measurements would be expected to fall within this distance of each other, 95% of the time. Thereiore, the smaller the repeatability coefficient, the greater the reliability. Thus one could assume that for 95% of occasions, repeated goniometric measures of this joint would be within 5"- 6" of each other, and that visual estiniates would be 45"- 51" of each other.
Effect of Observer Characteristics upon Reliability N o significant differences were found with respect to the recorded observer characteristics: occupation, years of clinical and specialist experience, routine use or experience of measurement tools.
I
Physiotherapy April I999/vol 85/no 4
206
. . Discussion Routine Method 'of Measurement by Therapists Since no published studies have addressed this area, it is not known whether our results o n therapists' routine method of nieasure- rnent ofjoint angle and ROM are typical. They do, however, support several authors' beliefs that goniometry and visual estimation are the most frequently used forms of measurement (Watkins el al, 1991; Youdas el ul, 1993; Dijkstra et al, 1994; Weiss et al, 1994; Kiddle, 1991). I n view of the doubts surrounding the reliability of visual estimation, it was interesting that so many of our observers reported using it. The reasons for its popularity are evident: it is quick, apparently simple, requires no equipment arid can be used for all ,joints through all ranges. Goniornetry is slower, more difficult and not suitable for alljoints or for.joints in w h i c h path o lo gy a ffe c t s bony 1 an d m ar ks . This study was examining the reliability of assessment techniques, and used normal joints. In the clinical setting, pathology or s u r g e r y c o u 1 d p re s u ni ab 1 y c o m p 1 i c a te measurement and affect reliability.
Reliability of Visual Estimation and Goniometry The results of this study relating to the comparative inter-rater reliability of visual e s t i m a ti on and go n i orn e t ry support the findings of' Low (1978), Walkins et al (1991), andYoudas et al (1991), but conflict with those of Croft e t al ( 1 994) , Marks et a1 (1978), Somers et a1 (1997, 1990) and Yondas el a1 (1993).
Despite using different reliability indices, onr results for the inter-rater reliability of goniometry are comparable to those of previous authors, producing fairly high levels of reliability (Youdas et al , 1992, 1993; Low, 1978) The higher reliability is particularly noticeable in comparison with clinical studies (Youdas et al, 1991, 1993) probilbly because this study iised splints to hold the ,joints in relatively fixed positions, thereby standardising the angle 1.0 be measured, and used a single siihject with nornial .joints.
The results for visual estirnation, however, produced an unusually low level of reliability. This very low reliability was found for both positions, indicating that i t is something about thc joint, rat.her than the angle, which was difficult for therapi estimate. There are a number of reasons why this might be the case:
The joints rrieasured and estimated were small peripheraljoints, with short lever a r m and with otherjoints in close proximity. These factors may make estimates more difficult to perform.
estimation, and some guidelines might have been helpful. There may have been some confusion as to the angle being estimated, ie the angle made by the dorsal surfaces, or that made by the ventral surfaces of the digit being measured. Again a protocol would have avoided this. Despite recommendations in the literature to thc contrary, some therapists may have interpreted a straight line as being 180", rather than 0". As the aini was to try to mimic what actually happens in clinical practice, it was decided in advance not to dictate the choice of zero position by the measurers.
estimates of the larger angle. As indicated by Stratford el ul (1984)
comparisons across studies are difficult because of differences in study design and the reliability coefficients used. Even within the small group of studies summarised in table I , a wide range of approaches has been used. Some studies have used models to be measured, which increases the chances of standardising what is actually being measured or estimated. Others have used patients, which may make the studies more clinically relevant, but leads to additional variables. The nature of the subjects does not seem to have a con tent effect upon the reliability of the observers' techniques.
Different studies have used different profcssions as observers, demonstrating varying levels of reliability. Two of the studies used physicians as observers (Marks et al, 1978; Croft el al, 1994) and both of these studies concluded that there was high reliability for visual estimation in the assessment of j o i n t angles by medical personnel. This supports an assertion by Milch (1945) that no amount of' objective measurement could be siibstitutcd for the subjective estimation of an experienced surgeon. All the other studies have used physical therapists or physiotherapists as observers. Low (1978) also used student physiotherapists and medical personnel, and Somers (1997) also used student physical therapists. The therapists studied displayed less consistency in their reliability than their medical colleagues. Studies of the latter,
N o protocol was issued for visual
w End digit bias was apparent for visual
Physiotherapy April 19W/voI 85/rio 4
Prof essi ona I art ides 207
however, included only very small numbers of observers (six in one study, three in the other), whereas studies of the former have ranged in number from 10 to 50. Our study is the first to assess occupational therapists’ reliability in this area, and to compare them with physiotherapists.
Effect of Observer Characteristics upon Reliability Our study, like that of Somers et a1 (1997) Sound no significant differences when looking at any of the recorded observer characteristics, including experience. Unlike Somers, however, we found visual estimation to be much more variable than goniometry. This would therefore not support the theory that ‘practice makes perfect’ , o r that experience necessarily leads to increased skill. It is possible that visual estimation is a skill that is related to other visuospatial abilities.
Correlations have been found between visuospatial dcfects and size overestimation in college students (Thompson and Spana, 1991). Elements of this skill may be innate, but may also be amenable to training through practice and feedback, like the ability to park a car in a confined space. It is the feedback element that is generally lacking in clinical experience, since once qualified, i t is unlikely that therapists receive such feedback o n the minutiae 01‘ assessment. I t is probable, therefore, that practice merely makes permanent, ie that simply repeating a technique without corrective feedback will only serve to reinforce one’s habits, whether bad or good.
Since none of the variation could be
References Bland, J M (1987). A n Introduction to Medical Statistzcs, Oxford University Press.
Bland, J M and Altman, D G (1986). ‘Statistical methods for assessing agreement between two methods of clinical measurement’, Lancet, 1, 307-3 10.
Brand, P W and Hollister, A (1993). ‘Methods of clinical measurement in the hand’ in: Ryan, J D and Throp, D (eds) Clinical Mechanics ofthe Hand, Mosby-Year Book, St Louis, 2nd edn, pages 223-253.
British Standards Institution (1979). ‘Precision of test methods. 1: Guide for the determination and reproducibility for a standard test method’ (BS 5497 part l ) , BSI, London.
attributed to any of the noted observer characteristics, it seems that VE is not only generally unreliable, but also that it is impossible to predict which individuals are likely to be more reliable than others. It makes no difference how much clinical experience one has, whether one uses VE routinely or not, or whether one regularly assesses/treats hands. Unless it is possible to identify those who are more likely to be reliable using VE, it seems unwise for anyone to continue to use it, at least for the MCP joint.
In this study, only one of the eight therapists who used no other form of measurement was a hand therapist (in this case with less than two years’ specialist experience). It is possible, therefore, that hand therapists may already be aware of the low reliability of VE of these joints.
Conclusion Ifjoint angle/ROM measurements are to be used as outcome measures, or for general assessment purposes, they need to be objective, reliable and valid. In this study the variability of visual estimation, when compared with goniometry, is considered to be too high for any of the uses described in the Introduction. However, further study examining the repeatability of visual estimates under a standardised protocol is required to determine their reliability under similar conditions of training. This study indicates that goniometry and visual estimation should not be used interchangeably. Under these study conditions, gonionietry has shown greater reliability than visual estimation in the assessment of smaller joints.
CambridgeKeeling, C (1995). ‘Range of motion measurement of the hand’ In: Hunter, J M, Mackin, E J and Callahan, A D (eds) Rehabilitation I
of the Hand: Surgery and therapy, Mosby, St Louis, 4th edn, pages 93-108.
Croft, P, Pope, D, Boswell, R, Rigby, A, and Silman, A (1994). ‘Observer variability in measuring elevation and external rotation of the shoulder’, British JournaE of Rhmmatology, 33, 10,
Dijkstra, P U, de Bont, L G, van der Weele, L T and Boering, G (1994). ‘Joint mobility measurements: Reliability of a standardised method’, Cranio, 12, 1, 52-57.
Ellis, B, Bruton, A, and Goddard, J (1997). ‘Joint angle measurement: A comparative study
942-946.
Physiotherapy April 1999/vol %/no 4
208
of the reliability of goniometry and wire tracing for the hand’, Clinical Rehabilitation, 11, 314320.
Hamilton, G F and Lachenbruch, P A (1969). ‘Reliability of goniometry in assessing finger joint angle’, Physical Therapy, 49, 5, 465-469.
Healy, M J R (1989). ‘Measuring measuring errors’, Statistics in Medicine, 8, 893-906.
Low, J L (1978). ‘The reliability ofjoint measurement’, Physiotherap, 62, 7,227-229.
Marks, J S, Palmer, M K, Burke, M J and Smith, P (1978). ‘Observer variation in the examination of knee joints’, Annals of the Rheumatic Diseases, 37, 376-377.
Milch, H (1945). ‘Measurement of muscle strength’, Journal ofBone and Joint Surgery, 27, 137.
Riddle, D L (1991). ‘Commentary’, Physical Therapy, 71,105-106.
Salter, M I (1987). ‘Assessment’ in: Salter, M I (ed) Hand Injuries: A therapeutic appvach, Churchill Livingstone, Edinburgh, pages 15-59, 1st edn.
Somers, D L, Hanson, J A, Kedzierski, C M, Nestor, K L and Quinlivan, K Y (1997). ‘The influence of experience on the reliability of goniometric and visual measurement of forefoot position’, Journal of Orthopaedic and Sports Physical Therapy, 25,3,192-202.
Stratford, P, Agostino, V, Brazeau, C and Gowitzke, B A (1984). ‘Reliability ofjoint angle measurement: A discussion of methodology issues’, Physiotherapy Canada, 36, 1, 5-9.
Stratford, P and Goldsmith, C (1997). ‘Use of the standard error as a reliability index of interest: An applied example using elbow flexor strength data’, Physical Therapy, 77, 745-750.
Thompson, J K and Spana, R E (1991). ‘Visuospatial ability, accuracy of size estimation, and bulimic disturbance in a non-eating disordered college sample: A neuropsychological analysis’, Perctption and Motor Skills, 73, 1,
Watkins, M A, Riddle, D L, Lamb, R L and Personius, W J (1991). ‘Reliability of goniometric measurements and visual estimates of knee range of motion obtained in a clinical setting’, Physical Therapy, 71,2,90-97.
Weiss, P L, August, S, Peters, G and Sampalis, J (1994). ‘Using the Exos Handmaster to measure digital range of motion: Reliability and validity’, Medical Engineering and Physics, 16, 4, 323-328.
Williams, J G and Callaghan, M (1990). ‘Comparison of visual estimation and goniometry in determination of a shoulderjoint angle’, Physiotherapy, 76, 10,655-657.
Youdas, J W, Bogard, C L and Suman, V J (1993). ‘Reliability of goniometric measurements and visual estimates of ankle joint active range of motion obtained in a clinical setting’, Archives of Physical Medicine and Rehabilitation, 74, 11 13-18.
Youdas, J W, Carey, J Rand Garrett, T R (1991). ‘Reliability of measurements of cervical spine range of motion - Comparison of three methods’, Physical Therapy, 71, 2,98-104.
335-338.