Embed Size (px)
Citation preview
Submit Manuscript | http://medcraveonline.com
IntroductionThe author uses math-physical medicine approach to investigate
three pairs of relationship between:
1. Weight vs. blood pressure (BP)
2. Weight vs. glucose (daily average glucose, including both FPG and PPG)
3. Glucose and BP
There are two clinical cases: Case A uses lifestyle management to control his metabolic disorders, while Case B uses both medications and partial lifestyle management to control the same three chronic diseases.
MethodBoth cases selected the same time periods for results comparison:
1,770 days from 1/1/2014 - 11/6/2018 with big data of 17,700
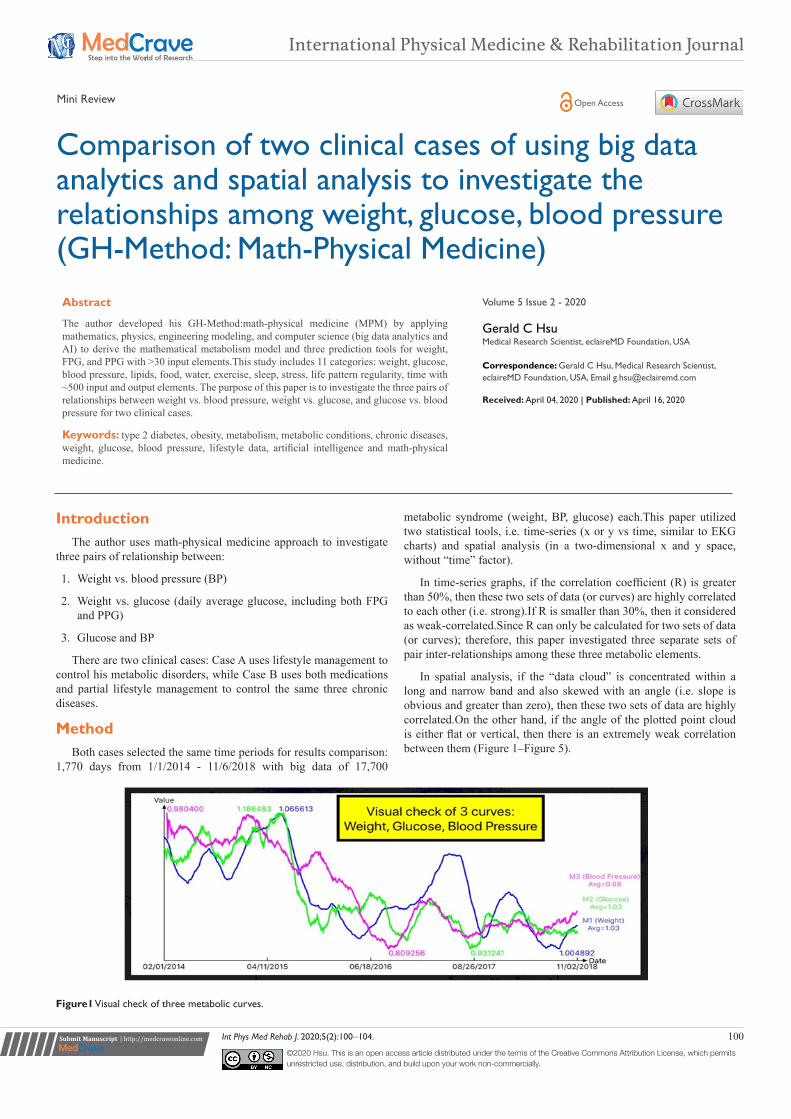
metabolic syndrome (weight, BP, glucose) each.This paper utilized two statistical tools, i.e. time-series (x or y vs time, similar to EKG charts) and spatial analysis (in a two-dimensional x and y space, without “time” factor).
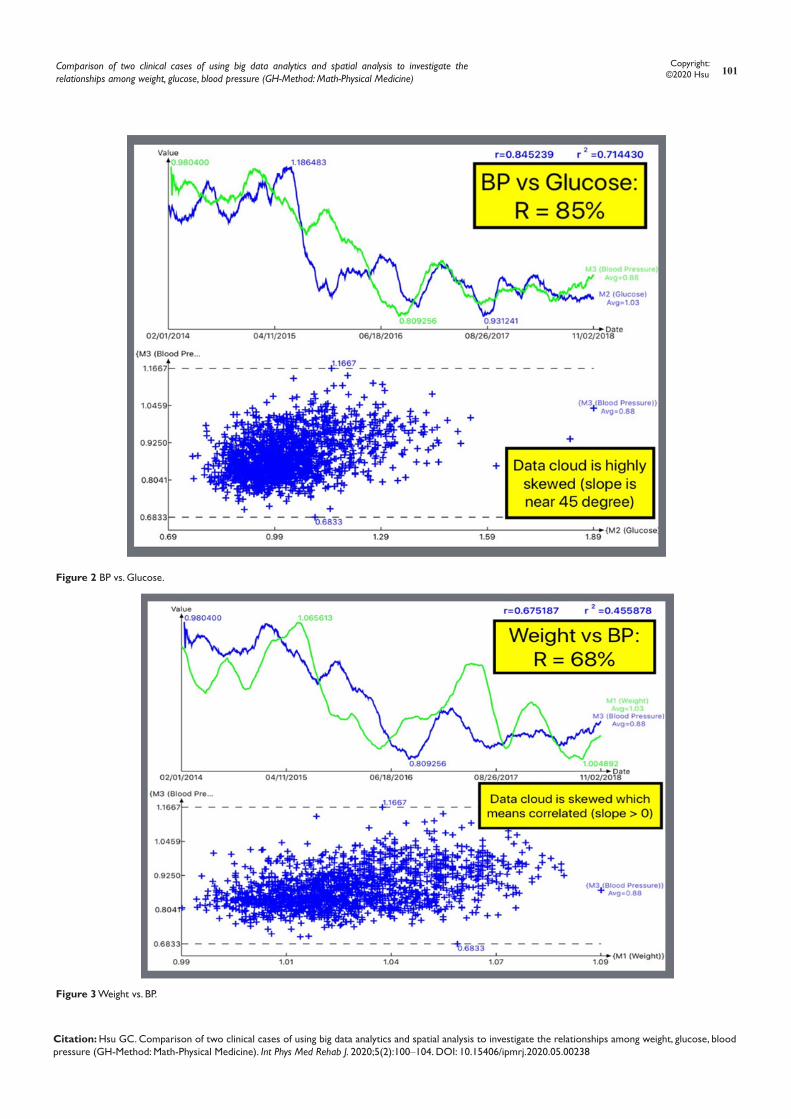
In time-series graphs, if the correlation coefficient (R) is greater than 50%, then these two sets of data (or curves) are highly correlated to each other (i.e. strong).If R is smaller than 30%, then it considered as weak-correlated.Since R can only be calculated for two sets of data (or curves); therefore, this paper investigated three separate sets of pair inter-relationships among these three metabolic elements.
In spatial analysis, if the “data cloud” is concentrated within a long and narrow band and also skewed with an angle (i.e. slope is obvious and greater than zero), then these two sets of data are highly correlated.On the other hand, if the angle of the plotted point cloud is either flat or vertical, then there is an extremely weak correlation between them (Figure 1–Figure 5).
Int Phys Med Rehab J. 2020;5(2):100‒104. 100©2020 Hsu. This is an open access article distributed under the terms of the Creative Commons Attribution License, which permits unrestricted use, distribution, and build upon your work non-commercially.
Comparison of two clinical cases of using big data analytics and spatial analysis to investigate the relationships among weight, glucose, blood pressure (GH-Method: Math-Physical Medicine)
Volume 5 Issue 2 - 2020
Gerald C HsuMedical Research Scientist, eclaireMD Foundation, USA
Correspondence: Gerald C Hsu, Medical Research Scientist, eclaireMD Foundation, USA, Email
Received: April 04, 2020 | Published: April 16, 2020
Abstract
The author developed his GH-Method:math-physical medicine (MPM) by applying mathematics, physics, engineering modeling, and computer science (big data analytics and AI) to derive the mathematical metabolism model and three prediction tools for weight, FPG, and PPG with >30 input elements.This study includes 11 categories: weight, glucose, blood pressure, lipids, food, water, exercise, sleep, stress, life pattern regularity, time with ~500 input and output elements. The purpose of this paper is to investigate the three pairs of relationships between weight vs. blood pressure, weight vs. glucose, and glucose vs. blood pressure for two clinical cases.
Keywords: type 2 diabetes, obesity, metabolism, metabolic conditions, chronic diseases, weight, glucose, blood pressure, lifestyle data, artificial intelligence and math-physical medicine.
International Physical Medicine & Rehabilitation Journal
Mini Review Open Access
Figure1 Visual check of three metabolic curves.
Comparison of two clinical cases of using big data analytics and spatial analysis to investigate the relationships among weight, glucose, blood pressure (GH-Method: Math-Physical Medicine)
101Copyright:
©2020 Hsu
Citation: Hsu GC. Comparison of two clinical cases of using big data analytics and spatial analysis to investigate the relationships among weight, glucose, blood pressure (GH-Method: Math-Physical Medicine). Int Phys Med Rehab J. 2020;5(2):100‒104. DOI: 10.15406/ipmrj.2020.05.00238
Figure 2 BP vs. Glucose.
Figure 3 Weight vs. BP.
Comparison of two clinical cases of using big data analytics and spatial analysis to investigate the relationships among weight, glucose, blood pressure (GH-Method: Math-Physical Medicine)
102Copyright:
©2020 Hsu
Citation: Hsu GC. Comparison of two clinical cases of using big data analytics and spatial analysis to investigate the relationships among weight, glucose, blood pressure (GH-Method: Math-Physical Medicine). Int Phys Med Rehab J. 2020;5(2):100‒104. DOI: 10.15406/ipmrj.2020.05.00238
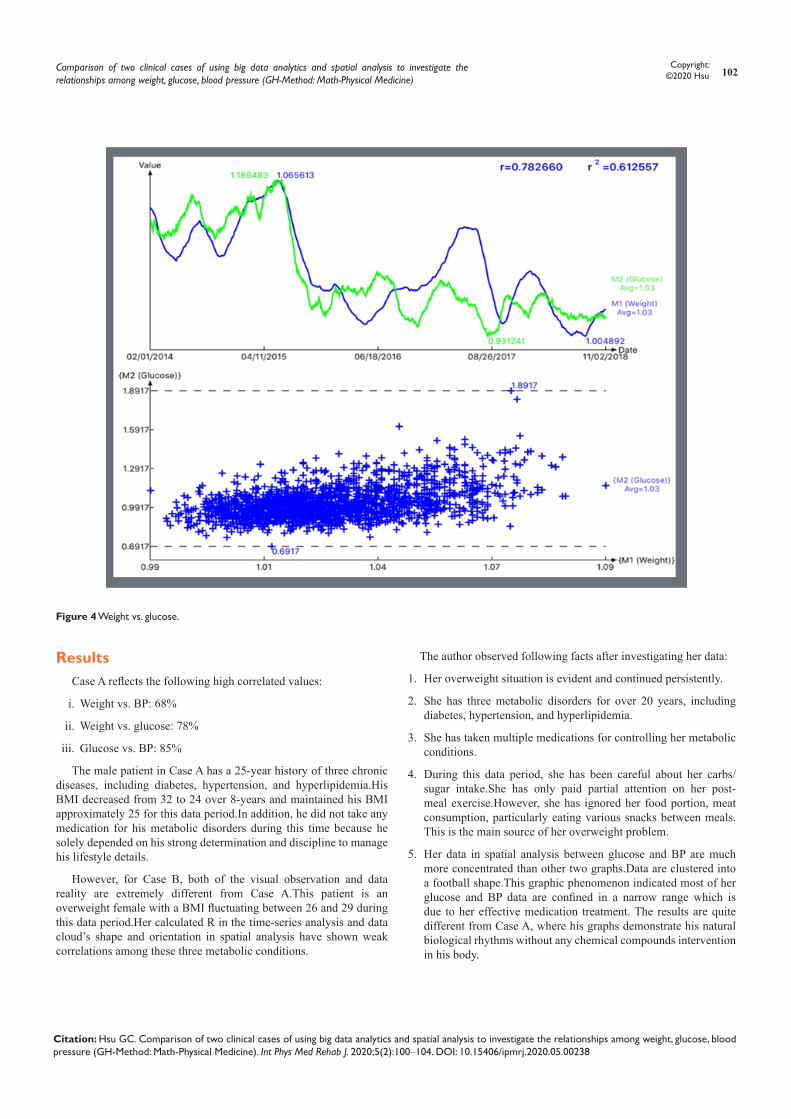
Figure 4 Weight vs. glucose.
ResultsCase A reflects the following high correlated values:
i. Weight vs. BP: 68%
ii. Weight vs. glucose: 78%
iii. Glucose vs. BP: 85%
The male patient in Case A has a 25-year history of three chronic diseases, including diabetes, hypertension, and hyperlipidemia.His BMI decreased from 32 to 24 over 8-years and maintained his BMI approximately 25 for this data period.In addition, he did not take any medication for his metabolic disorders during this time because he solely depended on his strong determination and discipline to manage his lifestyle details.
However, for Case B, both of the visual observation and data reality are extremely different from Case A.This patient is an overweight female with a BMI fluctuating between 26 and 29 during this data period.Her calculated R in the time-series analysis and data cloud’s shape and orientation in spatial analysis have shown weak correlations among these three metabolic conditions.
The author observed following facts after investigating her data:
1. Her overweight situation is evident and continued persistently.
2. She has three metabolic disorders for over 20 years, including diabetes, hypertension, and hyperlipidemia.
3. She has taken multiple medications for controlling her metabolic conditions.
4. During this data period, she has been careful about her carbs/sugar intake.She has only paid partial attention on her post-meal exercise.However, she has ignored her food portion, meat consumption, particularly eating various snacks between meals.This is the main source of her overweight problem.
5. Her data in spatial analysis between glucose and BP are much more concentrated than other two graphs.Data are clustered into a football shape.This graphic phenomenon indicated most of her glucose and BP data are confined in a narrow range which is due to her effective medication treatment. The results are quite different from Case A, where his graphs demonstrate his natural biological rhythms without any chemical compounds intervention in his body.

Comparison of two clinical cases of using big data analytics and spatial analysis to investigate the relationships among weight, glucose, blood pressure (GH-Method: Math-Physical Medicine)
103Copyright:
©2020 Hsu
Citation: Hsu GC. Comparison of two clinical cases of using big data analytics and spatial analysis to investigate the relationships among weight, glucose, blood pressure (GH-Method: Math-Physical Medicine). Int Phys Med Rehab J. 2020;5(2):100‒104. DOI: 10.15406/ipmrj.2020.05.00238
Figure 5 Weight vs. FPG & weight vs. PPG.

Comparison of two clinical cases of using big data analytics and spatial analysis to investigate the relationships among weight, glucose, blood pressure (GH-Method: Math-Physical Medicine)
104Copyright:
©2020 Hsu
Citation: Hsu GC. Comparison of two clinical cases of using big data analytics and spatial analysis to investigate the relationships among weight, glucose, blood pressure (GH-Method: Math-Physical Medicine). Int Phys Med Rehab J. 2020;5(2):100‒104. DOI: 10.15406/ipmrj.2020.05.00238
ConclusionClinical Case A has three strong R values existing among weight,
BP, and glucose.As a result, his three metabolic syndromes are related to each other in a natural way without medication intervention.
Clinical Case B demonstrates that medications are effective in controlling her chronic conditions combined with her partial effort on lifestyle management.However, her being overweight still represents a risk on her overall health.
The author did not discover any new findings by using the math-physical medicine approach; however, he was able to offer additional mathematical proof and quantitative evidence of metabolic disorder control via both lifestyle management and medication treatment.1–5
AcknowledgmentsFirst and foremost, the author wishes to express his sincere
appreciation to a very important person in his life, Professor Norman Jones at MIT and University of Liverpool. Not only did he give him the opportunity to study for his PhD at MIT, but he also trained him extensively on how to solve difficult problems and conduct any basic scientific research with a big vision, pure heart, and integrity.
The author would also like to thank Professor James Andrews at the University of Iowa. He helped and supported him tremendously when he first came to the United States. He believed in him and prepared
him to build his solid engineering and computer science foundation. He is forever grateful to his mentor, who has a kind heart and guided him during his undergraduate and master’s degree work at Iowa..
Conflicts of interestThe author declares no conflict of interest.
References1. Hsu, Gerald C. Using math-physical medicine to control T2D
via metabolism monitoring and glucose predictions. Journal of Endocrinology and Diabetes. 2018;1(1):1–6.
2. Hsu, Gerald C. Using Math-Physical Medicine to Analyze Metabolism and Improve Health Conditions. Video presented at the meeting of the 3rd international conference on endocrinology and metabolic syndrome 2018, Amsterdam, Netherlands. 2018.
3. Hsu, Gerald C. Using signal processing techniques to predict PPG for T2D. International Journal of Diabetes & Metabolic Disorders. 2018;3(2):1–3.
4. Hsu, Gerald C. Using math-physical medicine and artificial intelligence technology to manage lifestyle and control metabolic conditions of T2D. International Journal of Diabetes & Its Complications. 2018;2(3):1–7.
5. Hsu, Gerald C. A clinic case of using math-physical medicine to study the probability of having a heart attack or stroke based on combination of metabolic conditions, lifestyle, and metabolism index. Journal of Clinical Review & Case Reports. 2018;3(5):1–2.