Embed Size (px)
Citation preview
For permission to copy or republish, contact the American Institute of Aeronautics and Astronautics 370 L'Enfant Promenade, S.W., Washington, D.C. 20024
Dow
nloa
ded
by N
ASA
GL
EN
N R
ESE
AR
CH
CE
NT
ER
on
Mar
ch 2
, 201
6 | h
ttp://
arc.
aiaa
.org
| D
OI:
10.
2514
/6.1
991-
3132
COMPARISON OF TURBINE BYPASS AND MlXED FLOW TURBOFAN E N G W FOR A HIGH-SPEED C M L TRANSPORT
Jonathan A. Seidel William J. Haller Je&y J. Berton
Aeropropulsion Analysis Office NASA Lewis Research Center
Cleveland, Ohio
Abstract
There is renewed interest in developing an economically viable, environmentally acceptable commercial supersonic transport to begin operation early in the twenty-first century. The turbine bypass engine and the mixed flow turbofan are two of the candidate propulsion systems for this aircraft. A comparison of these two cycles for a Mach 2.4 cruise application is presented.
A parametric assessment is conducted for each cycle. Parameters that are investigated for the turbine bypass engine include design bypass, combustor exit temperature, and overall pressure ratio. Parameters that are investigated for the mixed flow turbofan include fan pressure ratio, mixer design pressure ratio, and combustor exit temperature. The attractive engines are then analyzed for a 5000 nautical mile, all supersonic cruise mission to determine the aircraft takeoff gross weights. The effects of takeoff noise, cruise emissions, the addition of subsonic cruise legs, and constrained supersonic cruise altitudes are also evaluated
Introduction
Several attempts have been made over the past quarter century to develop an economically viable, environmentally acceptable supersonic commercial transport. The U.S. Supersonic Transport Program, which ran from the mid 1960s until 1971, focused on establishing a cruise Mach number, airpIane, and engine that could compete in the international supersonic transport marketplace. The program was cancelled when political suppoa waned in the face of increasing technical, environmental, and economic concerns. From 1972 to 1981, NASA conducted the Supersonic Cruise Research Program. This cooperative govemment- industry effort investigated areas where advanced technology would produce significant enhancements in supersonic cruise performance. New engine concepts
were developed, as well as better noise reduction techniques (Ref. 1). More recently, the NASA- sponsored High Speed Research Program was initiated in 1989 with the objective of providing solutions to the environmental issues associated with a proposed future high speed civil transport. NASA-sponsored studies involving airframe and engine manufacturers have suggested that an economically viable, environmentally acceptable Mach 2.4 high-speed civil transport with a 2005 entry into service date is possible.
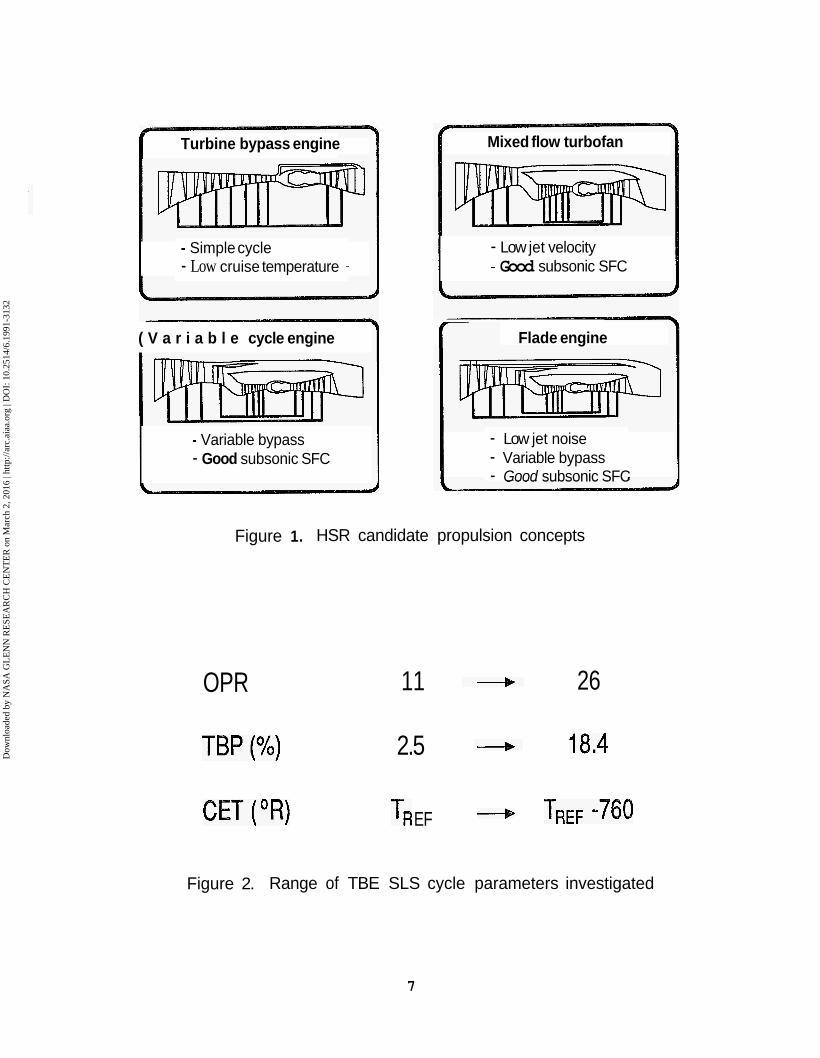
Contracts have been issued to study four engines as prime propulsion candidates for a high-speed civil transport. Several other cycles, however, are under evaluation by both engine manufacturers and NASA. The four cycles along with their primary performance benefits are shown in Figure 1. The turbine bypass engine (TBE) is desirable because of its high specific thrust and reasonable subsonic cruise performance due to the bypass valve. The mixed flow turbofan @IFIF) provides relatively low jet velocities and thrust specific fuel consumption (TSFC) rates due to its bypass ratio. The variable cycle engine is very similar to the MFlF except for the addition of a second bypass duct which yields greater flexibility in cycle operation at both high flight speeds and part power engine operation. The Hade cycle is a derivative of the variable cycle engine with an additional tip fan and bypass duct used to increase engine airflow during takeoff, thereby reducing jet noise. This paper analyzes and compares the TBE and MFI'F engine cycles for a Mach 2.4 high-speed civil transport. The other concepts are being investigated in separate studies.
Methods of Analysis
Cycle and mission analyses are conducted for the TBE and MFTF using materials and other technology limitations identified by NASA and industry commensurate with a 2005 entry into service date. The IWEP89 computer code is used to perform the
Copyright (D 1991 by the American Institute of Aeronautics and Astronautics, Inc. No copyright Is asserted In the United States under Tttle 17, US . Code. The U.S. Oovernment has a royalty-free license to exerclse all ahts under the copyright clalmed hereh for Governmental purposes. All other rights are resewed by the copyright owner.
Dow
nloa
ded
by N
ASA
GL
EN
N R
ESE
AR
CH
CE
NT
ER
on
Mar
ch 2
, 201
6 | h
ttp://
arc.
aiaa
.org
| D
OI:
10.
2514
/6.1
991-
3132
thermodynamic cycle analysis (Ref. 2). Preliminary cycle screening is conducted on the basis of uninstalled performance, with final mission results performed using data which incorporates the installation effects.
Engine weights and dimensions are calculated using a modified version of a Boeing weight estimation code (Ref. 3). Inlet weights are computed from a semi- analytical method incorporating empirical actuation system weights and structural weights modeled using the Internally Pressurized Structural Synthesis and Optimization code (Refs. 4, 5). Mixedejector nozzle weights are obtained from empirical correlations berived from contractor studies currently in progress. Miscellaneous pod weights (e.g., nacelle, pylon, mounts, etc.) are computed using semi-analytical relations for commercial transports (Refs. 5,6,7).
Engine installation effects are accounted for in the mission analysis using an axisymmetric translating centerbody inlet and an axisymmetric plug nozzle (Ref. 5). Inlet installation effects include bypass drag, bleed drag, pre-entry spill drag, and cowl lip losses. Nozzle installation effects include aftbody pressure drag. These installation drags, as well as nacelle drag, are scaled as the engine is sized during the mission and sizing analysis. Both engine types are assumed to be able to be integrated with the airframe such that aerodynamic interference drag penalties are equivalent. In addition, lower nozzle performance is used at takeoff to account for the performance decrement due to deployment of noise suppressors.
Mission and sizing analyses are performed on the most attractive cycles using the Aircraft Sizing Program (Ref. 8). Aerodynamic data and aircraft component weights are representative of a Mach 2.4 advanced high-speed civil transport. The aircraft is of an arrow wing design, with technology representative of a 2005 entry into service. Sideline and community noise calculations are performed using the Footprint Noise Analysis code (Ref. 9). The jet noise model used is the Motsinger-Sieckman model (Ref. lo), which is incorporated into the Footprint Noise Analysis code for the purpose of this study.
Results and Discussl 'on
At the outset of the screening process, a set of cycle ground rules were agreed upon by NASA, mneral Electric, and Pratt & Whilney with respect to maximum component efficiencies, compressor exit temperature (T3), and combustor exit temperature (CET). These values have been omitted from this paper due to their proprietary nature. Therefore, in the TBE results, CET is represented as the baseline maximum CET attainable for the given technology less a design temperature
2
increment (ACET). Since the baseline airplane's cruise characteristics are known, an approximate d s e thrust can be defined A cruise thrust band equal to ten percent on either si& of this value was established as an acceptable range for the initial cycle screening. This band represents the possible values of cruise thrust which will be needed and is denoted in all of the performance curves. Previous NASA in-house studies (Ref. 11) have shown that, depending on the effectiveness of the aircraft's takeoff lift coefficient, the engines are usually sized to satisfy the takeoff field length constraint. Consequently, for purposes of comparison, it is decided that all engines in this study be sized to deliver a prescribed sea level static (SLS) thrust.
TBE Cycle Analysis
The single-spool TBE is similar to that of a turbojet operating with a fixed area, choked turbine. The advantage of the TBE over the -jet is a bypass valve which allows the cycle to maintain constant turbine corrected airflow throughout the flight envelope without throttling. Bypassing a nominal amount of compressor discharge air around the combustor and the turbine, rather than throttling, produces higher cycle pressures and temperatures while maintaining total engine airflow. In addition, the bypass flow helps maintain high engine airflow during part-power operation, thereby reducing spillage and boattail drags.
Cycle parameters assessed for the TBE are CET, overall pressure ratio (OPR), and turbine bypass (TBP). The parameters are shown in Figure 2 with the range being investigated Based on previous studies of cruisedominated missions, cruise TSFC has been shown to be a key discriminator between potential cycle candidates. Engine weight is considered to be a secondary cycle discriminator. An initial screening resulted in eleven TBE cycles which warranted further investigation. These candidates along with key sea level static cycle parameters are shown in Figure 3. The jet velocities quoted conrespond to a maximum power takeoff without noise suppression. CET varies from the baseline technology limit (TBE1) to 760"R less than the baseline (TBES).
As shown in Figure 4, for a given design CET, the lowest TSFC cycle corresponds with the highest OPR. This result is due to the higher thermal efficiency of the high OPR cycles. Higher OPR designs show a slightly lower cruise thrust, indicating that higher OPR TBEs may require slight oversizing in order to meet thrust requirements at Mach 2.4. Because required engine size varies less than four percent with OPR, the highest OPR cycle, keeping with the established T3 limit, is chosen for the continuation of these studies due
Dow
nloa
ded
by N
ASA
GL
EN
N R
ESE
AR
CH
CE
NT
ER
on
Mar
ch 2
, 201
6 | h
ttp://
arc.
aiaa
.org
| D
OI:
10.
2514
/6.1
991-
3132
to its low TSFC, Engine weight varies less than six percent over the range of OPRs being investigated; therefore, the choice of the highest attainable OPR (17.5 at sea level static) is warranted for a cruise dominated mission.
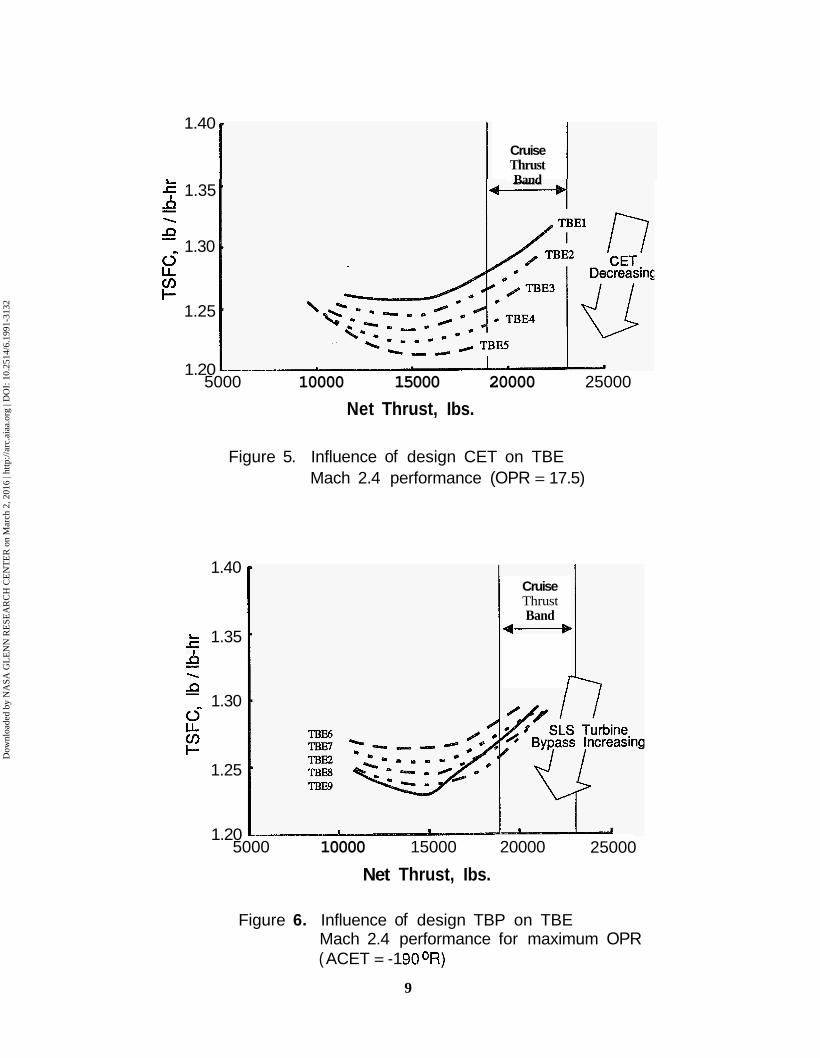
High CJ3T cycles produce the greatest specific thrust. These cycles, as shown in Figure 5 , also produce the highest cruise thrust and TSFC. However, high CET designs yield high takeoff jet velocities (approximately 24 percent difference from TBEl to TBE5). Lower CET cycles yield improved TSFCs and lower takeoff jet velocities, but also require a larger engine size (approximately 27 percent difference from TBEl to TBE5) to meet the thrust requirements. Because the cruise thrust for low CET designs is comparatively small, very low CET designs must be oversized to meet the required Mach 2.4 thrust,
Assessing the tradeoffs between high and low CET cycles, two mid range ACET designs are selected: -190"R and -570"R. The -190"R ACET cycle (TBEZ) provides good specific thrust with adequate cruise TSFC and a more easily suppressible jet velocity than higher CET designs. The -570"R ACET cycle (TBE4) provides an even lower jet velocity, a 4.1 percent improvement in subsonic and supersonic cruise TSFC versus TBEZ, and would need little, if any, oversizing to meet the cruise thrust requirements.
The percentage of total engine airflow bypassed around the high pressure turbine is examined in Figure 6. The maximum OPR attainable is used in order to fiilly realize any TSFC benefits. For this OPR, a sea level static TBP of approximately ten percent yields zero bypass flow at Mach 2.4 maximum throttle. A sea level static TBP greater than ten percent yields a small amount of bypass flow at Mach 2.4 maximum power. A sea level static TBP of less than ten percent yields zero bypass flow at some Mach number less than 2.4. Hence, in the latter scenario, to control the turbine corrected flow without the use of TBP, shaft speed and compressor pressure ratio must decrease. To award the same TSFC benefits of the highest allowable compressor exit temperature, the low TBP cycles are designed with a slightly higher sea level static OPR (approximately 19). This allows the low TBP cycles to achieve an OPR after shaft speed reduction at top of climb equal to that of the high TBP cycles.
Higher TBP cycles exhibit improved TSFCs over their low TBP counterparts, as shown in Figure 6. The higher bypass cycles deliver lower specific thrust and, consequently, are sized larger than the low TBP cycles for the required sea level static thrust. Takeoff jet velocities for the low TBP cycles are as much as 18
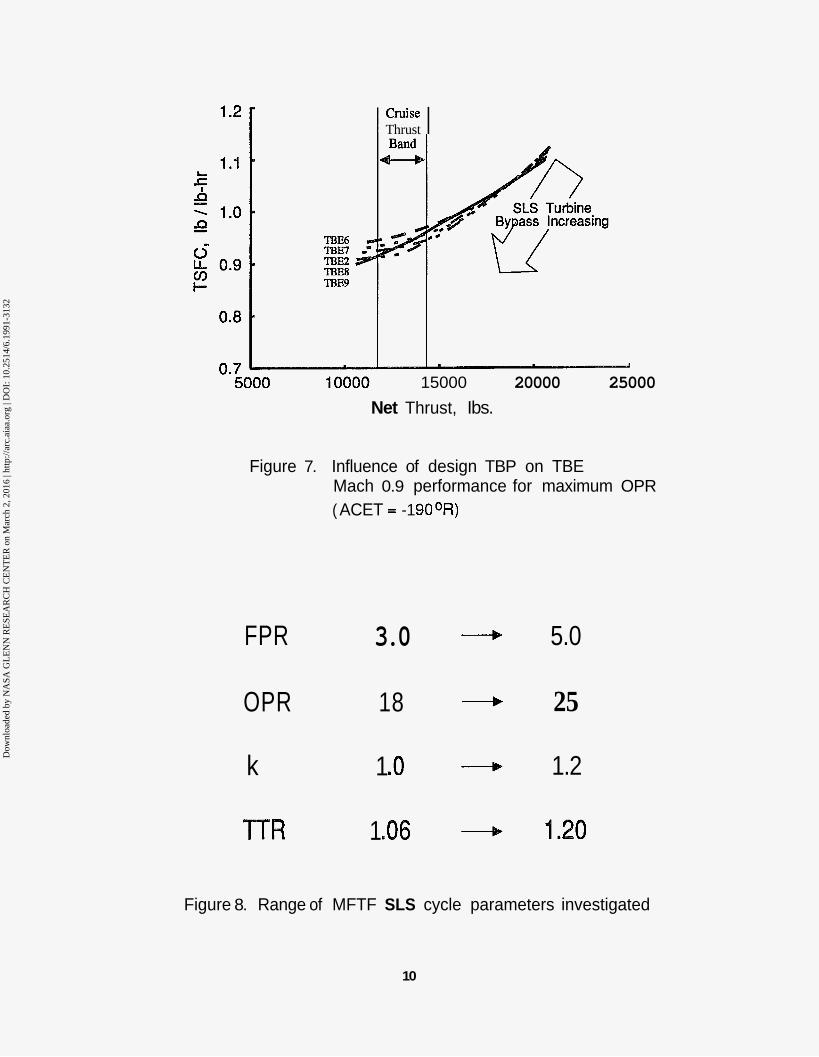
percent greater than the high TBP designs, thus indicating a greater takeoff noise suppression requirement. The higher TBP cycles exhibit steeper TSFC gradients during part power operation. An optimum sea level static TBP for a given CET and OPR can be chosen: 10.1 percent for ACET = -190"R and 10.6 percent for ACET = -570°R, companding to a sea level static OPR of 17.5. Subsonic cruise performance trends, illustrated in Figure 7, are similar to that of supersonic cruise.
A higher design TBP (TBE8) is also considered for the higher CET cycle despite the slightly lower specific thrust. The steeper TSFC gradient for both subsonic and supersonic cruise, coupled with a slightly lower takeoff jet velocity, makes 13.8 percent sea level static TBP desirable when considering a mission with a possible subsonic cruise leg. Higher TBP designs, however, require excessive oversizing and produce higher TSFCs despite the steeper gradient, Low design CETs demonstrate less benefit from higher TBPs.
MFl"€7 Cycle Analysis
The METF being analyzed in this study is a twin-spool engine with variable mixer primary and secondary inlet areas to provide greater cycle flexibiJity. Although each inlet area is allowed to vary for optimal performance, a constant total area is maintained This engine uses a throttle ratio, "R, which is the ratio of maximum CET to the sea level static CET. Hence, for a 'ITR greater than Unity, the CET increases with flight Mach number (Le., ram temperature) in order to keep the fan's corrected airflow and pressure ratio near their design (maximum) values. Once the maximum CET is encountered, it is held constant, thereby forcing the low spool speed to decrease and the thrust to lapse. All MFIFs operate at maximum CET at Mach 2.4, full power.
There are four cycle design parameters being investigated for the MFIF, as shown in Figure 8. A broad range for each variable is examined to find the best engine. The range of fan pressure ratios (FPRs) dictates the use of a three stage fan for pressure ratios above 4.0. The OPR is shown to be tied directly to TTR to ensure that the cycle operates at maximum allowable T3 at top of climb. Maximum T3 is necessary to obtain optimum cycle thermal efficiency. The mixer pressure ratio, k, is the ratio of mixer secondary to primary sea level static total pressure.
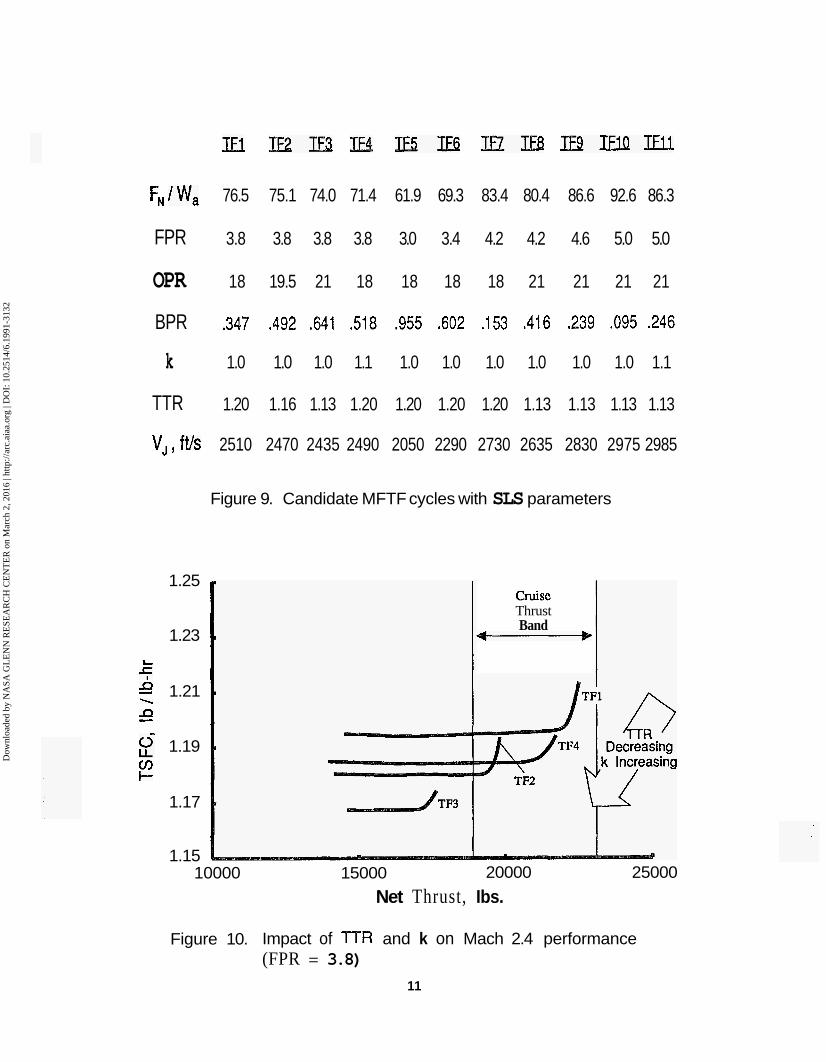
An initial screening process has established a group of candidate MFTFs. They are shown in Figure 9 with key sea level static parameters. As with the TBE, the jet velocities shown in tbe figure correspond to a
3
Dow
nloa
ded
by N
ASA
GL
EN
N R
ESE
AR
CH
CE
NT
ER
on
Mar
ch 2
, 201
6 | h
ttp://
arc.
aiaa
.org
| D
OI:
10.
2514
/6.1
991-
3132
maximum power takeoff without noise suppression. Since all engines were sized for a similar takeoff thrust, the specific thrust values shown in Figure 9 depict a wide range of engine sizes. There is an approximately 33 percent increase in engiue airflow from the smallest (TF10) to the largest (TF5).
A few engines from Figure 9 are presented in Figure 10 to compare cruise thrust and SFC. As "TR is decreased (from TF1 to TF3), or sea level static CEJT is increased, the maximum thrust decreases significantly. Increasing the mixer pressure ratio, k, results in. higher BPR. For example, TF4 was designed with the same FPR, OPR and TTR as TF1 except that k is increased from 1.0 to 1.1 resulting in a BPR of 0.518. Figure 10 shows that despite a slight decrement in maximum thrust, a significant TSFC benefit is obtained TF4 appears to be the best selection of this group. TF3, although providing an excellent TSFC, most likely will need considerable oversizing to meet the cruise thrust requirement.
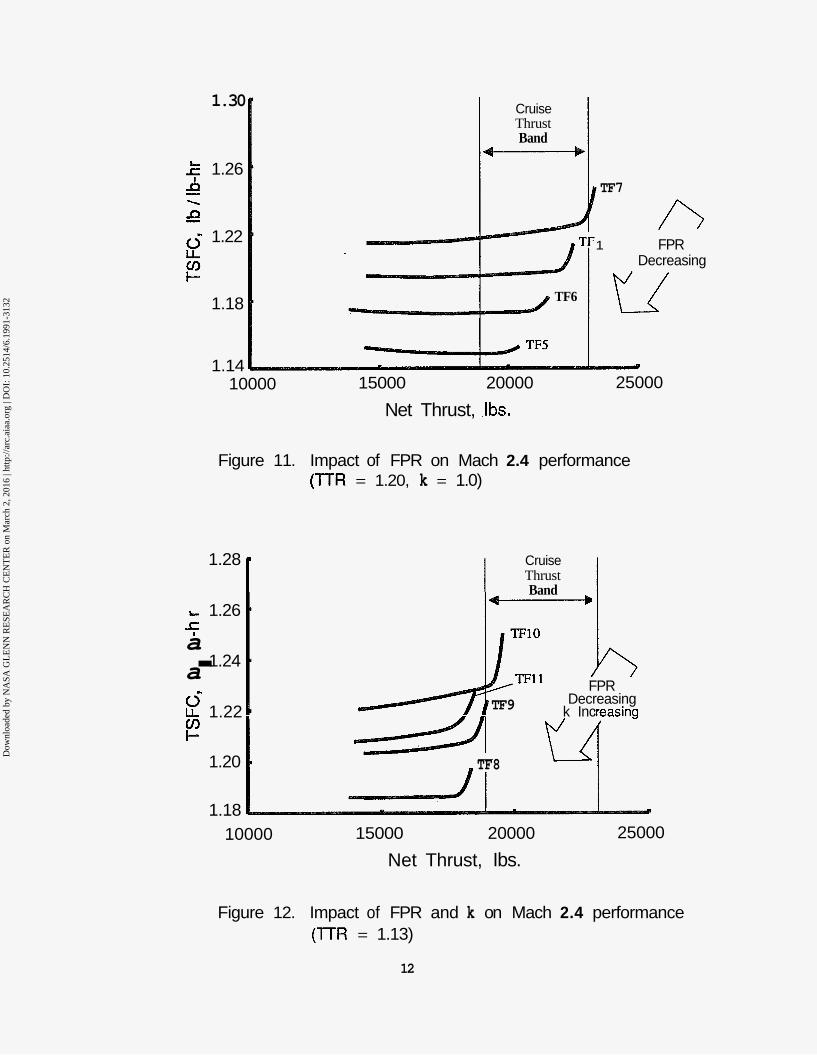
Other engines ftom the table in Figure 9 are shown in Figure 11 to illustrate the impact of FPR on cruise performance for a 'ITR = 1.20. As the design FPR is decreased from 4.2 (TF7) to 3.0 (TF5), the maximum thrust decreases, however, a large TSFC benefit is realized This result is obtained due to the substantial increase in BPR that is necessary to get a cycle match for the given l T R and k. Since all engines are sized for a constant takeoff thrust, the specific thrust decreases with sea level static FPR. Consequently, TF5 becomes a very large engine and may suffer severe installation penalties. TF6 appears to be a good compromise between the minimum TSFC engine and the smaller, but higher TSFC, options.
A range of FPRs for a TTR = 1.13 is illustrated in Figure 12. The specific thrusts for each of these engines is well above the other candidate MpI'Fs. Therefore, even if slight oversizing becomes necessary, these engines should sti l l be smaller than any of the other MFIl?s. As design FPR is dropped from 5.0 (TF10) to 4.2 (TF8), once again the maximum thrust decreases and the TSFC improves. TF8 provides the lowest TSM: in this group. Even with possible oversizing to meet the necessary cruise thrust, the engine size is acceptable. TF11 is similar to 'IF10 with the exception of k being increased from 1.0 to 1.1. Although TFlO has the highest specific thrust of all cycles analyzed, its TSFC is too Mgh. TF11 shows that by increasing k, a TSFC improvement can be obtained with only a minimal loss in maximum cruise thrust.
Weights and Installation
Based on the cycle screening procedure, seven engines are selected for the mission assessment: three TBEs (TBE2, TBm, TBE8) and four MFTFs (TF4, TF6, TF8, TF11). Using analyses described previously, pod weights for each of the engines are determined for a constant sea level thrust. A breakdown of these weights is shown in Figure 13.
Installed performance for each of the seven cycles is computed using Reference 5. Performance characteristics of an axisymmetric inlet with a translating centerbody are used to determine pressure recovery, airflow hctions, and inlet drags. Similarly, performance characteristics of an axisymmetric plug nozzle are used to determine the aftbody pressure drag. Interference effects due to propulsion/airframe integration are assumed equivalent for the TBE and MFTF.
Design Mission Analysis and Sizing
Using the installed engine performance and weight data described above, the three TBE and four MFTF cycles chosen are flown on a 5000 nautical mile, Mach 2.4, best available Breguet factor cruise design mission with reserves. Other types of missions, such as missions which incorporate subsonic overland cruise legs, are treated later as off-design missions of the sized aircraft. The wing and engine sizes for each aircraft are parametrically varied to obtain a minimum gross weight, design point aircraft. As the wing and engine vary in size, the aircraft weights and aerodynamics are systematically altered according to accepted methods applicable to high-speed transport aircraft. These sizing methods are described in detail in Reference 8. This analysis is graphically typified in so-called aircraft sizing "thumbprints," where the effects of constraining parameters can easily show the required minimum sizes of the engine and wing. The constraining p m e t e r s considered are: maximum fuel volume, 155 knot maximum approach speed, 45 minute maximum climb time, 11OOO foot maximum FAR 25 takeoff field length, and FAR 36 stage 3 maximum noise Limits for cases where a mixer-ejector nozzle is assumed to be unable to provide adequate noise suppression and a throttled takeoff must be employed.
The relationship between takeoff gross weight and sideline jet noise for the TBEM-powered aircraft is illustrated in Figure 14. This cycle serves as an example for the following discussion; the other cycles are analyzed in an anaIogous manner. The single point marked "baseline" represents the gross weight and sideline jet noise produced by an aircraft with unsuppressed TBE4 engines fitted with conventional
4
Dow
nloa
ded
by N
ASA
GL
EN
N R
ESE
AR
CH
CE
NT
ER
on
Mar
ch 2
, 201
6 | h
ttp://
arc.
aiaa
.org
| D
OI:
10.
2514
/6.1
991-
3132
nozzles. The jet noise analysis employed is the derivative of the Motsinger-Siedman method for conical, convergent nozzles operating at takeoff conditions equivalent to the TBE4's ideal exhaust conditions. The air& is analytically flown on a trajectory past community and sideline observers and their effective perceived noise levels are computed Corrections to the source noise consided am: forward velocity attenuation, atmospheric and ground attenuation, engine-by-engine shielding, and throttle cutback at the minimum cutback altitude. The point immediately above the baseline represents the gross weight and sideline jet noise of the aircraft when the additional weight and takeoff performance penalties of a mixer-ejector noise suppression nozzle has been added, but no noise benefits occur. Using such a nozzle relative to a conventional nozzle, in this particular case, incurs a 3.4 percent gross weight penalty. The curve rising from this point represents the noise reduction obtained by using larger engines and throttling them at takeoff. Such a technique is useful since jet noise is a much stronger function of jet velocity, or throttle setting, than the actual size of the jet. The gross weight penalty of this procedure is minimized by following the locus of minimum gross weights as the engine and wing grow in size. The gross weight penalty described by this curve assumes that any noise suppression required is achieved through engine oversizing and throttling alone, and not by other potentially available methods, such as aircraft operational techniques (e.g., high-lift devices, programmed throttle lapse rate, etc.). The severity of this gross weight increase may be lessened by designing a new aircraft for each engine and wing size, rather than by sizing a baseline aircraft with given characteristics. The family of curves shown towards lower sideline noise levels is a way to parametrically represent the amount of noise suppression a mixer-ejector nozzle wiJl achieve. These c w e s are simple five decibel subtractions from the original rightmost curve. Until aeroacoustic test results are available, this method can, with reasonable accuracy, predict the gross weight increases which would be brought about by oversizing the engines if the required jet noise suppression is not achieved.
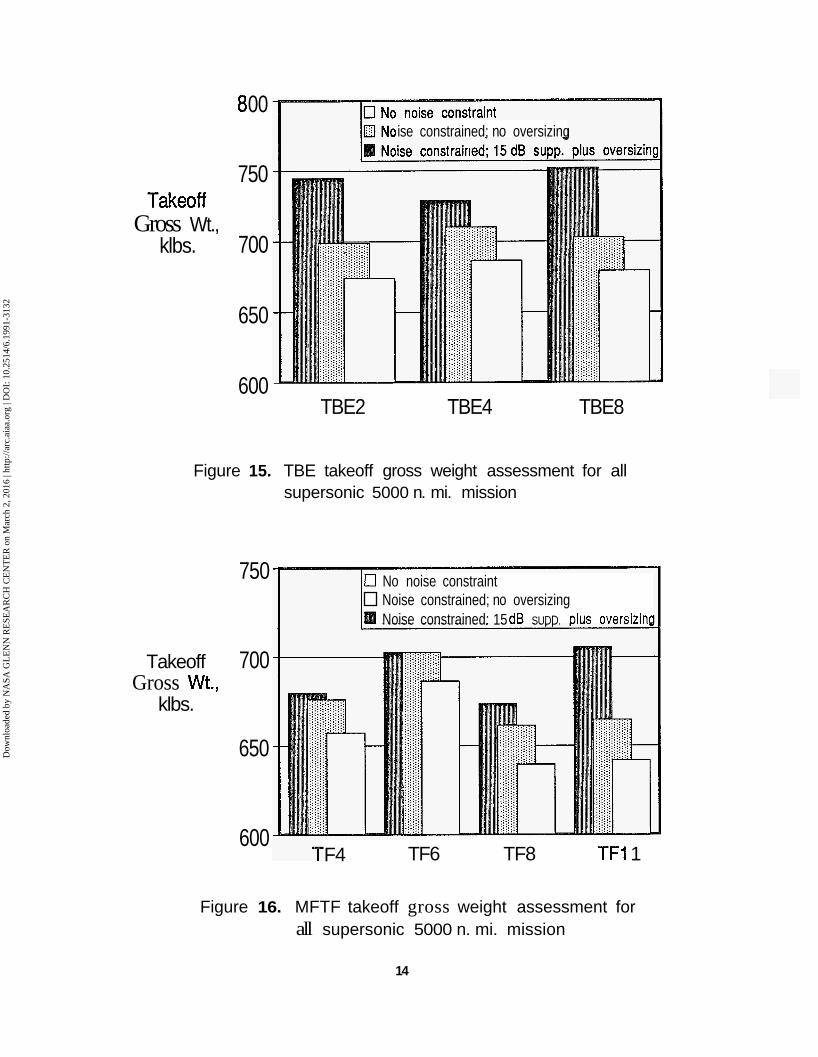
Figure 15 is a comparative gross weight representation of the three TBEpowered aircraft. The columns in the foreground represent the aircraft gross weights if the engines were allowed to ideally expand their flows through simple nozzles. These are the unconstrained noise cases. The middle columns represent the higher aircraft gross weights if mixer- ejector nozzles were attached, thereby adding weight and takeoff performance penalties. These nozzles are assumed to provide as much noise suppression as is necessary for each of the cycles. The dark columns in the background represent the aircraft gross weights if these mixer-ejector nozzles are capable of providing
5
only fifteen decibels of suppression over a simple convergent, conical nozzle operating at the same conditions. This gross weight penalty is due to the undesirable oversizing of the engine and wing described above to achieve acceptable sideline noise levels. Figure 16 is a similar comparative gross weight representation of the four METF-powered aircraft.
A relatively small six percent gross weight advantage is evident for the lightest noise-sized MFTF aircraft when compared to the lightest noise-sized TBE aircraft. This more detailed parametric gross weight evaluation substantiates the similar conclusion drawn in a previous analysis (Ref. 11). This small gross weight advantage is further accentuated, however, when the possibility of a noise suppressor nozzle with limited capability is introduced Should this happen, the inherently quieter MFlF engines require less engine oversizing for noise reduction than would their TBE counterparts. This fact is apparent graphically by the larger engine oversizing gross weight increases (Le., the dark columns in Figures 15 and 16) of the TBEpowered aircraft relative to the hEIF-powered aircraft.
Emissions for each of the noise-constrained aircraft (Le., the aircraft represented by the middle columns in Figures 15 and 16) are also calculated The cornlation used is a relation of the nitrogen oxides (NO,) with several thermodynamic engine parameters based on results from the NASA Energy-Efficient Engine CIean Combustor program adjusted for the projected level of emissions for advanced lean premixed, prevaporized combustors. The amounts of NO, generated during the cruise portion of the design mission is shown for each of the seven aircraft in Figure 17. Since combustor conditions for the candidate engines are roughly similar, NO, generation is not, at this time, a potential engine discriminator.
Off-Design Mission Analysis
Due to potential sonic boom restrictions during overland flight, one off-design mission of interest is one which incorporates an overland subsonic leg. This subsonic leg may either be flown before or after the main supersonic cruise leg. These are designated outbound or inbound legs, respectively. The total range penalty for the noise-constrained TBE and MFI'F-powered aircraft for various outbound subsonic leg distances is illustrated in Figure 18. Both the subsonic cruise Mach number and altitude of the sized design point aircraft were parametrically varied during this off-design mission to yield the maximum possible total range. It is apparent from the figure that the inclusion of a subsonic leg does not seriously erode the total range performance of either aircraft type. The slight advantage of the TBEpowered
Dow
nloa
ded
by N
ASA
GL
EN
N R
ESE
AR
CH
CE
NT
ER
on
Mar
ch 2
, 201
6 | h
ttp://
arc.
aiaa
.org
| D
OI:
10.
2514
/6.1
991-
3132
aircraft over the MFI'F-powered aircraft in total range performance is offset, however, by the amount of fuel burned The TBE aircraft fly farther off-design missions, but consume slightly more fuel in doing so. This range degradation penalty would be lessened had a subsonic cruise leg been included in the design mission profile.
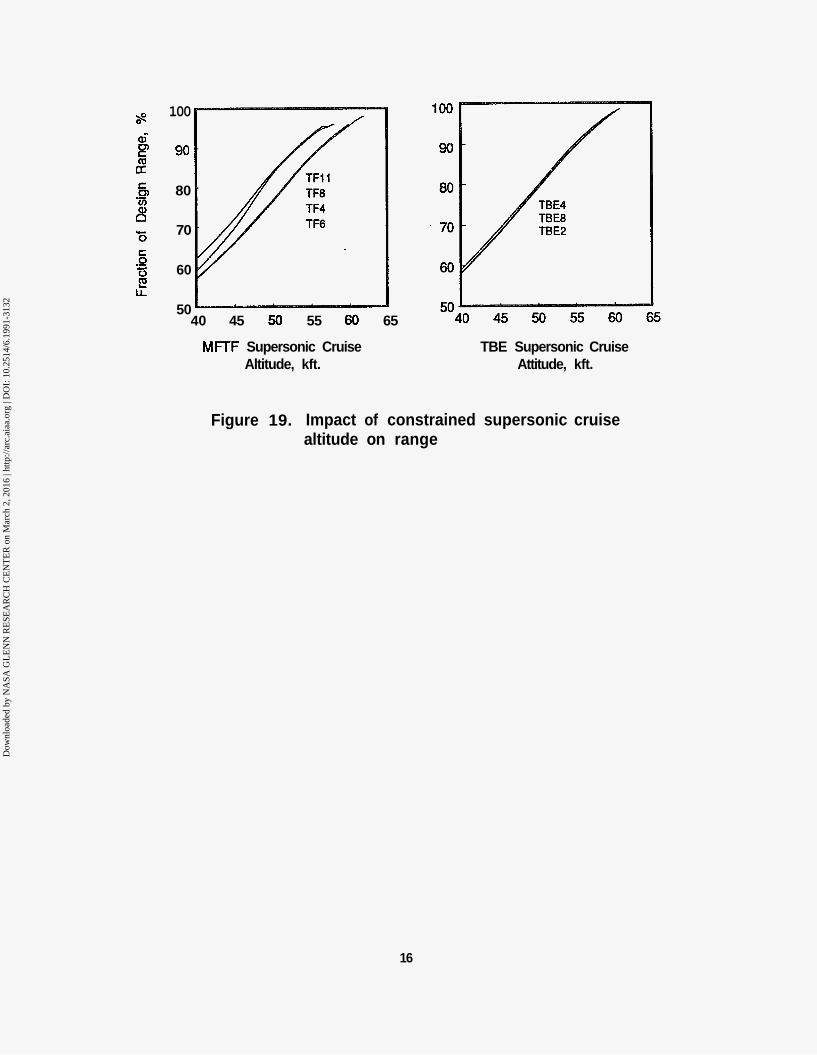
Another off-design mission of interest is one which the aircraft is forced to fly at a lower, less than ideal, constant-altitude cmise. This type of mission may be employed to reduce the atmospheric ozone damage if sufficiently clean combustors cannot be developed One study (Ref. 12) has shown that, under certain circumstances, by cruising at an altitude ten thousand feet less than the ideal Breguet cruise altitude, a decrease in ozone depletion of fifty percent might be realized The influence of cruise altitude on range for both the TBE and MFl'F-powered aircraft is illustrated in Figure 19. Note that, since an ideal Breguet factor cruise is not employed, the range is always less than the 5000 nautical mile design range. Although lowering the cruise altitude seriously erodes the total range, there is not a significant performance difference between either aircraft type.
Concluding Rem&
Based on the all-supersonic design mission evaluation, the best MEIT-powered aircraft exhibits a six percent lower takeoff gross weight than the best TBE-powered aircraft. This conclusion assumes that both types of propulsion systems can be integrated with the airframe such that aerodynamic interference penalties are equivalent. Due to the larger engine sizes of the MFlTs, the interference drags may be more difficult to minimize than the TBE's interference drags. The TBE, however, is a riskier cycle concept than the inherently quieter MFI'F if a mixer-ejector nozzle with adequate jet noise suppression cannot be developed Off-design mission analyses @e,, constrained altitude and subsonic cruise leg missions) do not show substantial cycle-dependent range degradations. Therefore, the choice of design mission parameters wiU be a stronger Muence on cycle selection. For example, if the design mission includes a significant subsonic cruise leg, the best MFTP would most likely tend toward the higher bypass designs. Due to the advanced combustor technology used in this study, cruise emissions for all candidate cycles are less than Present-day transports. Cycle variations of these engines were found to have little influence on the cruise NO, emissions. Expanded studies are needed to address all attractive engine concepts, incorporate propulsiodairfmne integration effects, and include evolving mixer-ejector nozzle experimental results. The fidelity of the analyses employed will improve as new data become available.
'
References
1. Fishbach, L. H.; Stitt, L. E.; Stone, J. R.; and Whitlow, Jr., J. B.: "NASA Research in Supersonic Propulsion - A Decade of Progms." NASA 7'M-82862, 1982.
2. Plencner, Robert M.; and Snyder, Christopher A.: 'The Navy / NASA Engine Program o\TNEP89) - A User's Manual." NASA TM-105186,1991.
3. Onat, E.; and Klees, G. W.: "A Method to Estimate Weight and Dimensions of Large and Small Gas Turbine Engines." NASA CR-159481,1979.
4. Moses, Paul L.; and Jones, Stuart C.: "Internally Pressurized Structural Synthesis and Optimization Code." Documentation, fhst updated release: April 24, 1987, NASA LaRC.
5. Kowalski, Edward J.; and Atkins, Jr., Robert A.,: "A Computer Code for Estimating Installed Performance of Aircraft Gas Turbine Engines," Volume I, 11, III. NASA CR-159691,159692,159693,1979.
6. "Methods for Comparative Evaluations of Propulsion System Designs for Supersonic Aircraft." Los Angeles Aircraft Division of Rockwell International Corporation. NASA CR-135110,1976.
7. Schmidt, Arling H.: "Preliminary Weight Kstimation of Engine Section Structure." SAWE Paper No. 1311, Index Category No. 23,1979.
8. Fetterman, Jr., David E.: "Preliminary Sizing and ' Performance of Aircraft." NASA TM-86357,1985.
9. Clark, B. J.: A Computer Program to Predict Aircraft Noise Levels. NASA TP-1913,1981.
10. Gliebe, P. R.; Motsinger, R.; and Sieckman, A.: "High Velocity Jet Noise Source Location and Reduction, Task 3 - Experimental Investigation of Suppression Principles." Report No. FAA-RD-76-79, III-I (R78AEG27), 1978.
11. Berton, J. J.; Haller, W. J.; Seidel, J. A,; and Senick, P. F.: "A NASA Lewis Comparative Propulsion System Assessment for the High-speed Civil Transport." F i Annual High-Speed Research Workshop, May 14- 16,1991, WiUiamsburg, VA.
12. Johnston, H. S.; Kinnison, D. E.; and Wuebbles, D. J.: "Nitrogen Oxides from High-Altitude Aircraft: an Update of Potential Effects on Ozone." Journal of Geophysical Research, Vol. 94, Nov. 20,1989.
6
Dow
nloa
ded
by N
ASA
GL
EN
N R
ESE
AR
CH
CE
NT
ER
on
Mar
ch 2
, 201
6 | h
ttp://
arc.
aiaa
.org
| D
OI:
10.
2514
/6.1
991-
3132
[ Turbine bypass engine
- Simple cycle - Low cruise temperature ~
( V a r i a b l e cycle engine
- Variable bypass - Good subsonic SFC
Mixed flow turbofan
- Low jet velocity - Good subsonic SFC
[-- Flade engine
- Low jet noise - Variable bypass - Good subsonic SFC
Figure 1. HSR candidate propulsion concepts
OPR 11
2.5
EF
26
Figure 2. Range of TBE SLS cycle parameters investigated
7
Dow
nloa
ded
by N
ASA
GL
EN
N R
ESE
AR
CH
CE
NT
ER
on
Mar
ch 2
, 201
6 | h
ttp://
arc.
aiaa
.org
| D
OI:
10.
2514
/6.1
991-
3132

TBEl TBE2 TBE3 TBE4 TBE6 TBE7 TBE8 TBEiQ --
1.40
L 1.35 f: d -0 1.30. \
c5 LL v)
i-= 1.25"
F$Wa 1012 96.7 91.8 86.6 80.6 104.0 100.4 92.9 88.7 94.7 96.1
- .
OPR
. 0
17.5 17.5 17.5 17.5 17.5 19.00 18.3 17.5 17.5 11.0 14.0
TBP, % 9.87 10,io 10.34 10.60 10.86 2.48 629 13.8 17.52 11.44 10.67
ACET,OR 0 -190 -380 -570 -760 -190 -190 -190 -190 -190 -190
VJ, ftlS 3246 3110 2962 2799 2617 3331 3224 2993 2867 3049 3094
Figure 3. Candidate TBE cycles with SLS parameters
1.20 5000 10000 15000 20000 25000
Net Thrust, Ibs.
Figure 4. Influence of design OPR on TBE Mach 2.4 performance (A C
8
Dow
nloa
ded
by N
ASA
GL
EN
N R
ESE
AR
CH
CE
NT
ER
on
Mar
ch 2
, 201
6 | h
ttp://
arc.
aiaa
.org
| D
OI:
10.
2514
/6.1
991-
3132
1.40
1.35 &! \
Cruise Thrust Band
&! 0”
1.30 LL v, I--
1.25
1.20 5000 10000 15000 20000 25000
Net Thrust, Ibs.
Figure 5. Influence of design CET on TBE Mach 2.4 performance (OPR = 17.5)
1.40
L 1.35 5 s 0 0”
\
1.30 LL v, t-
1.25
Cruise Thrust Band -
r
25000 1.20
5000 10000 15000 20000
Net Thrust, Ibs.
Figure 6. Influence of design TBP on TBE Mach 2.4 performance for maximum OPR ( ACET = -1 900R)
9
Dow
nloa
ded
by N
ASA
GL
EN
N R
ESE
AR
CH
CE
NT
ER
on
Mar
ch 2
, 201
6 | h
ttp://
arc.
aiaa
.org
| D
OI:
10.
2514
/6.1
991-
3132
Thrust Cruise I
TBE9
15000 20000 25000 Net Thrust, Ibs.
Figure 7. Influence of design TBP on TBE Mach 0.9 performance for maximum OPR ( ACET = -1 90'R)
FPR
OPR
k
3.0
18
1 .0
1 .o
5.0
25
1.2
Figure 8. Range of MFTF SLS cycle parameters investigated
10
Dow
nloa
ded
by N
ASA
GL
EN
N R
ESE
AR
CH
CE
NT
ER
on
Mar
ch 2
, 201
6 | h
ttp://
arc.
aiaa
.org
| D
OI:
10.
2514
/6.1
991-
3132
FN /wa
FPR
OPR
BPR
k
TTR
VJ I ft/s
1.25
1.23 L
5 1.21
\
A3 - 2 1.19 c/) I-=-
1.17
76.5 75.1 74.0 71.4 61.9 69.3 83.4 80.4 86.6 92.6 86.3
3.8 3.8 3.8 3.8 3.0 3.4 4.2 4.2 4.6 5.0 5.0
18 19.5 21 18 18 18 18 21 21 21 21
.347 .492 .641 ,518 .955 ,602 .153 .416 .239 .095 ,246
1.0 1.0 1.0 1.1 1.0 1.0 1.0 1.0 1.0 1.0 1.1
1.20 1.16 1.13 1.20 1.20 1.20 1.20 1.13 1.13 1.13 1.13
2510 2470 2435 2490 2050 2290 2730 2635 2830 2975 2985
Figure 9. Candidate MFTF cycles with SLS parameters
1.15 10000 15000
Cruise Thrust Band -
20000 25000 Net Thrust, Ibs.
Figure 10. Impact of TTR and k on Mach 2.4 performance (FPR = 3.8)
11
Dow
nloa
ded
by N
ASA
GL
EN
N R
ESE
AR
CH
CE
NT
ER
on
Mar
ch 2
, 201
6 | h
ttp://
arc.
aiaa
.org
| D
OI:
10.
2514
/6.1
991-
3132
1.30
1.26
1.22
1.18
1.14
Cruise Thrust Band
TF6
10000 15000 20000
Net Thrust, Jbs.
TF7
1 FPR Decreasing
25000
Figure 11. Impact of FPR on Mach 2.4 performance (TTR = 1.20, k = 1.0)
1.28
L 1.26 5 a . 1.24 a c5 u, 1.22 tn I--
1.20
1.18
Cruise Thrust Band -
TF8
FPR Decreasing
k Inc iasing TF9
10000 15000 20000
Net Thrust, Ibs. 25000
Figure 12. Impact of FPR and k on Mach 2.4 performance (TTR = 1.13)
12
Dow
nloa
ded
by N
ASA
GL
EN
N R
ESE
AR
CH
CE
NT
ER
on
Mar
ch 2
, 201
6 | h
ttp://
arc.
aiaa
.org
| D
OI:
10.
2514
/6.1
991-
3132

Bare engine wt. (wlaccs.)
Inlet wt.
Nozzle wt.
Nacelle & misc. pod wt.
Total pod wt.
-- TBE2 TBE4 - TF4 - TF11
6964 7934 7268 8272 8955 7301 7057
2900 3100 3020 3900 4000 3400 3100
3698 3879 3704 4158 3965 3967 3947
1043 1187 1089 1243 1306 1095 1072
14605 16100 15081 17573 18226 15763 15176
Figure 13. Breakdown of pod weights for selected engines for constant SLS thrust
Takeoff Gross Wt.,
klbs.
820
800
780
760
740
720
700
680 noise limit Baseline ,
90 95 100 105 110 115 120 ideline Noise (
Figure 14. Influence of sideline noise restrictions on aircraft size for TBE4
13
Dow
nloa
ded
by N
ASA
GL
EN
N R
ESE
AR
CH
CE
NT
ER
on
Mar
ch 2
, 201
6 | h
ttp://
arc.
aiaa
.org
| D
OI:
10.
2514
/6.1
991-
3132
00
750 Takeoff
Gross Wt., klbs. 700
650
600
ise constrained; no oversizing
TBE2 TBE4 TBE8
Figure 15. TBE takeoff gross weight assessment for all supersonic 5000 n. mi. mission
750
Takeoff 700 Gross Wt.,
klbs.
650
600
0 No noise constraint Noise constrained; no oversizing Noise constrained: 15 dB SUDD. ~lus oversizinfl
F4 TF6 TF8 TF1 1
Figure 16. MFTF takeoff gross weight assessment for all supersonic 5000 n. mi. mission
14
Dow
nloa
ded
by N
ASA
GL
EN
N R
ESE
AR
CH
CE
NT
ER
on
Mar
ch 2
, 201
6 | h
ttp://
arc.
aiaa
.org
| D
OI:
10.
2514
/6.1
991-
3132

n l o X 1 O 4 r
U
TBE2 TBE8 TBE4 TF4 TF6 TF8 TF11
Figure 17. Comparison of specific emissions for design mission
100
98
U c 96
8
El
E 94
0, v) .-
cc 0
100
98
96
94
92
9t-l
c 92 0
0 .- w
-- 500 1000 1500 e 90
L 0 500 1000 1500 0
MFTF Subsonic Cruise Distance, n. mi. TBE Subsonic Cruise Distance, n. mi.
Figure 18. Impact of offdesign subsonic cruise on range
15
Dow
nloa
ded
by N
ASA
GL
EN
N R
ESE
AR
CH
CE
NT
ER
on
Mar
ch 2
, 201
6 | h
ttp://
arc.
aiaa
.org
| D
OI:
10.
2514
/6.1
991-
3132
100
90
80
70
60
50 40 45 50 55 60 65
MFTF Supersonic Cruise Altitude, kft.
TBE Supersonic Cruise Attitude, kft.
Figure 19. Impact of constrained supersonic cruise altitude on range
16
Dow
nloa
ded
by N
ASA
GL
EN
N R
ESE
AR
CH
CE
NT
ER
on
Mar
ch 2
, 201
6 | h
ttp://
arc.
aiaa
.org
| D
OI:
10.
2514
/6.1
991-
3132