Embed Size (px)
Citation preview
Journal of Research of the National Bureau of Sta ndards Vol. 60, No.5, May 1958 Research Paper 2861
Comparison of Theoretical and Empirical Relations Between the Shear Modulus and Torsional Resonance Frequencies for Bars of Rectangular 'Cross Section
Sam Spinner and Rudolph C . Valore/ Jr.
The relations between t he modulus of elasticity ill shear and the fundalllen Lal Lors iolULI resonance frequency, mass, and dimensions for bars of rectangular cross secLioll h ,we been evaluated experimentally. The empirical relation was found to be less t han Lhc Lheoretical approximation given by Pickett by an amoun t increasing to about 1 3/4 pe rcent as the crosssecLional width to dep th ratio of the bars approached 10.
In addition to t he fund ame ntal torsional resonance frequ ency, t he firsL over tone of t he specimens wa . al.so determined. The overtone was found not to be an cxacL In' lLiple of the fundamental ; l t In creased more Lhan 5 percent over do uble t h e value of Lile fundHllle llLal as the wid Lh to depth ratio increased to 10.
1. Introduction
The exact relation between the modulus of elasticity in heal' and the tor ional resonance frequency for bars of various cross-sectional shapes is of considerable practical as well as theoretical importance. For certain cross-sectional shapes, including circular and quare , the relations for the shape factors involved in determining the shear modulu hom the angular deformation have been rigorously developed.2
Consequently, it is possible to derive an exact expression for til shear modulus as a function of the torsional resonance frequency for these shape , as is done by Pickett.3 For a rectangular cross section, however, the situation is not 0 atisfactory. For thi cross ection, Roark gives a simplified equation for the hape factor whicb , he states, involve an approximation resulting in an errol' not greater than 4 percent. Pickett's shear modulus-torsional frequency equation for this sbape, based on Roark's equation, is therefore also approximate, a Pickett notes. Cady 4 also gives an approximate equation relating the shear modulus to the torsional frequency for rectangular bars. !twill. be shown later that Pickett's and Cady's equations, although different in appearance, lead to essentially tue same numerical results.
This lack of a more exact expression for bars of rectangular cross section is unfortunate. This shape of bar can be easily fabricated for most materials and, in addition, lends itself to the experimental excitation of torsional vibration more easily than other simple shapes. Indeed, it is sometimes the only simple shape for which this can be accomplished.
110dern refinements in the sonic method permit the determination of resonance frequencies to a high degree of accuracy (sec section 3.3). It would be
1 Present address, rJ'exas Indu stries, Inc., Dallas, 'r ex. :'I See, for i nstan~~, Ray mond J. Roark , Formulas for stress ancl strain, p . 166,
2d ed. (McGraw·Hill Pllblisbing Co., Inc., New York, N . Y., 1943). 3 Gerald Pickett, Equations for computing elastic constan ts from fl exural and
torsional resonant frequencies of v ibratioll of prisms and cylindcrs, Am. Soc. 'l'esting Materials, Proc. , 45, R46 (194.1) .
• Walter Ouyton Cady, Piezoelectricity, p. 114, 1st cd . (MeGraw.Hill Pub· !sh lng Co., Inc., New Y ork , N . Y . , 1946).
desirable, th en, to develop a relationship betwecn the torsional resonance frequency and the shear modulus that would be comparable in accuracy with the determination 01' the 1'e onance frequency itself. The main purpose of thi paper i to cstablish such a relationship empirically and to compare this empiri cal relationship wit ll tbe appl'OA'irnate theoretica.l ones given by Pickett and Cady. From h re o-?- ' lIlce only torslOnal 1'e onance frequeneie are cll~cu ssecl, the te.rm "resonitnce frequency" itl ways refers to the torsLOnal resonance freqllenc),.
2 . Theory
Tll e general form of the relationship between the shear modulus and the resonance frequency is O'i en by I ickctt as fo llow :
(1)
where m is tlte mass of the pecimcll in gram, f i tlte rcsonance frequ enc. in cp , and G is the shear modulus in dynes/c:m2 (G i oftcn given in kilobar where 109 dynos/cm2= 1 kilobar) . B , in cm- I i~ related to t he shape in t he following manner: '
(2)
where 5
l= length (cm), (£ = cross-sectional aretL, _ n = the order of vibration (fol' the fundamental
n = l , fir t ovcrtone n = 2, etc.), I 1J = polar moment of inertia of cross- cctional
al'ea,6 K = shape factor fot' samc cross section (see
footnote 2). ----, The egs system used in this paper ellminates y, the acceleration of gravity from
the dcnon;>!nator of the right·hand side of cq (2), making the valu es for B, and hence G, mdependent of this factor. COIl\'ersion from kilo bars to psi's may be accomplished by means of the equation
Kilo barsX14.5038X 10'= psi. 'l' he conversion factor assum es a value of 0=980.66 em/sec'.
, co pages 10 and 68 of reference in footnote 2.
459
110
100
25
90
20 80
70
~ 15
'" 60
50
10
5
3 4 5 WIDTH TO DEPT H RA TIO
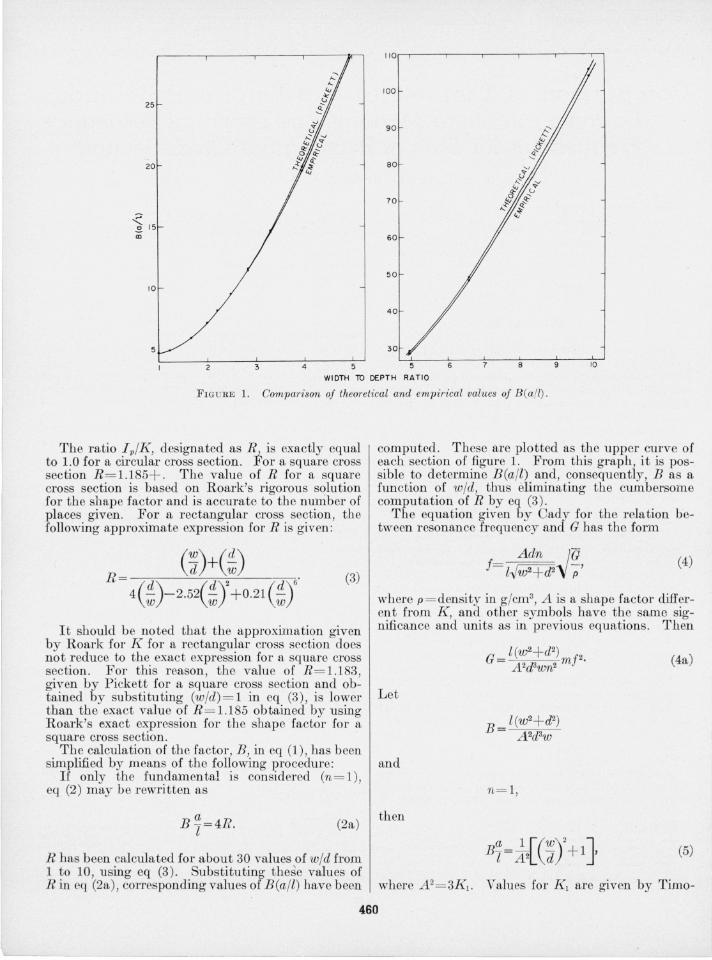
FIG U RE 1. Comparison of theoretical and empirical values of B Ca/I) .
The ratio IpIK, designated as R is exactly equal to 1.0 for a circular cross section. ~or a square cross section R = 1.185+. The value of R for a square cross section is based on Roark's rigorous solution for the shape factor and is accurate to the number of places given. For a rectangular cross section, the following approximate expression for R is given:
R= (d) (d)2 (d)6' 4 W -2.52 W +0.21 W (3)
It should be noted that the approximation given by Roark for K for a rectangular cross section does not reduce to the exact expression for a square cross section. For this reason, the value of R = 1.183, given by Pickett for a square cros section and obtained by substituting (wld) = l in eq (3) , is lower than the exact value of R = 1.185 obtained by using Roark's exact expression for the shape factor for a square cross section.
The calculation of the factor , B, in eq (1) , has been simplified by means of the following procedure:
If only the fundamental is considered (n = l ), eq (2) may be rewritten as
a B 1=4R. (2a)
R has been calculated for about 30 values of wid from 1 to 10, using eq (3). Substituting these values of R in eq (2a), corresponding values of B(all) have been
computed. These are plotted as the upper curve of each section of figure 1. From this graph, it is possible to determine B(all) and, consequently, B as a function of wid, thus eliminating the cumbersome computation of R by eq (3) .
The equation given by Cady for the relation between resonance frequency and G has the form
Adn IG j = Nw2+d2'V p' (4)
where p= density in g/cm3 , A is a shape factor different from K, and other symbols have the same significance and units as in previous equations. Then
(4a)
Let
and
n= l ,
then
(5)
where A 2= 3K,. Values for K, are given by Timo-
460
henko and Goodier .7 Table 1 gives th e values of B (a/l ) from Pickett's and Cady's equations for comparison.
T ABLE 1. Values of B (a/ I) from Pickett's and Cady's equations
wid B(al l )
Pick ett Cady
1.0 4.734 4. 742 1. 2 4. 92 4.90 1. 5 5. 55 5. 53 2. 0 7. 27 7. 28 2. 5 9. 66 9. 71
3. 0 12. 66 12.67 4. 0 20. 17 20. 17 5. 0 29. 71 29. 78
10. 0 107. 8 107. 9
The values of B (a/l ) are seen to be in good agreement. Cady states that hi equation loses accuracy for (w/d)< 3.8 However , for w/d= 1, Cady's value of B (a/l )= 4 .742 is identical with the one based on Roark's rigorous expression for the shape factor. This value is believed to be more accurate than the corresponding one from Pickett in t able 1.
3. Experimental Approach
3.1. Specimens
Specimens consisted of 12 steel bars of rectangular cross section, all cut from the same stock. All of the specimens were ground to the ame length (15.202 cm) and, with one exception , to the sam o width (3. 143 cm), while the dep ths were varied so that the ra tio of wid th to depth, wid, ranged from about 10 to 1. The one exception was the specimen of square cross section, which was 3.1 50 by 3.150 cm . The dimensions of all specimens wer e uniform to 0.001 cm . Width over depth ra tios for all specimens are to be found in column 2 of table 3.
Inasmuch as the evaluation of G r equired that the mass as well as the dimension of the specimens be known, the necessary data to calculate the density was available. This served as an internal check on th e homogeneity of the pecimens and the consistency of the data. T he average value of the density of the 12 specimens was found to be 7.814 g/cm3 with ah extreme variation of ± 0.003 and standard devia tion of about 0 .002.
3.2. Procedure
The fundamen tal an!i first over tones of the resonance frequencies of the specimens were determined by a sonic method, taking advantage of certain refinements previously describ ed .9 These r efinements ar e briefly summarized as follows:
, S. Timoshenko and J . N. Goodier, Theory oC elast icity, p. 277, 2d cd. (McG raw-Hili P ublishin g Co ., Inc., N ew York, N. Y ., 1951) .
8 Both Roark's a nd Cady's eq uations appear to be a pproxim ations based 0]] a powcr-seri~ expansion given by T imoshcn ko and Goodier, p . 278, eq (160) .
• Sam Spi nner, Elas tic mod uli ol glasses by a dynamic m ethod . J . Am. Ceram. Soc. 37, 229 (1954).
1. R eading the resonance frequency on a frequency counter.
2. Probing wi th the pickup by hand to es tabli h clearly the mode of vibration at resonance.
3. Suppor ting the specimen on foam rubb er aL the nodal points and driving them with a tweetertype speaker coupled throuO'h the air. Thi method of support and driving provides virtually zero coupling to the driving system , with specimens of the size and mass used her e, and results in the tru e t natural resonance frequ encies of the specimens.
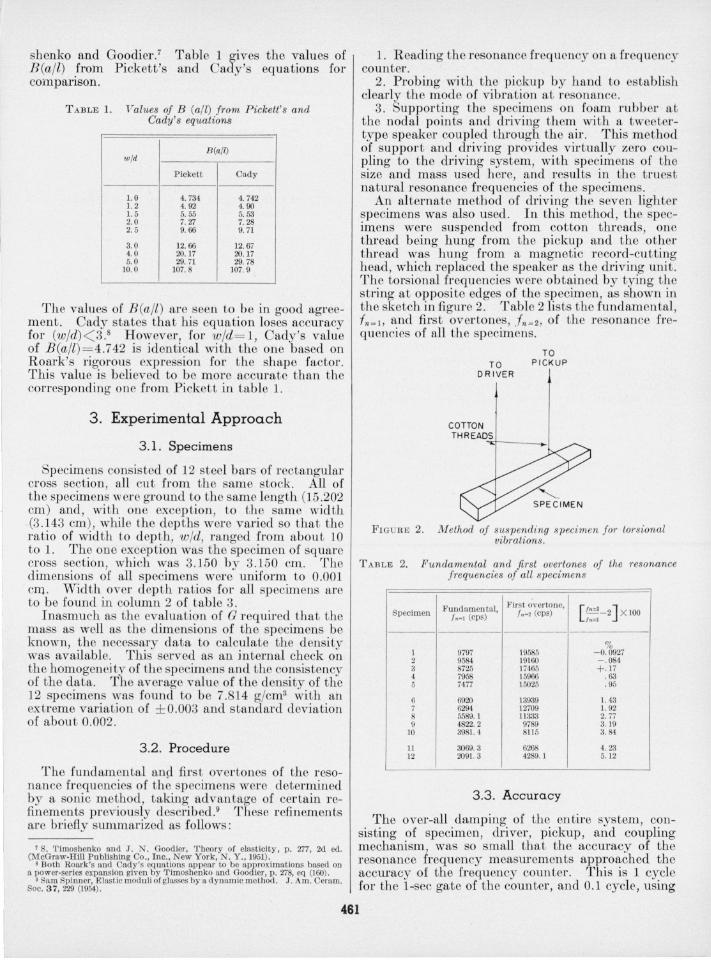
An al ternate method of driving the seven lighter specimens was also used. In this method, the specimens were suspended from cotton threads, one thread being hung from the pickup and the other thread was hung from a magnetic record-cutting head, which r eplaced the speaker as the driving unit. The torsional frequencies were ob tained by tying the string a t opposite edges of the specim en, as shown in the sketch in figure 2. Table 2 lists the fundamental, fn_ l , and first overtones, fn =2, of the resonance frequ encies of all th e sp ecimens.
TO TO PICKUP
DRIVER
COTTON THREADS
..q.--_~I
FlGu m;; 2. lVIelhod of sus pending specimen f or torsional vibrati ons.
T ABLE 2. Fundamental and fil'st overtones of the resonance frequencies of all specimens
F undamental, Fi.rst overtone, [,n=. -2 ] X 100 Specimen jn-' (cps) jn-' (CI)S) /"=1
% 1 9797 19585 - 0. 0927 2 9584 19160 -. 084 3 8725 "17465 +. 17 4 7958 J5966 . 63 5 7477 J5025 . 95
6 6920 13939 1. 43 7 6294 12709 1. 92 8 5589. 1 IJ333 2. 77 9 4822. 2 9789 3. J9
JO 3981. 4 SU5 3.84
It 3069.3 6268 4. 23 12 2091. 3 4289. 1 5.12
3.3. Accuracy
The over-all damping of the entire sys tem , consisting of specimen, driver , pickup , and coupling mechanism , was so small that the accuracy of the resonance frequency measuremen ts approached the accuracy of the frequency coun ter. This is 1 cycle for the I-sec gate of the counter , and 0.1 cycle, using
461
the 10-sec gate .. Generally, the I-sec gate was sufficient for the specimens of low value of wid, i . e., those having a high resonance frequency, whereas the 10-sec gate was used for specimens having high values of wid (low resonance frequency) . An additional small source of error is introduced by the -coupling m echanism. For those specimens vibrated by the suspension method, it was found that although the reso~an ce frequencies were r eproducible up to the maxllnum aCC11Tacy of the counter for any particular given position of the threads on the specimen , nevertheless, the fundam ental resonance frequencies were found to vary by about 2 cycle~, depending on whether the threads were placed near or far from the nodes; the highest values resulted when the threads were nearest the nodes. lO The frequencies obtained by driving through air (given in table 2) were usually intermediate between the highest and lowest values for the suspended specimens. In general, the bulkier the specimens, the less the measul'ed resonance frequencies were affected by the mode of coupling or the position of the supports. The accuracy of the fundamental reso- I
nance frequencies, then, was estimated to range from about 1 part in 2,000 for the flattest specimen to abou t 1 part in 10,000 for the square specimen.
To evaluate any possible effect of air damping on the resonance frequ encies of the specimens, some of the flatter bars wer e vibrated, both in air and, without changing the position of the fib ers, also in vacuum, using the suspension method. The resonance frequencies were found to be about 1 part in 6,000 higher in vacuum than in air. Because this variation is less than the error in measuremen t for the flatter specimens, it ,vas not considered sufficien t to justify vibrating all the specimens in this manner. . 10 'l~~e cn~ire problc.m of tllcse .small ~a!'jations!n measured resonance frequen
cIes WIth d Ifferences Hl suspenSIon pOSItIOn reQULres further stndy. For lighter and smaller specimens than. those used in th is investigat ion, the suspension meth od YIelds even more reliable results than does the method of air coupling. Also , for the most accurat e results, specimens should be vibrated in vacuum (sec next paragraph of text). The suspens ion method is easily adapted to this. For ~exural v ibrations, in contrast with torsional , the Jlighest frequencies are obtamed wh en the supports al'e placed furthest from the n odes. In all cases it is believed that the truest resonance frequencies arc obtained wh en th e driving and picku p fibers are nea rest the nodes .
3.4. Calculations
Oomparison of the experimental r esults will first be made with the curve based on Pickett's equation. The empirical (lower) curve shown in figure 2 was obtained in the following manner : For some particular value of wid say (wld) = l ,
where B'= B (all) and the subscripts indicate particular values for wld= 1. For any other value of wid, th e specimen will have the same value of G, and all the terms on the right-hand side h ave the sub-crip t 2 thus,
Therefore,
(6)
All the members on the right-hand side are known and B~/B~ may be evaluated. Values of this ratio are given in column 3 of table 3.
In order to obtain B (all) (experimental) directly as a function of wid, it is first necessary to select a reliable base value of B (all) for some particular value of wid. It has already been shown that the v alue of B (all)=4.742 for wld= l is believed most accurate. This number then , is selected as the base value for wld= 1. Values of B (all) (experimental) for higher wid ratios are then obtained by multiplying this b ase value by the B2' IB2' , ratio for the corresponding value of wid. These are given in column 5 of table 3.
It should be noted that the choice of a' base·value for B(all) (experimental) is somewhat- arbitrary. Should it develop that some other value of B (ajl) ei ther at wld= l , or at some other wid ratio ,~is more
TABLE 3. 'l'heoTetical and empirical data fOT TectangulaT bars of vaTying wId m/ios
[Data ronnded off to final figure. Oaleulations are on basis of more Significant figures]
B (It/I) [ B~ (theOl.)
IJ X 100 Speci men w B 2' ---d iN A '
Theoretical Experimental B-Z (oxp.)
----
% L ....... 1 1 4. 734 4.742 - 0. 17 0.4218 2 ....... _ 1. 237 1. 045 4.973 4.955 +.36 .51065 3_ ....... 1. 650 1. 261 5.979 5.981 -.03 . 6222 4 _______ . 1. 980 1. 516 7. 198 7.186 +. 17 . 6847 5 ________ 2. 198 1. 7175 8. 162 8. 144 . 23 . 7160
6 ________ 2.473 2.005 9.544 9. 505 . 40 .7 9 7 __ ______ 2.827 2.424 11.563 11. 495 . 59 . 7822 8 . ______ . 3. 298 3.074 14.681 14.577 . 71 .8148 9 ________ 3.957 4. 130 19. 815 19.583 1.18 .8509
10 _______ . 4. 938 6. 060 29. 096 28.734 1. 26 . 8834
11. ______ . 6.586 10.19 49.058 48.352 1. 48 .9177 12 ___ . __ ._ 9.908 21. 959 105.90 104. 12 1.71 . 9524
462
accurate, then a readjustment could easily be m.ade in column 5, using the more basic data from column 3.
The data in column 5 ,vas obtained without assuming any particular value for G for the specimens, but merely that all the specimens had the same value of G. An alternative method for calculating the data in column 5 may be used if, in acldiLion to assuming that the value of G of all the specimens is the same, a cle6nite value of G is derived for some particular value of wid. Thus, using B(all) = 4.742 for wld= l, and substituting in eq (1) and (2), leads to a value of 822.1 kilobars for G. Then, resubstituting this value in the same two equations, one obtains the following expression, from which B(alt) (experimentnJ) for the corresponding wid values may be calculated,
B a ( . 1) 822.1a T expel'lmentu = lmj2 . (7)
Comparison between theoretical and expcrimental curves can now also be made in terms of A2, used in Cady's equa Lions. A 2 is evaluated empirically by ubstituting B(all) (experimental) and the corre
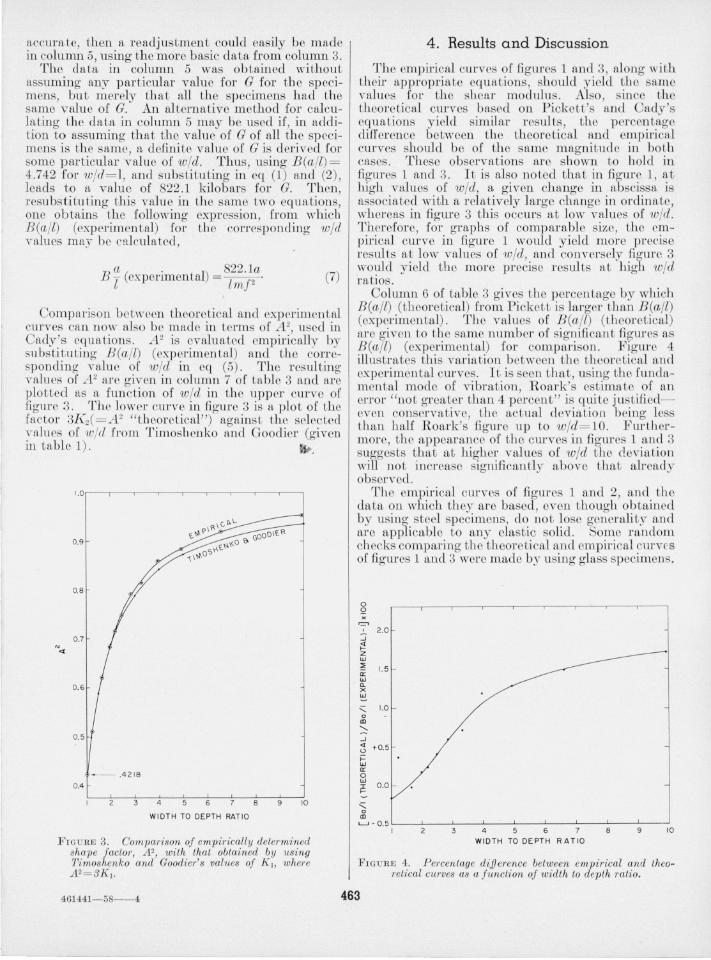
sponding value of wid in eq (5). The resulting values of A 2 are given in column 7 of table 3 and arc plotted as a function of wid in the upper curve of figure 3. The lower curve in figure 3 is a plo t of the factor 3K2 ( =rF "theoretiea,!") aga inst the selected yalues of wid from 1'imoshenko and Goodier (given in table 1) . §f.t.
0.9
~- .42 18
0.4
4 6 8 9 10
WIDTH TO DEPTH RATIO
FIGURE 3. Comparison of empil'ically determined shape factOl', A 2, with that obtained by using 'l'imoshenko and Goodier's val1ws of [(I> where A 2=S[( !.
4. Results and Discussion
The empirical curves of figures 1 and 3, along with their appropriate equations, should yield tbe arne values for the shear modulus. Also, since th theoretical curves based on Pickett's and Cad's equations yield similar results, the percentage difference between the theoretical and empirical curves should be of the same magnitude in both cases. These observations aTe shown to hold in. figures 1 and 3. It is also noted that in figure 1, at high values of wid, a given change in abscissa is associated with a relatively large change in ordinate, whereas in figure 3 this occurs at low values of wid. Therefore, for graphs of comparable size, the empiJ:ical CUl've in figUl'e 1 would yield more precise results at low values of wid, and conversely figure 3 would yield the more precise results a t high wid ratios.
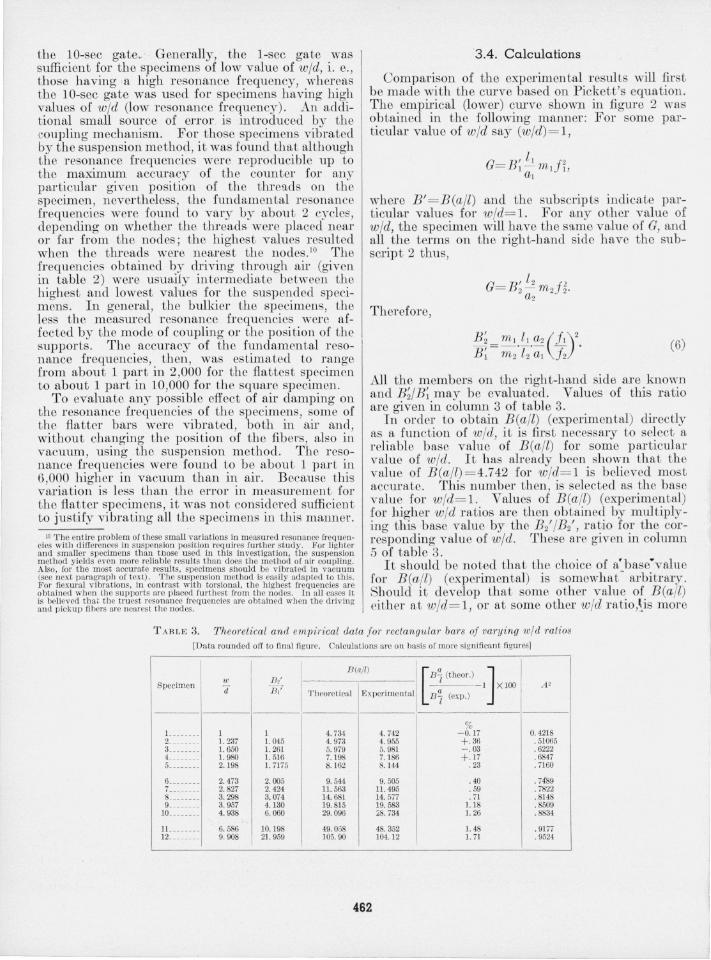
Column 6 of table 3 gives the percentage by which B(am (theoreLical) from Pic1 ett i larger than B (all) (experimental) . The values of B (all) (theoretical) arc given to the same number of significant figUl'es as B(all) (experiment.al) for comparison. FigUTe 4 illustrate this variation between the theoretical and experimental curves. It is seen that, using the fundamental mode of vibration, Hoark's e timate of an errol' " not greater than 4 percent" is quite justifiedeven conservative, the actual deviation being less than half Roark's fig ure up to wld= 10. Furthermore, the appearance of the ClU'ves in figures 1 and 3 suggests that at higher values of wid the deviation will not incl'ea e significan tly above that already observed.
The empirical ClU'ves of figures 1 and 2, and Lhe data on which they are based, even though obtained by usin& steel pecimens, do not 10 e generality and are applicable to any clast ic solid. Some random checks com.paring the theoretical and empirical CUl'VES of figures 1 ancl3 were made by using glass specimen.
0 Q K
=' 2.0
..J
" Z W
~ 1.5 0:: W a. x ~ .:;: 1.0 0 OJ
:::::: ..J <I to.5 <.)
;:: W 0:: 0 W
0.0 I
~ .:;:
0 OJ >-J - 0.5
I 2 4 6 7 8 9 10
WIDTH TO DEPTH RATIO
FIG URE 4. Percentage dijJel'ence between ernpirical and theoretical curves as a function of width to depth ratio.
461441- 58- 4 463
..J 2.05 <! t-Z W :::;; 2.04 <! 0 Z :::> lL. 2.03 a: w > 0 2.02 w z 0 t-a: w
2.0 I
> 0
t-2..00 Vl
a: lL.
2 3 4 5 6 7 8 9 10
WIOTH TO DEPTH RATIO
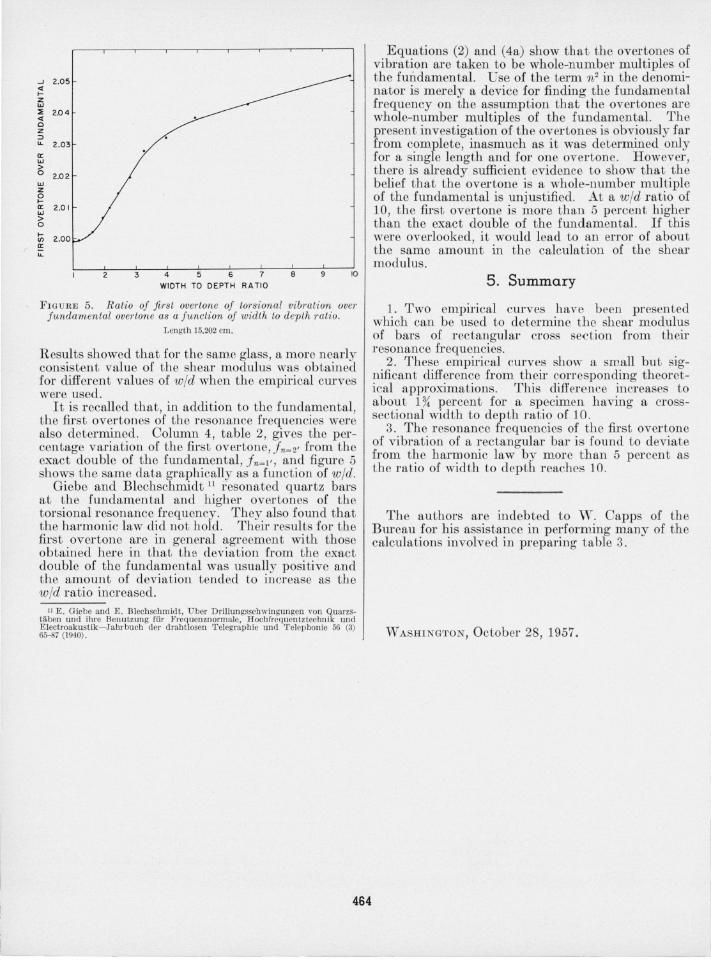
FIGURE 5. Ratio of first overtone of torsional vibration over fundamental overtone as a function of width to depth ratio.
Length 15.202 em.
Results showed that for the same glass, a more nearly consistent value of the shear modulus was obtained for different values of wid when the empirical curves were used.
It is recalled that, in addition to the fundamental , the first overtones of the resonance frequencies were also determined. Column 4, table 2, gives the percentage variation of the first overtone, } n=2' from the exact double of the fundamental, }n=l', and figure 5 shows the same data graphically as a function of wid.
Giebe and Blechschmidt 11 resonated quartz bars at the fundamental and higher overtones of the torsional resonance frequency. They also found that the harmonic law did not hold. Their results for the first overtone are in general agreement with those obtained here in that the deviation from the exact double of the fundamental was usually positive and the amount of deviation tended to increase as the wid ratio increased.
" E . Giebe and E . BJeehsehmidt. Uber Drillnngsscbwingungen von Qnarzstaben und ihre Benutzung fill' Frcquenznormale, Hochfrcquentztechnik nnd Electroakustik- Jahrbuch der drabtlosen T elegraphic und T elephonie 56 (3) 65-87 (1940).
464
Equations (2) and (4a) show that the overtones of vibration are taken to be whole-number multiples of the fundamental . Use of the term n2 in the denominator is merely a device for finding the fundamental frequency on the assumption that the overtones are whole-number multiples of the fundamental. The present investigation of the overtones is obviously far from complete, inasmuch as it was determined only for a single length and for one overtone. However, there is already sufficient evidence to show that the belief that the overtone is a whole-number multiple of the fundamental is unjustified. At a wid ratio of 10, the first overtone is more than .5 percent higher than the exact double of the fundamental. If this were overlooked, it would lead to an error of about the same amount in the calculation of the shear modulus.
5 . Summary
1. Two empirical curves have been presented which can be used to determine the shear modulus of bars of rectangular cross section from their resonance frequencies .
2. These empirical curves show a small but significan t difference from their corresponding theoretical approximations. This difference increases to about 1 % percent for a specimen having a crosssectional width to depth ratio of 10.
3. The resonance frequencies of the first overtone of vibration of a rectangular bar is found to deviate from the harmonic law by more than 5 percent as the ratio of width to depth reaches 10.
The authors are indebted to W. Capps of the Bureau for his assistance in performing many of the calculations involved in preparing table 3.
WASHINGTON, October 28, 1957.