Embed Size (px)
Citation preview
Comparison of the Newer Preventive Therapies on
Remineralisation of Enamel in Vitro
Mawia Ahmad Hijres Bataineh
Submitted in accordance with the requirements for the degree of Doctor of Clinical
Dentistry
The University of Leeds
Leeds Dental Institute
Division of Child Dental Health
October, 2014

The candidate confirms that the work submitted is her own and that
appropriate credit has been given where reference has been made to the work
of others.
This copy has been supplied on the understanding that it is copyright material
and that no quotation from the thesis may be published without proper
acknowledgement.
© <2014> “The University of Leeds” <Mawia Bataineh >

Dedicated to my Family

I
ACKNOWLEDGEMENTS
It would not have been possible to write this doctoral thesis without the help,
support and encouragement offered by the kind people around me, to whom I would
like to express my deepest appreciation.
First of all I would like to express my great gratitude and appreciation to my
supervisors Dr Jinous Tahmassebi and Professor Monty Duggal who gave me
unlimited support and assistance to succeed in this research project.
I am truly thankful to Dr Marina Malinowski for all the time and effort that she
spent while helping me and for her kind and ongoing support and encouragement
untill the last minute.
It was a great time that I spend with my friends and classmates Alaa BaniHani,
Anfal Faridoun, Fatma Al-Zahrani, Maryam Madouh, Mona Al-Omairah, Kate
Counihan and Alia Al-Awami, and I am greatly thankful for their loving, support
and continuous encouragement.
My greatest gratitude goes to my beloved family especially my parents for
always believing in me, and for their endless love and support throughout my life.
Last but not least, my warmest thanks go to my husband Jamil for the nonstop
moral and emotional support throughout all these years of my study, to my son
Najib who delighted my life and fill it with happiness.
II
ABSTRACT
Aim of the Research: To investigate in vitro the effect of Tooth Mousse (10% w/v
CPP-ACP), MI Paste Plus (10% w/v CPP-ACP, 900 ppm F) and high Fluoride
concentration toothpaste (2800 ppm F) in the remineralisation of demineralised
enamel subsurface lesions and to compare thses to the effect of 1450 ppm Fluoride
toothpaste and non-fluoride (0 ppm F) toothpaste control.
Materials and Methods: Enamel subsurface lesions were created in bovine enamel
slabs (N=120) which were assigned randomly to five groups; (1) Fluoride-free
Toothpaste (control), (2) 1450 ppm F toothpaste, (3) 2800 ppm F toothpaste, (4)
1450 ppm F toothpaste + Tooth Mousse (10% w/v CPP-ACP) and (5) 1450 ppm F
toothpaste + MI Paste Plus (10% w/v CPP-ACP, 900 ppm F). The enamel slabs
were subjected to a pH cycling regimen for 21 days, with daily exposure to the
toothpastes solutions before and after the pH cycling, in 1450 ppm F toothpaste +
Tooth Mousse and 1450 ppm F toothpaste + MI paste Plus groups the exposure to
the Tooth Mousse or MI paste plus were performed after the last toothpaste
exposure. QLF images were taken at the baseline and at the endpoint of the
experiment. Data analysis was carried out using one-way analysis of variance (One
way ANOVA). Following the completion of the study two enamel slabs were
randomly selected from each group to carry out SEM analysis.
Results: In all five groups, both ∆F (Average fluorescence loss) and ∆Q
(multiplication of ΔF and area) values improved significantly within the same group
after the treatment compared with the baseline values. In addition, the mean

III
difference in ΔF of 0 ppm F toothpaste (control) was significantly lower than the
mean difference in ΔF of the 1450 ppm F toothpaste, 1450 ppm F toothpaste +
Tooth Mousse and the 1450 ppm F toothpaste + MI paste Plus groups (p < 0.05) but
not significantly lower than the 2800 ppm F toothpaste group. Whereas the mean
difference in ΔQ of 0 ppm F toothpaste group was significantly lower when
compared with all other groups (p < 0.05). The SEM imaging revealed the presence
of amorphous deposits only on the enamel surface of the1450 ppm F toothpaste +
Tooth Mousse and the 1450 ppm F toothpaste + MI paste Plus groups .
Conclusion: The remineralisation of enamel subsurface lesions was found in all
groups with a statistically significant difference between all the test groups
compared with the 0 ppm F control. The use of Tooth Mousse and MI paste Plus in
conjunction with 1450 ppm F showed some increased efficacy in the
remineralisation of enamel subsurface lesions, however this did not reach a
significant level.

IV
TABLE OF CONTENTS
ACKNOWLEDGEMENTS ....................................................................................... I
ABSTRACT .............................................................................................................. II
TABLE OF CONTENTS ........................................................................................ IV
LIST OF FIGURES ............................................................................................. VIII
LIST OF TABLES ................................................................................................... X
LIST OF ABBREVIATIONS ................................................................................ XI
1.0 INTRODUCTION ............................................................................................ 1
2.0 LITERATURE REVIEW ................................................................................ 4
2.1 Dental Caries ............................................................................................... 4
2.1.1 Enamel caries ................................................................................... 5
2.1.2 Demineralisation and Remineralisation ........................................... 6
2.1.3 The Role of Saliva ............................................................................ 8
2.1.4 Enamel Lesion (White Spot Lesion; WSL) ..................................... 8
2.2 Enamel Remineralisation Therapies ....................................................... 11
2.2.1 Fluoride .......................................................................................... 12
2.2.1.1 Fluoride Mechanism of Action ........................................ 12
2.2.1.2 Fluoride in Saliva ............................................................ 14
2.2.1.3 Fluoride Delivery Systems .............................................. 14
2.2.1.4 Fluoride Limitation .......................................................... 16
2.2.1.5 Fluoride Toxicity and Dental Fluorosis ........................... 17
2.2.2 Milk Products and Enamel Remineralisation ................................. 19
2.2.3 Casein Phosphopeptide - Amorphous Calcium Phosphate
(CPP-ACP) ..................................................................................... 20
2.2.3.1 CPP-ACP Effect on Demineralisation............................. 24
2.2.3.2 CPP-ACP Effect in Remineralisation .............................. 27
2.2.3.2.1 In Vitro Remineralisation Studies .......................... 28
2.2.3.2.2 In Situ Remineralisation Studies ............................ 30
2.2.3.2.3 In Vivo Remineralisation Studies .......................... 32
2.2.3.3 CPP-ACP and Erosion ..................................................... 39
2.2.3.4 CPP-ACP and Fluoride ................................................... 41

V
2.3 Model Systems used to Study the Caries Process in Enamel.................. 44
2.3.1 In vitro Model ................................................................................ 44
2.3.1.1 Artificial Caries Lesions .................................................. 44
2.3.1.2 pH Cycling Model ........................................................... 45
2.3.2 Animal Caries Models.................................................................... 45
2.3.3 In situ Model .................................................................................. 46
2.4 Methods used in Demineralisation and Remineralisation
Evaluation ............................................................................................... 47
2.4.1 Microradiography ........................................................................... 47
2.4.2 Quantitative Light-Induced Fluorescence (QLF) ........................... 48
2.4.3 Microhardness Test ........................................................................ 51
2.4.4 Scanning Electron Microscopy (SEM) .......................................... 52
2.5 Methods Used for Early Caries Detection .............................................. 53
2.5.1 International Caries Detection and Assessment System
(ICDAS) ......................................................................................... 53
2.5.2 QLF ............................................................................................... 54
2.5.3 Fibre Optic Transillumination ........................................................ 54
2.5.4 Laser Fluorescence ......................................................................... 54
2.5.5 Digital Radiographic Techniques ................................................... 55
2.5.6 Electronic Caries Monitor (ECM) .................................................. 55
2.5.7 Ultrasound Techniques................................................................... 55
2.6 Research Aims, Objectives, And Hypothesis ......................................... 57
3.0 MATERIALS AND METHODS .................................................................. 58
3.1 Power Calculation ................................................................................... 58
3.2 Experiment Materials .............................................................................. 59
3.3 Study Groups ........................................................................................... 59
3.4 Enamel Slab Preparation ......................................................................... 60
3.5 Preparation of the Enamel Sub-surface Lesion ....................................... 62
3.5.1 The preparation of demineralisation system: acidified
hydroxyethyl cellulose gel ............................................................. 62
3.6 Quantitative Light-induced Fluorescence (QLF) measurements ............ 64
3.7 The ΔF Range of the Artificial Lesions .................................................. 70
3.8 Randomisation and Blindness ................................................................. 70
3.9 The pH Cycling Regime.......................................................................... 70
3.10 Study Protocol ......................................................................................... 71
VI
3.10.1 Experiment materials slurries ................................................ 73
3.11 Preparation of Solutions Used in the Study ............................................ 78
3.11.1 Artificial saliva ...................................................................... 78
3.11.1.1 The preparation of day time artificial saliva.................. 78
3.11.1.2 The preparation of night time artificial saliva ............... 79
3.11.2 Acetic acid buffer .................................................................. 80
3.12 Training and Calibration ......................................................................... 80
3.13 Intra-Examiner Reproducibility .............................................................. 81
3.14 Statistical Analysis .................................................................................. 81
3.15 Scanning Electron Microscopy SEM ...................................................... 82
4.0 RESULTS ....................................................................................................... 84
4.1 Quantitative Light-induced Fluorescence (QLF) Results ....................... 84
4.1.1 The mean fluorescence loss ΔF ...................................................... 84
4.1.1.1 Difference in ΔF within each group ................................ 86
4.1.1.2 Difference in ΔF between groups .................................... 89
4.1.1.3 Intra-examiner reproducibility for ΔF ............................. 95
4.1.2 ΔQ: ΔF times the Area. Percentage fluorescence loss with
respect to the fluorescence of sound tissue times the area.
Lesion volume ................................................................................ 97
4.1.2.1 Difference in ΔQ within each group................................ 98
4.1.2.2 Difference in ΔQ between groups ................................. 101
4.1.2.3 Intra-examiner reproducibility for ΔQ .......................... 107
4.1.3 Area of the White spot lesion. ...................................................... 109
4.1.3.1 Difference in lesion area within each group .................. 110
4.1.3.2 Difference in lesion area between groups ..................... 113
4.1.3.3 Intra-examiner reproducibility for lesion area ............... 117
4.1.4 Summary of the results for all three parameters. ......................... 119
4.2 Scanning Electron Microscopy (SEM) results ...................................... 120
5.0 DISCUSSION ............................................................................................... 124
5.1 In vitro Model ....................................................................................... 125
5.2 Study Design ......................................................................................... 125
5.2.1 Bovine teeth ................................................................................. 126
5.2.2 Enamel slabs preparation and storage .......................................... 127
5.2.3 Artificial carious lesions .............................................................. 127
5.2.4 pH cycling .................................................................................... 128
VII
5.2.5 Experiment materials ................................................................... 129
5.3 Quantitative Light-Induced Fluorescence (QLF) .................................. 130
5.4 Results of Quantitative Light-Induced Fluorescence (QLF) ................. 131
5.4.1 Effect of fluoridated toothpaste in remineralising enamel
subsurface lesion .......................................................................... 132
5.4.2 Effect of CPP-ACP and CPP-ACFP on remineralising enamel
subsurface lesion .......................................................................... 135
5.5 Scanning Electron Microscopy (SEM) ................................................. 139
5.5.1 Results of Scanning Electron Microscopy (SEM) ....................... 139
5.6 Suggestions for Future Research ........................................................... 141
5.7 Null hypothesis ..................................................................................... 142
6.0 CONCLUSION ............................................................................................. 143
7.0 REFERENCES ............................................................................................. 144
8.0 APPENDICES ............................................................................................. XIV

VIII
LIST OF FIGURES
Figure 3-1: Diamond wire saw apparatus used for the teeth sectioning (Well® Walter EBNER, CH-
2400 Le Loche). ......................................................................................................................... 60
Figure 3-2: Enamel slab suspended in the “Sterilin” type universal tube. ........................................... 61
Figure 3-3: Enamel slabs covered with nail varnish except for a small window. ................................ 62
Figure 3-4: Enamel slabs suspended in the acid gel. ........................................................................... 63
Figure 3-5: QLF machine, the SLR camera attached to the stand with standardised distance from the
enamel slab. ................................................................................................................................ 65
Figure 3-6: QLF image taken with the blue light shows the demineralised lesion in the centre of the
enamel slab as well as a patch drawn around the lesion with the border in sound enamel. ....... 66
Figure 3-7: Example of the blue light image analysis results including ΔF, ΔQ and the lesion area
values.. ....................................................................................................................................... 67
Figure 3-8: Examples of the blue light image of demineralised enamel lesions before and after pH
cycling for each group.. .............................................................................................................. 67
Figure 3-9: Flow chart of the pH cycling protocol followed for 0 ppm F, 1450 ppm F and 2800 ppm F
toothpastes groups. ..................................................................................................................... 74
Figure 3-10: Flow chart of the pH cycling protocol followed for 1450 ppm F +TM and 1450 ppm F +
MIplus groups. ........................................................................................................................... 75
Figure 3-11: Flow chart for 0 ppm F, 1450 ppm F and 2800 ppm F toothpaste groups. ..................... 76
Figure 3-12: Flow chart for 1450 ppm F+ TM and 1450 ppm F + MIplus groups. ............................. 77
Figure 3-13: enamel slabs coated with gold for the SEM analysis. ..................................................... 82
Figure 3-14: Scanning Electron Microscopy (HITACHI S-3400N). ................................................... 83
Figure 4-1: Boxplot for the distribution of the ΔF values at baseline for all groups. Error bars
represent SD, the line in the box of Box-and-whisker plot is the median value of the data. ...... 85
Figure 4-2: ΔF mean values at baseline and after treatment for all groups. ......................................... 87
Figure 4-3: Means of the difference in ΔF at baseline and after treatment of all groups. .................... 90
Figure 4-4: The % F values for all groups. ......................................................................................... 91
Figure 4-5: Boxplot for the difference in ΔF at baseline and after treatment for all groups. ............... 92
Figure 4-6: Bland-Altman plot for reproducibility of ΔF measurements at the end of the experiment.
................................................................................................................................................... 95
Figure 4-7: Boxplot for the distribution of the ΔQ values at baseline for all groups. .......................... 97
Figure 4-8: ΔQ mean values at baseline and after treatment. .............................................................. 99
Figure 4-9: Means of the difference in ΔQ at baseline and after treatment of all groups. ................. 102
Figure 4-10: The % Q values for all groups. .................................................................................... 103

IX
Figure 4-11: Boxplot for the difference in ΔQ at baseline and after treatment for all groups. .......... 104
Figure 4-12: Bland-Altman plot for reproducibility of ΔQ measurements. ....................................... 107
Figure 4-13: Boxplot for the distribution of the Area values at baseline for all groups. ................... 109
Figure 4-14: Lesion area at baseline and after treatment for all groups. ............................................ 111
Figure 4-15: Means of the difference in the lesion area at baseline and after treatment of all tested
groups. ...................................................................................................................................... 114
Figure 4-16: The % F values for all groups. ...................................................................................... 115
Figure 4-17: Boxplot for the difference in the lesion area at baseline and after treatment for all
groups. ...................................................................................................................................... 116
Figure 4-18: Bland-Altman plot for reproducibility of lesion area measurements. ........................... 118
Figure 4-19: SEM image for sound enamel surface shows natural surface without porosities......... 120
Figure 4-20: SEM image of the demineralised enamel subsurface lesion area treated with non-
fluoride toothpaste (0 ppm F) for 21 days in vitro under pH cycling. There is evidence of micro
porosities possibly due to exposure to the acid gel (arrows). ................................................... 121
Figure 4-21: SEM image of the demineralised enamel subsurface lesion area treated with fluoride
toothpaste and Tooth Mousse (1450 ppm F + TM) for 21 days in vitro under pH cycling. Less
clear evidence of micro porosities is visible. The surface is covered with amorphous deposits
(arrows). ................................................................................................................................... 122
Figure 4-22: A high magnification of one of the deposits seen in Figure 4-21 showing an amorphous
structure. ................................................................................................................................... 122
Figure 4-23: SEM image of the demineralised enamel subsurface lesion area treated with fluoride
toothpaste and MI paste plus (1450 ppm F + MIplus) for 21 days in vitro under pH cycling.
Some deposits can be seen on the enamel surface (arrows). .................................................... 123
Figure 4-24: A high magnification of one of the deposits seen in Figure 4-23. ................................ 123

X
LIST OF TABLES
Table 2-1: Tooth Mousse constitution ................................................................................................. 22
Table 3-1: Composition of the day time saliva solution. ..................................................................... 78
Table 3-2: Composition of the night time saliva solution. ................................................................... 79
Table 3-3: Constituents of Acetic acid. ............................................................................................... 80
Table 4-1:One way ANOVA between groups for ΔF values at baseline ............................................. 86
Table 4-2: The mean values of ΔF at baseline and after treatment for all groups. .............................. 86
Table 4-3: Paired sampled T test results for ΔF values at baseline and after treatment. ...................... 88
Table 4-4: Descriptive statistics for the difference in ΔF at baseline and after treatment for all groups.
................................................................................................................................................... 90
Table 4-5: One way ANOVA between groups for the difference in ∆F at baseline and after treatment.
................................................................................................................................................... 93
Table 4-6: Multiple comparisons of the difference in ∆F at baseline and after treatment between all
test groups and control. .............................................................................................................. 94
Table 4-7: Intra-class Correlation Coefficient for ΔF measurements. ................................................. 96
Table 4-8: One way ANOVA results for ΔQ values at baseline. ......................................................... 98
Table 4-9: The mean values of ΔQ at baseline and after treatment for all groups. .............................. 98
Table 4-10: Paired sampled T test results for ΔQ values at baseline and after treatment. ................. 100
Table 4-11: Descriptive statistics for the difference in ΔQ at baseline and after treatment for all
groups. ...................................................................................................................................... 102
Table 4-12: One way ANOVA between groups for the difference in ∆Q at baseline and after
treatment. ................................................................................................................................. 105
Table 4-13: Multiple Comparisons of the difference in ∆Q at baseline and after treatment between all
test groups and control. ............................................................................................................ 106
Table 4-14: Intra-class Correlation Coefficient for ΔQ measurements. ............................................ 108
Table 4-15: One way ANOVA results for area values at baseline. ................................................... 110
Table 4-16: The mean values of lesion area at baseline and after treatment for all groups. .............. 111
Table 4-17: Paired sampled T test results for the lesion area values at baseline and after treatment for
all groups. ................................................................................................................................. 112
Table 4-18: Descriptive statistics for the difference in the lesion area at baseline and after treatment
for all groups. ........................................................................................................................... 114
Table 4-19: Kruskal-Wallis Test results for the difference in the lesion area at baseline and after
treatment. ................................................................................................................................. 117
Table 4-20: Intra-class Correlation Coefficient for lesion area measurements. ................................. 118
XI
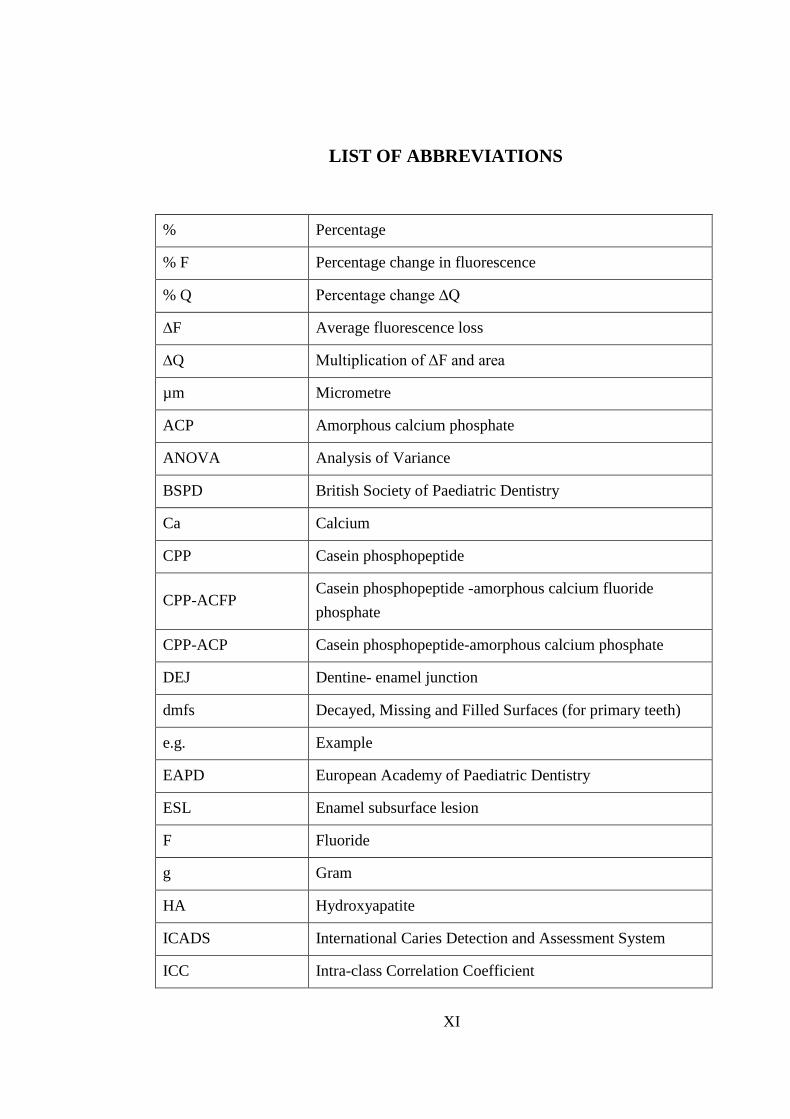
LIST OF ABBREVIATIONS
% Percentage
% F Percentage change in fluorescence
% Q Percentage change ∆Q
∆F Average fluorescence loss
∆Q Multiplication of ΔF and area
µm Micrometre
ACP Amorphous calcium phosphate
ANOVA Analysis of Variance
BSPD British Society of Paediatric Dentistry
Ca Calcium
CPP Casein phosphopeptide
CPP-ACFP Casein phosphopeptide -amorphous calcium fluoride
phosphate
CPP-ACP Casein phosphopeptide-amorphous calcium phosphate
DEJ Dentine- enamel junction
dmfs Decayed, Missing and Filled Surfaces (for primary teeth)
e.g. Example
EAPD European Academy of Paediatric Dentistry
ESL Enamel subsurface lesion
F Fluoride
g Gram
HA Hydroxyapatite
ICADS International Caries Detection and Assessment System
ICC Intra-class Correlation Coefficient
XII
Kg Kilogram
L Litre
mg Milligram
min Minutes
MIplus MI paste plus
ml or mL Millilitre
mm Millimetre
Mol Mole
N or n Number
Na Sodium
nm Nanometre
ºC Degree of Celsius
OR Odd Ratio
p p-value
pH Acidity
px Pixels
PO4 Phosphate
ppm Part per million
QLF Quantitative Light-Induced Fluorescence
RCT Randomised control trials
s Second
SD Standard deviation
SE Standard error
SEM Scanning Electron Microscopy
Ser(P) Phosphoseryl residue
SFGD Slow-release fluoride glass devices
Sig Statistical level
SMH Surface Microhardness
XIII
SPSS Statistics Package for the Social Sciences
TM Tooth Mousse
TMR Transverse Microradiography
vs Versus
w/v Weight per volume
w/w Weight per weight
WSL White spot lesion
wt Weight
1
1.0 INTRODUCTION
A more efficient way of oral health management is now achievable due to
better understanding of the pathogenesis of dental caries and its prevention
(Cummins, 2006). It has been reported that the prevalence of dental caries has
remarkably declined in the last decades (Petersson and Bratthall, 1996). This was
attributable primarily to the introduction and the widespread use of fluoride in
developed countries, improved oral hygiene, and a greater emphasis by the dental
profession on disease prevention and control. Nevertheless, dental caries for most
communities remains the most prevalent oral disease and a major public health
problem (Reynolds, 2008).
Dental caries can be defined as localised destruction of tooth tissue by micro-
organisms. Dental plaque cariogenic bacteria produce organic acids through the
fermentation of carbohydrate, and these acids are capable of causing
demineralisation of the dental hard tissues. Demineralisation can be reversed in its
early stages through uptake of calcium, phosphate, and fluoride through a
remineralisation process. The teeth in the oral environment are in balance between
continuous processes of demineralisation and remineralisation (Featherstone, 2004);
once this balance is disrupted the demineralisation will be predominant, which can
cause destruction and cavitation in the tooth structure (Featherstone, 2000).
However, if the caries lesion is detected at an early stage it can be reversed using
appropriate measures.
Remineralisation of early enamel carious lesions has now become the main
aim of preventive dentistry. A shift in emphasis from a restorative approach for
2
treating dental caries to a therapeutic approach focused on the remineralisation of
early caries lesions has taken place during the past decade (Ellwood et al., 2012),
and a range of new agents have been developed to provide a non-invasive
management of the early caries lesions.
The anti-cariogenic properties of milk and milk products were proven in
human and animal models (Reynolds and Johnson, 1981, Rosen et al., 1984) and the
chemical effect of phosphoprotien casein and calcium phosphate components were
proposed as the main mechanism for this action (Harper et al., 1986, Krobicka et al.,
1987). Casein phosphopeptide (CPP) has the ability to stabilise calcium and
phosphate in high concentrations at the tooth surface thereby inhibiting
demineralisation and enhancing the remineralisation.
Casein phosphopeptide -amorphous calcium phosphate (CPP-ACP) is a new
calcium phosphate remineralisation technology that has been shown to have anti-
cariogenic activity in laboratory, animal, and human in situ and clinical experiments.
The ability of CPP-ACP to enhance the remineralisation of enamel subsurface
lesions has been revealed in several studies (Shen et al., 2001, Reynolds et al., 2003,
Cai et al., 2007, Manton et al., 2008, Morgan et al., 2008).
The synergistic effect of CPP-ACP and fluoride in caries prevention has been
reported in a number of studies (Reynolds et al., 1995, Reynolds, 2008). This effect
has been attributed to the formation of CPP-stabilised amorphous calcium fluoride
phosphate (CPP-ACFP) (Cross et al., 2004), which results in an increase in the
concentrations of fluoride ions together with bioavailable calcium and phosphate
ions and their localisation at the tooth surface by the CPP.
3
Most of the studies that investigated the effect of CPP-ACP tested its solitary
effect on caries prevention and early lesion remineralisation. On the other hand, only
a few studies investigated its effect when added to the regular oral hygiene practice
that involves brushing the teeth with fluoridated toothpaste twice daily.
Therefore the aim of the current study was to investigate the effect of the
commercially available topical crèmes containing CPP-ACP and CPP-ACFP on the
remineralisation of enamel subsurface lesions when used supplementary to
fluoridated toothpaste, and to compare their effect on remineralisation to the results
from the use of different concentration fluoridated toothpastes.
4
2.0 LITERATURE REVIEW
In the following section, the research literature concerning the dental caries
process, along with the process of demineralisation and remineralisation will be
reviewed. In addition, the role of therapeutic agents that are currently being used in
the prevention and remineralisation of dental caries will also be discussed; with the
main focus on fluoride and CPP-ACP preparations.
2.1 Dental Caries
Dental caries is defined as a localised destruction of the susceptible dental hard
tissue that is caused by the bacterial acidic by-products resulting from the
fermentation of dietary carbohydrate (Fejerskov et al., 2003).
Dental caries is an infectious disease initiated by the bacterial biofilm formed
on the tooth surface. Bacterial biofilm is composed mainly of Mutans Streptococci
and Lactobacillus which have the ability to metabolise fermentable carbohydrates to
produce acidic by-products that result in a drop of the pH in the biofilm. These
changes in the pH can cause a disturbance in the equilibrium between tooth
substance and the surrounding plaque fluid, leading to chemical dissolution and loss
of minerals from tooth surface (Featherstone, 2000).
Dental caries is a dynamic process where multiple factors play a part in the
eventual outcome of the disease. This includes the pathological factors that lead to
demineralisation, such as the high numbers of cariogenic bacteria, insufficient
5
fluoride exposure, poor oral hygiene, frequent consumption of refined carbohydrates
and the inhibition of salivary function.
On the other hand, the protective factors that lead to remineralisation include
good salivary flow, different salivary components such as calcium, phosphate,
fluoride and protective proteins, antibacterial substances present in saliva, fluoride
from extrinsic sources, and selected dietary components (Featherstone, 2004).
Dental caries is one of the most common of all human diseases. A significant
shift in the epidemiology of dental caries has been noticed in many countries; this
includes the distribution of dental caries, which has become profoundly skewed to a
small percentage of the population (Tickle, 2002).
Before the introduction of fluoride to the market, carious lesions used to
progress very fast due to the rapid progression of demineralisation (White et al.,
1988, Chan, 1993). This led to straightforward detection of the large carious lesions
and the tendency among dentists to restore rather than monitor suspicious or
questionable lesions. However, the trend was reversed after the availability of
fluoride, where caries progression slowed down, and smaller lesions became
arrested and sometimes even reversed (White et al., 1978, Dodds, 1993, Stookey,
2005).
2.1.1 Enamel caries
Dental enamel is a highly mineralised tissue; more than 95% of the mature
dental enamel is composed of apatitic crystals. This high mineral content along with
the organised structure of enamel makes it the hardest substance in the human body
(Margolis et al., 2006).
6
Enamel is composed primarily of uniformly wide, well-oriented crystals of
hydroxyapatite, packed into an organic matrix. The changes in the crystals
orientation has a repetitive pattern that results in the formation of the prisms (rods)
and interprismatic regions (Boyde, 1967). The interprismatic spaces (pores) are
filled with water and organic material and form a fine network system of diffusion in
enamel (Fejerskov et al., 2003).
The process of dental caries starts when the acidogenic bacteria in the biofilm
ferment the dietary carbohydrates producing organic acids such as lactic, formic and
acetic acids as a by-product .These acids have the ability to diffuse into the enamel
pores between the rods where they dissociate and cause pH values of the fluid
surrounding the crystals to fall below a critical value for enamel dissolution
(pH=5.5) (Aoba, 2004). This drop in the pH causes dissolution of the mineral
crystals especially of the carbonated hydroxyapatite (LeGeros, 1991). As a result,
minerals including calcium and phosphate diffuse out of the enamel causing a net
loss of enamel minerals. If this process continues cavitation will eventually take
place.
2.1.2 Demineralisation and Remineralisation
Demineralisation can be defined as ‘the loss of calcified material from the
structure of the tooth. This chemical process can be biofilm mediated (i.e. caries) or
chemically mediated (i.e. erosion) from exogenous or endogenous sources of acid’
(Fontana et al., 2010).
7
Remineralisation on the other hand 'is the net gain of calcified material within
the tooth structure, replacing that which was previously lost through
demineralisation’ (Fontana et al., 2010).
As discussed before, the demineralisation process resulted from the acid by-
products of the acidogenic bacteria in the biofilm. As these acids diffuse into the
tooth structure among the crystals, they dissolve the calcium and phosphate of the
susceptible sites on the crystals into the surrounding fluid between the crystals
(Featherstone, 2008).
Remineralisation is the body’s natural repair mechanism for the subsurface
non-cavitated carious lesions. During the remineralisation process, the calcium and
phosphate, primarily from saliva, as well as from other topical sources, diffuse back
into the porous subsurface region of the caries lesion (Featherstone, 2000).
The remineralisation process involves building a new surface onto the existing
crystal remnants, rather than the formation of new crystal. If this happens with the
presence of fluoride, the new crystal will be composed of a mineral similar to
fluorapatite, resulting in a crystal surface that is much less soluble than the original
carbonated hydroxyapatite mineral, and more difficult to dissolve by acid challenge
from the plaque (Featherstone, 2008).
All through the day, and as part of a natural physiological process, the tooth
surface is in a continuous state of demineralisation and remineralisation. Whether
the caries process starts, progresses, stops, or reverses is determined by multiple
factors. Caries will progress if the demineralisation predominates over
remineralisation, such as in the case of acidic challenge. On the other hand, when

8
remineralisation takes over demineralisation, the lesion can be arrested or even
reversed (Featherstone, 2004, Ellwood et al., 2012).
2.1.3 The Role of Saliva
The protective role of saliva in the reversal or arrestment of the caries process
is well established (Mandel and Zengo, 1973, Shannon and Edmonds, 1972).
Four main mechanisms of saliva have been described for its role in caries
prevention; this includes providing a mechanical cleansing that results in less plaque
accumulation on the tooth surface, the reduction of enamel solubility through the
supersaturating state with regards to calcium, phosphate and fluoride, and the
salivary buffering capacity that neutralises the acids produced by cariogenic bacteria
or those introduced directly through diet, as well as its antibacterial activities
(Mandel, 1974).
The salivary calcium and phosphate is maintained in a supersaturated state by
the action of salivary proteins, in particular statherin, which binds the calcium ions
and holds it readily available in solution (Lamkin and Oppenheim, 1993).
Conditions that result in the impairment of the salivary flow or function can develop
into rampant caries due to the insufficient calcium and phosphate that is available
for remineralisation (Featherstone, 2008).
2.1.4 Enamel Lesion (White Spot Lesion; WSL)
As discussed before, dental caries is now perceived as a dynamic process
which is affected by several modifiers tending to push the mineral equilibrium in
9
one direction or another (Holt, 2001). If caries balance is tilted continually toward
demineralisation, the enamel will lose enough mineral and a white spot lesion
(WSL) will develop.
Histologically, four zones have been distinguished under polarised light in
enamel lesions. These zones represent different stages of enamel demineralisation
and remineralisation: (Darling, 1958)
1- The translucent zone: this represents the ‘leading edge’ of the enamel lesion
with mineral loss of approximately 1.2% (Hallsworth et al., 1972). Its width
may vary from 5-100 μm and it is located at the deepest part of the lesion.
Gaps found between rod and inter-rod enamel provide the initial source of
mineral dissolution resulting in translucent appearance of this zone and in
enamel structures being less evident. Analysis of material lost from this zone
shows a more soluble mineral phase and the absence of calcium
hydroxyapatite.
2- The dark zone: this represents the zone of 5–10% mineral loss (Hallsworth et
al., 1972). It occurs in 90-95% of the lesions and is located between the
translucent zone and the body of the lesion. Material removed from the dark
zone was found to be closer to apatite than that in the translucent zone and
contained carbonate and magnesium (Robinson et al., 1983).
3- The body of the lesion: representing an area with 20–30% of mineral loss
(Hallsworth et al., 1972) and increased in the pore volume depth, it is the

10
area in the developing enamel lesion that ultimately loses structural integrity
and precipitates surface breakdown.
The analysis of the minerals lost from this zone revealed less soluble
materials that were closely related to hydroxyapatite (Robinson et al., 1983).
4- The surface zone: this area has a minimal loss of 1–10% in minerals
(Hallsworth et al., 1972). In addition, increased pore volume is also observed
in the surface zone. A great variation was found in the mineral distribution
within the enamel lesion with a very thick surface zones are frequently
found. The high mineral density of this zone may have resulted from the
lattice ions precipitation from the oral environment.
The intact surface zone of the caries lesion has been described by Ingram and
Edgar, (1994). They stated that the existing evidence indicates that during the caries
process, the surface zone reforms, exhibiting larger crystallites compared with sound
enamel due to the incorporation of fluoride. This demonstrates the beneficial
involvement of fluoride in the process of lesion remineralisation, even at low levels.
The ‘healed’ surface zone may prevent the diffusion of the minerals into the
deeper demineralised enamel crystals therefore preventing the remineralisation.
Consequently, in order to be able to remineralise these deeper lesions and promote
subsurface healing, alternatives to direct fluoride treatment may be required as a
remineralising protocols (Meharry et al., 2012).
Aiming to bypass this ‘healed’ layer in an attempt to remineralise the
subsurface zone of the lesion, two different approaches can be implemented: the

11
application of low levels of fluoride and calcium ions, which can penetrate deep into
the subsurface lesion (Bishara and Ostby, 2008), or applying mechanical and
chemical abrasion in order to reactivate the superficial enamel substrate (Ardus et
al., 2007).
2.2 Enamel Remineralisation Therapies
Remineralisation is an important natural process in the dynamics of dental
caries. The possibility of the remineralisation of natural enamel lesions (white spot
lesions), was first described by Backer Dirks in 1966. Subsequently, a great number
of in situ and in vitro investigations were conducted in the following decades and
showed that remineralisation occurs in newly formed artificial enamel lesions
(Mellberg et al., 1986, Dijkman et al., 1990, Manning and Edgar, 1992), as well as
in lesions formed under plaque in situ (Dijkman et al., 1986) and in vivo (Øgaard et
al., 1988). With regard to the baseline mineral loss, it has been shown that the
remineralisation of newly formed white spot lesions and in vitro formed lesions take
place in the same way (Iijima et al., 1999).
With the better understanding of the caries disease, and the ability to detect
enamel demineralisation in its early stage, comes the opportunity to promote
‘preventative’ therapies that can be used to facilitate the early caries lesions
remineralisation. Subsequently, these therapies can reverse the early lesions leading
to the preservation of tooth structure, function and aesthetics (Pretty, 2006).
Currently a range of therapeutic procedures and a variety of new agents have
been developed to conservatively manage early caries lesions. These comprise of the
12
intensive use of topical fluoride treatments (dentifrices, varnishes, or gels), several
preparations of calcium and phosphate, improved oral hygiene, and reducing the
number of daily exposures to fermentable carbohydrates (Stookey, 2005).
2.2.1 Fluoride
Fluoride is widely accepted as the most effective tool for caries prevention.
The introduction of fluoridated toothpastes has a major role in the dental caries
decline seen in developed countries over the last decades (Twetman, 2009). Current
best practice and the evidence-based toolkit for prevention recommends twice-daily
toothbrushing with fluoride toothpaste for dentate children (Zero et al., 2012,
Department of health prevention toolkit, 2014).
Many studies have demonstrated the profound effect of fluoride on enamel
demineralisation and remineralisation that resulted from regular use of toothpaste,
even with low levels of fluoride (Bowen, 1995, Lynch et al., 2004).
2.2.1.1 Fluoride Mechanism of Action
Fluoride was proved to have both systemic and topical effects. The systemic
effect of fluoride takes place during tooth development and involves the replacement
of hydroxyapatite crystals with fluoroapatite crystals, which are characterised by
being more stable and less likely to dissolve with acids. It is widely believed that the
topical effect of fluoride rather than systemic delivery is more effective in caries
reduction (Fejerskov et al., 1996).
13
The main mechanisms of fluoride action are the inhibition of
demineralisation and promotion of remineralisation of tooth enamel, as the presence
of fluoride ions during the demineralisation and remineralisation cycle leads to its
incorporation into the crystalline structure of the carbonated hydroxyapatite (HA).
However, the action of fluoride in enamel remineralisation is limited by the bio-
availability of calcium and phosphate ions in saliva (ten Cate, 1999, Aoba, 2004,
Edgar et al., 2004, Featherstone, 2006, Reynolds, 2008).
Fluoride ions in plaque immediately promote the formation of fluorapatite in
the presence of the calcium and phosphate ions produced during demineralisation of
tooth enamel by plaque bacterial organic acids. This is now believed to be the major
mechanism of fluoride action in preventing enamel demineralisation (ten Cate, 1999,
Reynolds, 2008).
Fluoride ions can also promote the remineralisation of previously
demineralised enamel if salivary or plaque calcium and phosphate ions are available
in adequate amounts when the fluoride is applied (ten Cate, 1999), for every two
fluoride ions, ten calcium ions and six phosphate ions are required to form one unit
cell of fluorapatite [Ca10(PO4)6F2] (Reynolds, 2009).
Other effects of fluoride include the inhibition of glycolysis, and reduce the
production of extra-cellular polysaccharides in plaque bacteria. In addition, fluoride
is a bactericidal at high concentrations, and has an effect on the cariogenic potential
of the Streptococcus mutans.
14
2.2.1.2 Fluoride in Saliva
The presence of the fluoride in the liquid phase at the enamel-plaque interface
and its activity in the oral fluid are the most important factors in reducing enamel
solubility. Several studies revealed that fluoride levels as low as 0.01-0.10 ppm were
effective in the prevention of the enamel dissolution (Manly and Harrington, 1959,
Larsen, 1990).
The fluoride levels in saliva and caries status has been investigated in many
studies. A number of these studies showed a clear link between elevated salivary
fluoride levels and low caries status (Bruun and Thylstrup, 1984, Leverett et al.,
1987). In one study to evaluate the salivary fluoride level in children living in
fluoridated and non-fluoridated communities, Shields et al. (1987), reported that the
salivary fluoride levels in low caries children were (>0.04 ppm), whereas the
salivary fluoride levels in children with high caries-risk were (<0.02 ppm).
2.2.1.3 Fluoride Delivery Systems
Water fluoridation was the first breakthrough in preventive dentistry, which
was then followed by different forms of topical fluoride applications (toothpaste,
mouth rinse and professionally applied fluoride) (Marthaler and Petersen, 2005).
The effect of water fluoridation in dental caries was evaluated in several
studies, and was shown to reduce the dental caries experience both in primary and
permanent dentition by about 50% (Murray et al., 1991, Booth et al., 1992).
Moreover, fluoride-containing dentifrices and mouth rinses have proven to
decrease caries experience significantly in several randomised, controlled clinical

15
trials (Biesbrock et al., 2001, Marinho et al., 2003). The dose response effect of
different fluoride levels in toothpastes was also established in different clinical trials
(Chesters et al., 1992, Biesbrock et al., 2003), and in a recent Cochrane review
published by Walsh et al. (2010), who indicated that the caries preventive effect of
fluoride toothpaste significantly increases with higher fluoride concentrations. And
that the 1000 ppm F is the minimal fluoride concentration with a cariostatic activity.
Literature indicated that 1450 ppm F toothpastes display anti-caries efficacy
(Walsh et al., 2010, Biesbrock et al., 2003, Chesters et al., 1992, Marinho et al.,
2003). This concentration is being used widely in adult toothpastes in Europe. The
current EAPD as well as the BSPD guidelines recommended the use of 1450 ppm F
toothpaste, and the evidence-based toolkit for prevention also recommended the use
fluoridated toothpaste (1,350-1,500 ppm fluoride) for individuals over 6 years of age
(Department of health prevention toolkit, 2014).
Other preparations with higher fluoride concentrations of 2800 ppm F and
5000 ppm F are also available. It has been shown that 2800 ppm F toothpaste
provides clinically-proven anti-caries benefits (Biesbrock et al., 2001). These
preparations are usually given on prescription and target the groups with a high risk
of caries.
The anti-caries effect of fluoride toothpaste is affected by two factors; the
concentration of fluoride in the toothpaste, and the post-brushing water-rinsing
behaviour.
A correlation has been found between the fluoride concentration of dentifrices
ranging between 0 and 5000 ppm F and caries prevention (Tavss et al., 2003). A
randomised clinical trial aimed to compare two toothpastes with different fluoride
16
concentrations, mainly 5000 and 1450 ppm F reported a reversal in non-cavitated
fissure caries lesions with the high fluoride concentration toothpaste. In addition to
that, the group using 5000 ppm F showed a significantly higher decrease in laser
fluorescence of enamel than the 1450 ppm F group (Schirrmeister et al., 2007a).
A correlation has also been found between the rinsing method after tooth
brushing with caries experience and caries increment (Pitts et al., 2012). Salivary
fluoride concentration measured after dentifrice application decreases significantly
with increasing water volume, rinse duration and frequency of rinsing (Duckworth et
al., 1991, Attin and Hellwig, 1995). Eating immediately after brushing was also
found to result in a reduction in the salivary fluoride level about 12–15 fold (Sjögren
and Birkhed, 1994). An average of 26% reduction in the approximal caries in
preschool children was seen when a slurry rinse with the toothpaste was carried out
after brushing (Sjögren et al., 1995). The fluoride concentration in proximal saliva
and plaque was increased after using a dentifrice with 5000 ppm F without post-
brushing water rinsing compared to a with-rinsing regimen (Nordström and Birkhed,
2009).
2.2.1.4 Fluoride Limitation
As mentioned earlier, fluoride has a strong effect on caries prevalence
worldwide. However, fluoride does not provide a complete cure.
Fluoride action is limited by the bio-availability of calcium and phosphate
ions. The salivary reservoirs of calcium and phosphate are rapidly depleted under
acid challenges leading to a net loss of enamel minerals. Therefore, the use of a
delivery system for bio-available calcium and phosphate ions is an important adjunct
17
to fluoride treatment for the non-invasive management of early caries lesions
(Reynolds, 2009, Yamazaki et al., 2007).
2.2.1.5 Fluoride Toxicity and Dental Fluorosis
Fluoride can be toxic if used in high doses; the fluoride toxicity can be acute or
chronic depending on the dose.
Acute fluoride toxicity can result if the toxic dose was ingested, however, the
exact toxic dose is not known. Lidbeck et al. (1943), stated that the toxic dose was
over 100 mg F/kg, while Dreisbach, (1980) estimated that it was 6-9 mg F/kg.
Signs and symptoms of acute fluoride toxicity include nausea, vomiting,
hyper-salivation, abdominal pain and diarrhoea in case of ingestion of low dosage of
fluoride, while convulsions, cardiac arrhythmias and comatose can result from high
doses.
Chronic fluoride toxicity can result from frequent exposure to low levels of
fluoride over a prolonged period of time. Depending on the ingested dose it can be
expressed as dental fluorosis, skeletal fluorosis and kidney damage.
Overexposure to fluoride, especially in young children can cause fluorosis.
Dental fluorosis is an alteration in the tooth structure which results from excessive
fluoride ingestion during the pre-eruptive development of teeth. It has shown to have
a dose response effect and it results in increased surface and subsurface porosity.
The severity of dental fluorosis was found to be associated with a number of
factors namely; the dose of fluoride, timing of fluoride exposure and duration of
18
exposure (Dean et al., 1950). Teeth are more susceptable to fluorosis during their
transitional or early maturation stage of enamel development.
Several mechanisms have been suggested in the literature to explain the
development of dental fluorosis among teeth, yet the exact mechanism is still
unknown. The available evidence indicates that fluoride has an effect on cell
function; either directly through interactions with the developing ameloblasts or
more indirectly by interacting with the extracellular matrix therefore preventing the
full maturation of the tissue (DenBesten and Crenshaw, 1984, Smith et al., 1993).
Wong et al. (2011), in their Cochrane review concluded that “there should be a
balanced consideration between the benefits of topical fluorides in caries prevention
and the risk of the development of fluorosis”.

19
2.2.2 Milk Products and Enamel Remineralisation
The beneficial dental effects of milk have been known for many years. This
effect was attributed to the presence of calcium and phosphate in high
concentrations in milk that help to prevent dilution of enamel (Birkhed et al., 1993,
Bowen and Pearson, 1993) along with casein, a multi-phosphorolyted protein, which
stabilises milk calcium and phosphate ions in a colloidal state in micelles
(Moynihan, 2000, Reynolds, 1987). As the majority of the casein and calcium and
phosphate ions are bound in micelles, the calcium and phosphate may not be readily
available to the tooth surface upon milk consumption (Reynolds, 1987, Holt et al.,
1996). In addition to that, the diffusion of the calcium in casein micelles into the
subsurface lesion is usually unlikely to occur due to the presence of a relatively
intact enamel surface layer, therefore limiting the ability to remineralise enamel
lesion in situ (Ferrazzano et al., 2011). In spite of this limitation and the presence of
the fermentable disaccharide lactose, the anti-cariogenic activity of milk is still
demonstrated when tested in a rat model, even in de-salivated rats (Reynolds and
Johnson, 1981, Bowen et al., 1991), and it remineralised enamel subsurface lesions
in a human in situ model (Walker et al., 2006). Other milk products like cheeses did
not cause pH drops below the critical pH for enamel dissolution when tested using
an in situ model (Drummond et al., 2002).

20
2.2.3 Casein Phosphopeptide - Amorphous Calcium Phosphate (CPP-
ACP)
The low solubility of calcium and phosphate ions, especially in the presence of
fluoride ions, made it unsuccessful for use in remineralisation in the past. It was
found to be difficult to apply and was not effectively localised at the tooth surface.
An acid is required to produce the ions which are then able to diffuse into the
enamel subsurface lesion (Reynolds, 2009). In addition, only very low
concentrations of soluble calcium and phosphate can be used due to the intrinsic
insolubility of calcium phosphates, particularly calcium fluorophosphates.
Moreover, these soluble calcium and phosphate ions neither incorporate into dental
plaque, nor localise at the tooth surface in order to produce effective concentration
gradients to drive diffusion into the subsurface enamel (Reynolds, 2009).
Casein phosphopeptide-amorphous calcium phosphate (CPP-ACP) is a new
calcium phosphate remineralisation technology which has been developed, and
postulated that CPP stabilises calcium and phosphate in high concentrations in
addition to fluoride ions, by binding to the pellicle and plaque at the tooth surface.
This enables the calcium and phosphate ions to be freely bio-available to diffuse into
the enamel subsurface lesion by the concentration gradients, and effectively
promoting remineralisation in vivo (Reynolds, 2009).
Casein is the major milk protein, and accounts for almost 80% of its total
protein, it presents primarily as calcium phosphate stabilised micellular complexes,
and is responsible for the anti-cariogenic properties of milk (Aimutis, 2004,
Azarpazhooh and Limeback, 2008, Bánóczy et al., 2009). Casein phosphopeptides
(CPP) contain the cluster sequence -Ser(P)-Ser(P)-Ser(P)-Glu-Glu- that have a
21
remarkable ability to stabilise amorphous calcium phosphate (ACP) in a metastable
solution. Through the multiple phosphoseryl residues, CPP binds to form
nanoclusters of ACP, preventing their growth to the critical size required for
nucleation and phase transformation (Reynolds, 1998, Shen et al., 2001).
The role of CPP-ACP involves the localisation of ACP on the tooth surface;
this in turn leads to buffering of the free calcium and phosphate ions activities,
which help to maintain a state of super-saturation with respect to enamel by
suppressing demineralisation and enhancing remineralisation. The presence of CPP-
ACP might permit a rapid return to resting calcium concentration and allow earlier
remineralisation of enamel substrate (Reynolds, 1998).
Other roles of CPPs include binding to the S. mutans surface, directly and
strongly, which provides a source of calcium and phosphate in the plaque fluid and
reduce the loss of plaque calcium by inhibiting its diffusion. In addition to that, CPP
also reduced the adherence of S. mutans and S. sobrinus within dental plaque and
onto hydroxyapatite, causing a significant reduction in the proportion of the mutans
streptococci in rat and in vitro studies (Neeser et al., 1994, Schüpbach et al., 1996,
Guggenheim et al., 1999, Wernersson et al., 2006).
Van der Veen et al. (2009), reported a more than 60% reduction in the plaque
S. mutans proportion after 12 weeks exposure to a commercially available crème
containing CPP-ACP and fluoride compared to a similar crème without CPP-ACP.
22
The anticariogenic mechanism for CPP-ACP is believed to be multifactorial
through the following mode of action (Beerens et al., 2010):
(i) Promotion of enamel lesion remineralisation by maintaining a
supersaturated state of the enamel minerals calcium and phosphate in
plaque.
(ii) Delay the formation of biofilm and inhibit bacterial adhesion to the tooth
surface.
(iii) Act as a buffering agent, which may prevent the reduction of pH in the
oral micro-environment.
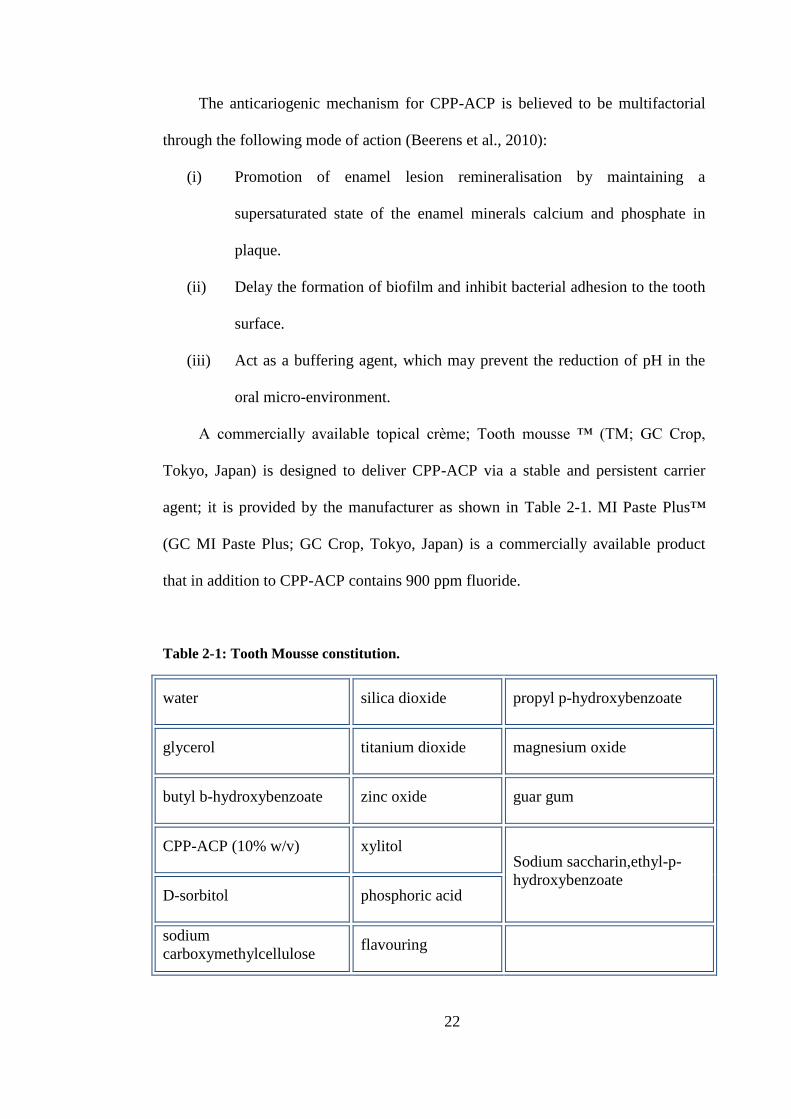
A commercially available topical crème; Tooth mousse ™ (TM; GC Crop,
Tokyo, Japan) is designed to deliver CPP-ACP via a stable and persistent carrier
agent; it is provided by the manufacturer as shown in Table 2-1. MI Paste Plus™
(GC MI Paste Plus; GC Crop, Tokyo, Japan) is a commercially available product
that in addition to CPP-ACP contains 900 ppm fluoride.
Table 2-1: Tooth Mousse constitution.
water silica dioxide propyl p-hydroxybenzoate
glycerol titanium dioxide magnesium oxide
butyl b-hydroxybenzoate zinc oxide guar gum
CPP-ACP (10% w/v) xylitol Sodium saccharin,ethyl-p-
hydroxybenzoate D-sorbitol phosphoric acid
sodium
carboxymethylcellulose flavouring

23
Azarpazhooh and Limeback, (2008) conducted a systematic review on the
efficacy of casein derivatives in clinical dentistry. The outcomes of interest of the
review were caries prevention (10 studies), relief from dry mouth symptoms (one
study) and treating dentin hypersensitivity (one study).
Regarding the outcome 'caries prevention' the review identified 10 studies of
caries prevention via treatment with casein derivatives. Eight of these studies were
randomised clinical trials with crossover designs that determined the remineralising
effects of CPP-ACP by using in situ caries models. The other two studies were in
vivo studies. The analysis of the studies showed that seven trials favoured CPP-ACP
in comparison to control, two studies found no additional benefit and one study had
contradictory findings. The authors of the review concluded that 'there is insufficient
clinical trial evidence (in quantity, quality or both) to make a recommendation
regarding the long-term effectiveness of casein derivatives, specifically CPP-ACP,
in preventing caries in vivo'.
A more recent meta-analysis study carried out by Yengopal and Mickenautsch,
(2009) to investigate whether CPP-ACP has any superior caries-preventive benefit
over any other intervention or placebo.
Five in situ randomised control trials (RCT) have been pooled for the meta-
analyses. These included in situ trials were participants wore appliances containing
enamel slabs for short-term (7-21 days) and the enamel slabs were then analysed in
the laboratory after exposure to CPP-ACP.
Exposure to CPP-ACP was found to improve the remineralisation of carious
lesions significantly when compared to the control group.

24
The authors’ conclusion indicates a short-term remineralisation effect of CPP-
ACP supported by the results of the in situ clinical trials, and in vivo RCT results
suggest a caries preventive effect for long-term clinical CPP-ACP use.
2.2.3.1 CPP-ACP Effect on Demineralisation
CPP-ACP binds readily to both the tooth surface and the bacteria in the plaque
surrounding it, depositing a high concentration of ACP in close proximity of the
tooth surface. This buffers free calcium and phosphate ions that increase the calcium
phosphate level in the plaque. A state of super-saturation can be maintained in this
way, which results in the inhibition of enamel demineralisation whilst enhancing
remineralisation (Reynolds et al., 1995, Reynolds et al., 1999).
The CPP-ACP efficacy in the prevention of demineralisation has been widely
investigated in both in vitro and in situ studies. Rahiotis and Vougiouklakis, (2007)
investigated the effect of CPP-ACP complex on the demineralisation of sound
human dentine in an in vitro study. Dentine in test groups received Tooth Mousse,
whereas no Tooth Mousse was provided to the control group. The dentine slabs were
then immersed in a demineralisation solution. It was found that single application of
Tooth Mousse reduced demineralisation of dentine significantly (%
demineralisation=19.6 ± 7.8) when results were compared to the control group (%
demineralisation=28.1 ± 7.0).
In a human in situ enamel demineralisation study, a 2.0% w/w sodium casinate
solution used twice daily produced a 51 ± 19% reduction in enamel mineral loss
caused by frequent sugar-solution exposure. In addition, an increase in the levels of
calcium and inorganic phosphate (144%, 160% respectively) in the inter-enamel
25
plaque were reported when 2.0% casine solution was used twice daily (Reynolds,
1987).
Another study used ultrasonic wave velocity to determine the effect of CPP-
ACP, and showed no significant increase in sonic velocity observed in specimens
treated with CPP-ACP before exposure to acid challenge. This suggests the
preventive role of CPP-ACP in enamel demineralisation (Yamaguchi et al., 2007).
Ferrazzano et al. (2007), used the weight loss of the samples to determine
demineralisation in their study. They showed that the addition of 1.0% w/v of CPP
to a demineralising fluid resulted in more than 50% less mineral loss from the
enamel that was exposed to a demineralising gel containing CPP compared to that
exposed to gel without CPP.
Another study carried out by Giulio et al. (2009), was conducted to
qualitatively evaluate by means of scanning electron microscopy (SEM) the effect of
CPP-ACP on striped enamel morphology after exposure to an acid solution. The
teeth were placed in acidic lactic solution for two hours three times a day for eight
days, with two hours water preservation in between. The SEM micrographs showed
that the stripped enamel samples exhibit a greater demineralisation compared to
unstripped enamel, and CPP-ACP reduced enamel dissolution on both intact and
abraded samples.
It has been reported that enamel subsurface lesions which were remineralised
by CPP-ACP were more resistant to demineralisation. Iijima et al. (2004), conducted
an in situ study to investigate the acid resistance of enamel lesions remineralised
using a sugar-free chewing gum containing CPP-ACP. In this study subjects were
required to chew either sugar-free gum containing 18.8 mg of CPP-ACP or sugar-
free gum without CPP-ACP. After that, the enamel slabs were exposed to acid
26
challenge in vitro for eight or 16 hours. The results showed the CPP-ACP containing
gum produced approximately twice the level of remineralisation as compared with
the control sugar-free gum (17.88 ± 0.74 vs. 9.02 ± 0.74 respectively). The eight and
16 hour acid challenge of the lesions remineralised with the CPP-ACP group led to
30.5% and 41.8% reductions in the deposited minerals respectively, compared to
65.4% and 88.0% reductions in the control group. This means sugar-free gum
containing CPP-ACP remineralises enamel subsurface lesions with minerals that are
more resistant to acid challenges. These observations are similar to those of Cai et
al. (2003), who investigated the effects of sucking sugar-free lozenges containing
different concentrations of CPP-ACP in a similar in situ model. A dose response in
relation to the amount of CPP-ACP in the lozenges was observed, with percentage
remineralisation (% R) values of 7.03 ± 0.65 for the control lozenges and 12.50 ±
1.48 and 19.39 ± 1.69 for the lozenges containing 18.8mg and 56.4mg CPP-ACP,
respectively.
The effects of a CPP-ACP and fluoride containing topical agents in reducing
enamel demineralisation around orthodontic brackets, was evaluated in an in vivo
and in vitro study (Uysal et al., 2010). In the in vivo study, 21 orthodontic patients
scheduled to have first premolars teeth extracted for orthodontic reasons were
involved and brackets were bonded on the maxillary and mandibular first premolars.
The study subjects were randomly assigned into three groups: Tooth Mousse (CPP-
ACP containing topical gel), Fluoridin N5 (sodium fluoride containing topical gel)
and a control group. Following 60 days, the brackets were removed and teeth were
extracted to evaluate the in vivo effects of the testing materials. Cross sectional
microhardness was used to assess demineralisation in enamel around the brackets.
27
The in vitro study consisted of 60 extracted premolars which were divided
into the same three groups. Whilst teeth from the control group were immersed in
demineralisation and remineralisation solutions without exposure to any topical
solution, teeth from the CPP-ACP and sodium fluoride topical gel groups were
treated with a 0.5 mL coat of predetermined topical solution before immersion in
cycling solutions. Samples were cycled for 14 days.
The results of both studies showed that the use of CPP-ACP and fluoride
containing topical gels were more significantly efficient on preventing enamel
demineraliation than the control group (p <0.001). No significant differences were
detected between CPP-ACP and the fluoride groups against demineralisation.
Another in vitro study was carried out to investigate the effect of Tooth
Mousse on the progression of enamel subsurface lesions around cemented
orthodontic brackets. The results indicated the preventive effect of Tooth Mousse in
reducing demineralisation when the brackets were cemented with a resin based
cement, and especially when Tooth Mousse was applied with 9000 ppm sodium
fluoride gel in a 50/50 w/w mix, as it has a synergistic effect resulting in minimal
demineralisation (Sudjalim et al., 2007).
2.2.3.2 CPP-ACP Effect in Remineralisation
Although the ability of CPP-ACP in promoting remineralisation in animals
was demonstrated in 1995, it was first used for the treatment of white spots lesions
in 2009.
Reynolds et al. (2003), showed that CPP-ACP technology was superior to
other forms of calcium phosphate in remineralising enamel subsurface lesions. Other
28
studies also highlighted the role of CPP-ACP in stabilising calcium and phosphate at
high levels, and in delivering the ions to the tooth surface. They also demonstrated
that CPP-ACP was able to bind to bacterial cells. It was shown that the CPP-ACP
bound to Streptococcus mutans and model plaque makes a reservoir of bio-available
calcium ions (Rose, 2000, Reynolds et al., 2003).
2.2.3.2.1 In Vitro Remineralisation Studies
In an in vitro study, a solution of 1.0% w/v of CPP-ACP was tested for its
effect on enamel subsurface lesion remineralisation, the results showed that this
solution replaced 63.9 ± 20.1% of mineral lost from an enamel subsurface lesion
after 10 days exposure. A dose response was also evident in this study as 0.5% CPP-
ACP replaced 51.6 ± 20.8% of minerals compared with 43.6 ± 18.9% replacement
by 0.1% CPP-ACP solution (Reynolds, 1997).
Another study reported a total mineral replacement (% R) of 15.0 ± 3.5% when
2% CPP-ACP solution was used at pH of 7.0. It was also found that the value of
mineral replacement increased to 41.8 ± 8.5% when pH dropped to 5.5. On the other
hand, when the pH fell below 5.5, the % R values also decreased, reaching 10.3 ±
3.3 at pH 4.5. A significant increase in the % R up to 57.7 ± 8.4% at pH 5.5 was
reported when fluoride was incorporated into the CPP-ACP complex leading to the
formation of CPP-ACFP complexes (Cochrane et al., 2008).
The CPP-ACP effect on dentine remineralisation was quantified by surface
analysis in vitro using micro MIR-FTIR. Remineralisation of 7.15 ± 3.0% was
obtained when the dentine surface was exposed to Tooth Mousse. However, only 4.1
± 1.5% of remineralisation was obtained in the control group. The authors suggested
29
that the direct physical barrier provided by the CPP-ACP to demineralisation in
conjunction with an increased concentration of calcium at the surface inhibiting
mineral loss was the main mechanism for the increased remineralisation in the Tooth
Mousse group (Rahiotis and Vougiouklakis, 2007).
Polarised light microscopy and pH cycling were used in an in vitro study to
quantify enamel surface lesions. In this study, Tooth Mousse was used as a topical
coating and as toothpaste, leading to a significantly increased level of mineralisation
of the enamel surface lesions when compared with the control specimens. Further
increases in the remineralisation of enamel surface lesions (approximately 30%)
were also noted after combining the Tooth Mousse with fluoridated toothpaste
(Kumar et al., 2008).
A study using sonic velocity to quantify bovine enamel mineralisation reported
that using a 1:10 dilution of Tooth Mousse enhances the mineralisation of enamel
under acidic conditions (0.1 M buffered lactic acid) for 10 minutes twice a day for
10 days (Yamaguchi et al., 2007).
In a recent study using DIAGNOdent™ (Jayarajan et al., 2011), both Tooth
Mousse and Tooth Mousse Plus showed statistically significant enamel
remineralisation compared with the control group (artificial saliva), the maximum
remineralisation was obtained by the Tooth Mousse Plus group.
The effects of the CPP-ACP on the remineralisation of artificial early enamel
lesions of the primary teeth were assessed in vitro study. Enamel specimens with
artificial early lesions were randomly divided into three groups; distilled and
deionised water as negative control, 500 ppm NaF solution as positive control, and
the CPP-ACP crème as the test group. The specimens underwent the
30
remineralisation process twice a day for 30 days. The enamel surface microhardness
(SMH) was measured before and after demineralisation, as well as 30 days after
remineralisation. The SMH of the eroded enamel in the CPP-ACP crème group had
increased significantly compared to that in the 500 ppm NaF solution group (Zhang
et al., 2011).
2.2.3.2.2 In Situ Remineralisation Studies
Reynolds et al. (2003), carried out an in situ study to test the effect of chewing
gum containing CPP-ACP four times per day for 14 days on enamel remineraliation.
They found that proportional remineralisation (% R) was 19.0 ± 2.5% for the CPP-
ACP chewing gum, whilst chewing gum with added CaCO₃ produced 8.9 ± 1.4%
remineralisation. The % R values for chewing a gum containing CCP-ACP, for
seven times per day for seven days were 19.4 ± 1.0% compared with 6.3 ± 1.2%,
resulted from chewing gum containing CaCO₃. Indicating that the remineralisation
capability of CPP-ACP was significantly higher compared with the chewing gums
of un-stabilised calcium.
Increased enamel subsurface remineralisation up to 102% and 152% were
reported after chewing gum containing 18.8 mg and 56.4 mg of CPP-ACP,
respectively for 20 minutes four times per day for 14 days compared with control
sugar-free gum (Cai et al., 2007). The microradiographic analysis showed that the
remineralisation occurred throughout the body of the lesion. The study author
reported that the remineralised apatite was more resistant to acid challenge than the
normal calcium-deficient carbonated tooth enamel.

31
In an in situ study by Schirrmeister et al. (2007b), a mandibular appliance was
used with bovine enamel slabs placed in the buccal sulcus. Different chewing gums
were used, one of them containing casein/hydrolysed casein and calcium phosphate
(Phoscal™), incorrectly described as CPP-ACP, and subjects were asked to chew
them four times per day for 14 days. In contrast with previuos studies, no significant
difference was found in remineralisation potential between the different gums, and
no significant greater % R was reported after chewing gum compared to the control
in this study.
Itthagarun et al. (2005), also used the in situ model with a mandibular
appliance to investigate the effect of gums containing urea alone, urea with
dicalcium phosphate, and urea with casein/hydrolysed casein and calcium phosphate
(Phoscal™). The study subjects chewed the gums five times-per-day for 21 days.
The appliance was continuously worn for the trial period and to encourage plaque
formation, Dacron™ gauze was used. Results showed that chewing gum containing
Phoscal™ had a significantly greater % R than the control gum. The difference
between the Phoscal™/urea gum and the dicalcium phosphate dehydrate/urea gum
was not significant, despite the gum with Phoscal™ having a 20% greater % R and
30% greater reduction in lesion depth.
In an attempt to enhance the positive dental effect of bovine milk, an in situ
model in a double-blind cross-over design study was conducted, with the subjects
drinking 200 mL of bovine milk with added CPP-ACP at two concentrations of 2
and 5 g/L, once a day for 15 days. The remineralisation of the enamel subsurface
lesions exposed to the two test milks were more than for the control group with the
increase in the % R values of 70% and 148% with a dose response relationship
(Walker et al., 2006). In addition, about 81% and 164% increases in the % R when
32
drinking CPP-ACP containing milk at concentrations 2g/L and 3g/L were reported
in another more recent study (Walker et al., 2009).
To investigate the CPP-ACP potential to slow the progression of enamel
subsurface lesions, study using in situ model was carried out using CPP-ACP added
to hard candy confections (Walker et al., 2010). The results showed that whilst the
consumption of the control sugar confection resulted in a significant
demineralisation (progression) in the enamel subsurface lesion, the consumption of
the sugar confections containing CPP-ACP did not result in lesion progression;
rather, it resulted in significant remineralisation (regression) of the lesion. The
remineralisation by consumption of the sugar with 1.0% CPP-ACP confection was
significantly greater than that obtained with the sugar free confection.
2.2.3.2.3 In Vivo Remineralisation Studies
The effect of CPP-ACP in enamel remineralisation and caries prevention was
assessed in a number of randomised control trials.
Morgan et al. (2008), conducted a two year randomised controlled clinical trial
with 2,720 subjects. The aim was to compare the effect of two chewing gums; one
containing 54 mg CPP-ACP per serving to an identical gum not containing CPP-
ACP, on the prevalence of dental caries. Standardised bitewing radiographs were
taken both at baseline and endpoint of the study to assess caries progression or
regression over a two year period. The subjects followed a regimen of chewing the
allocated gum for ten minutes three times per day, one chew being supervised at
school. When transition scores were used to evaluate caries progression or
regression, 18% fewer progressions were observed in the CPP-ACP group, and a
33
statistically significant lower chance of surface progression in the CPP-ACP gum
group (OR = 0.82, p = 0.03) were reported. In this study, the efficacy of the gum
containing CPP-ACP in reducing caries prevalence was believed to be marked,
especially considering that study subjects were living in a community (Melbourne,
Australia) with water fluoridation (1 ppm F), the incidence of caries was low, and
both groups were supplied with preventive products and the positive control group
also chewed a sugar-free gum three times per day, reducing their caries-risk and
therefore reducing the possible incremental difference between the control and test
groups.
Ferrazzano et al. (2011), conducted an in vivo study to test the effectiveness of
CPP to promote remineralisation of early enamel caries. Patients with an age range
of 10-16 years were selected and divided into two groups. Two demineralised
enamel specimens were placed in the buccal surfaces of the upper first molars. In the
first group, subjects were instructed to apply Tooth Mousse on the right sided
specimen only and to use a placebo mousse on the left side. The application was
done on a daily bases, three times per day for one month. In the second group,
subjects had no treatment and enamel specimens were used as a control. The results
of the SEM analysis showed a diffuse and homogeneous mineral coating that
reduced the surface alterations only in the demineralised specimen treated with
Tooth Mousse.
A more recent clinical trial (Sitthisettapong et al., 2012) was conducted to test
the effect of daily application of 10% w/v CPP-ACP paste for one year when added
to regular toothbrushing with fluoridated toothpaste to prevent dental caries in pre-
school children.

34
The study population consisted of preschool children with high-caries-risk
aged two to three years. Children were randomly assigned to receive either 10% w/v
CPP-ACP paste (n = 150) or a placebo control (n = 146) in addition to fluoridated
toothpaste. Every school day, trained teachers perform the toothbrushing with
fluoridated toothpaste (1000 ppm F), followed by the application of the child’s
coded pastes. The assessment using The International Caries Detection and
Assessment System (ICDAS) was recorded at baseline, six months, and one year.
A significant increase in mean numbers of enamel and dentin carious lesions,
as well as dmfs, was found in both groups after one year with no significant
difference between the two groups.
A number of randomised control trials were also conducted to evaluate the
effect of CPP-ACP/CPP-ACFP (Tooth Mousse, MI paste plus) on the
remineralisation of white spot lesions.
An in vivo study was used to assess the effect a casein based product
(Topocal™) incorrectly identified as CPP-ACP on post-orthodontic white spot
lesions (Andersson et al., 2007). The study involved 26 subjects who were randomly
assigned to either the test group using Topocal™ as a dentifrice for three months,
followed by three months use of fluoridated toothpaste (1000-1100 ppm F) or a
positive control group using fluoridated toothpaste and a 0.05% sodium fluoride
mouth-rinse for six months. Laser fluorescence (DIAGNOdent™) in addition to the
visual assessment was used to quantify the post-orthodontic white spot lesions. In
this study, Topocal™ containing cream was found to have a greater capability of
returning the white spot lesions to a normal appearance. At 12 months, the white
35
spot lesions that returned to normal in the Topocal™ group were three times more
compared with that in the positive control group.
To test the efficacy of Tooth Mousse compared with a Tooth Mousse placebo
without CPP-ACP, a similar white spot lesion model was used in de-banded
orthodontic patients. Visual assessment using ICDASII determined a significant
difference between the test and the placebo group after three months. In the severe
lesions, more regression was reported with Tooth Mousse (31%) compared with a
placebo (OR = 2.3, P = 0.04) and in the active lesions compared with the inactive
lesions (OR = 5.07; P > 0.001) in both the test and the control group. This means
diffusion of calcium and phosphate ions occurred to a greater extent into lesions
with increased surface pore size (Bailey et al., 2009).
Beerens et al. (2010), investigated using a double-blind prospective
randomised clinical trial the effect of CPP-ACFP (MI-Past Plus) on the
remineralisation of white spot caries lesions and on plaque composition compared to
that of a control group using fluoride-free paste with calcium.
Orthodontic patients (n = 54) with multiple white spot lesions were included in
this randomised clinical trial. Subjects were randomly assigned to either the CPP-
ACFP paste or control paste, and instructed to use these products supplementary to
their normal oral hygiene. The subjects were followed up for three months and
quantitative light-induced fluorescence (QLF) was used to assess the caries
regression. QLF images were captured directly after the debonding and at six and 12
weeks thereafter. The results showed that both groups had a significant decrease in
fluorescence loss compared to baseline and no difference was found between the
groups. No significant changes in the size of the lesion area were noticed over time
or between the groups.
36
Plaque composition was also investigated in this study, plaque samples were
obtained just before debonding and at six and 12 weeks afterwards. The total counts
and proportions of aciduric bacteria, Streptococcus mutans, and Lactobacillus spp
were measured. A reduction in the percentage of aciduric bacteria from 47.4 to
38.1% and of S. mutans from 9.6 to 6.6% was reported. No difference was found
between the groups. The authors concluded that there was no clinical advantage for
use of the CPP-ACFP paste supplementary to normal oral hygiene over the time
span of 12 weeks.
In another clinical trial (Bröchner et al., 2011), the study subject were divided
into two groups. Subjects in the first group were instructed to apply Tooth Mousse
once daily (in the evening) and to brush their teeth with standard fluoride toothpaste
(1100 ppm F) in the morning. While In the control group, the subjects were
instructed to brush their teeth with standard fluoride toothpaste two times a day
(morning and evening). This was done for a study period of 4 weeks, during this
period the use of additional preventive measures based on fluoride was prohibited.
QLF was used in this trial to assess the white spot lesion regression or progression
after fixed orthodontic treatment.
The result of this study showed that statistically significant reductions of the
ΔF values, approximately 30–35%, were observed in both study groups. However,
there was no difference between the groups. Regarding the lesion area, a reduction
by 58% was noticed in the CPP–ACP group and 26% in the fluoride group, this
difference was close to reaching statistical significance (p = 0.06).
Akin and Basciftci, (2012) carried out a randomised clinical trial, investigated
different treatments for white spot lesions after fixed orthodontic therapy. The
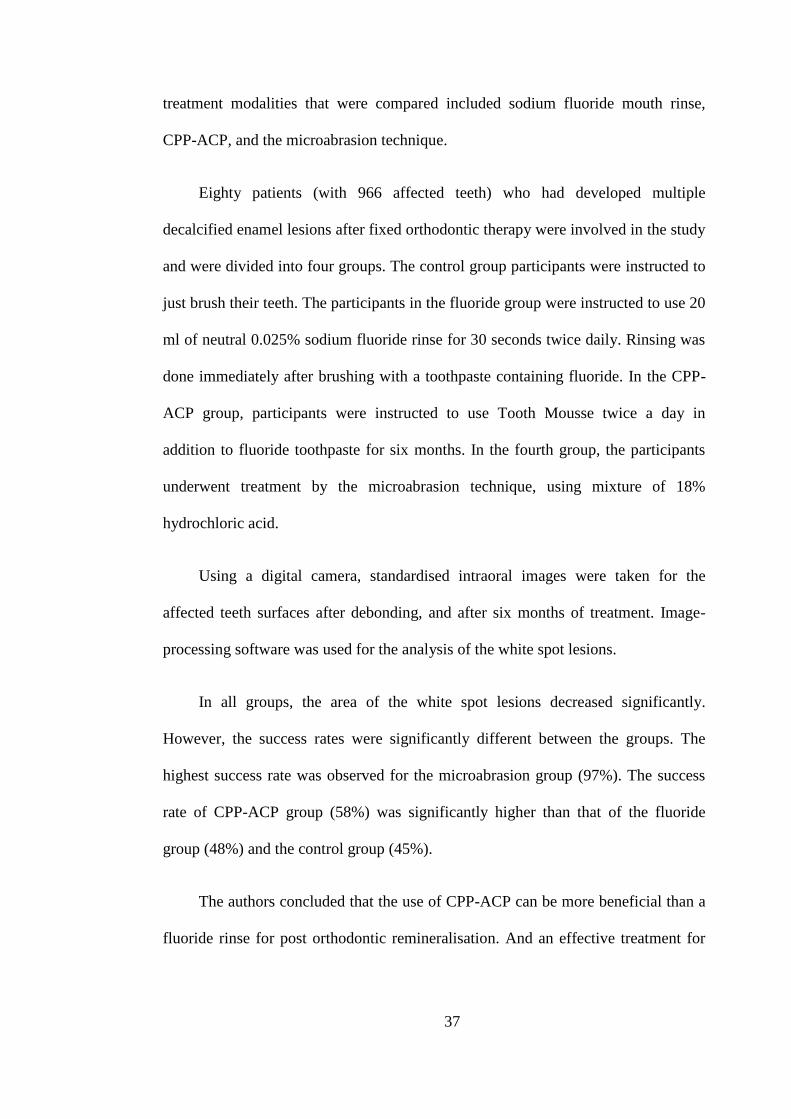
37
treatment modalities that were compared included sodium fluoride mouth rinse,
CPP-ACP, and the microabrasion technique.
Eighty patients (with 966 affected teeth) who had developed multiple
decalcified enamel lesions after fixed orthodontic therapy were involved in the study
and were divided into four groups. The control group participants were instructed to
just brush their teeth. The participants in the fluoride group were instructed to use 20
ml of neutral 0.025% sodium fluoride rinse for 30 seconds twice daily. Rinsing was
done immediately after brushing with a toothpaste containing fluoride. In the CPP-
ACP group, participants were instructed to use Tooth Mousse twice a day in
addition to fluoride toothpaste for six months. In the fourth group, the participants
underwent treatment by the microabrasion technique, using mixture of 18%
hydrochloric acid.
Using a digital camera, standardised intraoral images were taken for the
affected teeth surfaces after debonding, and after six months of treatment. Image-
processing software was used for the analysis of the white spot lesions.
In all groups, the area of the white spot lesions decreased significantly.
However, the success rates were significantly different between the groups. The
highest success rate was observed for the microabrasion group (97%). The success
rate of CPP-ACP group (58%) was significantly higher than that of the fluoride
group (48%) and the control group (45%).
The authors concluded that the use of CPP-ACP can be more beneficial than a
fluoride rinse for post orthodontic remineralisation. And an effective treatment for
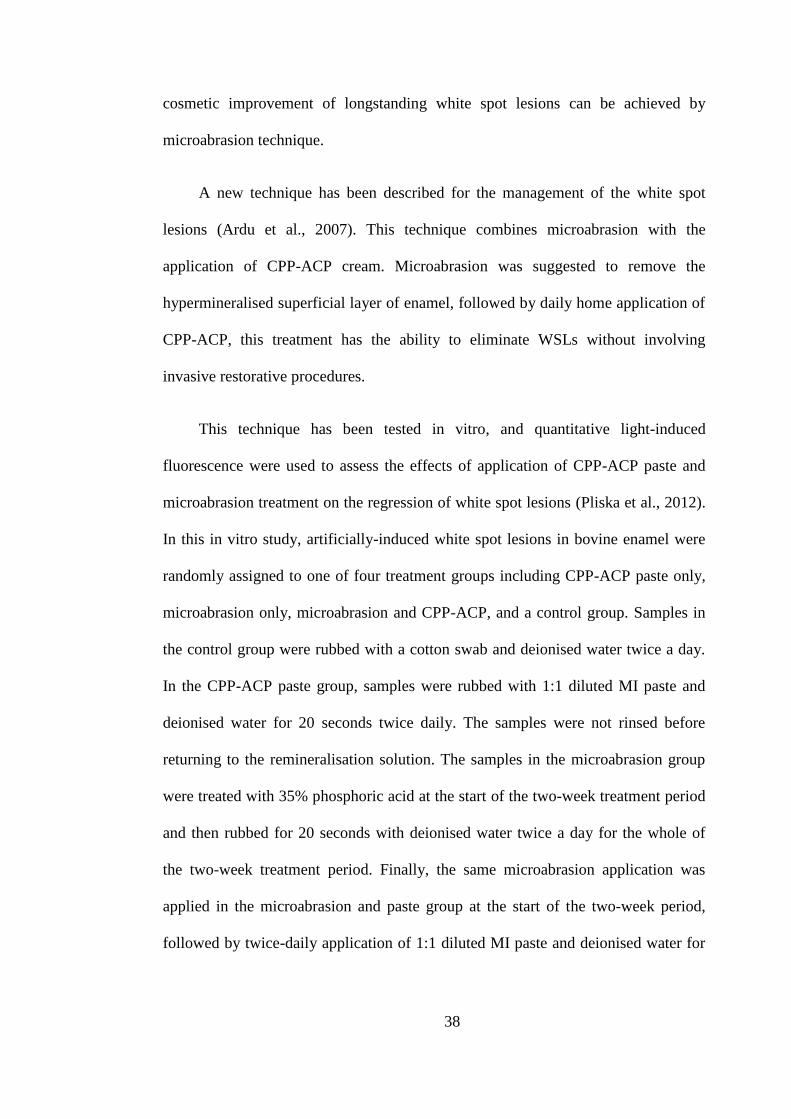
38
cosmetic improvement of longstanding white spot lesions can be achieved by
microabrasion technique.
A new technique has been described for the management of the white spot
lesions (Ardu et al., 2007). This technique combines microabrasion with the
application of CPP-ACP cream. Microabrasion was suggested to remove the
hypermineralised superficial layer of enamel, followed by daily home application of
CPP-ACP, this treatment has the ability to eliminate WSLs without involving
invasive restorative procedures.
This technique has been tested in vitro, and quantitative light-induced
fluorescence were used to assess the effects of application of CPP-ACP paste and
microabrasion treatment on the regression of white spot lesions (Pliska et al., 2012).
In this in vitro study, artificially-induced white spot lesions in bovine enamel were
randomly assigned to one of four treatment groups including CPP-ACP paste only,
microabrasion only, microabrasion and CPP-ACP, and a control group. Samples in
the control group were rubbed with a cotton swab and deionised water twice a day.
In the CPP-ACP paste group, samples were rubbed with 1:1 diluted MI paste and
deionised water for 20 seconds twice daily. The samples were not rinsed before
returning to the remineralisation solution. The samples in the microabrasion group
were treated with 35% phosphoric acid at the start of the two-week treatment period
and then rubbed for 20 seconds with deionised water twice a day for the whole of
the two-week treatment period. Finally, the same microabrasion application was
applied in the microabrasion and paste group at the start of the two-week period,
followed by twice-daily application of 1:1 diluted MI paste and deionised water for
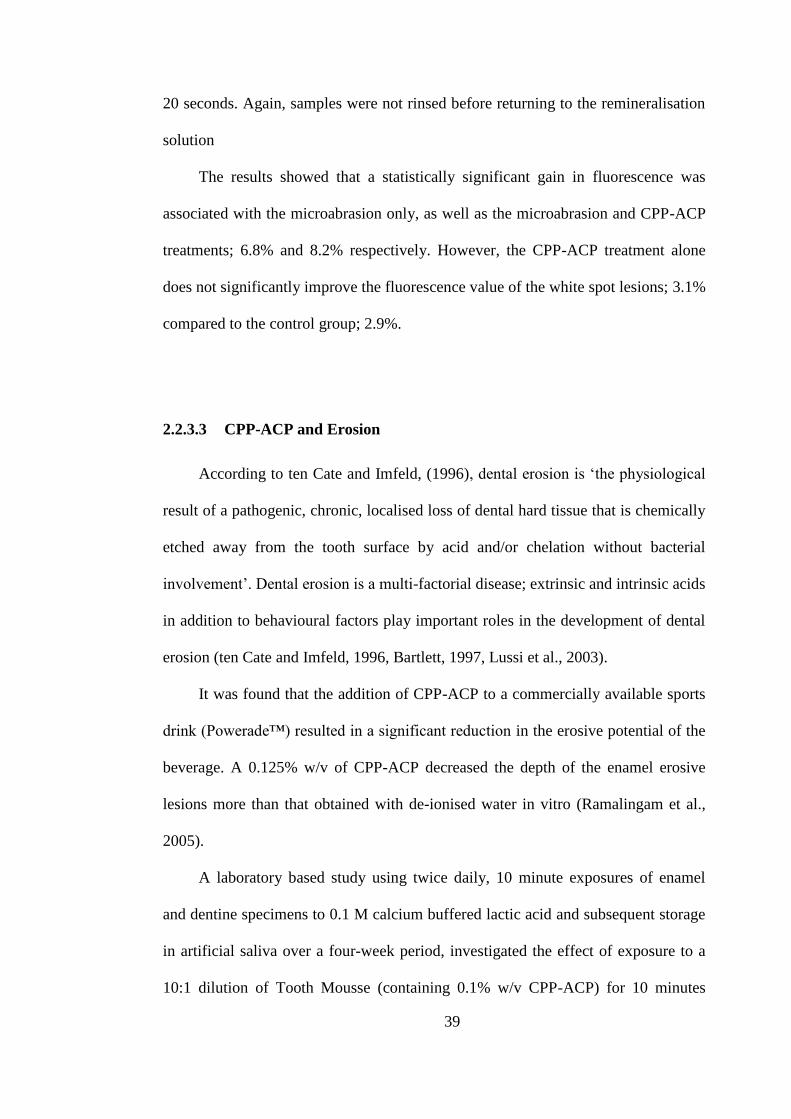
39
20 seconds. Again, samples were not rinsed before returning to the remineralisation
solution
The results showed that a statistically significant gain in fluorescence was
associated with the microabrasion only, as well as the microabrasion and CPP-ACP
treatments; 6.8% and 8.2% respectively. However, the CPP-ACP treatment alone
does not significantly improve the fluorescence value of the white spot lesions; 3.1%
compared to the control group; 2.9%.
2.2.3.3 CPP-ACP and Erosion
According to ten Cate and Imfeld, (1996), dental erosion is ‘the physiological
result of a pathogenic, chronic, localised loss of dental hard tissue that is chemically
etched away from the tooth surface by acid and/or chelation without bacterial
involvement’. Dental erosion is a multi-factorial disease; extrinsic and intrinsic acids
in addition to behavioural factors play important roles in the development of dental
erosion (ten Cate and Imfeld, 1996, Bartlett, 1997, Lussi et al., 2003).
It was found that the addition of CPP-ACP to a commercially available sports
drink (Powerade™) resulted in a significant reduction in the erosive potential of the
beverage. A 0.125% w/v of CPP-ACP decreased the depth of the enamel erosive
lesions more than that obtained with de-ionised water in vitro (Ramalingam et al.,
2005).
A laboratory based study using twice daily, 10 minute exposures of enamel
and dentine specimens to 0.1 M calcium buffered lactic acid and subsequent storage
in artificial saliva over a four-week period, investigated the effect of exposure to a
10:1 dilution of Tooth Mousse (containing 0.1% w/v CPP-ACP) for 10 minutes
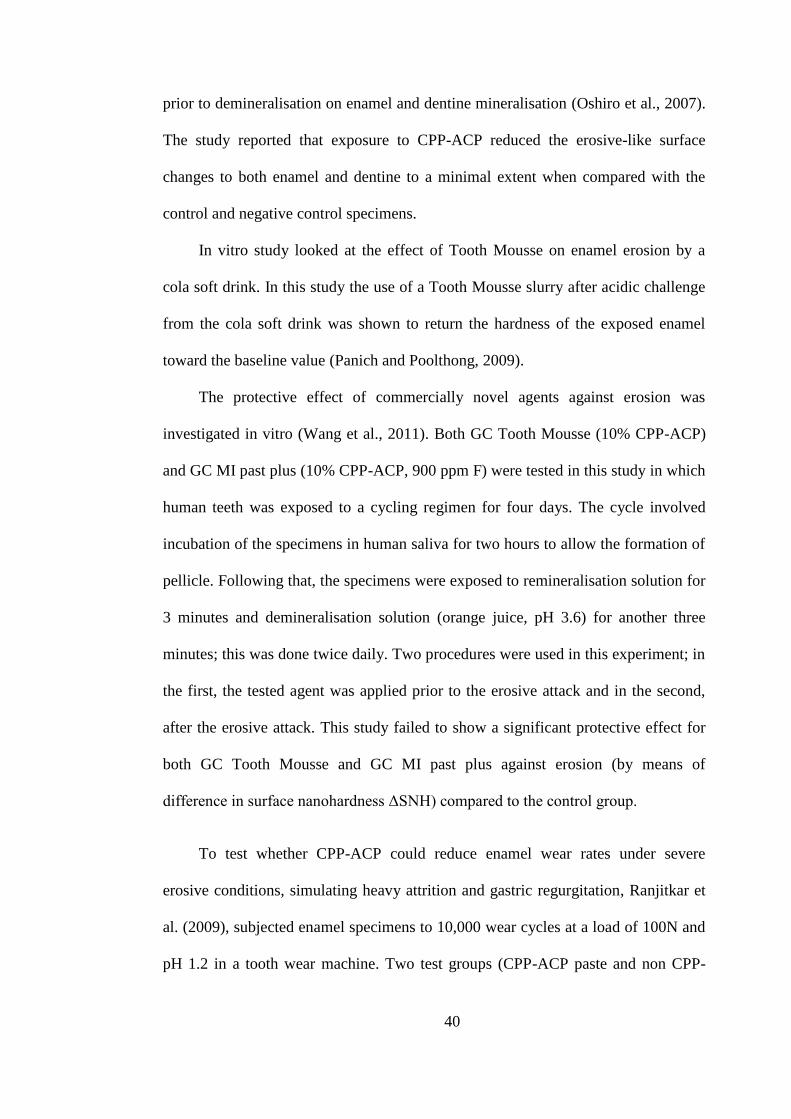
40
prior to demineralisation on enamel and dentine mineralisation (Oshiro et al., 2007).
The study reported that exposure to CPP-ACP reduced the erosive-like surface
changes to both enamel and dentine to a minimal extent when compared with the
control and negative control specimens.
In vitro study looked at the effect of Tooth Mousse on enamel erosion by a
cola soft drink. In this study the use of a Tooth Mousse slurry after acidic challenge
from the cola soft drink was shown to return the hardness of the exposed enamel
toward the baseline value (Panich and Poolthong, 2009).
The protective effect of commercially novel agents against erosion was
investigated in vitro (Wang et al., 2011). Both GC Tooth Mousse (10% CPP-ACP)
and GC MI past plus (10% CPP-ACP, 900 ppm F) were tested in this study in which
human teeth was exposed to a cycling regimen for four days. The cycle involved
incubation of the specimens in human saliva for two hours to allow the formation of
pellicle. Following that, the specimens were exposed to remineralisation solution for
3 minutes and demineralisation solution (orange juice, pH 3.6) for another three
minutes; this was done twice daily. Two procedures were used in this experiment; in
the first, the tested agent was applied prior to the erosive attack and in the second,
after the erosive attack. This study failed to show a significant protective effect for
both GC Tooth Mousse and GC MI past plus against erosion (by means of
difference in surface nanohardness ΔSNH) compared to the control group.
To test whether CPP-ACP could reduce enamel wear rates under severe
erosive conditions, simulating heavy attrition and gastric regurgitation, Ranjitkar et
al. (2009), subjected enamel specimens to 10,000 wear cycles at a load of 100N and
pH 1.2 in a tooth wear machine. Two test groups (CPP-ACP paste and non CPP-
41
ACP paste with the same formula) and a control group were included in this study.
In the test groups, the pastes were applied for 5 minutes, whereas no paste was
applied in the control group. The results of this study showed that both CPP-ACP
and non CPP-ACP pastes significantly reduce the enamel wear, with smoother and
more polished wear facets noticed compared with the control group. The mean wear
rate of the CPP-ACP group was also significantly lower than that of the non CPP-
ACP group.
Vongsawan et al. (2010), tested the effectiveness of high calcium milk and
CPP-ACP on enamel erosion caused by chlorinated water. In this study the enamel
specimens were soaked in chlorinated water (pH 5.0, resembling gas-chlorinated
swimming pool water) for 72 hours at room temperature, followed by emersion in
artificial saliva for 30 minutes. Before this procedure, the experiment agents were
applied to the enamel specimens of the test groups; a 0.5 mm layer of CPP-ACP for
five minutes, and immersion in bovine milk for five minutes, whilst the control
group received no treatment. The results found a significantly greater decrease of the
surface microhardness value in the control group compared to the test groups.
2.2.3.4 CPP-ACP and Fluoride
The synergistic effect of CPP-ACP and fluoride in caries reduction is well
established (Reynolds et al., 1995, Reynolds et al., 2008). This effect may be
attributable to the formation of CPP-stabilised amorphous calcium fluoride
phosphate (Cross et al., 2004), resulting in the increased incorporation of fluoride
42
ions into plaque, together with increased concentrations of bio-available calcium and
phosphate ions.
In their study on rats, Reynolds et al. (1995), reported a significant reduction
in the caries scores in the group received 0.5% CPP-ACP plus 500 ppm F compared
with those in the group received either 0.5% CPP-ACP or 500 ppm F alone. This
may be attributed to the formation of CPP-stabilised amorphous calcium fluoride
phosphate, which increases the concentration of bio-available calcium and
phosphate ions in addition to the increased incorporation of fluoride ions into plaque
(Cross et al., 2004).
In an in situ study investigating the ability of CPP-ACP to increase the
incorporation of fluoride into plaque and in promoting enamel remineralisation,
CPP-ACP and fluoride containing dentifrices (1100 ppm NaF, 2800 ppm NaF, 2%
CPP-ACP, 2% CPP-ACP plus 1100 ppm NaF, placebo) and mouth-rinses (2% CPP-
ACP plus 450 ppm F, de-ionised water) were tested (Reynolds et al., 2008). The
mouth-rinse was used three times daily for five days and the dentifrices were rinsed
with water slurries four times a day for 14 days. A significant increase in the
fluoride incorporation into plaque was found after the addition of 2% CPP-ACP to
the 450 ppm F mouth-rinse (33.0±17.6 nmol/mg dry wt) and this was more than a
100% increase compared with the fluoride mouthwash alone. The study also showed
that remineralisation of 2% CPP-ACP containing dentifrice was comparable with
that achieved with 2800 ppm F dentifrice, whilst the dentifrice containing 2% CPP-
ACP plus 1100 ppm F was superior to all other formulations.
Kariya et al. (2004), in an in vitro study demonstrated that the addition of
fluoride to the CPP-ACP improved its acid-resisting effect. The same findings were
also reported by Lennon et al. (2006), as they showed that the enamel lost when

43
using paste containing casein calcium phosphate followed by a toothpaste containing
250 ppm F in an erosive cycle, was less than that using 250 ppm F and casein
calcium phosphate alone. This was attributed to the capacity of the fluoride to
improve the crystalline tooth structure, generation of fluorapatite, and accelerated
remineralisation.
In another in vitro study Kumar et al. (2008), reported that the use of CPP-
ACP in combination with fluoridated toothpaste showed a higher remineralisation
potential and a 13.1% reduction in the lesion depth in comparison to 7% in the
fluoridated toothpaste group and 10.1% in the other CPP-ACP groups. The negative
control group showed an increase in lesion depth by 23%. The study authors
recommended the use of CPP-ACP as a self-applied topical coating after brushing
the teeth with fluoridated toothpaste in children with high caries-risk.
The effect of CPP-ACP in enamel remineralisation along with the effect of
slow-release fluoride glass devices (SFGD) were investigated in vitro under pH
cycling condition (Al-Mullahi and Toumba, 2010). In this study the effect of CPP-
ACP and SFGD were tested separately and together. Enamel surface microhardness
SMH was measured at baseline and after 10 days of pH cycling regime. The results
of this study showed the enamel SMH values in all the test groups (SFGD, CPP-
ACP and SFGD + CPP-ACP) were significantly higher than that in the control
group. No significant difference was noticed in enamel SMH between the SFGD and
CPP-ACP groups. Although SFGD + CPP-ACP group produced greater
improvement in enamel SMH in comparison to SFGD or CPP-ACP alone this
difference was not statistically significant.
44
2.3 Model Systems used to Study the Caries Process in Enamel
Different approaches have been used for studying the caries process. The gold
standard for these types of studies is a well-conducted and controlled randomised
clinical trial. However, conducting a clinical trial is both time consuming and
expensive. Therefore, a variety of models have been used as alternatives. These
include:
2.3.1 In vitro Model
In this model, tooth specimens were used and the application of the test
material is done in a laboratory setting. An improvement of this approach has
resulted from the development of the analytical technology of determining mineral
gain or loss, to or from the tissue or its supernatant (Higham et al., 2005). The
advantages of this approach are that it can be inexpensive and performed over a
short period of time. However, limitations have been recognised for the in vitro
model as it cannot replicate the oral environment, therefore, the information they
provide on enamel demineralisation and remineralisation can be different from what
actually occur in the oral cavity (Higham et al., 2005).
2.3.1.1 Artificial Caries Lesions
Using artificial enamel caries lesions in an in vitro model has been widely used
in studying the process of demineralisation and remineralisation. Early caries lesion
is characterised by having an intact surface layer with underlying subsurface
demineralisation (Silverstone, 1973). Different methods has been used to create an
45
artificial carious lesions, this includes acidified gels (Silverstone, 1973, Arends and
Davidson, 1975), and lactate buffers (Featherstone et al., 1978), With the later been
shown to produce artificial lesions with characteristic features similar to that of
natural caries i.e. apparently intact surface layer, a lesional centre and an inner zone
(Silverstone, 1973).
2.3.1.2 pH Cycling Model
The pH cycling model is an in vitro model that involves a process of
alternating demineralisation and remineralisation, hence providing a better
simulation of the caries process.
This model has become the method of choice for many caries researchers, and
has been used widely to investigate caries-preventive agents on the dynamics of
enamel demineralisation and remineralisation (Featherstone, 1996, ten Cate et al.,
2006, White et al., 1994).
2.3.2 Animal Caries Models
Animal caries models were used since the 1940s. Through this model, different
variables involved in the caries process can be controlled such as the oral microflora
where super-infection with cariogenic bacteria can be done, as well as controlling
the delivery of the diet. Therefore, this model can provide information that is more
related to the actual lesions that results from in vivo conditions. Nevertheless,
objections of this model arises as the process of demineralisation and
46
remineralisation in animals are not related to the real process in human teeth in the
human oral environment (Higham et al., 2005).
2.3.3 In situ Model
This model involves the use of an intra-oral appliance or device that contains
specimens of dental tissue. Many studies used the in situ models to study the dental
caries and its prevention, this involves the study of fluoride mechanism of action,
fluoride delivery systems, as well as other remineralising agents (Zero, 1995).
In contrast to in vitro or animal experimentation, in situ studies are performed
in the human mouth, which make it more related to the actual demineralisation and
remineralisation process in the oral environment. At the same time this model
allows flexibility of experimental design and facilitates the control of different
experimental variables in ways not achievable with clinical trials (Zero, 1995).

47
2.4 Methods used in Demineralisation and Remineralisation
Evaluation
Different laboratory methods are currently used in the measurement of enamel
mineralisation. These methods allow detection of the mineral loss and gain in
enamel even with small changes, this includes:
2.4.1 Microradiography
This technique is based on comparing the amount of x-ray absorbed from the
tooth sample with that of a simultaneous exposed standard.
Transverse Microradiography (TMR) is considered to be the gold standard for
the measurement of smooth surface enamel mineralisation. The accurate and reliable
measurements it produces make it the most practical and widely accepted analytical
technique (Arends and Ten Bosch, 1992, Damen et al., 1997).
TMR became a suitable tool for detecting small changes in mineral density
profiles, especially after the development of the computer-aided video- image
analysis (Damen et al., 1997). It involves the investigation of 80 μm and 150 μm
planoparallel sections of enamel and dentine, which are cut from the sample.
The lesion mineral content is represented by ΔZ which calculated from the
lesion depth and the mineral distribution profile.
Disadvantages of the TMR technique includes the fact that destruction of the
tooth sample is needed in preparation, therefore it is only useful for in vitro and in
situ studies. In addition, the preparation of the slices is a very technique sensitive
procedure as testing slices must have an identified and homogeneous thickness (Ten
48
Bosch and Angmar-Månsson, 1991). Add to that the expensive radiographic
consumables that are also required.
The technique advantages include reasonable accuracy of quantitative mineral
loss or gain, and determining mineral distribution (Arends and Ten Bosch, 1992).
The other two types of microradiography are the longitudinal microradiography and
wavelength independent microradiography which allow repeated measurements of
the mineral content by using non-destructive techniques.
2.4.2 Quantitative Light-Induced Fluorescence (QLF)
Fluorescence is a phenomenon by which an object is excited by a particular
wavelength of light and the fluorescent (reflected) light is of a larger wavelength.
When the excitation light is in the visible spectrum, the fluorescence will be of a
different colour (Pretty, 2006).
Benedict, (1928) was the first to describe the enamel auto-fluorescence, and
suggested its use in the detection of dental caries (Benedict, 1929).
The demineralisation of enamel was found to result in a reduction of its auto-
fluorescence. de Josselin de Jong et al. (1990), suggested that the observed
differences in fluorescence between sound and carious enamel could be explained
by altered amounts of light scattering and absorption. When dental enamel is
demineralised, it becomes porous and the saliva liquids fill the pores causing a
decrease in the light path in the enamel (Tranæus et al., 2001). In a caries lesion, the
light scattering is much stronger than that in sound enamel (Ten Bosch, 1996) and
the absorption of light per unit of volume is smaller, as a result, the fluorescence is
less strong in the caries lesion.

49
Quantitative Light-Induced Fluorescence (QLF) is a novel device for the
detection of early demineralisation of enamel. It is reported to be a valuable and
non-destructive tool for early detection, quantification, and longitudinal monitoring
of early (non-cavitated) carious lesions (Kühnisch and Heinrich-Weltzien, 2004).
QLF is a two-stage process for the detection and assessment of
demineralisation and remineralisation. It involves the acquisition of images using a
camera-based system (Yin et al., 2007) by subjecting the enamel to a beam of
monochromatic blue light at a wavelength of 370 nm. The resultant auto-
fluorescence with a yellow-green colour of human enamel is then detected and
measured after filtration with a high band pass filter at 520 nm (Adeyemi et al.,
2006).
Following that, the analysis of the images is carried out using proprietary
software which involves using a patch to define areas of sound enamel around the
lesion of interest. Subsequently, the software employs the pixel values of the sound
enamel to reconstruct the surface of the affected area and thus allow an estimation of
the degree of fluorescence lost for each pixel, considering the lesion is at a given
threshold, typically 5.0% (De Josselin de Jong et al., 1995). This means that all
pixels with a loss of fluorescence greater than 5.0% of the average sound value will
be considered to be part of the lesion. Once the pixels have been assigned 'sound' or
'lesion' the software then calculates the average fluorescence loss in the lesion,
known as % ΔF, and then the total area of the lesion in mm2. A multiplication of
these two variables results in a third metric output, ΔQ (Pretty, 2006).
The enamel dentinal junction (DEJ) is believed to be the source of the auto-
fluorescence. The presence of the DEJ or dentine underneath the enamel is
50
necessary to provide sufficient fluorescence contrast between the lesion and the
sound enamel. Studies have shown that when underlying dentine is removed, the
enamel fluorescence is lost (Van Der Veen and De Josselin de Jong, 2000).
Studies have revealed that QLF could detect demineralisation that resulted
from an eight hour exposure to the decalcification solution (lactic acid-Carbopol
solution) and was able to quantify changes in lesion severity associated with
longer demineralisation (Ando et al., 1997). It can also follow the progression of
the lesion longitudinally in the same tooth.
The QLF device has been validated by comparison with transverse
microradiography TMR. A good correlation was found between QLF and TMR (Al-
Khateeb et al., 1997) and thus indicates the validity of the QLF as a measure of
mineral content (Higham et al., 2005). It has shown to be reliable and reproducible
as well.
Different types of carious lesions have been assessed by the QLF. The QLF
sensitivity has been reported at 0.68 and specificity at 0.70 for the occlusal caries
which is comparable with other systems. The correlations of QLF metrics and lesion
depth have also been reported to be up to 0.82 (Pretty, 2006).
The presence of confounding factors that adversely affect the reliability of
measurements is associated with all techniques; therefore, optimal conditions should
be determined and implemented to ensure valid results.
In vitro and in vivo studies using the QLF technique have shown larger
standard deviations or errors for the QLF technique compared to other techniques,
such as microradiography (four to five times greater) and confocal laser scanning
light microscopy. This was mainly noticed in the in vitro studies. In this case, the
51
thickness of enamel and dentin is the only confounding factor, taking into
consideration the work under the standardised conditions (Ando et al., 2003).
This was confirmed in an in vitro study (Ando et al., 2003). The results of this
study imply that fluorescence radiance measurements in either sound or
demineralised enamel will depend on enamel thickness for lesions of the same size,
which means that two specimens with same severity of demineralisation but with
different enamel thickness would have different values for fluorescence radiance due
to the differences in enamel thickness. These findings draw attention to the
importance of standardising the thickness of enamel within the same group when
conducting in vitro fluorescence studies assessing enamel lesion severity.
Another factor that could potentially influence the QLF image and
consequently the analysis of the demineralisation loss is the extent of hydration of
the lesion (Angmar-Mansson and Bosch, 2001). This is particularly important when
monitoring the lesions longitudinally. In order to achieve reliable results, the
application of compressed air for 15 seconds prior to the QLF imaging is suggested
(Pretty et al., 2004).
The ambient light may also influence the results of QLF test, however, in areas
where QLF is to be used, a light level of 88 lux can be employed without
significantly affecting the reported values (Pretty et al., 2002a).
2.4.3 Microhardness Test
The microhardness technique is very sensitive to changes in mineral density
and can provide indirect evidence of mineral loss or gain (Featherstone and Zero,
52
1992). For that reason, it has been used to determine demineralisation and
remineralisation effects on dental enamel (Koulourides and Volker, 1964).
This method measures the resistance of enamel surface to indenter penetration,
which represents the degree of the superficial enamel layer porosity that in turn
indicates mineral loss or gain in subsurface lesions (Koulourides, 1971). The
measurements involve micro- and nano- indentation of a Knoop or Vickers diamond
tip of defined geometrical dimensions, and its load and duration on the tooth surface
(Lussi et al., 2006).
Microhardness testing is a rapid and inexpensive technique and it has been in
use in the dentistry field for a long time (Lussi et al., 2006). A flat and polished
tooth specimen surface is needed to get effective microhardness measurements. In
addition to that, the measurements obtained do not necessarily represent the surface
of the whole specimen since different specimen sites have varying microhardness
values. Which is considered the main disadvantage of the technique (Caldwell et al.,
1957).
2.4.4 Scanning Electron Microscopy (SEM)
The principle of the SEM procedure involves scanning a fine beam of
electrons across the surface of a specimen in synchronism with the spot of the
display cathode ray tube (CRT).This produces a highly magnified image of three
dimensional appearances, which is derived from the action of the electron beam
scanning across the surface of the specimen.

53
SEM scans qualitative alterations of the surface, the size and the shape of
features as well as observing the roughness on the surface of objects. Moreover,
SEM can reveal the minerals precipitate in pellicle from mineral dissolution. The
advantages of this technique includes that no sample preparation is required. The
micro-structural images produced by the SEM are readily interpreted. However,
SEM only provides subjective and qualitative assessment without comprehensive
information about surface alterations of specimens.
2.5 Methods Used for Early Caries Detection
An increase in the research activity surrounding caries diagnostic methods has
been noticed in recent years. The assessment of early caries lesions has received a
particular concern (Pretty, 2006), since the early detection of the caries process is
crucial to prevent the progression of the caries lesion.
Several methods are currently available for the early detection of dental caries:
2.5.1 International Caries Detection and Assessment System (ICDAS)
The ICDAS system has been developed in order to standardise caries detection
and diagnosis among practitioners. The system employs an evidence-based
approach for detecting early and later stage caries, and classifies lesions based on
their clinical visual appearance. Depending on the severity of the lesion the system
has a coded classification from 0-6 (Pitts and Ekstrand, 2013).
54
2.5.2 QLF
Discussed before in 2.4.2
2.5.3 Fibre Optic Transillumination
Fibre optic transillumination uses the optical properties of enamel. Through a
device composed of small aperture in the form of a dental hand-piece it uses a high
intensity white light to enhance the optical properties of enamel, thereby providing
the ability to distinguish between early enamel and early dentine lesions. However,
the system has a disadvantage of being subjective rather than objective. This
property makes the longitudinal monitoring of the lesion a complex process (Pretty,
2006).
2.5.4 Laser Fluorescence
Laser Fluorescence (DIAGNODent) system measures enamel fluorescence
quantitatively using 655 nm red light. It supports the detection of non-cavitated,
occlusal pit-and-fissure caries, as well as smooth surface caries at their early stage.
Clinical investigations have demonstrated high sensitivity (≥0.92) in detection of
occlusal caries and reproducibility tests resulted in Cohen's Kappa value of 0.93 in
vivo (Hibst et al., 2001).
No image of the tooth is produced by the system; alternatively it displays a
numerical value on two LED displays. The first numerical value displays the current
reading, whilst the second displays the peak reading for that examination (Pretty,
2006).

55
2.5.5 Digital Radiographic Techniques
Digital radiography has contributed to an increase in the diagnostic yield of
dental radiographs. It offers the potential of image enhancement by applying a range
of algorithms making their diagnostic performance at least as good as the
conventional radiographs (Pretty, 2006). Several studies revealed a significantly
lower sensitivity and specificity of digital radiographs on assessing small proximal
caries (Verdonschot et al., 1992). However, these radiographs have the advantage of
using a lower radiation dose for the patient in order to produce the tooth image
(Pretty, 2006).
2.5.6 Electronic Caries Monitor (ECM)
The Electronic caries monitor (ECM) is a device which employs a single,
fixed-frequency alternating current in an attempt to measure the ‘bulk resistance’ of
tooth tissue (Longbottom and Huysmans, 2004). A number of physical factors were
found to affect ECM results, including the temperature of the tooth (Huysmans et
al., 2000), the thickness of the tissue (Wang et al., 2000), and the hydration of the
material and the surface area (Longbottom and Huysmans, 2004).
2.5.7 Ultrasound Techniques
The principle behind the Ultrasound technique is that sound waves can pass
through gases and liquids as well as solids and the boundaries between them (Hall
and Girkin, 2004). By utilising a sonar device in which a beam of ultrasound wave is

56
directed against the tooth surface, images of tissues can be acquired by collecting the
reflected sound waves.
57
2.6 Research Aims, Objectives, And Hypothesis
Aim:
To investigate in vitro the effect of Tooth Mousse (10% w/v CPP-ACP), MI
Paste Plus (10% w/v CPP-ACP, 900 ppm F) and high fluoride concentration
toothpaste (2800 ppm F) in the remineralisation of demineralised enamel subsurface
lesion and to compare it to the effect of 1450 ppm F toothpaste and 0 ppm F
toothpaste control.
Objectives:
To assess using QLF the effect of Tooth Mousse (10% w/v CPP-ACP) and
MI Paste Plus (10% w/v CPP-ACP, 900 ppm F) when used suplmentary to
fluoride toothpaste (1450 ppm F) in the remineralisation of demineralised
enamel subsurface lesions in vitro under pH cycling condition.
To compare the additional effect of Tooth Mousse and MI Paste Plus with
that of fluoride toothpaste (1450 ppm F) alone, high fluoride toothpaste
(2800 ppm F) and non-fluoride toothpaste.
The null hypothesis:
There is no difference in the enamel remineralisation that results from Tooth
Mousse, MI Paste Plus, 1450 ppm F toothpaste, 2800 ppm F toothpaste and
non-fluoridated toothpaste.
58
3.0 MATERIALS AND METHODS
This was an in vitro study designed to investigate the remineralisation of the
enamel subsurface lesions under pH cycling condition using different remineralising
agents. The methodology adopted in the present study including preparation of
tissue samples and the pH cycling protocol as well as the materials and equipment
used will be described in this section.
3.1 Power Calculation
Statistical advice was sought and the sample size was calculated by using data
from a previous PhD thesis ‘Investigations into the effect of casein phosphopeptide-
amorphous calcium phosphate on enamel demineralisation and remineralisation’
(Manton, 2009). A total of 22 enamel slabs per group were needed. This calculation
was based on the assumption that the standard deviation of the response variable is
2.0, power 90%, 0.05 significance level and a true difference between treatments
would be adjusted to 3 units. This was based on the calculations by MGH
Biostatistics Centre software (Schoenfeld, 2010).
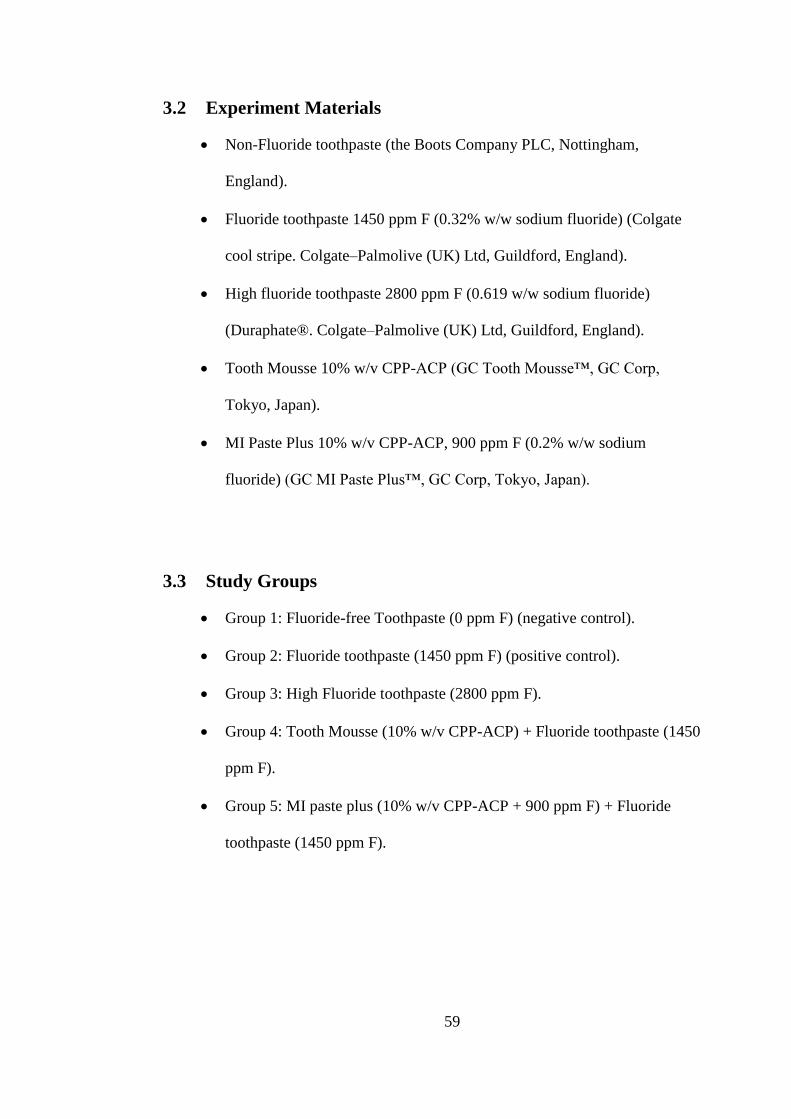
59
3.2 Experiment Materials
Non-Fluoride toothpaste (the Boots Company PLC, Nottingham,
England).
Fluoride toothpaste 1450 ppm F (0.32% w/w sodium fluoride) (Colgate
cool stripe. Colgate–Palmolive (UK) Ltd, Guildford, England).
High fluoride toothpaste 2800 ppm F (0.619 w/w sodium fluoride)
(Duraphate®. Colgate–Palmolive (UK) Ltd, Guildford, England).
Tooth Mousse 10% w/v CPP-ACP (GC Tooth Mousse™, GC Corp,
Tokyo, Japan).
MI Paste Plus 10% w/v CPP-ACP, 900 ppm F (0.2% w/w sodium
fluoride) (GC MI Paste Plus™, GC Corp, Tokyo, Japan).
3.3 Study Groups
Group 1: Fluoride-free Toothpaste (0 ppm F) (negative control).
Group 2: Fluoride toothpaste (1450 ppm F) (positive control).
Group 3: High Fluoride toothpaste (2800 ppm F).
Group 4: Tooth Mousse (10% w/v CPP-ACP) + Fluoride toothpaste (1450
ppm F).
Group 5: MI paste plus (10% w/v CPP-ACP + 900 ppm F) + Fluoride
toothpaste (1450 ppm F).
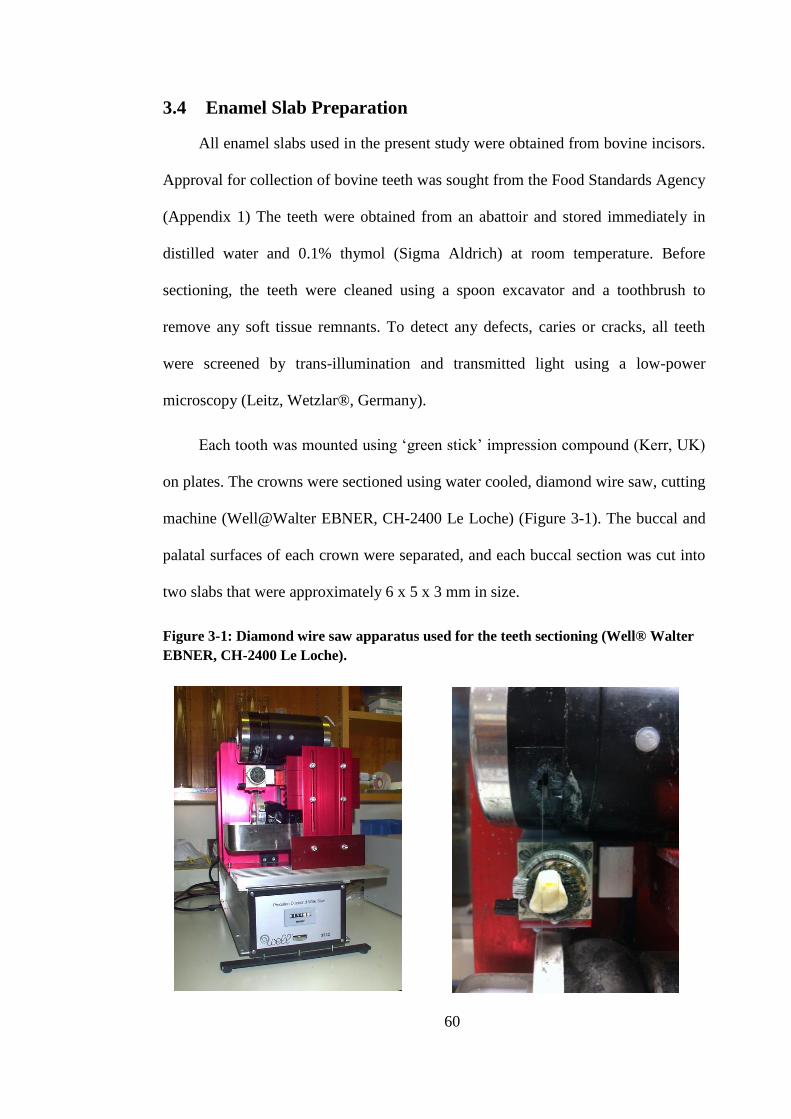
60
3.4 Enamel Slab Preparation
All enamel slabs used in the present study were obtained from bovine incisors.
Approval for collection of bovine teeth was sought from the Food Standards Agency
(Appendix 1) The teeth were obtained from an abattoir and stored immediately in
distilled water and 0.1% thymol (Sigma Aldrich) at room temperature. Before
sectioning, the teeth were cleaned using a spoon excavator and a toothbrush to
remove any soft tissue remnants. To detect any defects, caries or cracks, all teeth
were screened by trans-illumination and transmitted light using a low-power
microscopy (Leitz, Wetzlar®, Germany).
Each tooth was mounted using ‘green stick’ impression compound (Kerr, UK)
on plates. The crowns were sectioned using water cooled, diamond wire saw, cutting
machine (Well@Walter EBNER, CH-2400 Le Loche) (Figure 3-1). The buccal and
palatal surfaces of each crown were separated, and each buccal section was cut into
two slabs that were approximately 6 x 5 x 3 mm in size.
Figure 3-1: Diamond wire saw apparatus used for the teeth sectioning (Well® Walter
EBNER, CH-2400 Le Loche).

61
Each enamel slab was mounted on a plastic rod using “sticky wax” to hold
the slab in the demineralising gel. The rod was secured to the lid of a “Sterilin”
type universal tube so that when the top was screwed onto the tube, the tooth
was suspended in the centre of the tube free space (Figure 3-2). Two coats of an
acid resistant, coloured nail varnish (Max Factor “Glossfinity”) were then
applied on the enamel slabs, except for a small window of approximately 2 x 3
mm on the centre of each slab that was left exposed (Figure 3-3). An interval of
24 hours was left between the two applications to allow the nail varnish to dry
completely.
Once the enamel slabs were prepared, they were kept moist in plastic
containers at room temperature to prevent dehydration.
Figure 3-2: Enamel slab suspended in the “Sterilin” type universal tube.
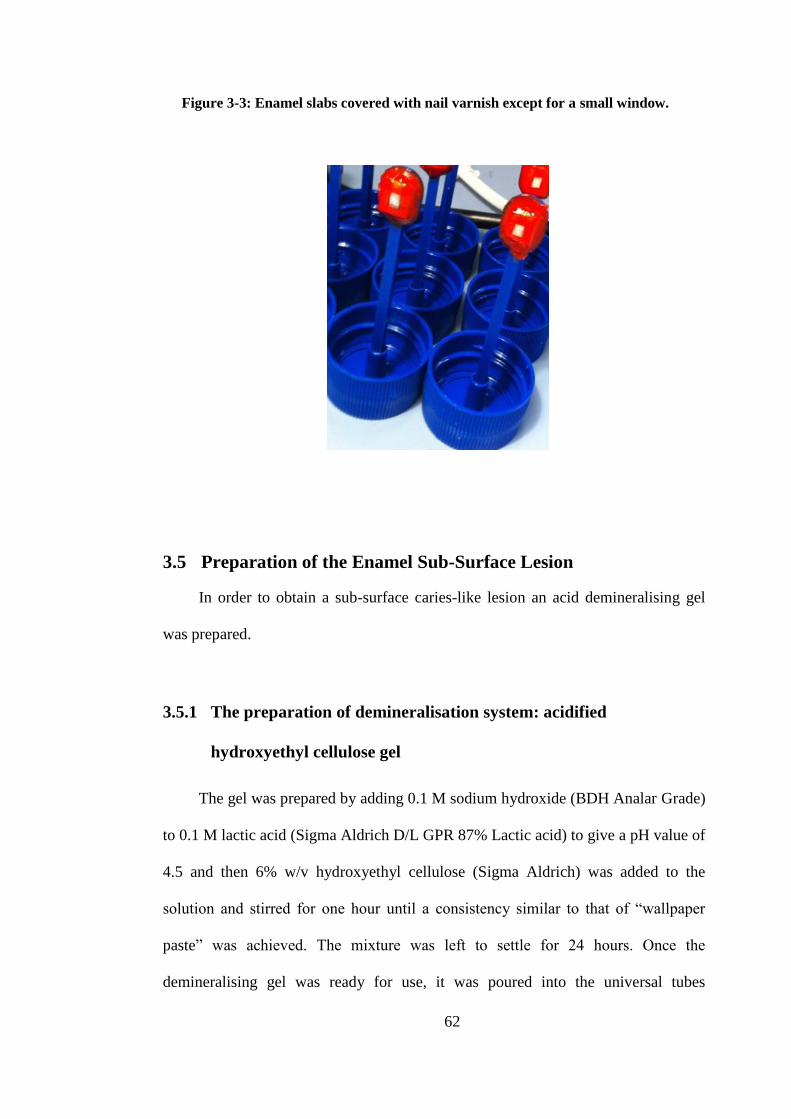
62
Figure 3-3: Enamel slabs covered with nail varnish except for a small window.
3.5 Preparation of the Enamel Sub-Surface Lesion
In order to obtain a sub-surface caries-like lesion an acid demineralising gel
was prepared.
3.5.1 The preparation of demineralisation system: acidified
hydroxyethyl cellulose gel
The gel was prepared by adding 0.1 M sodium hydroxide (BDH Analar Grade)
to 0.1 M lactic acid (Sigma Aldrich D/L GPR 87% Lactic acid) to give a pH value of
4.5 and then 6% w/v hydroxyethyl cellulose (Sigma Aldrich) was added to the
solution and stirred for one hour until a consistency similar to that of “wallpaper
paste” was achieved. The mixture was left to settle for 24 hours. Once the
demineralising gel was ready for use, it was poured into the universal tubes
63
“Sterilin” into which the mounted teeth were then submerged (Figure 3-4). The
enamel slabs were immersed in acid gel for 10 days to produce an artificial enamel
subsurface lesion. The enamel slabs were removed from the acid gel and washed
with distilled water, the nail varnish was then removed using methanol to prepare
the enamel slabs for the baseline QLF measurements.
Figure 3-4: Enamel slabs suspended in the acid gel.
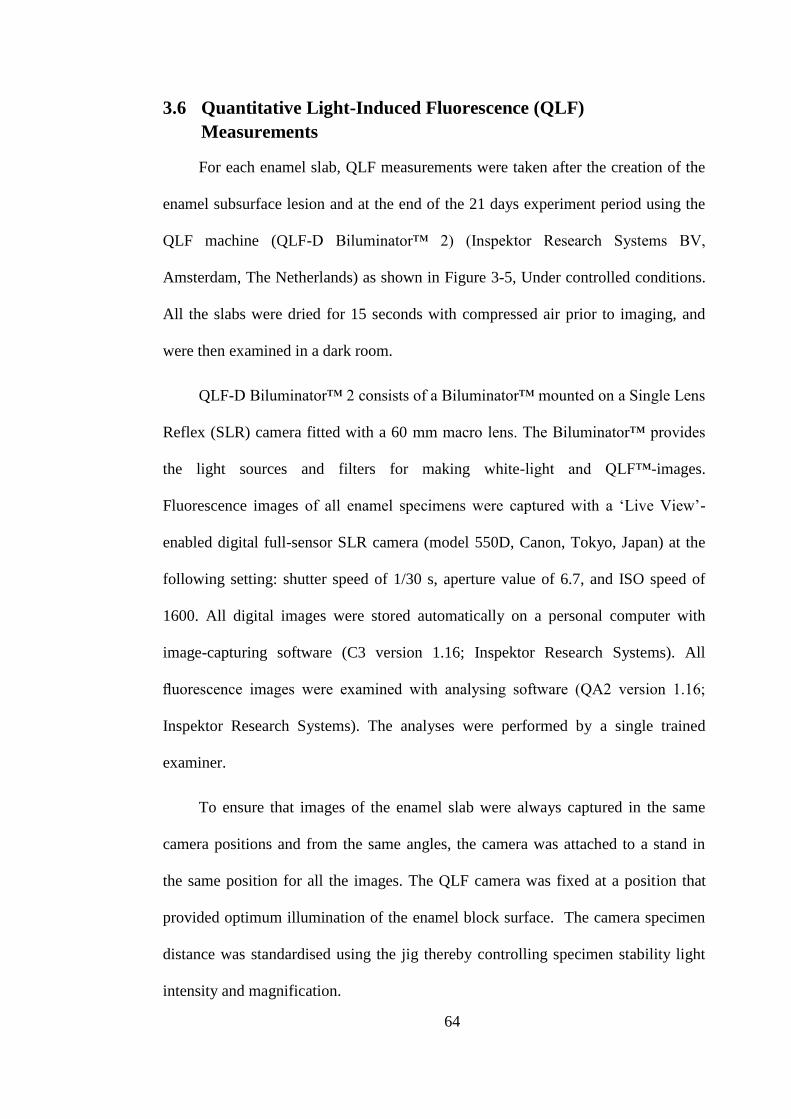
64
3.6 Quantitative Light-Induced Fluorescence (QLF)
Measurements
For each enamel slab, QLF measurements were taken after the creation of the
enamel subsurface lesion and at the end of the 21 days experiment period using the
QLF machine (QLF-D Biluminator™ 2) (Inspektor Research Systems BV,
Amsterdam, The Netherlands) as shown in Figure 3-5, Under controlled conditions.
All the slabs were dried for 15 seconds with compressed air prior to imaging, and
were then examined in a dark room.
QLF-D Biluminator™ 2 consists of a Biluminator™ mounted on a Single Lens
Reflex (SLR) camera fitted with a 60 mm macro lens. The Biluminator™ provides
the light sources and filters for making white-light and QLF™-images.
Fluorescence images of all enamel specimens were captured with a ‘Live View’-
enabled digital full-sensor SLR camera (model 550D, Canon, Tokyo, Japan) at the
following setting: shutter speed of 1/30 s, aperture value of 6.7, and ISO speed of
1600. All digital images were stored automatically on a personal computer with
image-capturing software (C3 version 1.16; Inspektor Research Systems). All
fluorescence images were examined with analysing software (QA2 version 1.16;
Inspektor Research Systems). The analyses were performed by a single trained
examiner.
To ensure that images of the enamel slab were always captured in the same
camera positions and from the same angles, the camera was attached to a stand in
the same position for all the images. The QLF camera was fixed at a position that
provided optimum illumination of the enamel block surface. The camera specimen
distance was standardised using the jig thereby controlling specimen stability light
intensity and magnification.

65
Figure 3-5: QLF machine, the SLR camera attached to the stand with standardised
distance from the enamel slab.
A patch was drawn around the white spot lesion site by the study examiner
with its borders on sound enamel as can be seen in Figure 3-6. Inside this patch, the
fluorescence levels of sound tissue were reconstructed by using the fluorescence
radiance of the surrounding sound enamel. The percentage difference between the
reconstructed and the original fluorescence levels was calculated. The same area of
interest was used for the baseline and endpoint white spot lesion image
identification.
Demineralised areas appeared as dark spots. The fluorescent radiance of a
white spot lesion viewed by QLF was lower than that of sound enamel. As already
described in page 48, in order to enable calculation of loss of fluorescence in the
white spot lesion, the fluorescent radiance of sound tissue at the lesion site was
reconstructed by interpolation from the radiance of the sound tissue surrounding the
lesion. Fluorescence radiance levels less than 95% of reconstructed sound

66
fluorescence radiance levels were considered to be artificial early caries lesions and
were displayed as shades of grey where darker grey corresponds to higher
fluorescence loss. The difference between the measured values and the reconstructed
values gave the resulting fluorescence loss in the lesion.
Figure 3-6: QLF image taken with the blue light shows the demineralised lesion in the
centre of the enamel slab as well as a patch drawn around the lesion with the border in
sound enamel. (Arrow 1: sound enamel, arrow 2: demineralised enamel, arrow 3:
patch drawn around the lesion).
For each enamel lesion the following three metrics were obtained: (see
Figure 3-7)
1. ΔF: Percentage fluorescence loss with respect to the fluorescence of
sound tooth tissue; related to lesion depth (%),
2. ΔQ: The ΔF times the Area. Percentage fluorescence loss with respect
to the fluorescence of sound tissue times the area. Related to lesion
volume (% px2),
3. Area: The surface area of the lesion expressed in pixels2 (px
2).
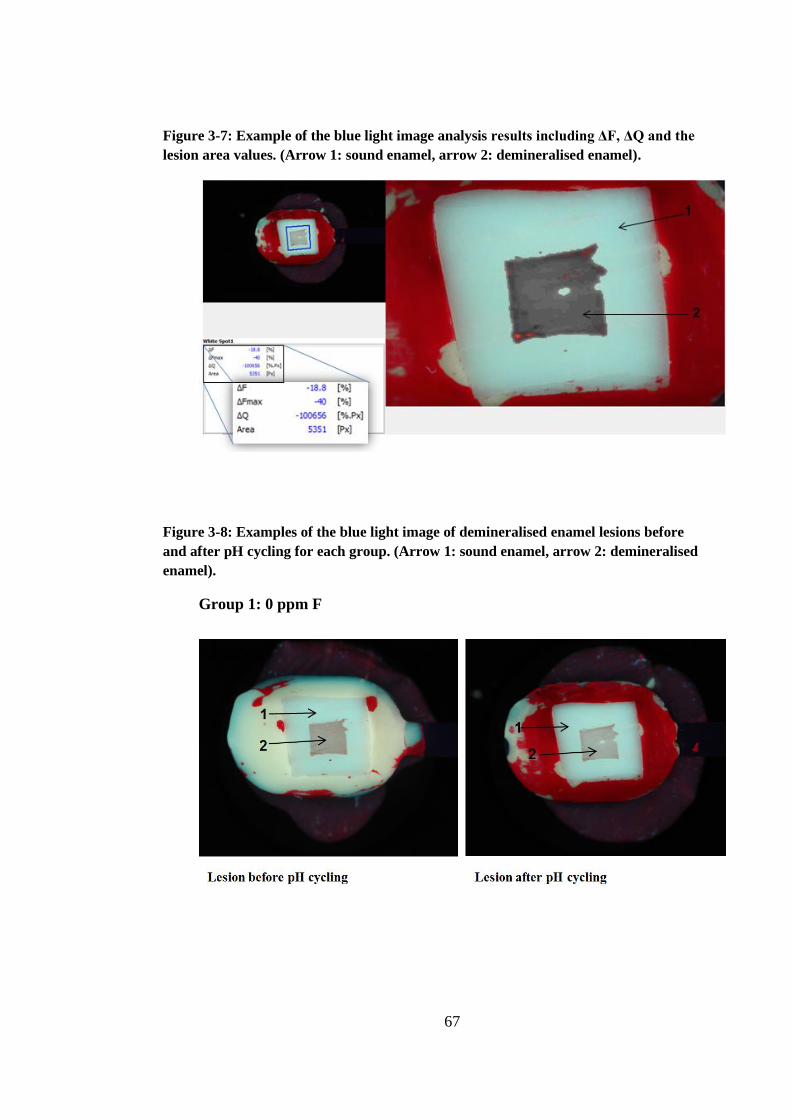
67
Figure 3-7: Example of the blue light image analysis results including ΔF, ΔQ and the
lesion area values. (Arrow 1: sound enamel, arrow 2: demineralised enamel).
Figure 3-8: Examples of the blue light image of demineralised enamel lesions before
and after pH cycling for each group. (Arrow 1: sound enamel, arrow 2: demineralised
enamel).
Group 1: 0 ppm F
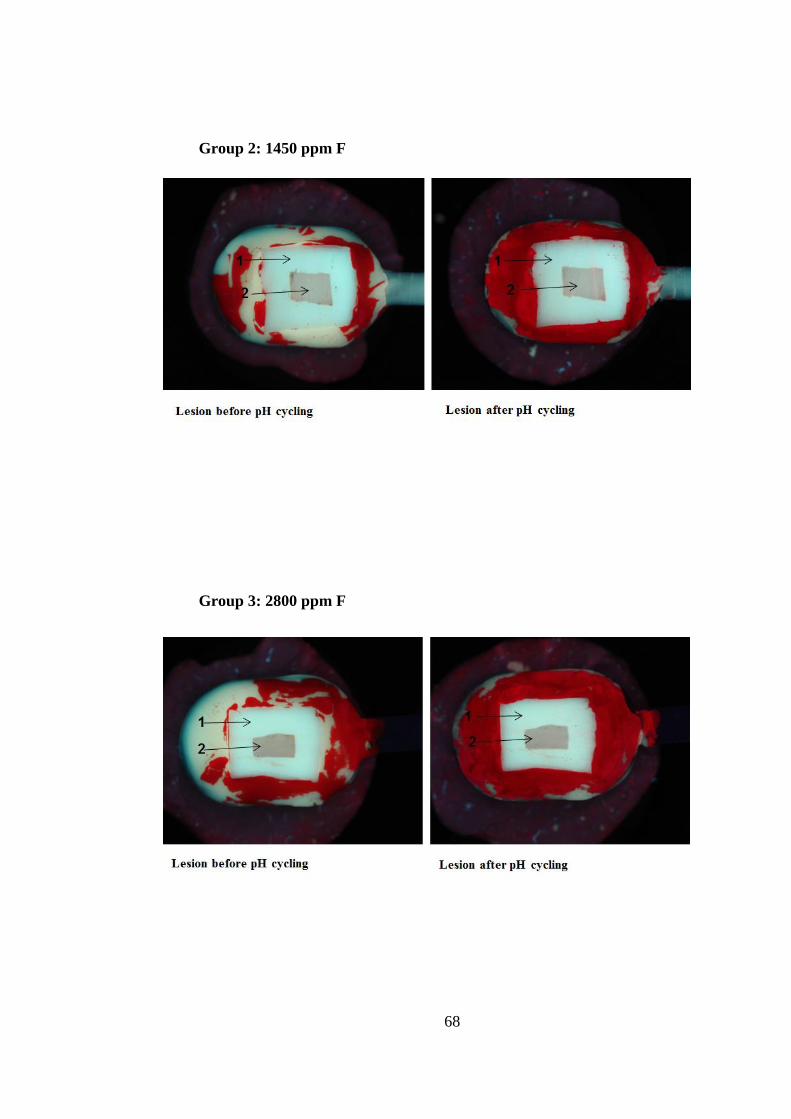
68
Group 2: 1450 ppm F
Group 3: 2800 ppm F
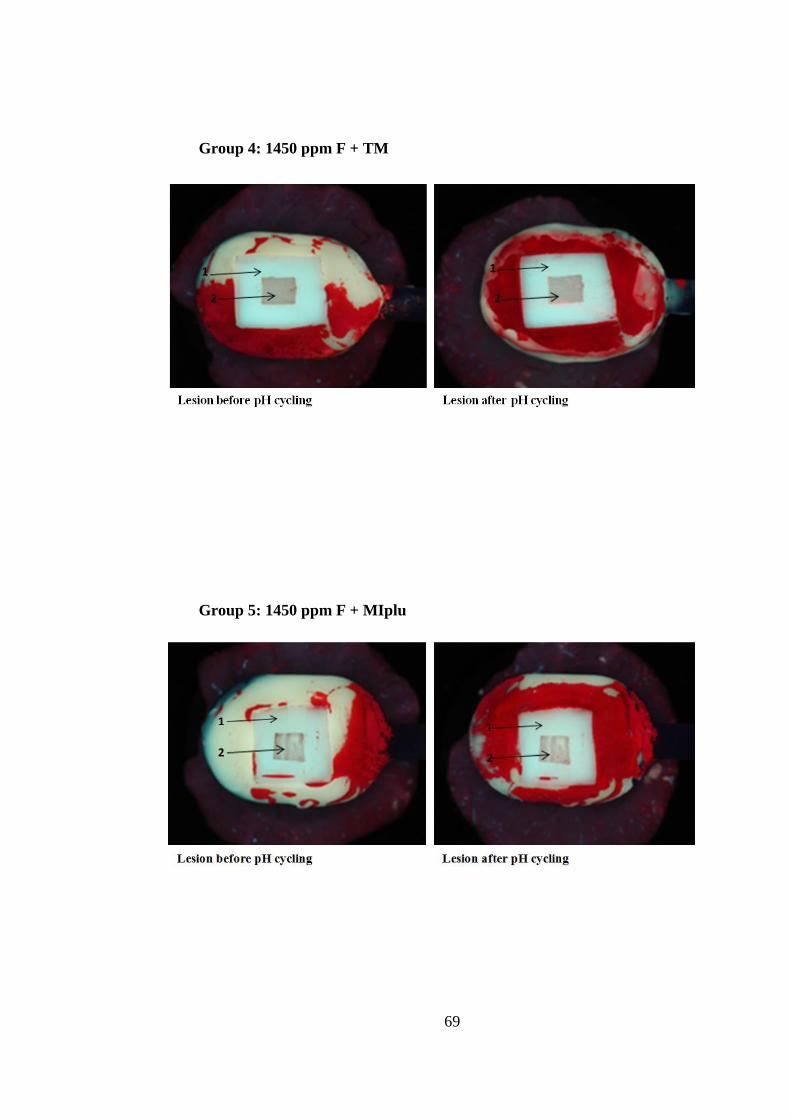
69
Group 4: 1450 ppm F + TM
Group 5: 1450 ppm F + MIplu

70
3.7 The Δf Range of the Artificial Lesions
After performing the QLF baseline analysis for all enamel slabs, the range of
ΔF values were found to vary between -7.66 and -31.98. The enamel slabs with the
ΔF range (-14.12 to -26.65 with an average of -20.75) were selected to be involved
in the experiment in order to pick up the differences in ΔF after treatment.
3.8 Randomisation and Blindness
All enamel slabs were randomly assigned to five groups using a table of
random numbers. When the slabs were analysed with QLF, the investigator did not
know to which group the enamel slab belongs, making the analysis completely
blinded.
3.9 The pH Cycling Regime
Each enamel slab was attached to plastic rod (holder). The enamel slabs were
rinsed with distilled water for 1 minute then dipped in toothpaste slurry for 30
minutes. After that the enamel slabs were rinsed with distilled water for 1 minute
and placed in day time artificial saliva for 60 minutes. The enamel slabs were then
exposed to first demineralisation challenge by dipping in acetic acid solution (pH
4.8) for 5 minutes, then rinsed with distilled water for 1 minute and placed in day
time artificial saliva. This process was repeated until the enamel slabs were
subjected to 5 demineralisation challenges. After the last cycle the enamel slabs
were dipped in toothpaste slurry for 30 minutes.

71
In 0 ppm F, 1450 ppm F and 2800 ppm F groups, enamel slabs were then
placed in the night time artificial saliva. While in 1450 ppm F + TM and 1450 ppm
F + MIplus groups, and following the toothpaste dipping, the enamel slabs were
rinsed gently with distilled water and then dipped in the Tooth Mousse or MI paste
plus slurries for 30 minutes and finally were placed in the night time artificial saliva.
The acetic acid was changed after each exposure. The day time saliva and the night
time saliva were changed every day. The enamel slabs were kept in incubator at
37˚C at all times except during the dipping in the toothpaste slurry or the
demineralisation solution.
3.10 Study Protocol
Group 1: Non-Fluoride Toothpaste (0 ppm F)
Non-Fluoride toothpaste (0 ppm F), which served as a negative control, was
used twice daily. One application was done before the pH cycling regimen and one
at the end of the pH cycling before placing the enamel slabs in the night time saliva.
The enamel slabs were placed in the toothpaste slurry for 30 minutes each time.
Group 2: Fluoride Toothpaste (1450 ppm F)
Fluoride toothpaste (1450 ppm F), which served as a positive control, was
applied twice daily. One application was done before the pH cycling regimen and
one at the end of the pH cycling before placing the enamel slabs in the night time
saliva. The enamel slabs were placed in the toothpaste slurry for 30 minutes each
time.

72
Group 3: High Fluoride Toothpaste (2800 ppm F)
High Fluoride toothpaste (2800 ppm F) was applied twice daily. One
application was done before the pH cycling regimen and one at the end of the pH
cycling before placing the enamel slabs in the night time saliva. The enamel slabs
were placed in the toothpaste slurry for 30 minutes each time.
Group 4: Tooth Mousse (10% w/v CPP-ACP)
Fluoride toothpaste (1450 ppm F) was applied twice daily and Tooth Mousse
(10% w/v CPP-ACP) was applied once a day.
The first toothpaste application was done before the pH cycling regimen and
the second application at the end of the pH cycling. The enamel slabs were placed in
the toothpaste slurry for 30 minutes each time. Following the last application, the
enamel slabs were gently washed with distilled water and placed in the Tooth
Mousse slurry for 30 minutes and then placed in night time saliva.
Group 5: MI paste plus (10% w/v CPP-ACP + 900 ppm F)
Fluoride toothpaste (1450 ppm F) was applied twice daily, and MI paste plus
(10% w/v CPP-ACP + 900 ppm F) applied once a day.
The first toothpaste application was done before the pH cycling regimen and
the second application at the end of the pH cycling. The enamel slabs were placed in
the toothpaste slurry for 30 minutes each time. Following the last application, the
enamel slabs were gently washed with distilled water and placed in the MI paste
plus slurry for 30 minutes and then placed in night time saliva.
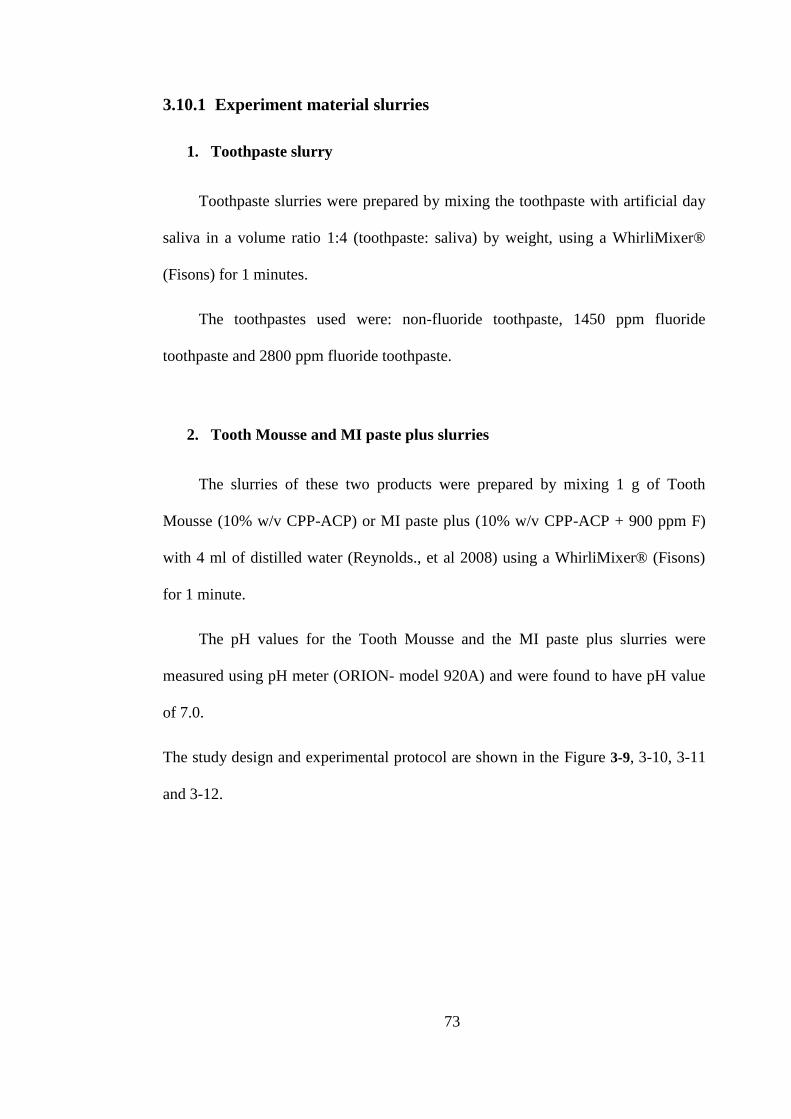
73
3.10.1 Experiment material slurries
1. Toothpaste slurry
Toothpaste slurries were prepared by mixing the toothpaste with artificial day
saliva in a volume ratio 1:4 (toothpaste: saliva) by weight, using a WhirliMixer®
(Fisons) for 1 minutes.
The toothpastes used were: non-fluoride toothpaste, 1450 ppm fluoride
toothpaste and 2800 ppm fluoride toothpaste.
2. Tooth Mousse and MI paste plus slurries
The slurries of these two products were prepared by mixing 1 g of Tooth
Mousse (10% w/v CPP-ACP) or MI paste plus (10% w/v CPP-ACP + 900 ppm F)
with 4 ml of distilled water (Reynolds., et al 2008) using a WhirliMixer® (Fisons)
for 1 minute.
The pH values for the Tooth Mousse and the MI paste plus slurries were
measured using pH meter (ORION- model 920A) and were found to have pH value
of 7.0.
The study design and experimental protocol are shown in the Figure 3-9, 3-10, 3-11
and 3-12.
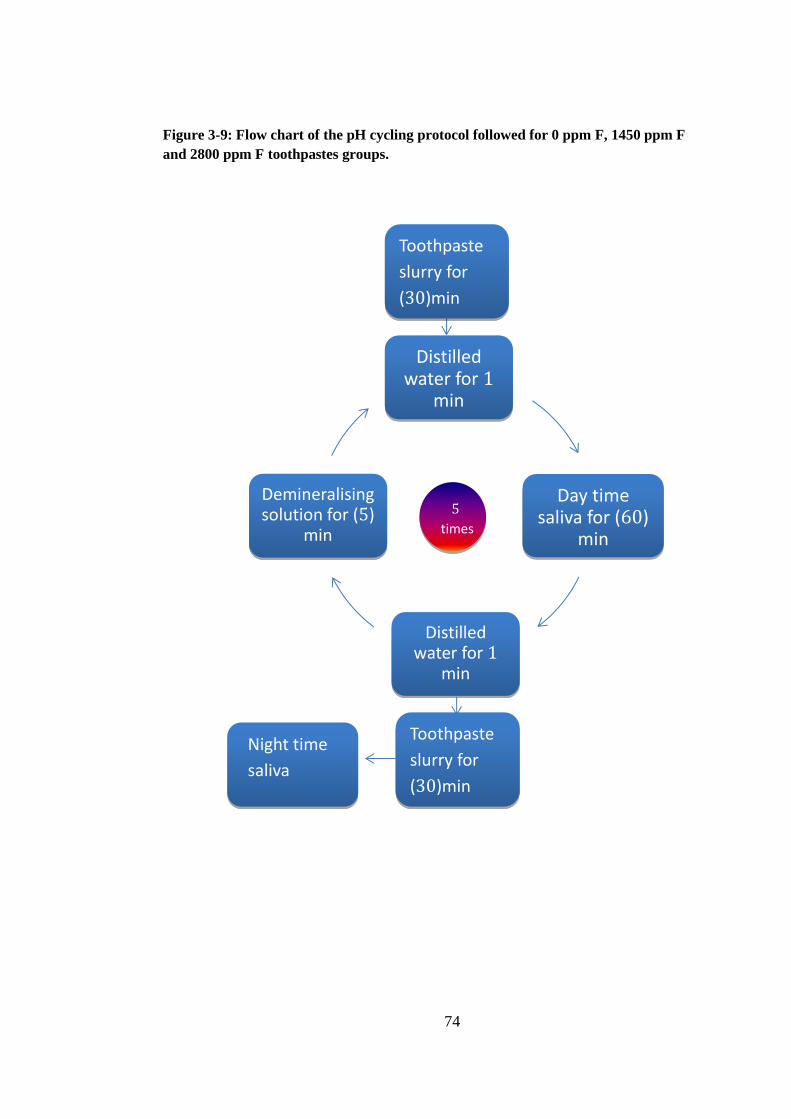
74
Toothpaste
slurry for
(30)min
Toothpaste
slurry for
(30)min
Tooth Mousse
(MIplus) slurry
for 30 min
Night time
saliva
Distilled water for 1
min
Day time saliva for (60)
min
Distilled water for 1
min
Demineralising solution for (5)
min
5
times
Figure 3-9: Flow chart of the pH cycling protocol followed for 0 ppm F, 1450 ppm F
and 2800 ppm F toothpastes groups.

75
Toothpaste
slurry for
(30)min
Toothpaste
slurry for
(30)min
Tooth Mousse
(MIplus) slurry
for 30 min
Night time
saliva
Distilled water for 1
min
Day time saliva for (60)
min
Distilled water for 1
min
Demineralising solution for (5)
min
5
times
Figure 3-10: Flow chart of the pH cycling protocol followed for 1450 ppm F +TM and
1450 ppm F + MIplus groups.

76
Figure 3-11: Flow chart for 0 ppm F, 1450 ppm F and 2800 ppm F toothpaste groups.
Toothpaste slurry (0 ppm, 1450 ppm or 2800 ppm) for 30 min
2. Acetic acid (for 5 min)
1. Acetic acid (for 5 min)
Wash with distilled water
Toothpaste slurry (0 ppm, 1450 ppm or 2800 ppm) for 30 min
Night time saliva
3. Acetic acid (for 5 min)
5. Acetic acid (for 5 min)
4. Acetic acid (for 5 min)
Wash with distilled water --->60 min in day time saliva---Wash with distilled water
Wash with distilled water --->60 min in day time saliva---Wash with distilled water
Wash with distilled water --->60 min in day time saliva---Wash with distilled water
Wash with distilled water --->60 min in day time saliva---Wash with distilled water
Wash with distilled water--->60 min in day time saliva---Wash with distilled water
Wash with distilled water --->60 min in day time saliva---Wash with distilled water
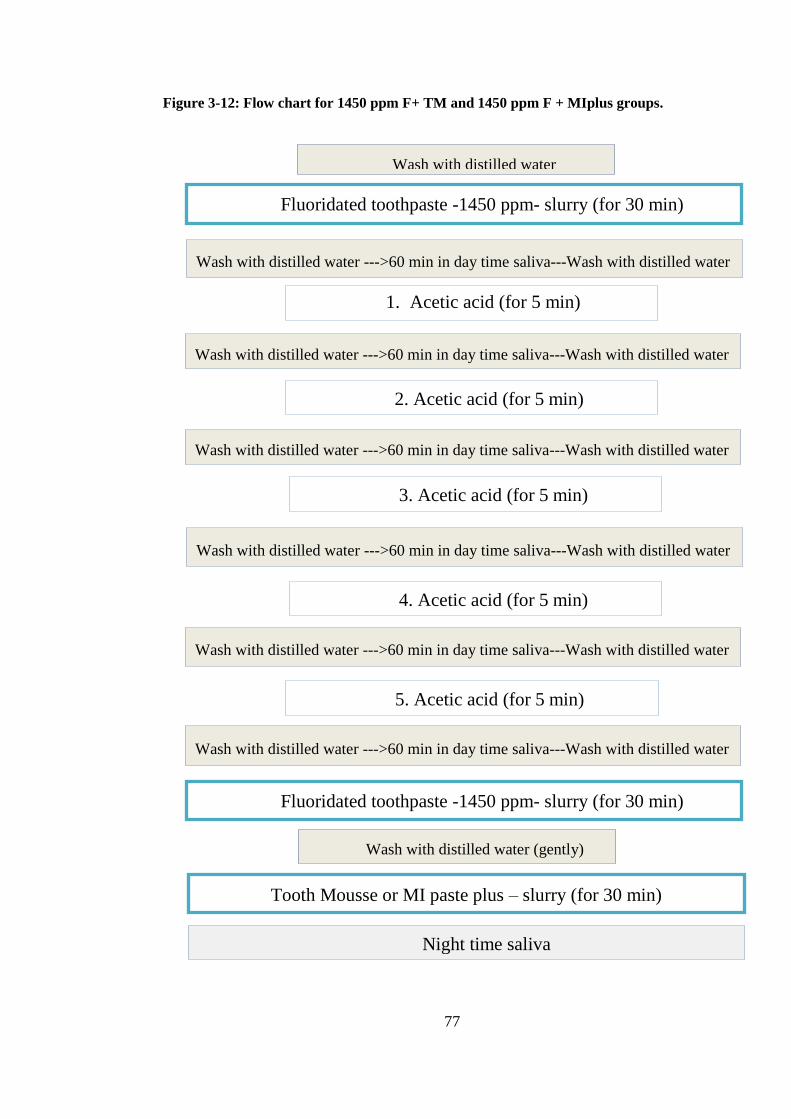
77
Figure 3-12: Flow chart for 1450 ppm F+ TM and 1450 ppm F + MIplus groups.
Fluoridated toothpaste -1450 ppm- slurry (for 30 min)
Night time saliva
Wash with distilled water
2. Acetic acid (for 5 min)
1. Acetic acid (for 5 min)
3. Acetic acid (for 5 min)
5. Acetic acid (for 5 min)
4. Acetic acid (for 5 min)
Wash with distilled water --->60 min in day time saliva---Wash with distilled water
Wash with distilled water --->60 min in day time saliva---Wash with distilled water
Wash with distilled water --->60 min in day time saliva---Wash with distilled water
Wash with distilled water --->60 min in day time saliva---Wash with distilled water
Wash with distilled water --->60 min in day time saliva---Wash with distilled water
Wash with distilled water --->60 min in day time saliva---Wash with distilled water
Tooth Mousse or MI paste plus – slurry (for 30 min)
Fluoridated toothpaste -1450 ppm- slurry (for 30 min)
Wash with distilled water (gently)
78
3.11 Preparation of Solutions Used in the Study
3.11.1 Artificial saliva
Two artificial saliva solutions were used in this study. The first solution was
used for day time during the pH cycling, between the acid exposures. The second
solution was used to store the slabs during the night. The day saliva was
supersaturated solution that allowed remineralisation of enamel slabs, the night
saliva was a saturated solution that maintained the enamel condition and did not
provide any minerals exchange.
The artificial saliva composition was based on the electrolyte composition of
natural saliva and it was advised to be used in order to eliminate any precipitation on
the enamel surface (as provided by Dr RP Shellis, Department of Oral and Dental
Science, University of Bristol, Bristol, UK).
3.11.1.1 The preparation of day time artificial saliva
The formulation of the day time saliva is shown in Table 3-1.
Table 3-1: Composition of the day time saliva solution.
Contents Concentration g/L
Calcium carbonate 0.07
Magnesium carbonate (hydrated basic) 0.019
Potassium di-hydrogen phosphate 0.554
HEPES buffer (acid form) 4.77
Potassium chloride 2.24

79
Using 900 ml distilled water 1.8 ml 1 mol/L HCl and the above components
were stirred using a magnetic stirrer until they all dissolved. The solution pH was
then adjusted to 6.8 by adding KOH solution and was made up to 1L with de-ionised
water.
3.11.1.2 The preparation of night time artificial saliva
The formulation of the night time saliva is shown in Table 3-2.
Table 3-2: Composition of the night time saliva solution.
Using 900 ml distilled water, 1.8 ml 1 mol/L HCl and the above components
were stirred using magnetic stirrer until they all dissolved. The solution pH was then
adjusted to 6.8 by adding KOH solution and was made up to 1L with de-ionised
water.
Contents Concentration g/L
Calcium carbonate 0.05
Magnesium carbonate (hydrated basic) 0.019
Potassium di-hydrogen phosphate 0.068
HEPES buffer (acid form) 4.77
Potassium chloride 2.24
80
3.11.2 Acetic acid buffer
The preparation of acetic acid solution was done according to ten Cate et al.
(2006), the constitution of acetic acid is shown in Table 3-3.
Table 3-3: Constituents of Acetic acid.
The above contents and 1 L distilled water were stirred using centrifuge until
fully dissolved. The pH was adjusted using pH meter (ORION- model 920A) by
adding KOH solution to reach pH 4.8.
3.12 Training and Calibration
The study investigator had received training to use the QLF machine (QLF-D
Biluminator™ 2) and was familiar with the QLF software before the study.
The training was provided by the manufacturer (Inspektor Research Systems
BV, Amsterdam, The Netherlands), and included the image capturing as well as
image analysis. The investigator assessment of sound, demineralised enamel and the
border of the lesion during image analysis were calibrated.
Contents Concentration g/L
Calcium chloride 1.66
Potassium di-hydrogen phosphate 1.22
Acetic acid 30.02
81
3.13 Intra-Examiner Reproducibility
The study investigator randomly retested 15% of the enamel slabs with the
QLF at the end of the experiment. Intra-examiner reproducibility was tested using
the Bland-Altman plot as well as using Intra-class Correlation Coefficient (ICC).
3.14 Statistical Analysis
The data were analysed using SPSS statistical software package for windows
version 20.0. Descriptive statistics were used to calculate the mean, median, range,
and standard deviation.
The normality of the data distribution was assessed using Shapiro-Wilk test
and Kolmogorov-Smirnov test.
Paired sampled t-tests were performed to compare the changes in
remineralisation at baseline and after treatment within the same group.
One way ANOVA was used to compare between the five groups when the data
were normally distributed, and Kruskal-Wallis Test was used when the data were
not normally distributed. Furthermore, Bonferroni test or Mann-Whitney U test was
used to assess if there was any significant difference between each of the groups.
The test calculated the 95% confidence interval as well. The significance level was
set at a level of p <0.05.

82
3.15 Scanning Electron Microscopy SEM
Two enamel slabs from each group were selected randomly for the SEM
analysis. Samples were mounted on stubs using carbon discs (12mm Agar) for gold
sputtering. Specimens were then sputter coated with 300A˚ layer of gold using
Polaron E5000 sputter coater (Figure 3-13). Microstructural analysis was undertaken
using a Scanning Electron Microscope (HITACHI S-3400N) (Figure 3-14) operated
at a 20 kV accelerating voltage. Standardised scanning angles were used and the
entire surface of each enamel disc was scanned and imaged using high power
magnification.
Figure 3-13: enamel slabs coated with gold for the SEM analysis.
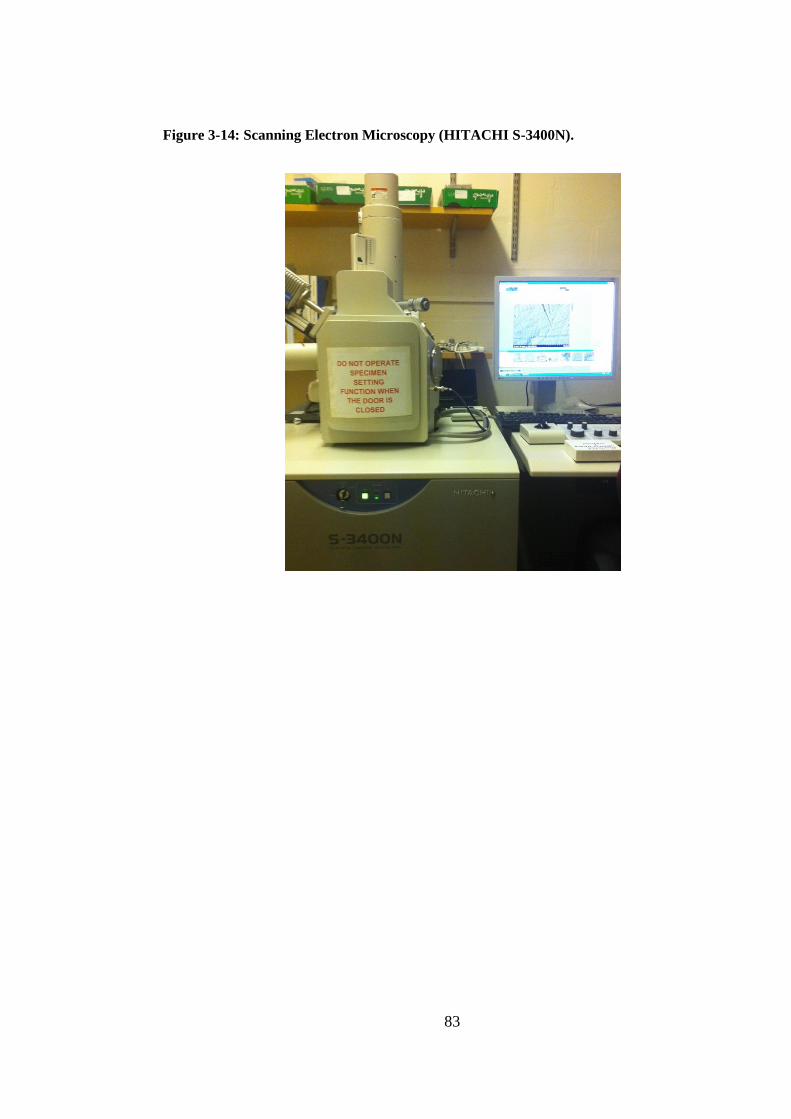
83
Figure 3-14: Scanning Electron Microscopy (HITACHI S-3400N).
84
4.0 RESULTS
4.1 Quantitative Light-induced Fluorescence (QLF) Results
Three main parameters for QLF were statistically analysed, these were:
ΔF: Percentage fluorescence loss with respect to the fluorescence of sound
tooth tissue. Related to lesion depth (%).
ΔQ: ΔF times the Area. Percentage fluorescence loss with respect to the
fluorescence of sound tissue times the area. This is related to lesion volume
(%px2).
Area: The surface area of the lesion expressed in pixels2
(px2).
4.1.1 The mean fluorescence loss ΔF
The values of ΔF at baseline for all groups were checked to see if there was a
difference between the groups. The normality tests (Shapiro-Wilk test and
Kolmogorov-Smirnov test) were carried out to check the normality of the data. The
data were considered normally distributed if the p values from these tests were not
statistically significant (p >0.05). p values for all groups except for group 3 were
not statistically significant therefore data was considered to be normally distributed.
(Appendix 2).
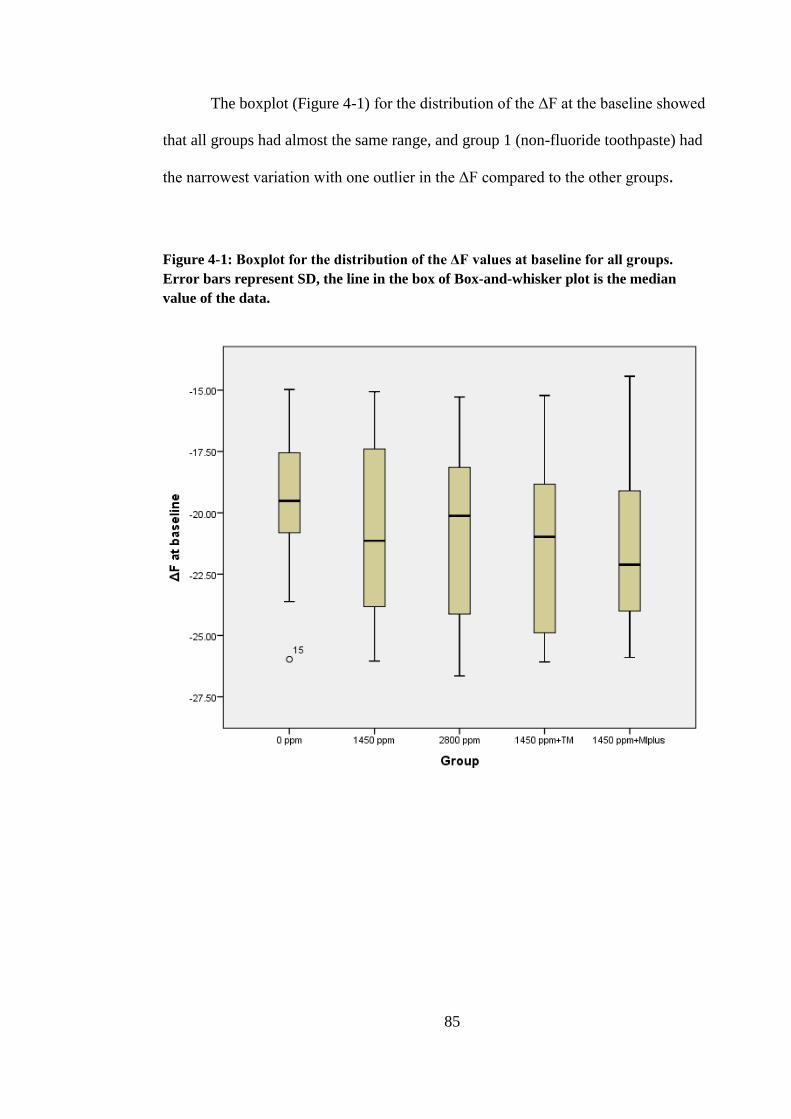
85
The boxplot (Figure 4-1) for the distribution of the ΔF at the baseline showed
that all groups had almost the same range, and group 1 (non-fluoride toothpaste) had
the narrowest variation with one outlier in the ΔF compared to the other groups.
Figure 4-1: Boxplot for the distribution of the ΔF values at baseline for all groups.
Error bars represent SD, the line in the box of Box-and-whisker plot is the median
value of the data.

86
One way ANOVA test (Table 4-1) was performed to assess if there was any
statistically significant difference in ΔF values at the baseline between the lesions
assigned to the five groups. No statistically significant difference was found.
Table 4-1:One way ANOVA between groups for ΔF values at baseline
Sum of
Squares df
Mean
Square F Sig.
Between Groups 49.062 4 12.265 1.108 .356
Within Groups 1273.357 115 11.073
Total 1322.419 119
4.1.1.1 Difference in ΔF within each group
The ΔF mean values both at baseline and after treatment are shown in
Table 4-2. It can be seen that there was an improvement in ΔF values for all the
groups in the study.
Table 4-2: The mean values of ΔF at baseline and after treatment for all groups.
Group Mean ΔF at
baseline ± SD
Mean ΔF
after
treatment ±
SD
Mean Difference in ΔF at
baseline and after treatment
± SD
0 ppm -19.58 ± 2.69 -15.93 ± 2.32 3.647 ± 1.89
1450 ppm -20.71 ± 3.50 -14.82 ± 2.96 5.887 ± 2.03
2800 ppm -21.00 ± 3.41 -16.13 ± 4.04 4.869 ± 2.66
1450 ppm + TM -21.34 ± 3.45 -15.12 ± 3.08 6.219 ± 2.57
1450 ppm +
MIplus -21.25 ± 3.51 -15.15 ± 3.57 6.107 ± 2.53
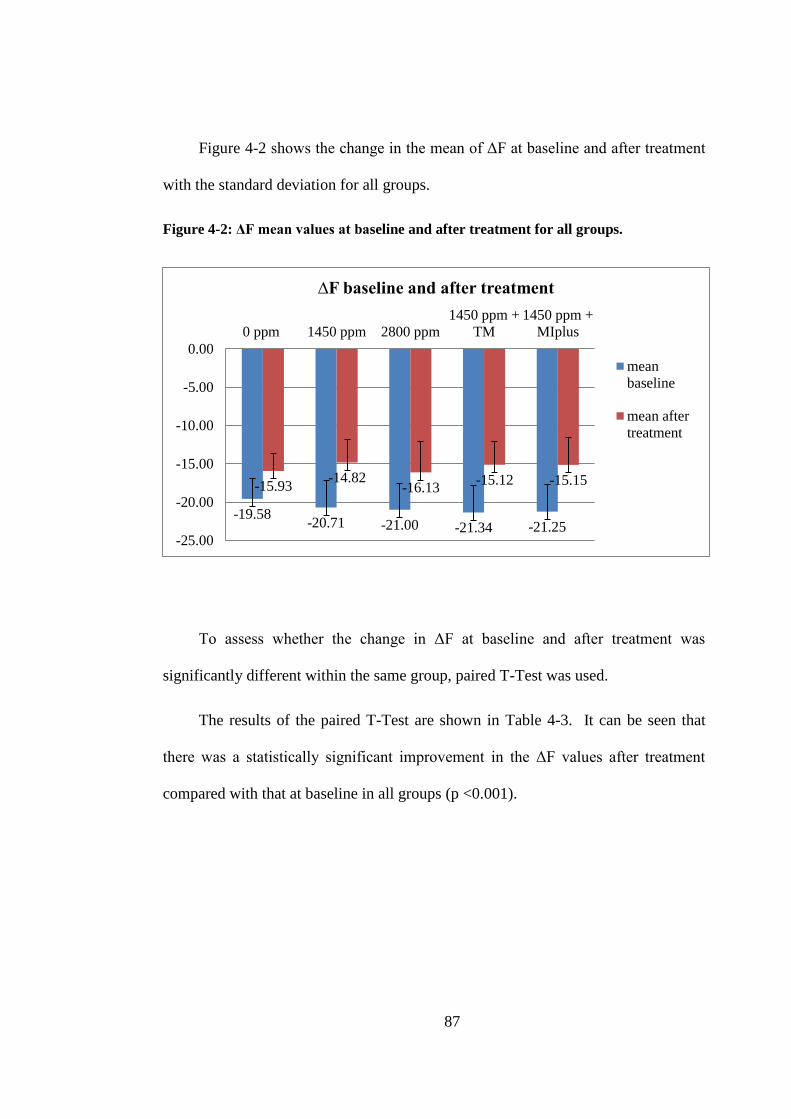
87
Figure 4-2 shows the change in the mean of ΔF at baseline and after treatment
with the standard deviation for all groups.
Figure 4-2: ΔF mean values at baseline and after treatment for all groups.
To assess whether the change in ΔF at baseline and after treatment was
significantly different within the same group, paired T-Test was used.
The results of the paired T-Test are shown in Table 4-3. It can be seen that
there was a statistically significant improvement in the ΔF values after treatment
compared with that at baseline in all groups (p <0.001).
-19.58 -20.71 -21.00 -21.34 -21.25
-15.93 -14.82
-16.13 -15.12 -15.15
-25.00
-20.00
-15.00
-10.00
-5.00
0.00
0 ppm 1450 ppm 2800 ppm
1450 ppm +
TM
1450 ppm +
MIplus
∆F baseline and after treatment
mean
baseline
mean after
treatment
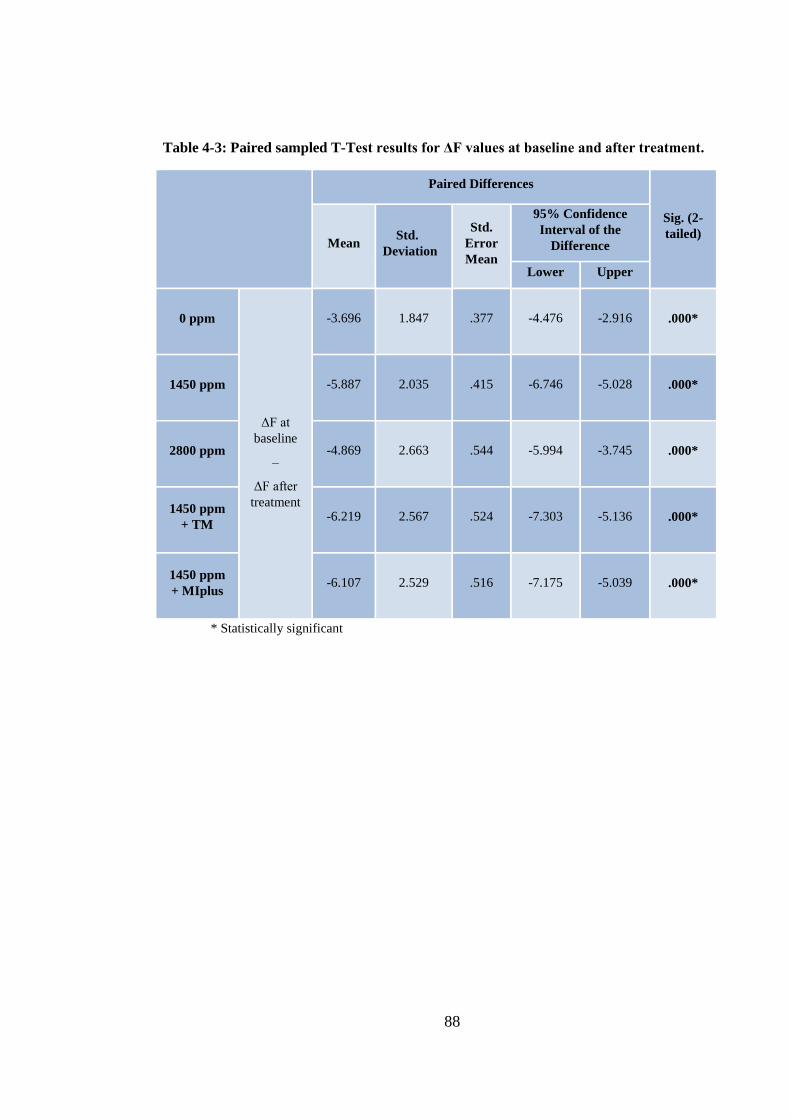
88
Table 4-3: Paired sampled T-Test results for ΔF values at baseline and after treatment.
Paired Differences
Sig. (2-
tailed) Mean
Std.
Deviation
Std.
Error
Mean
95% Confidence
Interval of the
Difference
Lower Upper
0 ppm
ΔF at
baseline
–
ΔF after
treatment
-3.696 1.847 .377 -4.476 -2.916 .000*
1450 ppm -5.887 2.035 .415 -6.746 -5.028 .000*
2800 ppm -4.869 2.663 .544 -5.994 -3.745 .000*
1450 ppm
+ TM -6.219 2.567 .524 -7.303 -5.136 .000*
1450 ppm
+ MIplus -6.107 2.529 .516 -7.175 -5.039 .000*
* Statistically significant

89
4.1.1.2 Difference in ΔF between all groups
The ΔF difference (change) was measured using the following formula:
Difference in ΔF = ΔF after treatment - ΔF at baseline
Descriptive statistics
Figure 4-3 shows the difference in ΔF in the five tested groups. In all groups
the difference in ΔF was positive, meaning that there was decrease in ΔF (mean
fluorescence loss) after treatment compared to that at baseline. The highest
reduction in ΔF was seen in the 1450 ppm fluoride toothpaste with Tooth Mousse
(1450 ppm F + TM) group with mean difference of (6.22 ± 2.57), followed by the
1450 ppm fluoride toothpaste with MI paste plus (1450 ppm F + MIplus) with
mean difference of (6.11± 2.53). The least reduction was noticed in the non-
fluoride toothpaste (0 ppm F) group with mean difference of (3.65 ± 1.89). The
1450 ppm fluoride toothpaste (1450 ppm F) group and the 2800 ppm fluoride
toothpaste (2800 ppm F) group also show reduction in the ΔF value with mean
difference of (5.89± 2.03), (4.87±2.66) respectively (Table 4-4).
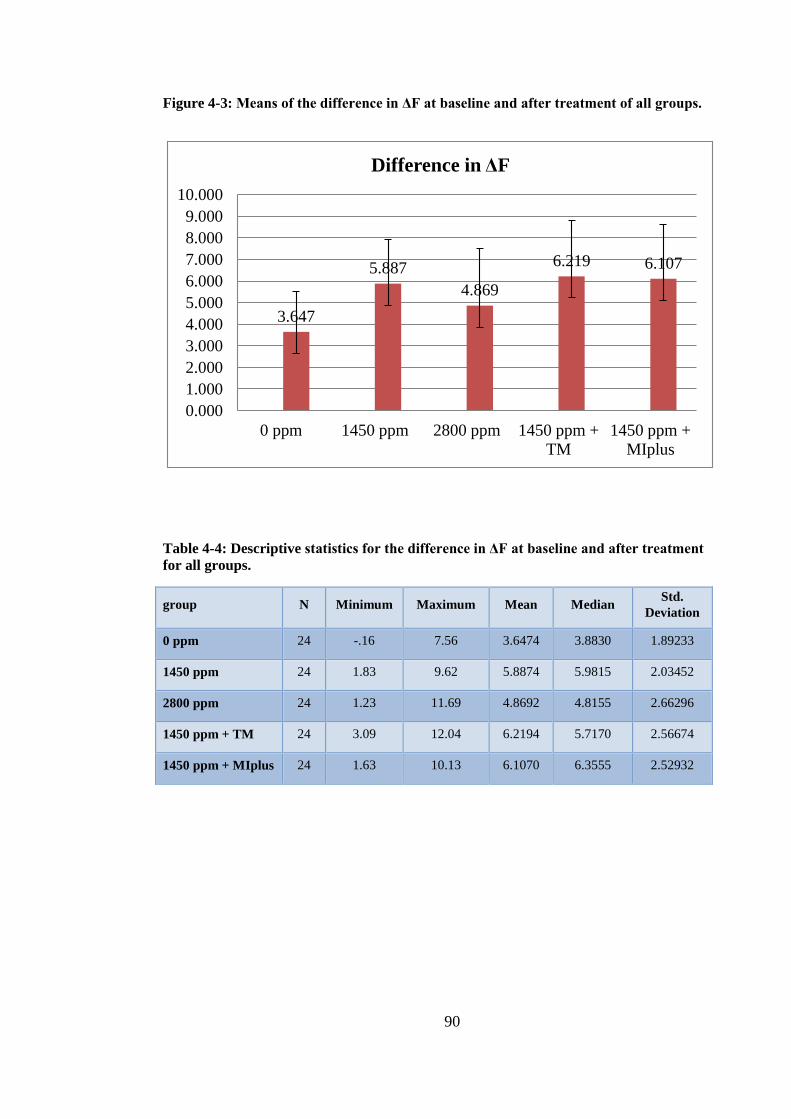
90
Figure 4-3: Means of the difference in ΔF at baseline and after treatment of all groups.
Table 4-4: Descriptive statistics for the difference in ΔF at baseline and after treatment
for all groups.
group N Minimum Maximum Mean Median Std.
Deviation
0 ppm 24 -.16 7.56 3.6474 3.8830 1.89233
1450 ppm 24 1.83 9.62 5.8874 5.9815 2.03452
2800 ppm 24 1.23 11.69 4.8692 4.8155 2.66296
1450 ppm + TM 24 3.09 12.04 6.2194 5.7170 2.56674
1450 ppm + MIplus 24 1.63 10.13 6.1070 6.3555 2.52932
3.647
5.887
4.869
6.219 6.107
0.000
1.000
2.000
3.000
4.000
5.000
6.000
7.000
8.000
9.000
10.000
0 ppm 1450 ppm 2800 ppm 1450 ppm +
TM
1450 ppm +
MIplus
Difference in ΔF
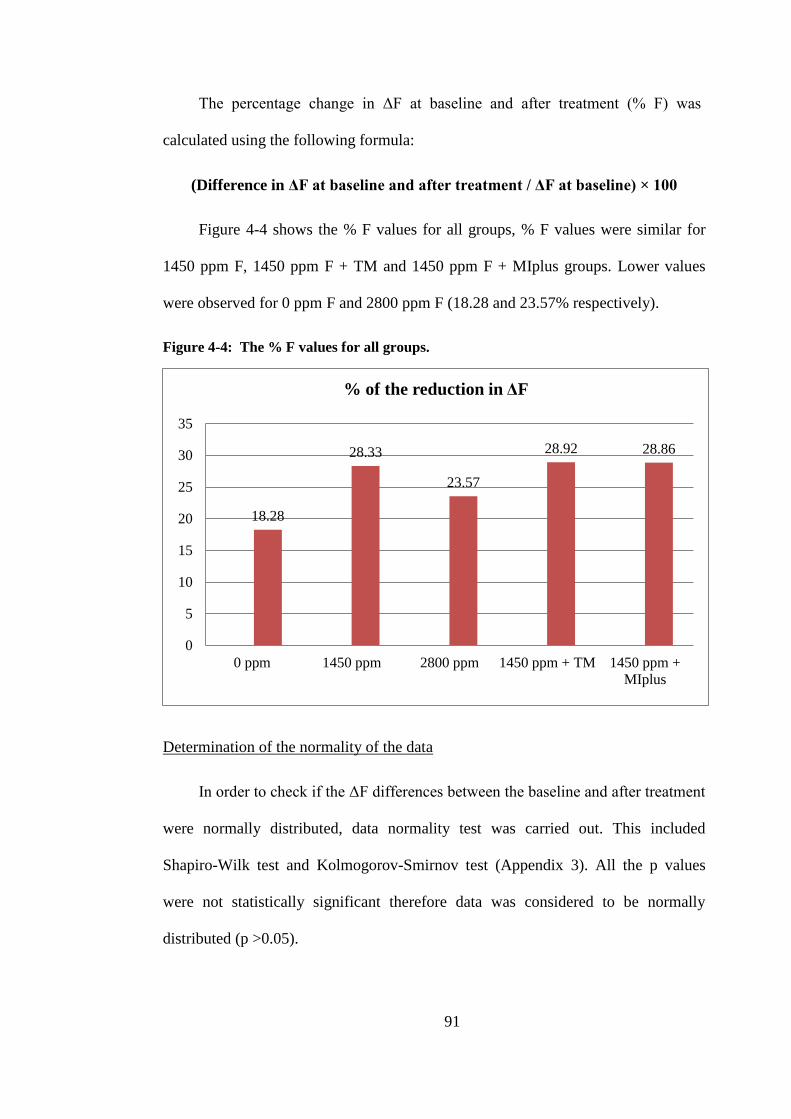
91
The percentage change in ΔF at baseline and after treatment (% F) was
calculated using the following formula:
(Difference in ΔF at baseline and after treatment / ΔF at baseline) × 100
Figure 4-4 shows the % F values for all groups, % F values were similar for
1450 ppm F, 1450 ppm F + TM and 1450 ppm F + MIplus groups. Lower values
were observed for 0 ppm F and 2800 ppm F (18.28 and 23.57% respectively).
Figure 4-4: The % F values for all groups.
Determination of the normality of the data
In order to check if the ΔF differences between the baseline and after treatment
were normally distributed, data normality test was carried out. This included
Shapiro-Wilk test and Kolmogorov-Smirnov test (Appendix 3). All the p values
were not statistically significant therefore data was considered to be normally
distributed (p >0.05).
18.28
28.33
23.57
28.92 28.86
0
5
10
15
20
25
30
35
0 ppm 1450 ppm 2800 ppm 1450 ppm + TM 1450 ppm +
MIplus
% of the reduction in ΔF
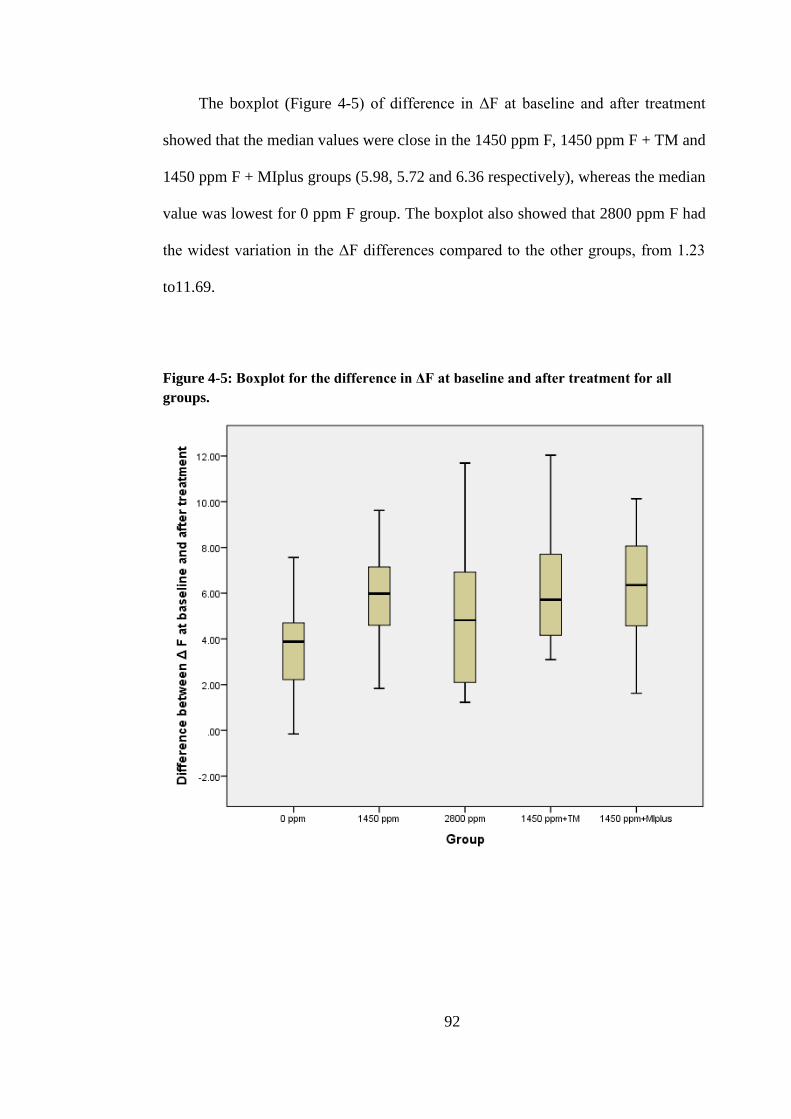
92
The boxplot (Figure 4-5) of difference in ΔF at baseline and after treatment
showed that the median values were close in the 1450 ppm F, 1450 ppm F + TM and
1450 ppm F + MIplus groups (5.98, 5.72 and 6.36 respectively), whereas the median
value was lowest for 0 ppm F group. The boxplot also showed that 2800 ppm F had
the widest variation in the ΔF differences compared to the other groups, from 1.23
to11.69.
Figure 4-5: Boxplot for the difference in ΔF at baseline and after treatment for all
groups.

93
One way ANOVA test (Table 4-5) was performed to assess if the difference in
ΔF was statistically significant between the five groups. It showed that the mean
difference in ΔF was statistically significant between the groups (p <0.001).
Table 4-5: One way ANOVA between groups for the difference in ∆F at baseline and
after treatment.
Sum of
Squares df
Mean
Square F Sig.
Between Groups 113.946 4 28.486 5.124 .001*
Within Groups 639.334 115 5.559
Total 753.280 119
* Statistically significant
In order to determine which groups were statistically significant different,
pairwise comparisons were conducted using a Bonferroni test. The Bonferroni tests
corrects for multiple testing. The results of the Bonferroni tests are shown in
Table 4-6.
It can be seen that the mean difference in ΔF of the 0 ppm F control group was
significantly lower compared to the 1450 ppm F, 1450 ppm F + TM and 1450 ppm F
+ MIplus groups, (p < 0.05). However, no significant difference was observed
between the 0 ppm F and 2800 ppm F groups.
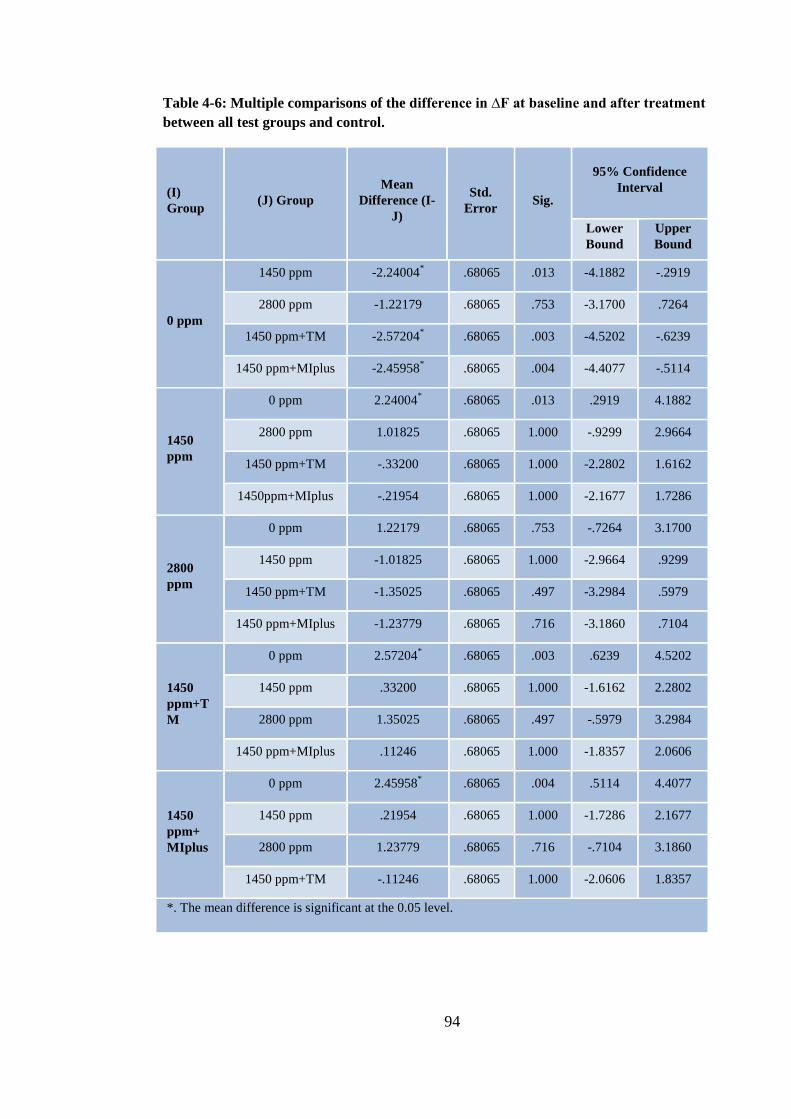
94
Table 4-6: Multiple comparisons of the difference in ∆F at baseline and after treatment
between all test groups and control.
(I)
Group (J) Group
Mean
Difference (I-
J)
Std.
Error Sig.
95% Confidence
Interval
Lower
Bound
Upper
Bound
0 ppm
1450 ppm -2.24004* .68065 .013 -4.1882 -.2919
2800 ppm -1.22179 .68065 .753 -3.1700 .7264
1450 ppm+TM -2.57204* .68065 .003 -4.5202 -.6239
1450 ppm+MIplus
-2.45958* .68065 .004 -4.4077 -.5114
1450
ppm
0 ppm 2.24004* .68065 .013 .2919 4.1882
2800 ppm 1.01825 .68065 1.000 -.9299 2.9664
1450 ppm+TM -.33200 .68065 1.000 -2.2802 1.6162
1450ppm+MIplus
-.21954 .68065 1.000 -2.1677 1.7286
2800
ppm
0 ppm 1.22179 .68065 .753 -.7264 3.1700
1450 ppm -1.01825 .68065 1.000 -2.9664 .9299
1450 ppm+TM -1.35025 .68065 .497 -3.2984 .5979
1450 ppm+MIplus -1.23779 .68065 .716 -3.1860 .7104
1450
ppm+T
M
0 ppm 2.57204* .68065 .003 .6239 4.5202
1450 ppm .33200 .68065 1.000 -1.6162 2.2802
2800 ppm 1.35025 .68065 .497 -.5979 3.2984
1450 ppm+MIplus .11246 .68065 1.000 -1.8357 2.0606
1450
ppm+
MIplus
0 ppm 2.45958* .68065 .004 .5114 4.4077
1450 ppm .21954 .68065 1.000 -1.7286 2.1677
2800 ppm 1.23779 .68065 .716 -.7104 3.1860
1450 ppm+TM -.11246 .68065 1.000 -2.0606 1.8357
*. The mean difference is significant at the 0.05 level.
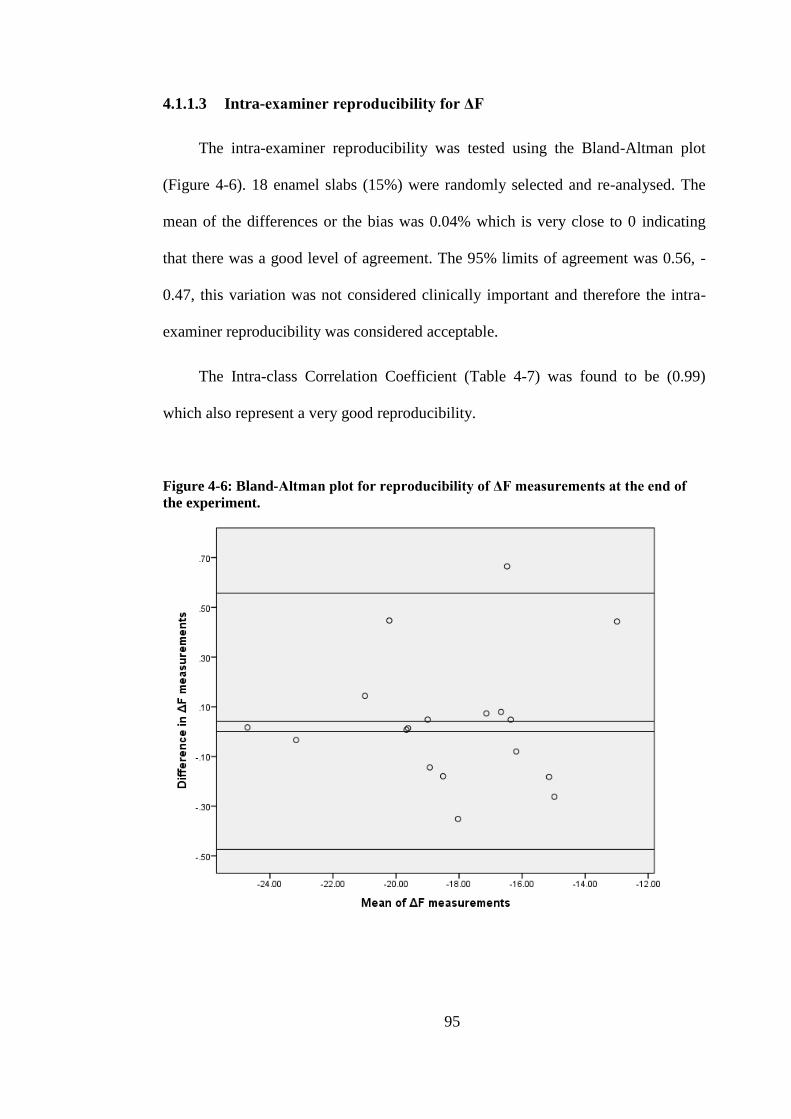
95
4.1.1.3 Intra-examiner reproducibility for ΔF
The intra-examiner reproducibility was tested using the Bland-Altman plot
(Figure 4-6). 18 enamel slabs (15%) were randomly selected and re-analysed. The
mean of the differences or the bias was 0.04% which is very close to 0 indicating
that there was a good level of agreement. The 95% limits of agreement was 0.56, -
0.47, this variation was not considered clinically important and therefore the intra-
examiner reproducibility was considered acceptable.
The Intra-class Correlation Coefficient (Table 4-7) was found to be (0.99)
which also represent a very good reproducibility.
Figure 4-6: Bland-Altman plot for reproducibility of ΔF measurements at the end of
the experiment.

96
Table 4-7: Intra-class Correlation Coefficient for ΔF measurements.
Intra-class
Correlation
95% Confidence
Interval F Test with True Value 0
Lower
Bound
Upper
Bound Value df1 df2 Sig
Single
Measures .995 .986 .998 415.576 15 15 .000
Average
Measures .998 .993 .999 415.576 15 15 .000

97
4.1.2 ΔQ: ΔF times the Area. Percentage fluorescence loss with respect
to the fluorescence of sound tissue times the area. Lesion volume
Normality tests (Shapiro-Wilk test and Kolmogorov-Smirnov test) were done
for the ΔQ values at baseline and showed that the data were normally distributed for
all groups (Appendix 4).
The boxplot (Figure 4-7) for the distribution of the ΔQ at the baseline showed
that the median for all groups were close, and two outliers can be seen in 2800 ppm
F and 1450 ppm F + TM groups.
Figure 4-7: Boxplot for the distribution of the ΔQ values at baseline for all groups.
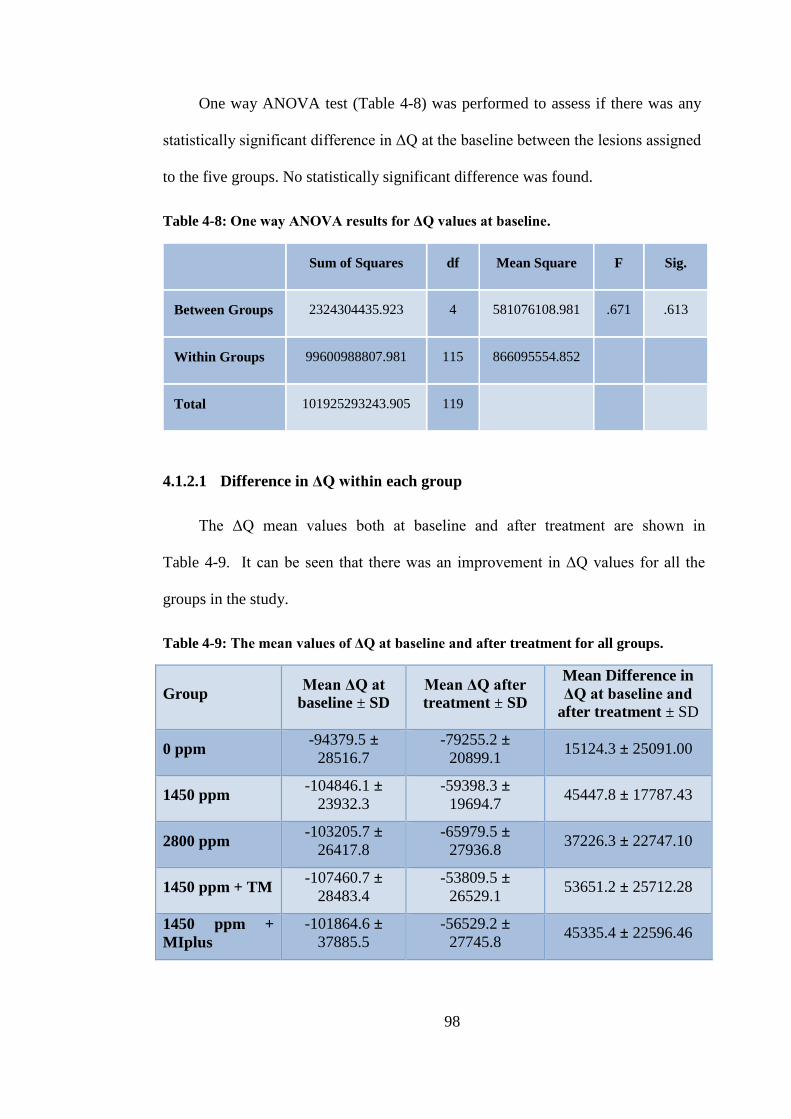
98
One way ANOVA test (Table 4-8) was performed to assess if there was any
statistically significant difference in ΔQ at the baseline between the lesions assigned
to the five groups. No statistically significant difference was found.
Table 4-8: One way ANOVA results for ΔQ values at baseline.
Sum of Squares df Mean Square F Sig.
Between Groups 2324304435.923 4 581076108.981 .671 .613
Within Groups 99600988807.981 115 866095554.852
Total 101925293243.905 119
4.1.2.1 Difference in ΔQ within each group
The ΔQ mean values both at baseline and after treatment are shown in
Table 4-9. It can be seen that there was an improvement in ΔQ values for all the
groups in the study.
Table 4-9: The mean values of ΔQ at baseline and after treatment for all groups.
Group Mean ΔQ at
baseline ± SD
Mean ΔQ after
treatment ± SD
Mean Difference in
ΔQ at baseline and
after treatment ± SD
0 ppm -94379.5 ±
28516.7
-79255.2 ±
20899.1 15124.3 ± 25091.00
1450 ppm -104846.1 ±
23932.3
-59398.3 ±
19694.7 45447.8 ± 17787.43
2800 ppm -103205.7 ±
26417.8
-65979.5 ±
27936.8 37226.3 ± 22747.10
1450 ppm + TM -107460.7 ±
28483.4
-53809.5 ±
26529.1 53651.2 ± 25712.28
1450 ppm +
MIplus
-101864.6 ±
37885.5
-56529.2 ±
27745.8 45335.4 ± 22596.46
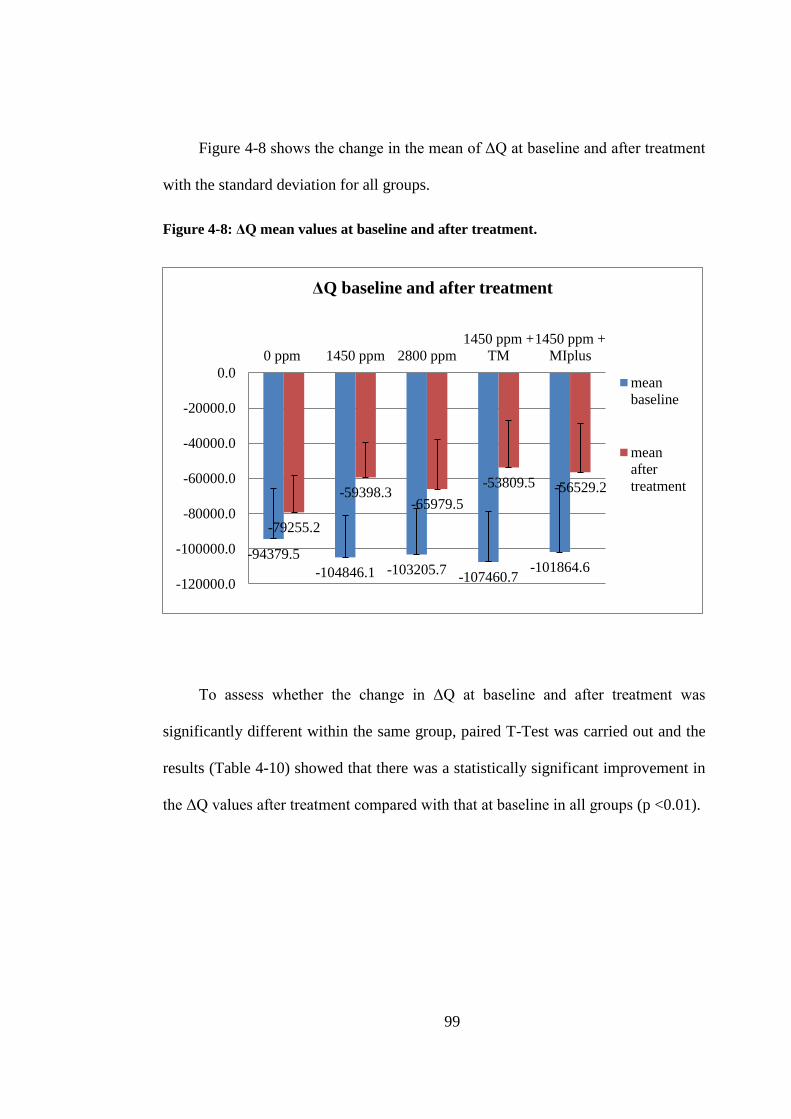
99
Figure 4-8 shows the change in the mean of ΔQ at baseline and after treatment
with the standard deviation for all groups.
Figure 4-8: ΔQ mean values at baseline and after treatment.
To assess whether the change in ΔQ at baseline and after treatment was
significantly different within the same group, paired T-Test was carried out and the
results (Table 4-10) showed that there was a statistically significant improvement in
the ΔQ values after treatment compared with that at baseline in all groups (p <0.01).
-94379.5
-104846.1 -103205.7 -107460.7
-101864.6
-79255.2
-59398.3 -65979.5
-53809.5 -56529.2
-120000.0
-100000.0
-80000.0
-60000.0
-40000.0
-20000.0
0.0
0 ppm 1450 ppm 2800 ppm
1450 ppm +
TM
1450 ppm +
MIplus
ΔQ baseline and after treatment
mean
baseline
mean
after
treatment
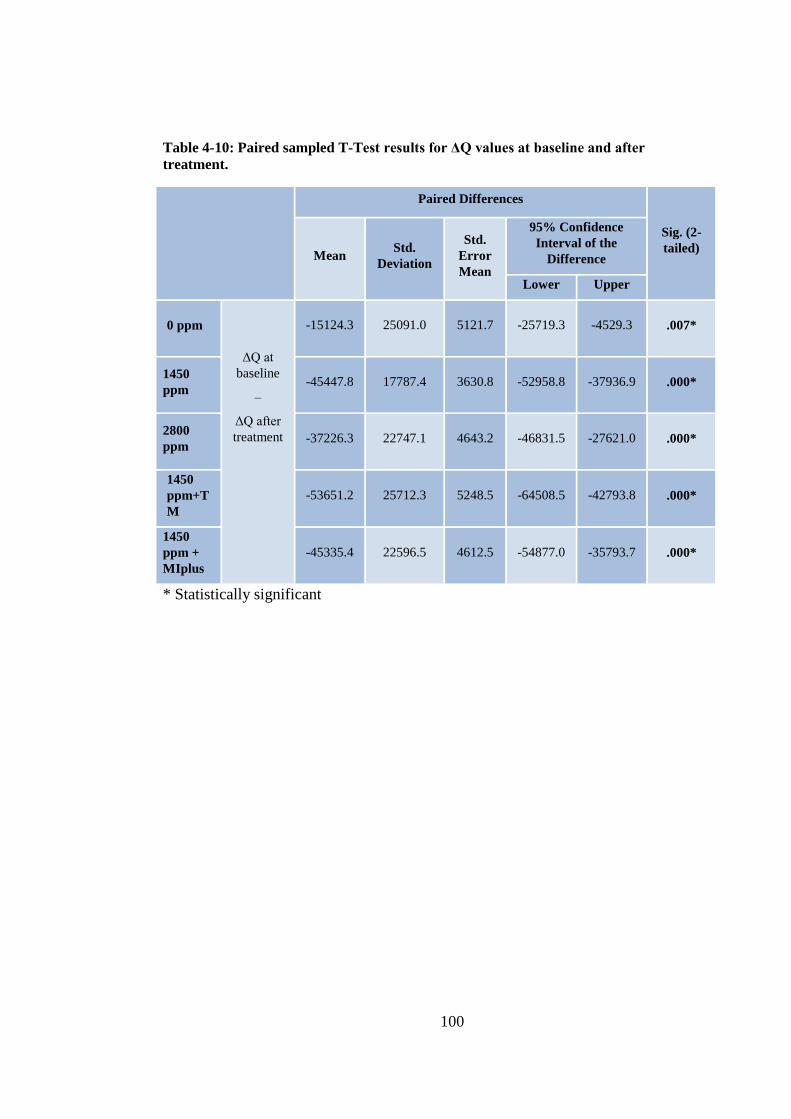
100
Table 4-10: Paired sampled T-Test results for ΔQ values at baseline and after
treatment.
Paired Differences
Sig. (2-
tailed) Mean
Std.
Deviation
Std.
Error
Mean
95% Confidence
Interval of the
Difference
Lower Upper
0 ppm
ΔQ at
baseline
–
ΔQ after
treatment
-15124.3 25091.0 5121.7 -25719.3 -4529.3 .007*
1450
ppm -45447.8 17787.4 3630.8 -52958.8 -37936.9 .000*
2800
ppm -37226.3 22747.1 4643.2 -46831.5 -27621.0 .000*
1450
ppm+T
M
-53651.2 25712.3 5248.5 -64508.5 -42793.8 .000*
1450
ppm +
MIplus
-45335.4 22596.5 4612.5 -54877.0 -35793.7 .000*
* Statistically significant

101
4.1.2.2 Difference in ΔQ between groups
The ΔQ difference (change) was measured using the following formula:
Difference in ΔQ = ΔQ after treatment - ΔQ at baseline
Descriptive statistics
Figure 4-9 shows the difference in ΔQ in the five tested groups. In all groups
the difference in ΔQ was positive, meaning that there was decrease in ΔQ after
treatment compared to that at baseline.
The highest reduction in ΔQ was seen in the 1450 ppm F + TM group with
mean difference of 53651.2 ± 25712.28, followed by the 1450 ppm F with mean
difference of 45447.8 ± 17787.43. The least reduction was noticed in the 0 ppm F
group with mean difference of 15124.3 ± 25091.00. The 1450 ppm F + MIplus and
the 2800 ppm F groups also show reduction in the ΔQ values with mean difference
of 45335.4 ± 22596.46 and 37226.3 ± 22747.10 respectively (Table 4-11).

102
Figure 4-9: Means of the difference in ΔQ at baseline and after treatment of all groups.
Table 4-11: Descriptive statistics for the difference in ΔQ at baseline and after
treatment for all groups.
group N Minimum Maximum Mean Median
Std.
Deviation
0ppm 24 -45843.9 65353.6 15124.3 17391.6 25091.0
1450ppm 24 20777.1 77293.1 45447.8 40542.1 17787.4
2800ppm 24 -1802.8 88930.1 37226.3 35997.3 22747.1
1450ppm+TM 24 13234.7 107616.9 53651.2 48669.3 25712.3
1450ppm+TM+
24 13391.3 94102.8 45335.4 43069.4 22596.5
15124.3
45447.8
37226.3
53651.2
45335.4
0.000
10000.000
20000.000
30000.000
40000.000
50000.000
60000.000
70000.000
80000.000
90000.000
0 ppm 1450 ppm 2800 ppm 1450 ppm +
TM
1450 ppm +
MIplus
Difference in ΔQ
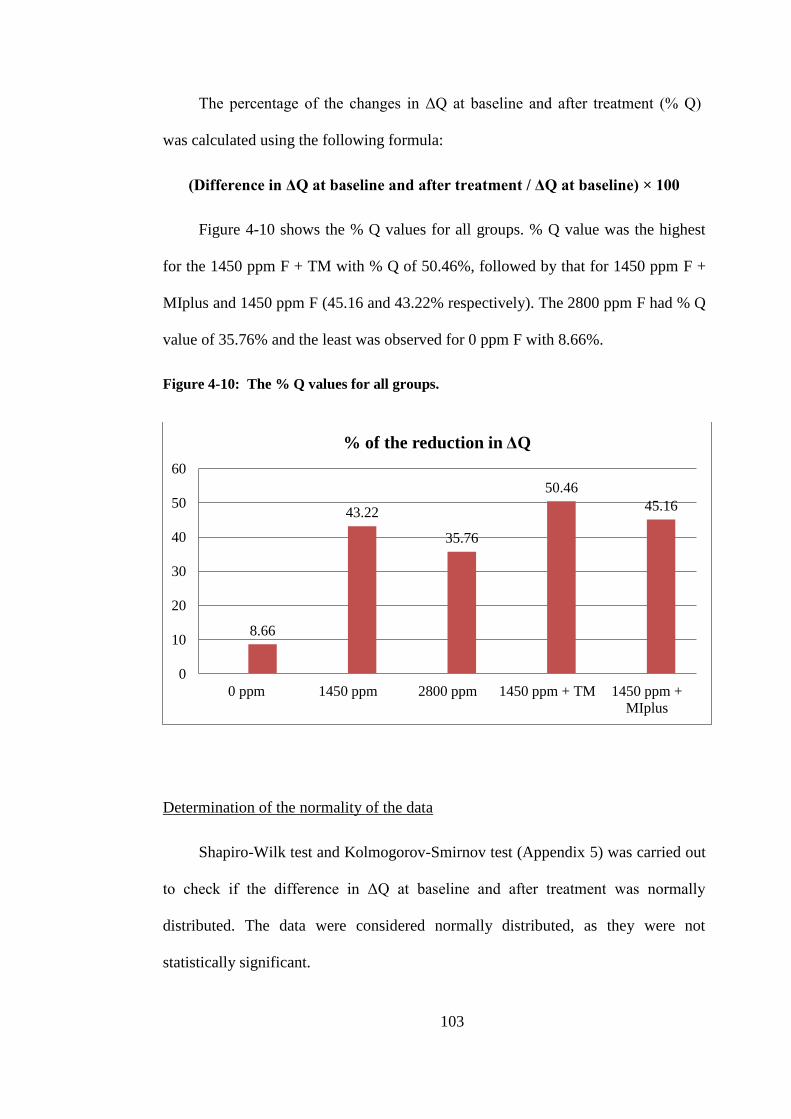
103
The percentage of the changes in ΔQ at baseline and after treatment (% Q)
was calculated using the following formula:
(Difference in ΔQ at baseline and after treatment / ΔQ at baseline) × 100
Figure 4-10 shows the % Q values for all groups. % Q value was the highest
for the 1450 ppm F + TM with % Q of 50.46%, followed by that for 1450 ppm F +
MIplus and 1450 ppm F (45.16 and 43.22% respectively). The 2800 ppm F had % Q
value of 35.76% and the least was observed for 0 ppm F with 8.66%.
Figure 4-10: The % Q values for all groups.
Determination of the normality of the data
Shapiro-Wilk test and Kolmogorov-Smirnov test (Appendix 5) was carried out
to check if the difference in ΔQ at baseline and after treatment was normally
distributed. The data were considered normally distributed, as they were not
statistically significant.
8.66
43.22
35.76
50.46
45.16
0
10
20
30
40
50
60
0 ppm 1450 ppm 2800 ppm 1450 ppm + TM 1450 ppm +
MIplus
% of the reduction in ΔQ
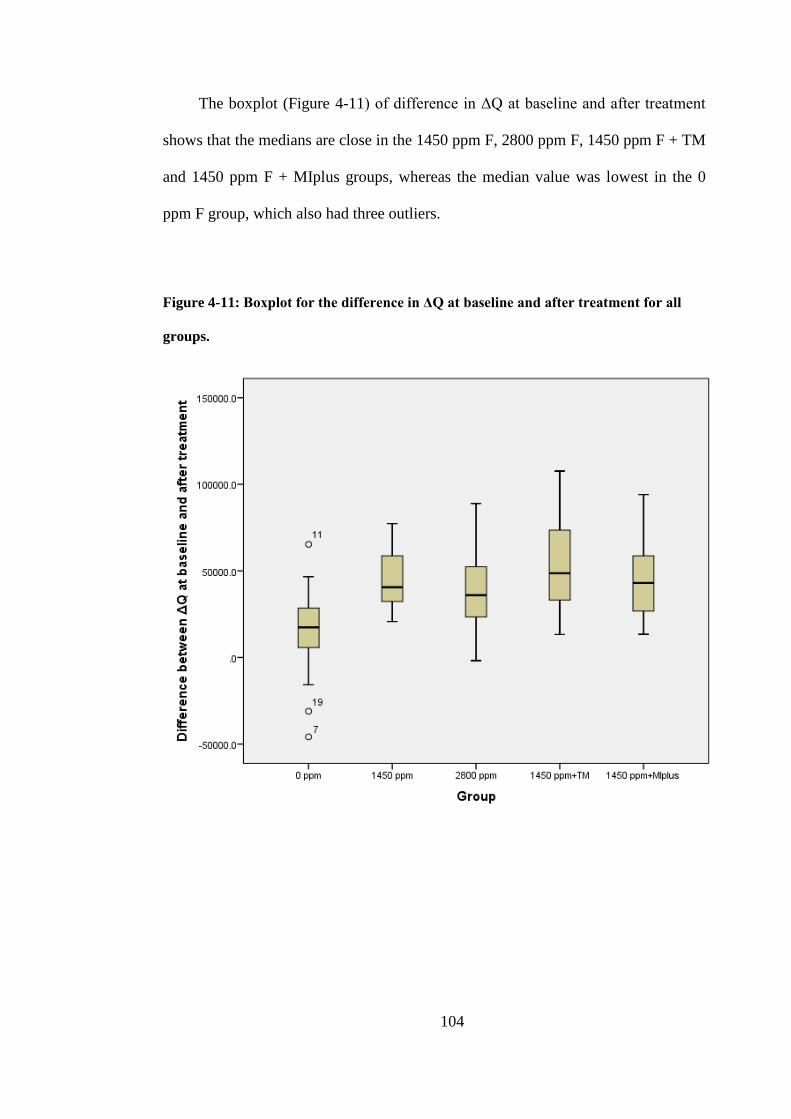
104
The boxplot (Figure 4-11) of difference in ΔQ at baseline and after treatment
shows that the medians are close in the 1450 ppm F, 2800 ppm F, 1450 ppm F + TM
and 1450 ppm F + MIplus groups, whereas the median value was lowest in the 0
ppm F group, which also had three outliers.
Figure 4-11: Boxplot for the difference in ΔQ at baseline and after treatment for all
groups.

105
One way ANOVA test (Table 4-12) was performed to assess if the difference
in ΔQ was statistically significant between the five groups. It showed that the mean
difference in ΔQ was statistically significant between the groups (p <0.001).
Table 4-12: One way ANOVA between groups for the difference in ∆Q at baseline and
after treatment.
Sum of Squares df Mean Square F Sig.
Between Groups 20854236820.3 4 5213559205.1 9.893 .000
Within Groups 60607363029.0 115 527020548.1
Total 81461599849.4 119
In order to determine which groups were statistically significant different,
pairwise comparisons were conducted using Bonferroni test. The Bonferroni tests
corrects for multiple testing. The results of the Bonferroni tests are shown in Table
4-13. It can be seen that the mean difference in ΔQ of the 0 ppm F was statistically
significant lower compared to all groups (p < 0.05).
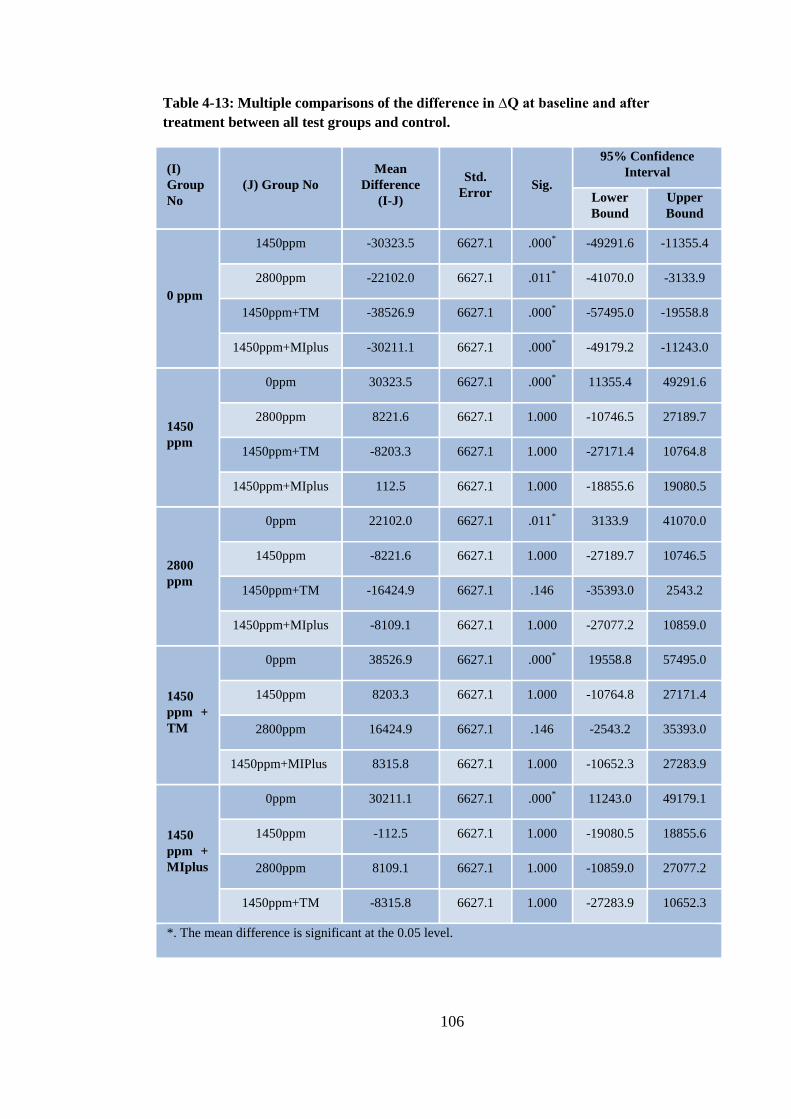
106
Table 4-13: Multiple comparisons of the difference in ∆Q at baseline and after
treatment between all test groups and control.
(I)
Group
No
(J) Group No
Mean
Difference
(I-J)
Std.
Error Sig.
95% Confidence
Interval
Lower
Bound
Upper
Bound
0 ppm
1450ppm -30323.5 6627.1 .000*
-49291.6 -11355.4
2800ppm -22102.0 6627.1 .011*
-41070.0 -3133.9
1450ppm+TM -38526.9 6627.1 .000* -57495.0 -19558.8
1450ppm+MIplus
-30211.1 6627.1 .000* -49179.2 -11243.0
1450
ppm
0ppm 30323.5 6627.1 .000* 11355.4 49291.6
2800ppm 8221.6 6627.1 1.000 -10746.5 27189.7
1450ppm+TM -8203.3 6627.1 1.000 -27171.4 10764.8
1450ppm+MIplus
112.5 6627.1 1.000 -18855.6 19080.5
2800
ppm
0ppm 22102.0 6627.1 .011* 3133.9 41070.0
1450ppm -8221.6 6627.1 1.000 -27189.7 10746.5
1450ppm+TM -16424.9 6627.1 .146 -35393.0 2543.2
1450ppm+MIplus -8109.1 6627.1 1.000 -27077.2 10859.0
1450
ppm +
TM
0ppm 38526.9 6627.1 .000* 19558.8 57495.0
1450ppm 8203.3 6627.1 1.000 -10764.8 27171.4
2800ppm 16424.9 6627.1 .146 -2543.2 35393.0
1450ppm+MIPlus 8315.8 6627.1 1.000 -10652.3 27283.9
1450
ppm +
MIplus
0ppm 30211.1 6627.1 .000* 11243.0 49179.1
1450ppm -112.5 6627.1 1.000 -19080.5 18855.6
2800ppm 8109.1 6627.1 1.000 -10859.0 27077.2
1450ppm+TM -8315.8 6627.1 1.000 -27283.9 10652.3
*. The mean difference is significant at the 0.05 level.

107
4.1.2.3 Intra-examiner reproducibility for ΔQ
The intra-examiner reproducibility was tested using the Bland-Altman plot
(Figure 4-12). 18 enamel slabs (15%) were randomly selected and re-analysed. The
mean of the differences or the bias was 599.1%px2. The 95% limits of agreement
were 6477.3, -5279.0 this variation was not considered clinically important and
therefore the intra-examiner reproducibility was considered acceptable.
The Intra-class Correlation Coefficient (Table 4-14) was found to be (0.99)
which also represent a very good reproducibility.
Figure 4-12: Bland-Altman plot for reproducibility of ΔQ measurements.

108
Table 4-14: Intra-class Correlation Coefficient for ΔQ measurements.
Intra-class
Correlation
95% Confidence
Interval F Test with True Value 0
Lower
Bound
Upper
Bound Value df1 df2 Sig
Single
Measures .985 .957 .995 129.212 15 15 .000
Average
Measures .992 .978 .997 129.212 15 15 .000
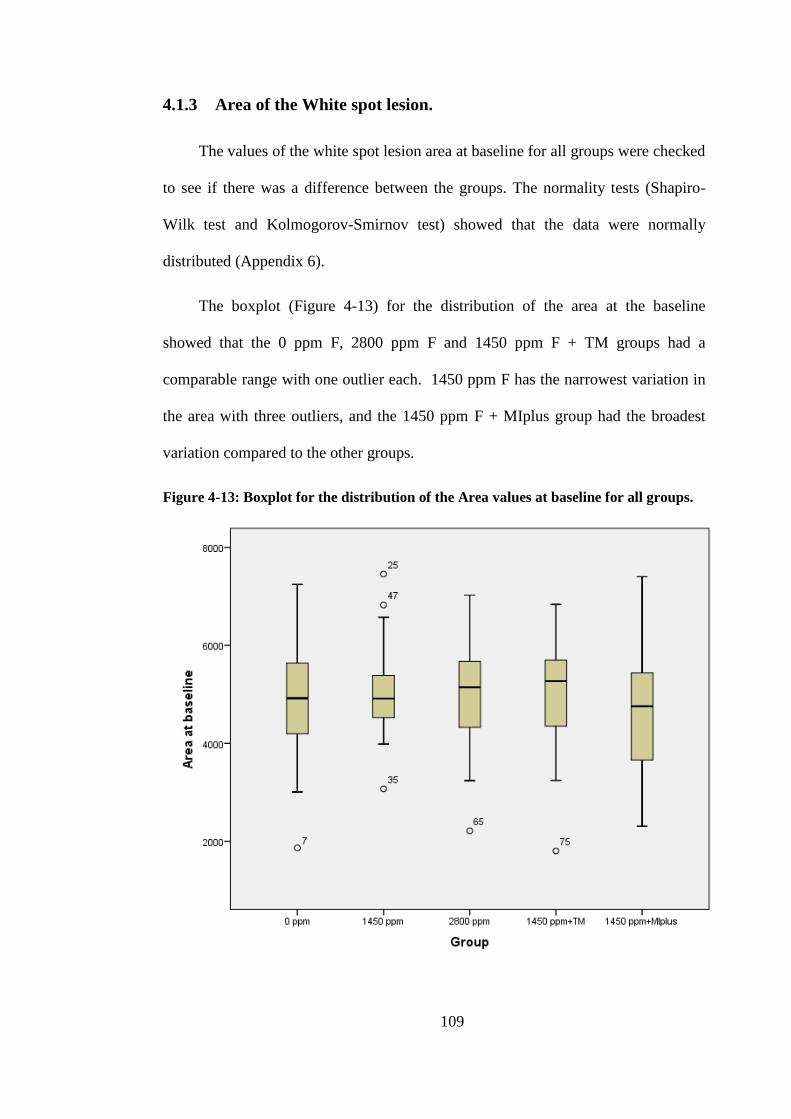
109
4.1.3 Area of the White spot lesion.
The values of the white spot lesion area at baseline for all groups were checked
to see if there was a difference between the groups. The normality tests (Shapiro-
Wilk test and Kolmogorov-Smirnov test) showed that the data were normally
distributed (Appendix 6).
The boxplot (Figure 4-13) for the distribution of the area at the baseline
showed that the 0 ppm F, 2800 ppm F and 1450 ppm F + TM groups had a
comparable range with one outlier each. 1450 ppm F has the narrowest variation in
the area with three outliers, and the 1450 ppm F + MIplus group had the broadest
variation compared to the other groups.
Figure 4-13: Boxplot for the distribution of the Area values at baseline for all groups.
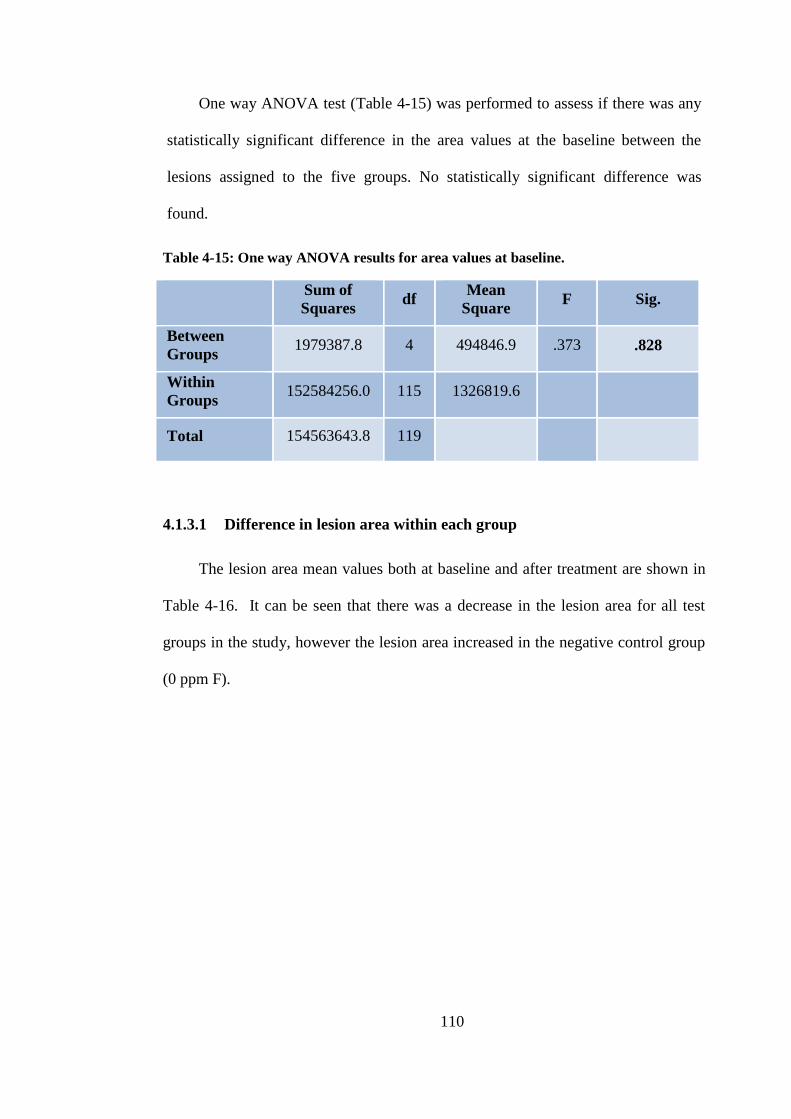
110
One way ANOVA test (Table 4-15) was performed to assess if there was any
statistically significant difference in the area values at the baseline between the
lesions assigned to the five groups. No statistically significant difference was
found.
Table 4-15: One way ANOVA results for area values at baseline.
Sum of
Squares df
Mean
Square F Sig.
Between
Groups 1979387.8 4 494846.9 .373 .828
Within
Groups 152584256.0 115 1326819.6
Total 154563643.8 119
4.1.3.1 Difference in lesion area within each group
The lesion area mean values both at baseline and after treatment are shown in
Table 4-16. It can be seen that there was a decrease in the lesion area for all test
groups in the study, however the lesion area increased in the negative control group
(0 ppm F).
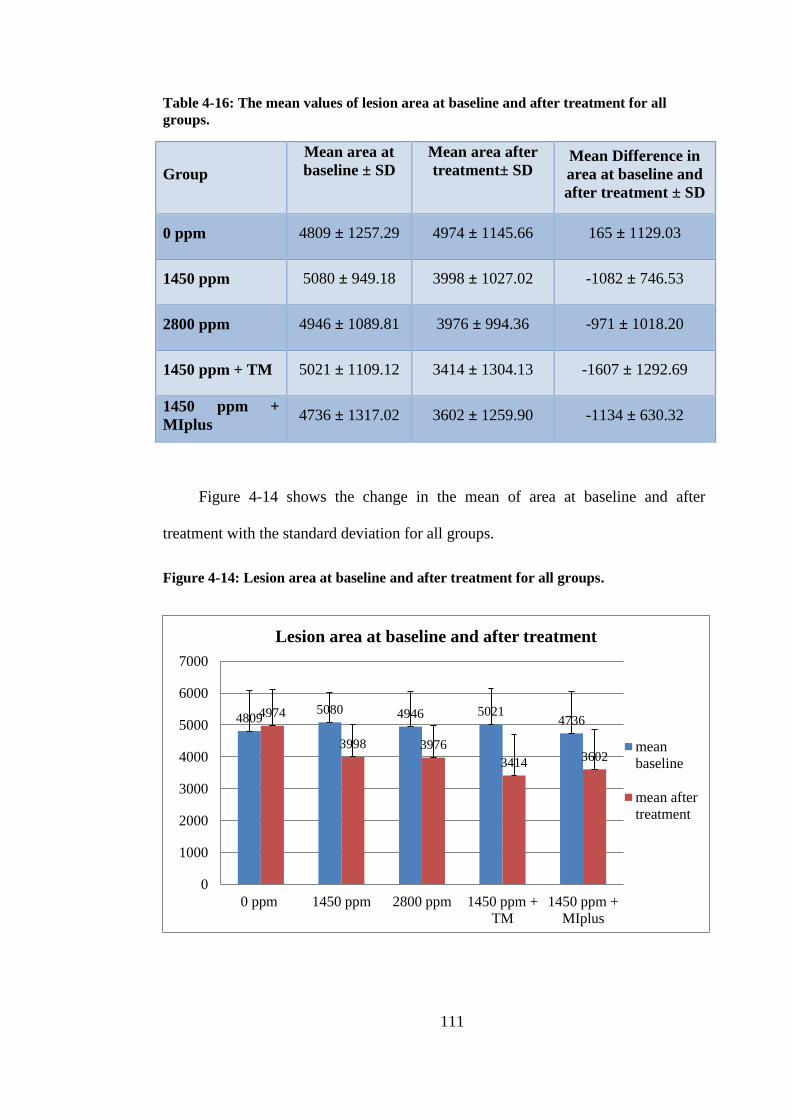
111
Table 4-16: The mean values of lesion area at baseline and after treatment for all
groups.
Group
Mean area at
baseline ± SD
Mean area after
treatment± SD
Mean Difference in
area at baseline and
after treatment ± SD
0 ppm 4809 ± 1257.29 4974 ± 1145.66 165 ± 1129.03
1450 ppm 5080 ± 949.18 3998 ± 1027.02 -1082 ± 746.53
2800 ppm 4946 ± 1089.81 3976 ± 994.36 -971 ± 1018.20
1450 ppm + TM 5021 ± 1109.12 3414 ± 1304.13 -1607 ± 1292.69
1450 ppm +
MIplus 4736 ± 1317.02 3602 ± 1259.90 -1134 ± 630.32
Figure 4-14 shows the change in the mean of area at baseline and after
treatment with the standard deviation for all groups.
Figure 4-14: Lesion area at baseline and after treatment for all groups.
4809 5080 4946 5021
4736 4974
3998 3976
3414 3602
0
1000
2000
3000
4000
5000
6000
7000
0 ppm 1450 ppm 2800 ppm 1450 ppm +
TM
1450 ppm +
MIplus
Lesion area at baseline and after treatment
mean
baseline
mean after
treatment

112
To assess whether the change in the area at baseline and after treatment was
significantly different within the same group, paired T-Test was used.
The paired T-Test results shown in Table 4-17 showed that there was a
statistically significant improvement in the lesion area values after treatment
compared with that at baseline in all groups (p <0.001), except in the 0 ppm F group.
Table 4-17: Paired sampled T test results for the lesion area values at baseline and
after treatment for all groups.
Paired Differences
Sig. (2-
tailed) Mean Std.
Deviation
Std.
Error
Mean
95% Confidence
Interval of the
Difference
Lower Upper
0 ppm
Area at
baseline
–
Area
after
treatment
-165.2 1129.0 230.5 -641.9 311.6 .481
1450
ppm 1081.7 746.5 152.3 766.5 1396.9 .000*
2800
ppm 970.8 1018.2 207.8 540.8 1400.7 .000*
1450
ppm +
TM
1607.3 1292.7 263.7 1061.4 2153.1 .000*
1450
ppm +
MIplus
1133.9 630.3 128.7 867.8 1400.1 .000*
*Statistically significant

113
4.1.3.2 Difference in lesion area between groups
The lesion area difference (change) was measured using the following
formula:
Difference in lesion area= lesion area after treatment – lesion area at baseline
Descriptive statistics
Figure 4-15 shows the difference in the lesion area for the five tested groups.
In the 1450 ppm F, 2800 ppm F, 1450 ppm F +TM and the 1450 ppm F + MIplus
groups, the difference in the lesion area was negative, meaning that there was a
decrease in the lesion area after treatment compared to that at baseline. While in the
0 ppm F group, the value was positive meaning that there was increase in the area of
the lesion after treatment.
The highest reduction in area was seen in the 1450 ppm F + TM group with
mean difference of 1607.00 ± 1292.69, followed by the 1450 ppm F + MIplus group
with mean difference of 1134.00 ± 630.32. The 1450 ppm F and the 2800 ppm F
groups also showed a reduction in the area values with mean difference of 1082.00 ±
746.53 and 971.00 ± 1018.20 respectively. An increase in the area was noticed in the
0 ppm F group with a mean difference of 165.00 ± 1129.03 (Table 4-18).
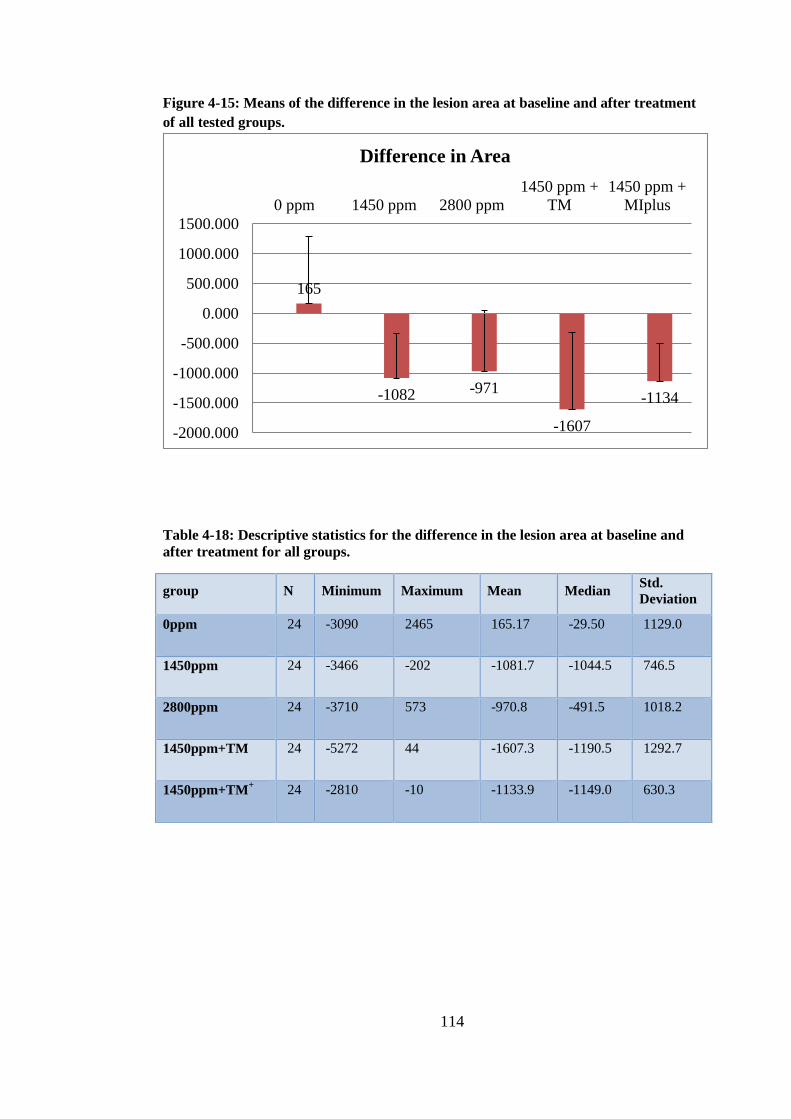
114
Figure 4-15: Means of the difference in the lesion area at baseline and after treatment
of all tested groups.
Table 4-18: Descriptive statistics for the difference in the lesion area at baseline and
after treatment for all groups.
group N Minimum Maximum Mean Median Std.
Deviation
0ppm 24 -3090 2465 165.17 -29.50 1129.0
1450ppm 24 -3466 -202 -1081.7 -1044.5 746.5
2800ppm 24 -3710 573 -970.8 -491.5 1018.2
1450ppm+TM 24 -5272 44 -1607.3 -1190.5 1292.7
1450ppm+TM+
24 -2810 -10 -1133.9 -1149.0 630.3
165
-1082 -971
-1607
-1134
-2000.000
-1500.000
-1000.000
-500.000
0.000
500.000
1000.000
1500.000
0 ppm 1450 ppm 2800 ppm
1450 ppm +
TM
1450 ppm +
MIplus
Difference in Area
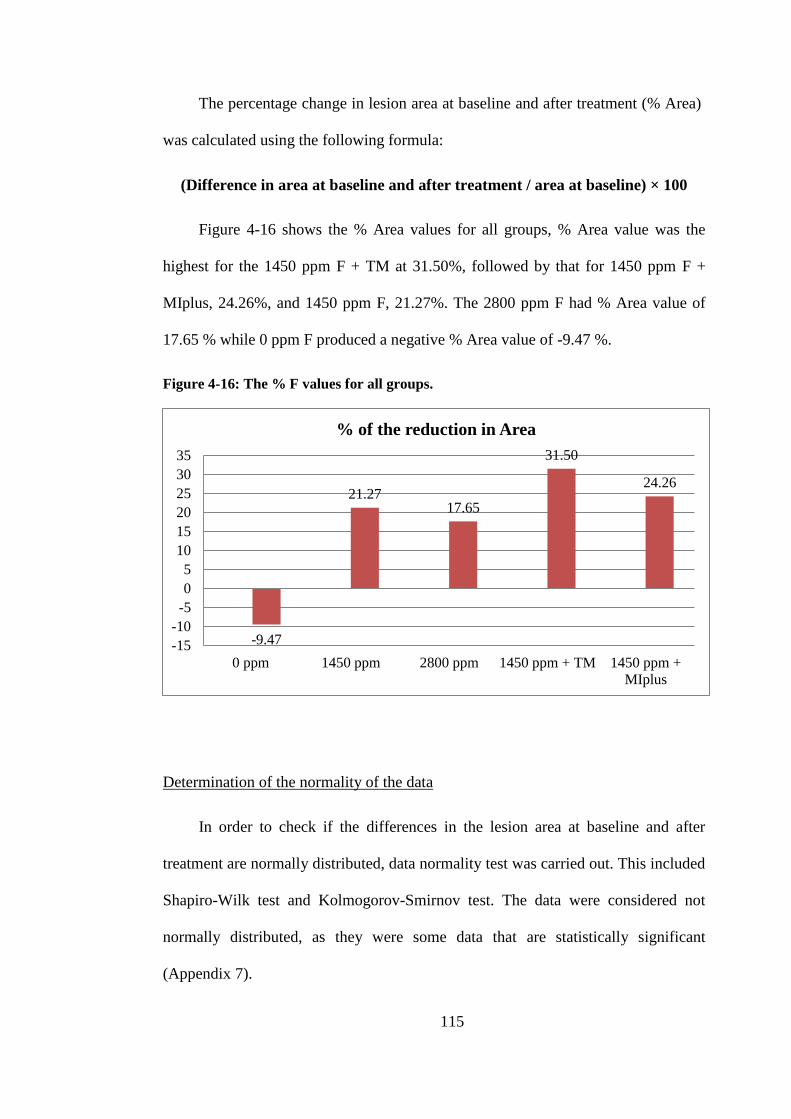
115
The percentage change in lesion area at baseline and after treatment (% Area)
was calculated using the following formula:
(Difference in area at baseline and after treatment / area at baseline) × 100
Figure 4-16 shows the % Area values for all groups, % Area value was the
highest for the 1450 ppm F + TM at 31.50%, followed by that for 1450 ppm F +
MIplus, 24.26%, and 1450 ppm F, 21.27%. The 2800 ppm F had % Area value of
17.65 % while 0 ppm F produced a negative % Area value of -9.47 %.
Figure 4-16: The % F values for all groups.
Determination of the normality of the data
In order to check if the differences in the lesion area at baseline and after
treatment are normally distributed, data normality test was carried out. This included
Shapiro-Wilk test and Kolmogorov-Smirnov test. The data were considered not
normally distributed, as they were some data that are statistically significant
(Appendix 7).
-9.47
21.27 17.65
31.50
24.26
-15
-10
-5
0
5
10
15
20
25
30
35
0 ppm 1450 ppm 2800 ppm 1450 ppm + TM 1450 ppm +
MIplus
% of the reduction in Area
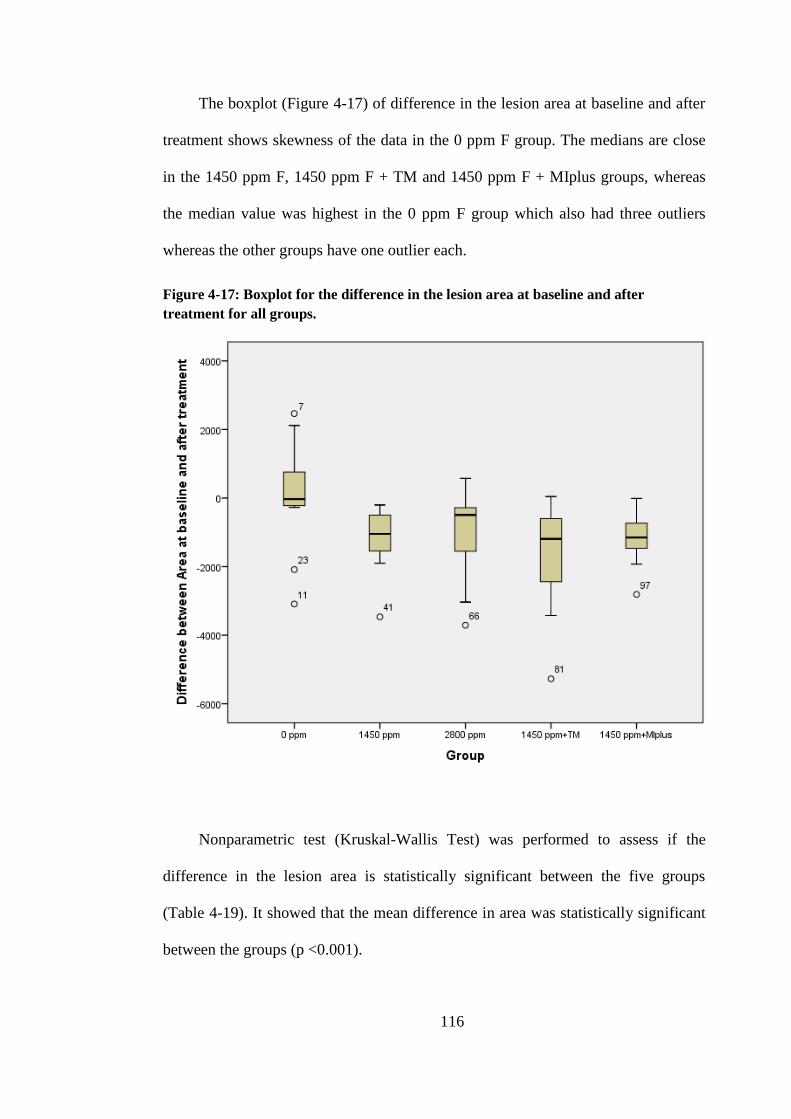
116
The boxplot (Figure 4-17) of difference in the lesion area at baseline and after
treatment shows skewness of the data in the 0 ppm F group. The medians are close
in the 1450 ppm F, 1450 ppm F + TM and 1450 ppm F + MIplus groups, whereas
the median value was highest in the 0 ppm F group which also had three outliers
whereas the other groups have one outlier each.
Figure 4-17: Boxplot for the difference in the lesion area at baseline and after
treatment for all groups.
Nonparametric test (Kruskal-Wallis Test) was performed to assess if the
difference in the lesion area is statistically significant between the five groups
(Table 4-19). It showed that the mean difference in area was statistically significant
between the groups (p <0.001).

117
Table 4-19: Kruskal-Wallis Test results for the difference in the lesion area at baseline
and after treatment.
Difference between Area at baseline and after treatment
Chi-Square 37.938
df 4
Asymp. Sig. .000
a. Kruskal Wallis Test
b. Grouping Variable: Group No
In order to determine which groups were statistically significant different, two-
independent sample test using Mann-Whitney U test was performed. The test
showed that the mean difference in the lesion area of the 0 ppm F group was
statistically significant lower compared to all groups (p < 0.001).
No other statistically significant differences were found between the other
groups (p >0.05).
4.1.3.3 Intra-examiner reproducibility for lesion area
The intra-examiner reproducibility was tested using the Bland-Altman plot
(Figure 4-18). 18 enamel slabs (15%) were randomly selected and re-analysed. The
mean of the differences or the bias was -17.78 px2. The 95% limits of agreement
were 183.7, -219.4 this variation was not considered clinically important indicating
good agreement between the readings.
The Intra-class Correlation Coefficient (Table 4-20) was found to be (0.99)
which also represent a very good reproducibility.

118
Figure 4-18: Bland-Altman plot for reproducibility of lesion area measurements.
Table 4-20: Intra-class Correlation Coefficient for lesion area measurements.
Intraclass
Correlation
95% Confidence
Interval F Test with True Value 0
Lower
Bound
Upper
Bound Value df1 df2 Sig
Single
Measures .992 .977 .997 246.267 15 15 .000
Average
Measures .996 .988 .999 246.267 15 15 .000
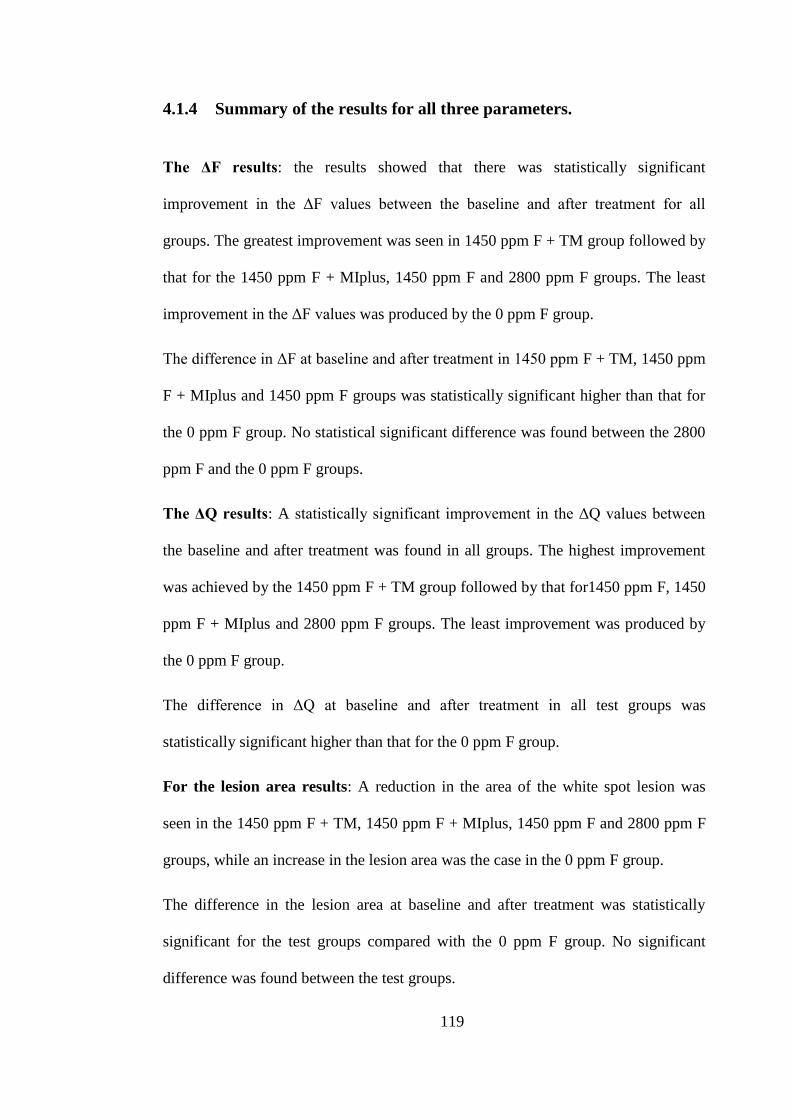
119
4.1.4 Summary of the results for all three parameters.
The ΔF results: the results showed that there was statistically significant
improvement in the ΔF values between the baseline and after treatment for all
groups. The greatest improvement was seen in 1450 ppm F + TM group followed by
that for the 1450 ppm F + MIplus, 1450 ppm F and 2800 ppm F groups. The least
improvement in the ΔF values was produced by the 0 ppm F group.
The difference in ΔF at baseline and after treatment in 1450 ppm F + TM, 1450 ppm
F + MIplus and 1450 ppm F groups was statistically significant higher than that for
the 0 ppm F group. No statistical significant difference was found between the 2800
ppm F and the 0 ppm F groups.
The ΔQ results: A statistically significant improvement in the ΔQ values between
the baseline and after treatment was found in all groups. The highest improvement
was achieved by the 1450 ppm F + TM group followed by that for1450 ppm F, 1450
ppm F + MIplus and 2800 ppm F groups. The least improvement was produced by
the 0 ppm F group.
The difference in ΔQ at baseline and after treatment in all test groups was
statistically significant higher than that for the 0 ppm F group.
For the lesion area results: A reduction in the area of the white spot lesion was
seen in the 1450 ppm F + TM, 1450 ppm F + MIplus, 1450 ppm F and 2800 ppm F
groups, while an increase in the lesion area was the case in the 0 ppm F group.
The difference in the lesion area at baseline and after treatment was statistically
significant for the test groups compared with the 0 ppm F group. No significant
difference was found between the test groups.

120
4.2 Scanning Electron Microscopy (SEM) results
In order to further investigate the results seen in the previous section,
especially in relation to the groups containing TM and MI paste plus, SEM images
are presented here for these groups after 21 days of pH cycling.
Figure 4-19: SEM image for sound enamel surface shows natural surface without
porosities.
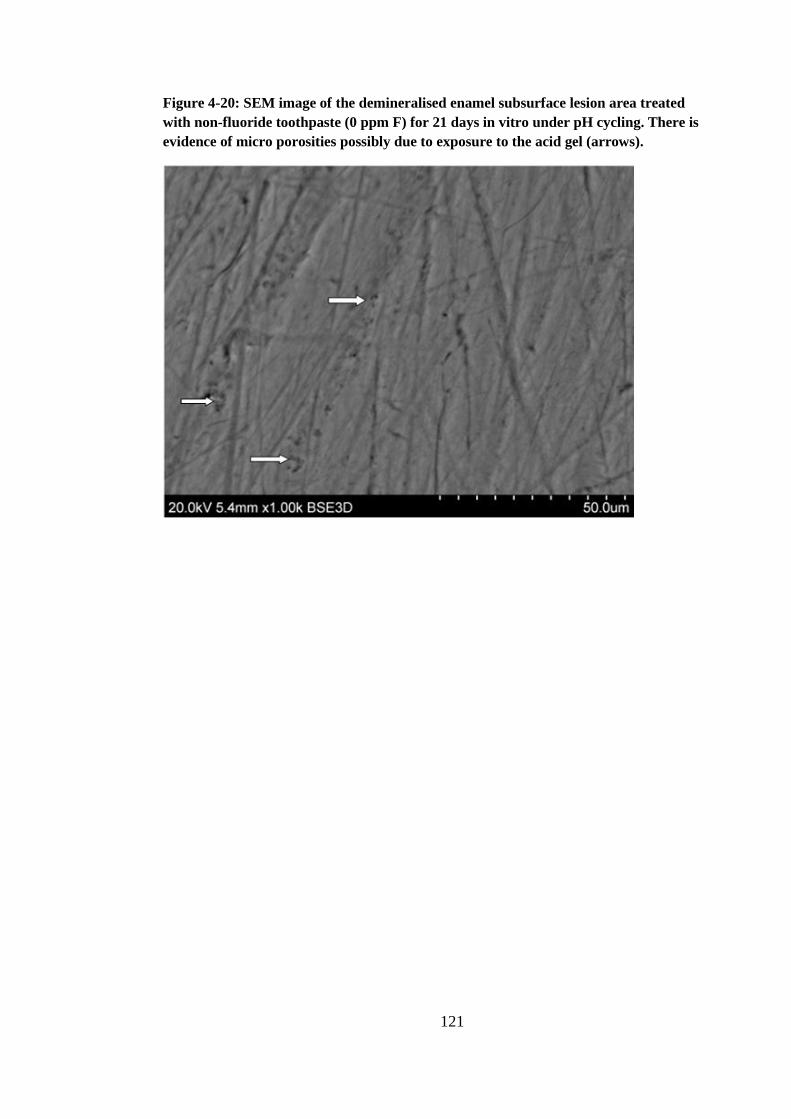
121
Figure 4-20: SEM image of the demineralised enamel subsurface lesion area treated
with non-fluoride toothpaste (0 ppm F) for 21 days in vitro under pH cycling. There is
evidence of micro porosities possibly due to exposure to the acid gel (arrows).
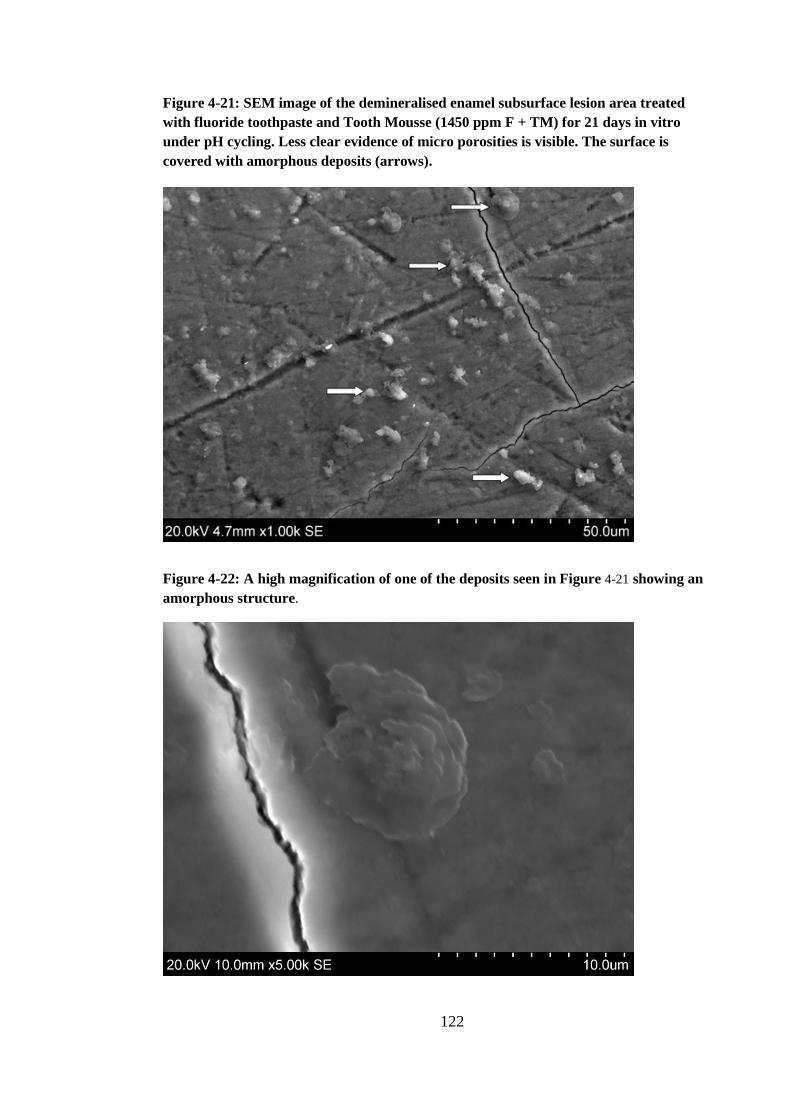
122
Figure 4-21: SEM image of the demineralised enamel subsurface lesion area treated
with fluoride toothpaste and Tooth Mousse (1450 ppm F + TM) for 21 days in vitro
under pH cycling. Less clear evidence of micro porosities is visible. The surface is
covered with amorphous deposits (arrows).
Figure 4-22: A high magnification of one of the deposits seen in Figure 4-21 showing an
amorphous structure.

123
Figure 4-23: SEM image of the demineralised enamel subsurface lesion area treated
with fluoride toothpaste and MI paste plus (1450 ppm F + MIplus) for 21 days in vitro
under pH cycling. Some deposits can be seen on the enamel surface (arrows).
Figure 4-24: A high magnification of one of the deposits seen in Figure 4-23.

124
5.0 DISCUSSION
The potential of the remineralisation of enamel lesion has been demonstrated
by Backer Dirks (1966), who noticed spontaneous disappearance of the white spot
lesions in young individuals as a result of the remineralising ability of saliva.
Subsequently, many studies were conducted to assess the effect of various
preparations of calcium, phosphate, and fluoride on enamel remineralisation.
The search of the available literature revealed many studies including in vitro,
in situ and in vivo studies that had investigated the effect of CPP-ACP, CPP-ACFP
and fluoride on enamel remineralisation. In the majority of these studies the CPP-
ACP and/or CPP-ACFP preparations were used alone and were compared with other
remineralising agents such as fluoride containing toothpaste or mouthrinses, or they
were compared with a negative control group or placebo.
There appears to be shortage of literature investigating the effect of adding the
CPP-ACP and CPP-ACPF crèmes to the regular oral hygiene practice that involves
toothbrushing with fluoridated toothpaste twice daily.
Therefore the current in vitro study aimed to investigate the additional effect of
using CPP-ACP as well as the CPP-ACFP crème as an adjunct to the regular use of
fluoridated toothpaste (1450 ppm F) on the remineralisation of enamel subsurface
lesions, and to compare this effect to those results from the solitary use of
fluoridated toothpastes (1450 ppm F or 2800 ppm F) or to the effect of non-
fluoridated toothpaste as a control.

125
5.1 In vitro model
The present study used an in vitro model to study enamel remineralisation. The
in vitro model of studying the caries process and studying the effect of different anti-
cariogenic agents on enamel demineralisation and remineralisation is widely
accepted and has been adopted in numerous studies.
The key advantage of the in vitro model is providing the ability to carry out
single variable experiments under highly controlled conditions (White, 1995). It also
allows the use of a wide range of analytical techniques for substrate analysis that
might not be accessible in the in vivo model. Other advantages include being
inexpensive and a quick approach (White, 1995).
In spite of that, significant limitations are inherited in the in vitro model; the
most particular is the inability to replicate the complex biological processes involved
in caries (White, 1995). This model also lacks many important protective
biochemical processes available in the oral environment that reverse the process of
demineralisation and promote the remineralisation including the composition of
saliva, the salivary flow rate, and salivary pellicle formation on the enamel (White,
1992, West et al., 1998).
5.2 Study design
Five groups were used in this study; in addition to the CPP-ACP and CPP-
ACPF crème groups, negative control (non-fluoride toothpaste) and positive control
(fluoride toothpaste 1450 ppm F), a high fluoride toothpaste (2800 ppm F) group
was also included in the present study. A randomised, single-blinded design was
used to prevent the introduction of bias in the study.

126
5.2.1 Bovine teeth
Preferably, human teeth should be used for the study of the caries process.
However, due to the difficulty of obtaining human teeth in large numbers; bovine
teeth were used in the current study.
Over the past years the use of bovine teeth in dental research has increased
(Yassen et al., 2011).
The characteristics of bovine teeth make it a good substitute for human teeth in
caries research. This includes the presence of a large flat surface that has no
previous exposure to caries challenges. In addition to that, bovine teeth have less
variability in composition than human teeth which results in a less variable response
to the cariogenic challenge as well as to the anti-cariogenic agents (Mellberg, 1992).
The mineral distribution in carious lesions in bovine teeth is reportedly similar
to that found in human teeth, and the structural changes are comparable in human
and bovine teeth (Edmunds et al., 1988).
On the other hand, bovine enamel was found to be softer in comparison to
human enamel, represented by the higher rate of lesion progression and lesion depth
(Amaechi et al., 1999). The bovine enamel does not have the exact structure and
chemistry of human enamel, which led some researchers to question their continued
use in dental research (Titley et al., 1988, Arends et al., 1989, Wennber and
Orstavik, 1990). However a number of in vitro studies (Brighenti et al., 2006,
Lennon et al., 2006, ten Cate et al., 2006) have successfully used the bovine enamel
in order to evaluate the effect of different anti-cariogenic agents on enhancing
enamel remineralisation and inhibiting enamel demineralisation.

127
5.2.2 Enamel slabs preparation and storage
The buccal section of the bovine teeth was used in the present study to allow
more uniform thickness of enamel as well as more flat surfaces. The enamel slabs
were stored in distilled water and 0.1% thymol (Sigma Aldrich) with the aim of
inhibition of the bacterial growth and prevention of enamel slabs dehydration. The
antimicrobial properties of thymol were proven through its ability to perforate cell
membranes, and subsequently destroy the pathogens that may be present on the teeth
(Shapiro and Guggenheim, 1995). At the same time thymol has no detrimental effect
on enamel but a few studies showed that it can affect dentine permeability (Preston
et al., 2007).
5.2.3 Artificial carious lesions
Two methods were used in previous studies in order to create artificial caries-
like lesions. They included using either buffered solutions or acidified gels. It has
been shown that the lesion produced by the acidified gels were generally shallow
and smaller in size compared with those produced by the buffered solutions, which
are characterised by being large and deep (Gray, 1966, Featherstone and Rodgers,
1981, Issa, 2004). This was attributed to the slow diffusion rate with the acidified
gels that maintain the dissolved mineral ions in close proximity to the sample
allowing their re-precipitation within the enamel surface leading to the growth of
residual mineral crystals and the formation of an intact surface layer (Clark, 2001).
In the current study the enamel subsurface lesion was created using acidified
hydroxyethyl cellulose gel as it is easy to use and produce consistent lesions with
uniformed areas of demineralisation. In addition to that, lesions produced by

128
hydroxyethyl cellulose gel were found to be more rigid when compared with the
lesions produced by acetic acid buffer (Issa, 2004).
The enamel slabs were immersed in the acidified gel for 10 days in order to
produce enamel lesion with average ∆F of approximately 20.7, which was close to
the ∆F values in a study carried out by Manton (2009).
5.2.4 pH cycling
In order to replicate the continuous process of demineralisation and
remineralisation in the oral environment, the pH cycling model has been suggested
by ten Cate and Duijsters, (1982). This model involves a process of alternating
demineralisation and remineralisation of artificial enamel lesions that aims to
simulate the carious process in the oral environment including the various
demineralisation challenges from moderate to severe (ten Cate et al., 2006). The pH
cycling model has been used widely to investigate caries-preventive agents on the
dynamics of enamel de- and remineralisation (Featherstone, 1996, ten Cate et al.,
2006).
Most of the previous studies that have used the pH cycling model have
repeated the cycle for a 14 day period (ten Cate and Duijsters, 1982, Malinowski et
al., 2007), however in the current study, a 21 day period of pH cycling was
implemented in order to allow sufficient time to produce changes in the pre-
demineralised enamel slabs. The pH cycling regime involved exposing the enamel
slabs to 5 demineralisation challenges during the day. Acetic acid buffer (ten Cate et
al., 2006) at pH 4.8 was used and was applied for 5 minutes. This demineralisation
challenge represents the acid in the cariogenic challenge.

129
Both day time and night time artificial saliva were used in this study. The day
time saliva was supersaturated with calcium and phosphate in order to allow
remineralisation of enamel slabs during the day and it was used in between the
demineralisation challenges for 60 minutes. On the other hand, the night time saliva
was a saturated solution and it was used overnight to maintain the enamel condition
without providing any mineral exchanges.
The pH cycling protocol used for the current study was developed at the
University of Leeds and it has been used in a previous caries study (Al-Mullahi and
Toumba, 2010) at the Leeds Dental Institute-Paediatric Dentistry Department.
5.2.5 Experiment materials
The toothpastes used in the current study included non-fluoride toothpaste
which was used as negative control in order to assess the remineralisation results
from the artificial saliva.
The other toothpastes used included the 1450 ppm F which is the most
common fluoride concentration in adult toothpaste preparations in the United
Kingdom, and the 2800 ppm F toothpaste which usually is prescribed for high
caries-risk individuals.
The application of Tooth Mousse or MI Paste Plus was done in the form of
slurries as was used in previous studies (Reynolds et al., 2008, Al-Mullahi and
Toumba, 2010). The application of the slurries to the enamel slabs was carried out
after the exposure to the fluoride toothpaste, with no rinsing afterwards and was
done in accordance with the manufacturer’s instructions.
130
5.3 Quantitative Light-Induced Fluorescence (QLF)
In the present study, QLF was used to assess the enamel demineralisation and
remineralisation at baseline and following the treatment. This technique has been
used for the detection and quantitative analysis of early caries as a strong correlation
was found between the mineral loss and fluorescence loss in enamel after
demineralisation. The advantage of this technique is being non-destructive which
allows the longitudinal monitoring of early carious lesions.
QLF was validated by comparison with transverse microradiography (Al-
Khateeb et al., 1997) and a good correlation coefficient (r = 0.84) was found
between fluorescence changes and mineral loss.
The intra-examiner and inter-examiner repeatability of QLF has been assessed
in different studies. Pretty et al. (2002b), reported high reproducibility of QLF for
the in vitro caries lesions. The intra-class correlation coefficients (ICCs) for intra-
examiner reliability was (0.93) and for the inter-examiner reliability (0.96). In this
study the assessment of the intra and inter-examiner repeatability was limited to the
analysis stage of the QLF technique.
Excellent repeatability and reproducibility of the QLF method was reported in
vivo for both the image capture and analysis stages (Tranæus et al., 2002). The inter-
examiner reliability showed ICCs between 0.95 and 0.98 for the image capturing
stage. A close ICCs was found for the analytical stage with intra-examiner reliability
between 0.93 and 0.99 and inter-examiner reliability between 0.95 and 0.99.
In the present study the intra-class correlation coefficients (ICCs) for inter-
examiner reliability for the image analysis was found to be (0.99) which represent a
very good reproducibility.
131
Many confounders were found to influence the QLF imaging, therefore it was
important to standardise the techniques while carrying out the present study. The
image capture was carried out under controlled conditions at baseline and after the
end of the experiment. All images were captured in a dark room in order to control
the ambient light effect. To control the extent of hydration of the lesions, all the
slabs were dried for 15 seconds with compressed air prior to imaging.
The enamel and dentine thickness were found to influence the fluorescence,
however; this confounding factor could not be absolutely standardised in the present
study. Since only profound differences in the total thickness of the dental tissue was
found to influence the caries assessment with the QLF (Ando et al., 2003), the
impact of this factor is believed to be minimal on the results of the current study.
The analysis of the QLF images is highly subjective as it is based on the
investigator assessment of sound or demineralised enamel. In order to minimise the
potential for operator bias, the study investigator had received training from the
manufacturer and was familiar with the QLF software before the study.
5.4 Results of Quantitative Light-Induced Fluorescence (QLF)
As mentioned before, QLF produces three parameters that include; the ΔF
which represents the percentage fluorescence loss and related to lesion depth, the
surface area of the lesion as well as ΔQ which is the ΔF times the area and represent
the lesion volume. All these values were calculated in this study; however, the ΔQ
value was considered as the main indicator for the mineral loss and the lesion
progression or regression in the present study. Since it was indicated that the lesion
area may increases or decreases while the ΔF value maintained the same or
132
alternatively the lesion area may be maintained despite the increase or decrease in
ΔF value (Ando et al., 2004). For this reason the independent evaluation for these
two values may not give a good evaluation of the lesions progression or regression.
5.4.1 Effect of fluoridated toothpaste in remineralising enamel
subsurface lesions
The current study assessed the effect of fluoridated toothpastes on
remineralising enamel subsurface lesions. Two fluoride concentrations were
assessed; the 1450 ppm F (0.32% w/w sodium fluoride), and the 2800 ppm F (0.619
w/w sodium fluoride), along with non-fluoridated toothpaste as a negative control.
The study results showed that all these groups produced remineralisation of the
enamel subsurface lesions. The highest remineralisation was achieved using the
1450 ppm F toothpaste followed by that produced by 2800 ppm F toothpaste and the
least remineralisation was produced in the negative control group, 0 ppm F
toothpaste. A statistical significance difference was found between both fluoride
groups and the negative control when the ∆Q and lesion area values were compared;
however, the comparison of the ΔF values between the groups showed a significant
difference between the 1450 ppm F and the 0 ppm F groups, and no significant
difference between 2800 ppm F and 0 ppm F was found. In addition, no statistical
significance difference was found between the 1450 ppm F and the 2800 ppm F in
any of the three parameters.
Overall, in the present study it was noted that the higher fluoride concentration
of 2800 ppm toothpaste did not follow the expected dose response curve. However,
when ΔQ was used as a outcome measure, a significant difference was observed

133
between 0 ppm F and 2800 ppm F, but this was not evident for ΔF. A possible
explanation for this anomaly is that ΔQ reflects the total demineralisation which also
takes into account the area of the lesion and the depth. ΔF is an average measure of
fluorescence loss which is a reflection of the average demineralisation in the
measured lesion. With 2800 ppm F, although the area of the lesion seems to have
reduced in size (improved ΔQ), the average mineral loss and depth of the lesion
across the remaining lesion did not significantly improve with 2800 ppm F
compared to the 0 ppm F control.
This was an interesting result, given that it has been shown in a randomised,
double-blind clinical trial (Biesbrock et al., 2001) that 2800 ppm F dentifrice
reduced caries experience by 20.4%, which was 85% greater reduction than that
produced by the 1700 ppm F, and statistically significant comparable to the 1100
ppm F. This clinical study had clearly shown a dose response. A dose response
effect of different fluoride levels in toothpastes was also shown in Cochrane review
by Walsh et al. (2010).
It would be interesting to speculate why in our model this dose response was
not observed for remineralisation of subsurface caries-like lesions. A possible
explanation could be that an exceedingly high F concentration in toothpaste slurry
produced a surface mineral rich layer which in turn compromised the
remineralisation of the body of the lesion. Some evidence to support this hypothesis
can be found in the literature. The remineralisation of white spots lesion by fluoride
was investigated in previous studies, ten Cate et al. (1981), showed that the topical
applications of high-concentration fluoride solution resulted in a higher initial, but
lower subsequent, rates of mineral deposition. A higher mineral deposit in the body
of the lesion was also reported when no fluoride was added to the remineralising
134
solution compared with that of 2 ppm F (Lammers et al., 1990). Although the
fluoride effect in promoting remineralisation is well established, longitudinal
epidemiological studies showed that fluoride might inhibit complete lesion
remineralisation (Dirks, 1966, Pot and Groeneveld, 1976). It was found that the
remineralisation process of surface softened enamel was completely different from
that for the remineralisation of subsurface lesions from a kinetic point of view (ten
Cate and Arends, 1978). The surface softened lesion was found to remineralise
faster and more completely than the subsurface lesion (Gelhard, 1982).
Ogaard et al. (1988), found that the application of fluoride on established
carious lesions underneath orthodontic appliances may arrest the lesions, however
the complete repair of the lesions might be inhibited due to the formation of
fluorapatite in the surface area. The deposition of fluorapatite in the surface layer
can result in the blockage of the surface pores and subsequently restrict the diffusion
into the lesions. The resulting surface would probably be much more caries-resistant
compared to the original enamel, but it still retained a demineralised appearance (ten
Cate and Duijsters, 1982).
On the other hand, the 2800 ppm F toothpaste was shown to produce more
remineralisation (89%) compared with that of 1100 ppm F toothpaste (Reynolds et
al., 2008). The microradiography analysis revealed that the fluoride toothpaste
tended to promote remineralisation predominantly in the surface layer. However, an
in situ model was used in this study making the direct comparison with our study
difficult.
135
5.4.2 Effect of CPP-ACP and CPP-ACFP on remineralising enamel
subsurface lesions
In the present study the effect of both CPP-ACP (Tooth Mousse) and CPP-
ACFP (MI Paste Plus) on the remineralisation of enamel subsurface lesions were
assessed. Both materials were used as one application after the use of fluoridated
toothpaste (1450 ppm F).
The results showed that in all QLF parameters (ΔF, ΔQ and lesion area) the
1450 ppm + TM and 1450 ppm + MIplus groups produced remineralisation of the
enamel subsurface lesion which was statistically significant compared with the
baseline as well as in comparison to the remineralisation produced in the negative
control group (0 ppm F). This remineralisation was also found to be higher in
comparison with that produced by the 1450 ppm F and 2800 ppm F groups;
however, this difference failed to reach a significant level. This might be attributed
to the in vitro model used in the present study, which might not be sensitive enough
to express these differences. As in the current model both CPP-ACP and ACP-
ACFP were used directly after the use of the 1450 ppm F toothpaste, the use of F
toothpaste might cause a blockage of the surface pores of the lesion by the formation
of the fluorapatite in the surface layer which in turn can prevent the diffusion of the
calcium and phosphate ions from the CPP-ACP into the body of the lesion to
promote remineralisation as discussed earlier (section 1.3.1).
The release of calcium, phosphate and fluoride ions from the CPP complex in
dental plaque intra-orally is believed to be promoted by low plaque pH (Cochrane et
al., 2010). In their in vitro study Cochrane et al. (2008), reported an increase in the
remineralisation by a 2% CPP-ACP solution from 15.0 ± 3.5% to 41.8 ± 8.5% when
136
the solution pH dropped from 7.0 to 5.5, and that the remineralisation was incresed
to 57.7 ± 8.4 at pH 5.5 when fluoride was incorporated into the CPP-ACP. This
might explain why in our in vitro model the remineralisation produced by the CPP-
ACP and CPP-ACFP solutions increased, however it did not reach significance as
the measured pH value for these solutions in our study were 7.0.
The positive effect of CPP-ACP (Tooth Mousse) and CPP-ACFP (MI Paste
Plus) in the remineralisation of enamel lesions has been shown in previous in vitro
studies (Kumar et al., 2008, Jayarajan et al., 2011, Zhang et al., 2011). However,
different methodologies were used in these studies compared to the current study.
In Jayarajan et al. (2011), and Zhang et al. (2011), studies the CPP-ACP/CPP-
ACFP crème were used alone, and showed a significant difference in enamel
remineralisation when compared with fluoride or a negative control. Whereas in the
present study, the CPP-ACP and CPP-ACFP crèmes were used as an adjunct to the
fluoride treatment with 1450 ppm F. In their study, Kumar, et al. (2008), revealed an
additive effect for the application of the CPP-ACP crème after the fluoride
toothpaste treatment, which is consistent with the results of the current study,
however it was not reported whether this additional effect was statistical
significance or not.
The CPP-ACP was shown to promote the remineralisation of enamel
subsurface lesions in situ models, This resulted from the localisation of the CPP-
ACP in the plaque matrix resulting in a significant increase of the calcium and
phosphate ions in supragingival plaque (Reynolds et al., 2003) as well as its
bounding to the surface of bacterial cells producing a reservoir of bio-available
calcium ions (Rose, 2000, Reynolds et al., 2003).
137
Reynolds et al. (2008), used the in situ model to assess the remineralisation
effect of 2% CPP-ACP dentifrice. This study showed that the remineralisation
produced by the 2% CPP-ACP dentifrice was better than a single use of 1100 ppm F
containing dentifrice, as well as similar to that produced by the 2800 ppm F. The
highest remineralisation among all groups was that produced by dentifrice with 2%
CPP-ACP plus 1100 ppm F.
The additive effect of the CPP-ACP and fluoride was reported to be resulted
from the interaction between the CPP-ACP with fluoride ions to produce ACFP
(Cross et al., 2004, Reynolds et al., 2008) which in turn promote the localisation of
the fluoride ion at the tooth surface. The presence of fluoride ions along with the
calcium and phosphate ions in plaque increases the level of fluorapatite saturation;
consequently promote the remineralisation of enamel with fluorapatite during an
acid challenge.
Unexpectedly, in the present study, the CPP-ACP group produced more
remineralisation than the CPP-ACFP group. However, this difference was not found
to be statistically significant. The reason of such finding may be again caused by the
use of higher fluoride concentration in the CPP-ACFP group which might results in
the formation of the surface hypomineralised layer that inhibit the diffusion of
calcium and phosphate into the body of the lesion, bearing in mind that the use of
the CPP-ACFP as well as the CPP-ACP crèmes were done after the application of
the 1450 ppm F twice daily which in turn can be responsible for the formation of the
surface mineral rich zone.
Another explanation for this finding is the formation of calcium fluoride
precipitate (crystals) when the fluoride ions are present along with calcium ions
from CPP-ACP resulting in less fluoride and calcium ions available to diffuse down
138
the body of the lesion to promote remineralisation. This is particularly significant
when using in vitro models that is lacking in natural salivary proteins especially the
calcium stabilising proline-rich protein and statherin.
The additive effect of CPP-ACP to the normal oral hygiene practice using
fluoride toothpaste on the remineralisation of the white spot lesions was shown in a
number of randomised control trials, Bailey et al. (2009), reported (31%) more
remineralisation of the white spot lesions in the Tooth Mousse group compared with
the placebo cream. However the application of the cream was done morning and
night after normal oral hygiene procedures using fluoridated dentifrice (1000 ppm F
as NaF) for 12 weeks. Akin and Basciftci, (2012) also reported a high success rate
using CPP-ACP Tooth Mousse in treating white spot lesions which was statistically
significant than that produces with the control group or that for 0.025% sodium
fluoride mouthrinse.
On the other hand Beerens et al. (2010), and Bröchner et al. (2011), failed to
show the additive clinical benefits of CPP-ACFP and CPP-ACP in the
remineralisation of white spot lesions when compared to the normal oral hygiene
practice with fluoride toothpaste. However, the application of the CPP-ACP/CPP-
ACFP crèmes in these two trials were done once a day and for study period of 4
weeks in Bröchner et al. (2011) study, compared with that for Bailey et al. (2009),
where the application was done twice daily for 12 weeks period.
Although comparing the result of the in vitro study with that of an in vivo
study might not be valid, the same trend was noticed between the current study and
that for the Beerens et al. (2010), and Bröchner et al. (2011), as the CPP-ACP/CPP-
ACFP was applied once a day, and did not result in a significant improvement in the

139
white spot lesions compared with that resulted from the solitary use of 1450 ppm F
toothpaste.
5.5 Scanning Electron Microscopy (SEM)
The scanning electron microscope produces highly magnified images through
the interaction between the electron beams with the specimen surface. SEM analysis
can provide useful information about structural changes of the tooth surfaces that
take place during the study. SEM imaging has been used extensively to study the
enamel and dentine surfaces, this includes studies of different types of tooth surface
loss as well as the studies of dentine hypersensitivity and different agents used for its
managements.
In the current study SEM imaging was used to assess the changes of the
enamel surface after various remineralising treatments. Although SEM is usually
used in the erosion studies to qualitatively assess the changes of eroded enamel and
the extent of tooth wear, in the current study the enamel surface was not subjected to
erosive challenge, rather, the demineralisation challenges that had been used
produced enamel subsurface lesions. This was confirmed in the SEM results as the
enamel surfaces that were subjected to the demineralisation challenge remained
intact and minimal surface loss has been noticed comparable with sound enamel.
5.5.1 Results of Scanning Electron Microscopy (SEM)
The SEM images revealed amorphous deposits on the enamel surface of both
the CPP-ACP and the CPP-ACPF groups, while no deposits were seen in the enamel
surface of the other groups.
140
The presence of calcified (amorphous) deposits on the enamel surface treated
with the CPP-ACP was reported in previous studies (Ferrazzano et al., 2011,
Jayarajan et al., 2011) using SEM. In the in vivo study conducted by Ferrazzano et
al. (2011), reduction in the surface alteration with the presence of a diffuse and
homogeneous mineral coating was found only in the demineralised enamel
specimens treated with CPP-ACP Tooth Mousse.
In summary, in the present in vitro study, five groups were assessed for their
effect on the remineralisation of enamel subsurface lesions including 0 ppm F, 1450
ppm F, 2800 ppm F, 1450 ppm F + TM and 1450 ppm F + MIplus. The
remineralisation of the enamel subsurface lesions was observed in all groups.
However, significantly more remineralisation was noticed in all test groups
compared with the negative control group (0 ppm F). The 1450 ppm + TM and the
1450 ppm F + MIplus groups showed increased remineralisation of enamel
subsurface lesions compared to the fluoride toothpaste alone, however, this
difference did not reach a statistical significant level.
141
5.6 Suggestions for Future Research
The results of the current in vitro study showed that there were no significant
benefits of CPP-ACP and CPP-ACPF crème on remineralising enamel subsurface
lesions when they were used supplementary to the use of fluoride toothpaste (1450
ppm F) twice daily compared to the use of the fluoride toothpaste alone over a
period of 21 days.
In this study both CPP-ACP and CPP-ACPF crème were used immediately
after the application of the fluoride toothpaste. Therefore further research is needed
to investigate the effect of both crèmes when they are used at different times than
that used in the present study. For example, using Tooth Mousse in the middle of the
pH cycling regime in case of in vitro studies and at different occasion to that of the
toothbrushing with fluoride toothpaste in studies which are carried out in situ or in
vivo.
The CPP-ACP and CPP-ACPF crème in the present study was applied in a
form of slurries. It would be interesting to investigate whether or not there would be
any difference in the results if a different method of application was used such as
dentifrices or as a topical application.
Due the limitation of the in vitro study, future in situ and in vivo studies
comparing the reminerlising agents and regimens assessed in the current study
would give results that would be more directly related to the clinical use of these
materials.
142
5.7 Null hypothesis
The null hypothesis “There is no difference in the enamel remineralisation that
results from Tooth Mousse, MI Paste Plus, 1450 ppm F toothpaste, 2800 ppm F
toothpaste and non-fluoridated toothpaste” can be rejected as a significant
differences were found in the enamel remineralisation between the test groups and
the negative control group (non-fluoridated toothpaste).

143
6.0 CONCLUSION
From the results of this in vitro study it can be concluded that:
1- A statistically significant remineralisation of enamel subsurface lesions in
comparison with the baseline was found in all groups.
2- When remineralisation of the enamel subsurface lesions was compared
between the groups, a statistically significant difference was achieved for all
test groups compared with the 0 ppm F toothpaste control.
3- Both Tooth Mousse and MI Paste Plus were used in conjunction with 1450
ppm F and showed some increased efficacy in the remineralisation of enamel
subsurface lesions, however this did not reach a significant level in our in
vitro model.

144
7.0 REFERENCES
ADEYEMI, A., JARAD, F., PENDER, N. & HIGHAM, S. 2006. Comparison of
quantitative light-induced fluorescence (QLF) and digital imaging applied for the
detection and quantification of staining and stain removal on teeth. Journal of dentistry,
34, 460-466.
AIMUTIS, W. R. 2004. Bioactive properties of milk proteins with particular focus on
anticariogenesis. The Journal of nutrition, 134, 989S-995S.
AKIN, M. & BASCIFTCI, F. A. 2012. Can white spot lesions be treated effectively?
The Angle Orthodontist, 82, 770-775.
AL-KHATEEB, S., TEN CATE, J., ANGMAR-MÅNSSON, B., DE JONG, E. D. J.,
SUNDSTRÖM, G., EXTERKATE, R. & OLIVEBY, A. 1997. Quantification of
formation and remineralization of artificial enamel lesions with a new portable
fluorescence device. Advances in Dental Research, 11, 502-506.
AL-MULLAHI, A. & TOUMBA, K. 2010. Effect of slow-release fluoride devices and
casein phosphopeptide/amorphous calcium phosphate nanocomplexes on enamel
remineralization in vitro. Caries research, 44, 364-371.
AMAECHI, B., HIGHAM, S. & EDGAR, W. 1999. Factors influencing the
development of dental erosion in vitro: enamel type, temperature and exposure time.
Journal of oral rehabilitation, 26, 624-630.
ANDERSSON, A., SKOLD-LARSSON, K., HALLGREN, A., PETERSSON, L. G. &
TWETMAN, S. 2007. Effect of a dental cream containing amorphous calcium
phosphate complexes on white spot lesion regression assessed by laser fluorescence.
Oral Health and Preventive Dentistry, 5, 229.
ANDO, M., HALL, A., ECKERT, G., SCHEMEHORN, B., ANALOUI, M. &
STOOKEY, G. 1997. Relative ability of laser fluorescence techniques to quantitate
early mineral loss in vitro. Caries Research, 31, 125-131.

145
ANDO, M., SCHEMEHORN, B., ECKERT, G., ZERO, D. & STOOKEY, G. 2003.
Influence of enamel thickness on quantification of mineral loss in enamel using laser-
induced fluorescence. Caries research, 37, 24-28.
ANDO, M., ECKERT, G. J., STOOKEY, G. K. & ZERO, D. T. 2004. Effect of imaging
geometry on evaluating natural white-spot lesions using quantitative light-induced
fluorescence. Caries research, 38, 39-44.
ANGMAR-MANSSON, B. & BOSCH, J. T. 2001. Quantitative light-induced
fluorescence (QLF): a method for assessment of incipient caries lesions.
Dentomaxillofacial Radiology, 30, 298-307.
AOBA, T. 2004. Solubility properties of human tooth mineral and pathogenesis of
dental caries. Oral diseases, 10, 249-257.
ARDU S, CASTIONI NV, BENBACHIR N & I, K. 2007. Minimally invasive treatment
of white spot enamel lesions. Quintessence International, 38, 633-636.
ARENDS, J. & DAVIDSON, C. 1975. HPO42−
content in enamel and artificial carious
lesions. Calcified Tissue Research, 18, 65-79.
ARENDS, J. & TEN BOSCH, J. 1992. Demineralization and remineralization
evaluation techniques. Journal of dental research, 71, 924-928.
ARENDS, J., CHRISTOFFERSEN, J., RUBEN, J. & JONGEBLOED, W. 1989.
Remineralization of bovine dentine in vitro. Caries research, 23, 309-314.
ATTIN, T. & HELLWIG, E. 1995. Salivary fluoride content after toothbrushing with a
sodium fluoride and an amine fluoride dentifrice followed by different mouthrinsing
procedures. The Journal of clinical dentistry, 7, 6-8.
AZARPAZHOOH, A. & LIMEBACK, H. 2008. Clinical efficacy of casein derivatives.
Journal of American Dental Association, 139, 915-24.
146
BAILEY, D., ADAMS, G., TSAO, C., HYSLOP, A., ESCOBAR, K., MANTON, D.,
REYNOLDS, E. & MORGAN, M. 2009. Regression of post-orthodontic lesions by a
remineralizing cream. Journal of dental research, 88, 1148-1153.
BÁNÓCZY, J., PETERSEN, P. E. & RUGG-GUNN, A. 2009. Milk fluoridation for the
prevention of dental caries, World Health Organization.
BARTLETT, D. 1997. The causes of dental erosion. Oral diseases, 3, 209-211.
BEERENS, M., VAN DER VEEN, M., VAN BEEK, H. & TEN CATE, J. 2010. Effects
of casein phosphopeptide amorphous calcium fluoride phosphate paste on white spot
lesions and dental plaque after orthodontic treatment: a 3‐month follow‐up. European
journal of oral sciences, 118, 610-617.
BENEDICT, H. 1928. A note on the fluorescence of teeth in ultra-violet rays. Science,
67, 442-442.
BENEDICT, H. 1929. The fluorescence of teeth as another method of attack on the
problem of dental caries. Journal of Dental Research, 9, 274-5.
BIESBROCK, A. R., GERLACH, R. W., BOLLMER, B. W., FALLER, R. V.,
JACOBS, S. A. & BARTIZEK, R. D. 2001. Relative anti‐caries efficacy of 1100, 1700,
2200, and 2800 ppm fluoride ion in a sodium fluoride dentifrice over 1 year. Community
dentistry and oral epidemiology, 29, 382-389.
BIESBROCK, A., BARTIZEK, R., GERLACH, R., JACOBS, S. & ARCHILA, L.
2003. Effect of three concentrations of sodium fluoride dentifrices on clinical caries.
American journal of dentistry, 16, 99-104.
BIRKHED, D., IMFELD, T. & EDWARDSSON, S. 1993. pH changes in human dental
plaque from lactose and milk before and after adaptation. Caries research, 27, 43-50.
BISHARA, S. E. & OSTBY, A. W. 2008. White spot lesions: formation, prevention,
and treatment. Seminars in Orthodontics. Elsevier, 174-182.
147
BOOTH, J., MITROPOULOS, C. & WORTHINGTON, H. 1992. A comparison
between the dental health of 3-year-old children living in fluoridated Huddersfield and
non-fluoridated Dewsbury in 1989. Community dental health, 9, 151-157.
BOWEN, W. & PEARSON, S. 1993. Effect of milk on cariogenesis. Caries research,
27, 461-466.
BOWEN, W., PEARSON, S., VANWUYCKHUYSE, B. & TABAK, L. 1991.
Influence of milk, lactose-reduced milk, and lactose on caries in desalivated rats. Caries
Research, 25, 283-286.
BOWEN, W. H. 1995. The role of fluoride toothpastes in the prevention of dental
caries. Journal of the Royal Society of Medicine, 88, 505.
BOYDE, A. 1967. The development of enamel structure. Proceedings of the Royal
Society of Medicine, 60, 923.
BRIGHENTI, F., DELBEM, A., BUZALAF, M., OLIVEIRA, F., RIBEIRO, D. &
SASSAKI, K. 2006. In vitro evaluation of acidified toothpastes with low fluoride
content. Caries research, 40, 239-244.
BRÖCHNER, A., CHRISTENSEN, C., KRISTENSEN, B., TRANÆUS, S.,
KARLSSON, L., SONNESEN, L. & TWETMAN, S. 2011. Treatment of post-
orthodontic white spot lesions with casein phosphopeptide-stabilised amorphous
calcium phosphate. Clinical oral investigations, 15, 369-373.
BRUUN, C. & THYLSTRUP, A. 1984. Fluoride in whole saliva and dental caries
experience in areas with high or low concentrations of fluoride in the drinking water.
Caries research, 18, 450-456.
CAI, F., SHEN, P., MORGAN, M. & REYNOLDS, E. 2003. Remineralization of
enamel subsurface lesions in situ by sugar‐free lozenges containing casein
phosphopeptideamorphous calcium phosphate. Australian dental journal, 48, 240-243.
CAI, F., MANTON, D., SHEN, P., WALKER, G., CROSS, K., YUAN, Y.,
REYNOLDS, C. & REYNOLDS, E. 2007. Effect of addition of citric acid and casein
148
phosphopeptide-amorphous calcium phosphate to a sugar-free chewing gum on enamel
remineralization in situ. Caries research, 41, 377-383.
CALDWELL, R. C., MUNTZ, M., GILMORE, R. & PIGMAN, W. 1957.
Microhardness studies of intact surface enamel. Journal of dental research, 36, 732-
738.
CHAN, D. 1993. Current methods and criteria for caries diagnosis in North America.
Journal of dental education, 57, 422-427.
CHESTERS, R., HUNTINGTON, E., BURCHELL, C. & STEPHEN, K. 1992. Effect
of oral care habits on caries in adolescents. Caries research, 26, 299-304.
CHESTNUTT, I. G., SCHÄFER, F., JACOBSON, A. P. & STEPHEN, K. W. 1998.
The influence of toothbrushing frequency and post‐brushing rinsing on caries
experience in a caries clinical trial. Community dentistry and oral epidemiology, 26,
406-411.
CLARK, K. 2001. The development of model systems to study root caries. PhD Thesis,
University of Liverpool.
COCHRANE, N., SARANATHAN, S., CAI, F., CROSS, K. & REYNOLDS, E. 2008.
Enamel subsurface lesion remineralisation with casein phosphopeptide stabilised
solutions of calcium, phosphate and fluoride. Caries research, 42, 88-97.
COCHRANE, N., CAI, F., HUQ, N., BURROW, M. & REYNOLDS, E. 2010. New
approaches to enhanced remineralization of tooth enamel. Journal of Dental research,
89, 1187-1197.
CROSS, K., HUQ, N., STANTON, D., SUM, M. & REYNOLDS, E. 2004. NMR
studies of a novel calcium, phosphate and fluoride delivery vehicle- αS1--casein (59–
79) by stabilized amorphous calcium fluoride phosphate nanocomplexes. Biomaterials,
25, 5061-5069.

149
CUMMINS, D. 2006. The impact of research and development on the prevention of oral
diseases in children and adolescents: an industry perspective. Pediatric dentistry, 28,
118-127.
DAMEN, J., EXTERKATE, R. & TEN CATE, J. 1997. Reproducibility of TMR for the
determination of longitudinal mineral changes in dental hard tissues. Advances in dental
research, 11, 415-419.
DARLING, A. I. 1958. Studies of the early lesion of enamel caries with transmitted
light, polarised light and microradiography. Its nature, mode of spread, points of entry
and its relation to enamel structure. British Dental Journal, 105, 119-135.
DE JOSSELIN DE JONG, E., ANGMAR-MA˚ NSSON, B., TEN BOSCH, J. &
SUNDSTROM, F. 1990. Comparison of white light scattering and light-induced
fluorescence from sound and carious tooth enamel. Caries Research, 24, 399.
DE JOSSELIN DE JONG, E., SUNDSTRÖM, F., WESTERLING, H., TRANAEUS,
S., TEN BOSCH, J. & ANGMAR-MÅNSSON, B. 1995. A new method for in vivo
quantification of changes in initial enamel caries with laser fluorescence. Caries
research, 29, 2-7.
DEAN, H. T. 1934. Classification of mottled enamel diagnosis. Journal of American
dental association, 21, 1421-1426.
DEAN, H. T., ARNOLD JR, F. A., JAY, P. & KNUTSON, J. W. 1950. Studies on mass
control of dental caries through fluoridation of the public water supply. Public Health
Reports (1896-1970), 1403-1408.
Delivering better oral health: an evidence-based toolkit for prevention, Public Health
England. 2014
DENBESTEN, P. & CRENSHAW, M. 1984. The effects of chronic high fluoride levels
on forming enamel in the rat. Archives of oral biology, 29, 675-679.
150
DIJKMAN, A., SCHUTHOF, J. & ARENDS, J. 1986. In vivo remineralization of
plaque-induced initial enamel lesions–a microradiographic investigation. Caries
research, 20, 202-208.
DIJKMAN, A., HUIZINGA, E., RUBEN, J. & ARENDS, J. 1990. Remineralization of
human enamel in situ after 3 months: the effect of not brushing versus the effect of an F
dentifrice and an F-free dentifrice. Caries research, 24, 263-266.
DIRKS, O. B. 1966. Posteruptive changes in dental enamel. Journal of Dental
Research, 45, 503-511.
DODDS, M. 1993. Dilemmas in caries diagnosis--applications to current practice and
need for research. Journal of dental education, 57, 433-438.
DREISBACH, R. H. 1980. Handbook of Poisoning: Prevention, Diagnosis, Treatment
10th Ed, Lange Medical Publications.
DRUMMOND, B., CHANDLER, N. & MELDRUM, A. 2002. Comparison of the
cariogenicity of some processed cheeses. European journal of paediatric dentistry:
official journal of European Academy of Paediatric Dentistry, 3, 188-194.
DUCKWORTH, R., KNOOP, D. & STEPHEN, W. 1991. Effect of mouthrinsing after
toothbrushing with a fluoride dentifrice on human salivary fluoride levels. Caries
research, 25, 287-291.
EDGAR, W., O’MULLANE, D. & DAWES, C. 2004. Saliva and oral health. British
Dental Association. London.
EDMUNDS, D., WHITTAKER, D. & GREEN, R. 1988. Suitability of human, bovine,
equine, and ovine tooth enamel for studies of artificial bacterial carious lesions. Caries
research, 22, 327-336.
ELLWOOD, R., GOMEZ, J. & PRETTY, I. 2012. Caries clinical trial methods for the
assessment of oral care products in the 21st century. Advances in dental research, 24,
32-35.
151
FEATHERSTONE, J. 1996. Modeling the caries-inhibitory effects of dental materials.
Dental Materials, 12, 194-197.
FEATHERSTONE, J. D. 2000. The science and practice of caries prevention. Journal-
American Dental Association, 131, 887-900.
FEATHERSTONE, J. 2004. The continuum of dental caries—evidence for a dynamic
disease process. Journal of Dental Research, 83, C39-C42.
FEATHERSTONE, J. D. 2006. Caries prevention and reversal based on the caries
balance. Pediatric dentistry, 28, 128-132.
FEATHERSTONE, J. 2008. Dental caries: a dynamic disease process. Australian dental
journal, 53, 286-291.
FEATHERSTONE, J. & RODGERS, B. 1981. Effect of acetic, lactic and other organic
acids on the formation of artificial carious lesions. Caries research, 15, 377-385.
FEATHERSTONE, J. & ZERO, D. 1992. An in situ model for simultaneous assessment
of inhibition of demineralization and enhancement of remineralization. Journal of
dental research, 71, 804-810.
FEATHERSTONE, J., DUNCAN, J. & CUTRESS, T. 1978. Crystallographic changes
in human tooth enamel during in-vitro caries simulation. Archives of oral biology, 23,
405-413.
FEJERSKOV, O., EKSTRAND, J. & BURT, B. A. 1996. Fluoride in dentistry,
Munksgaard.
FEJERSKOV, O., KIDD, E. A., FEJERSKOV, O. & KIDD, E. A. 2003. Dental caries,
Blackwell Munksgaard.
FERRAZZANO, G., CANTILE, T., INGENITO, A., CHIANESE, L. & QUARTO, M.
2007. New strategies in dental caries prevention: experimental study on casein
phosphopeptides. European journal of paediatric dentistry: official journal of European
Academy of Paediatric Dentistry, 8, 183-187.
152
FERRAZZANO, G. F., AMATO, I., CANTILE, T., SANGIANANTONI, G. &
INGENITO, A. 2011. In vivo remineralising effect of GC Tooth Mousse on early dental
enamel lesions: SEM analysis. International dental journal, 61, 210-216.
FONTANA, M., YOUNG, D. A., WOLFF, M. S., PITTS, N. B. & LONGBOTTOM, C.
2010. Defining dental caries for 2010 and beyond. Dental Clinics of North America, 54,
423-440.
GELHARD, T. 1982. Remineralization of human enamel in vivo. PhD thesis, University
of Groningen.
GIULIO, A. B., MATTEO, Z., SERENA, I. P., SILVIA, M. & LUIGI, C. 2009. In vitro
evaluation of casein phosphopeptide-amorphous calcium phosphate (CPP-ACP) effect
on stripped enamel surfaces. A SEM investigation. Journal of dentistry, 37, 228-232.
GRAY, J. 1966. Kinetics of enamel dissolution during formation of incipient caries-like
lesions. Archives of oral biology, 11, 397-IN7.
GUGGENHEIM, B., SCHMID, R., AESCHLIMANN, J., BERROCAL, R. &
NEESER, J.-R. 1999. Powdered Milk Micellar Casein Prevents Oral Colonization by
Streptococcus sobrinus and Dental Caries in Rats: A Basis for the Caries–Protective
Effect of Dairy Products. Caries research, 33, 446-454.
HALL, A. & GIRKIN, J. 2004. A review of potential new diagnostic modalities for
caries lesions. Journal of Dental Research, 83, C89-C94.
HALLSWORTH, A., ROBINSON, C. & WEATHERELL, J. 1972. Mineral and
magnesium distribution within the approximal carious lesion of dental enamel. Caries
research, 6, 156-168.
HARPER, D., OSBORN, J., HEFFERREN, J. & CLAYTON, R. 1986. Cariostatic
evaluation of cheeses with diverse physical and compositional characteristics. Caries
research, 20, 123-130.

153
HIBST, R., PAULUS, R. & LUSSI, A. 2001. Detection of occlusal caries by laser
fluorescence: basic and clinical investigations. Medical Laser Application, 16, 205-213.
HIGHAM, S., PRETTY, I., EDGAR, W. & SMITH, P. 2005. The use of in situ models
and QLF for the study of coronal caries. Journal of dentistry, 33, 235-241.
HOLT, C., WAHLGREN, N. & DRAKENBERG, T. 1996. Ability of a beta-casein
phosphopeptide to modulate the precipitation of calcium phosphate by forming
amorphous dicalcium phosphate nanoclusters. Biochem. J, 314, 1035-1039.
HOLT, R. D. 2001. Advances in dental public health. Primary Dental Care, 8, 99-102.
HUYSMANS, M., LONGBOTTOM, C., CHRISTIE, A., BRUCE, P. & SHELLIS, R.
2000. Temperature dependence of the electrical resistance of sound and carious teeth.
Journal of dental research, 79, 1464-1468.
IIJIMA, Y., TAKAGI, O., RUBEN, J. & ARENDS, J. 1999. In vitro remineralization of
in vivo and in vitro formed enamel lesions. Caries research, 33, 206-213.
IIJIMA, Y., CAI, F., SHEN, P., WALKER, G., REYNOLDS, C. & REYNOLDS, E.
2004. Acid resistance of enamel subsurface lesions remineralized by a sugar-free
chewing gum containing casein phosphopeptide-amorphous calcium phosphate. Caries
research, 38, 551-556.
INGRAM, G. & EDGAR, W. 1994. Interactions of fluoride and non-fluoride agents
with the caries process. Advances in dental research, 8, 158-165.
ISSA, A. 2004. The effect of intrinsic and extrinsic sugars on enamel demineralisation
and plaque pH as determined using intraoral cariogenicity tests and plaque pH
telemetry. PhD Thesis, University of Leeds.
ITTHAGARUN, A., KING, N., YIU, C. & DAWES, C. 2005. The effect of chewing
gums containing calcium phosphates on the remineralization of artificial caries-like
lesions in situ. Caries research, 39, 251-254.
154
JAYARAJAN, J., JANARDHANAM, P. & JAYAKUMAR, P. 2011. Efficacy of CPP-
ACP and CPP-ACPF on enamel remineralization-An in vitro study using scanning
electron microscope and DIAGNOdent®. Indian Journal of Dental Research, 22, 77.
KARIYA, S., SATO, T., SAKAGUCHI, Y. & YOSHII, E. 2004. Fluoride effect on acid
resistance capacity of CPP–ACP containing material. Abstract 2045. 82nd General
Session of the IADR.
KOULOURIDES, T. 1971. Remineralization of enamel as a defense against caries.
Chemistry and Physiology of Enamel, University of Michigan Press, Ann Arbor, 109-
119.
KOULOURIDES, T. & VOLKER, J. 1964. Changes of enamel microhardness in the
human mouth. The Alabama journal of medical sciences, 1, 435.
KROBICKA, A., BOWEN, W., PEARSON, S. & YOUNG, D. 1987. The effects of
cheese snacks on caries in desalivated rats. Journal of dental research, 66, 1116-1119.
KÜHNISCH, J. & HEINRICH-WELTZIEN, R. 2004. Quantitative light-induced
fluorescence (QLF)--a literature review. International journal of computerized dentistry,
7, 325-338.
KUMAR, V., ITTHAGARUN, A. & KING, N. 2008. The effect of casein
phosphopeptide‐amorphous calcium phosphate on remineralization of artificial caries‐
like lesions: an in vitro study. Australian dental journal, 53, 34-40.
LAMKIN, M. S. & OPPENHEIM, F. G. 1993. Structural features of salivary function.
Critical Reviews in Oral Biology & Medicine, 4, 251-259.
LAMMERS, P., BORGGREVEN, J. & DRIESSENS, F. 1990. Influence of fluoride on
in vitro remineralization of artificial subsurface lesions determined with a sandwich
technique. Caries research, 24, 81-85.
LARSEN, M. 1990. Chemical events during tooth dissolution. Journal of dental
research, 69, 575-80; discussion 634-6.
155
LEGEROS, R. 1991. Calcium Phosphates in Oral Biology and Medicine (1991). San
Francisco, California.
LENNON, A., PFEFFER, M., BUCHALLA, W., BECKER, K., LENNON, S. &
ATTIN, T. 2006. Effect of a casein/calcium phosphate-containing tooth cream and
fluoride on enamel erosion in vitro. Caries research, 40, 154-157.
LEVERETT, D., ADAIR, S., SHIELDS, C. & FU, J. 1987.relationship between salivary
and plaque fluoride levels and dental-caries experience in fluoridated and
nonfluoridated communities. Caries Research, karger allschwilerstrasse 10, ch-4009
Basel, Switzerland, 179-180.
LIDBECK, W. L., HILL, I. B. & BEEMAN, J. A. 1943. Acute sodium fluoride
poisoning. Journal of the American Medical Association, 121, 826-827.
LONGBOTTOM, C. & HUYSMANS, M.-C. 2004. Electrical measurements for use in
caries clinical trials. Journal of dental research, 83, C76-C79.
LUSSI, A., JAEGGI, T. & ZERO, D. 2003. The role of diet in the aetiology of dental
erosion. Caries Research, 38, 34-44.
LUSSI, A., HELLWIG, E., ZERO, D. & JAEGGI, T. 2006. Erosive tooth wear:
diagnosis, risk factors and prevention. American journal of dentistry, 19, 319.
LYNCH, R., NAVADA, R. & WALIA, R. 2004. Low‐levels of fluoride in plaque and
saliva and their effects on the demineralisation and remineralisation of enamel; role of
fluoride toothpastes. International dental journal, 54, 304-309.
MALINOWSKI, M., DUGGAL, M. S., STRAFFORD, S. M. & TOUMBA, K. J. 2012.
Effect of varying concentrations of fluoridated milk on enamel remineralisation in vitro.
Caries Research, 46:555–60.
MANDEL, I. D. 1974. Relation of saliva and plaque to caries. Journal of dental
research, 53, 246-266.
156
MANDEL, I. D. & ZENGO, A. N. 1973. Genetic and chemical aspects of caries
resistance. Comparative immunology of the oral cavity, 118-137.
MANLY, R. & HARRINGTON, D. P. 1959. Solution rate of tooth enamel in an acetate
buffer. Journal of dental research, 38, 910-919.
MANNING, R. & EDGAR, W. 1992. Intra-oral models for studying de-and
remineralization in man: methodology and measurement. Journal of dental research,
71, 895-900.
MANTON, D. J. 2009. Investigations into the effect of casein phosphopeptide-
amorphous calcium phosphate on enamel demineralisation and remineralisation. PhD
Thesis, The Univerity of Melbourne.
MANTON, D. J., WALKER, G. D., CAI, F., COCHRANE, N. J., SHEN, P. &
REYNOLDS, E. C. 2008. Remineralization of enamel subsurface lesions in situ by the
use of three commercially available sugar‐free gums. International Journal of
Paediatric Dentistry, 18, 284-290.
MARGOLIS, H., BENIASH, E. & FOWLER, C. 2006. Role of macromolecular
assembly of enamel matrix proteins in enamel formation. Journal of dental research,
85, 775-793.
MARINHO, V., HIGGINS, J., LOGAN, S. & SHEIHAM, A. 2003. Fluoride
mouthrinses for preventing dental caries in children and adolescents. Cochrane
Database of Systematic Reviews, 3.
MARTHALER, T. & PETERSEN, P. 2005. Salt fluoridation—an alternative in
automatic prevention of dental caries. International Dental Journal, 55, 351-358.
MEHARRY, M., DAWSON, D., WEFEL, J., HARLESS, J., KUMMET, C. & XIAO,
X. 2012. The effect of surface defects in early caries assessment using quantitative light-
induced fluorescence (QLF) and micro-digital-photography (MDP). Journal of
dentistry, 40, 955-961.
157
MELLBERG, J., CASTROVINCE, L. & ROTSIDES, I. 1986. In vivo remineralization
by a monofluorophosphate dentifrice as determined with a thin-section sandwich
method. Journal of dental research, 65, 1078-1083.
MELLBERG, J. 1992. Hard-tissue substrates for evaluation of cariogenic and anti-
cariogenic activity in situ. Journal of dental research, 71, 913-919.
MORGAN, M., ADAMS, G., BAILEY, D., TSAO, C., FISCHMAN, S. &
REYNOLDS, E. 2008. The anticariogenic effect of sugar-free gum containing CPP-
ACP nanocomplexes on approximal caries determined using digital bitewing
radiography. Caries research, 42, 171-184.
MOYNIHAN, P. 2000. Foods and factors that protect against dental caries. Nutrition
Bulletin, 25, 281-286.
MURRAY, J. J., RUGG-GUNN, A. J. & JENKINS, G. N. 1991. Fluorides in caries
prevention, Butterworth-Heinemann.
NEESER, J. R., GOLLIARD, M., WOLTZ, A., ROUVET, M., DILLMANN, M. L. &
GUGGENHEIM, B. 1994. In vitro modulation of oral bacterial adhesion to saliva‐
coated hydroxyapatite beads by milk casein derivatives. Oral microbiology and
immunology, 9, 193-201.
NORDSTRÖM, A. & BIRKHED, D. 2009. Fluoride retention in proximal plaque and
saliva using two NaF dentifrices containing 5,000 and 1,450 ppm F with and without
water rinsing. Caries research, 43, 64-69.
ØGAARD, B., RØLLA, G., ARENDS, J. & TEN CATE, J. 1988. Orthodontic
appliances and enamel demineralization Part 2. Prevention and treatment of lesions.
American Journal of Orthodontics and Dentofacial Orthopedics, 94, 123-128.
OSHIRO, M., YAMAGUCHI, K., TAKAMIZAWA, T., INAGE, H., WATANABE, T.,
IROKAWA, A., ANDO, S. & MIYAZAKI, M. 2007. Effect of CPP-ACP paste on tooth
mineralization: an FE-SEM study. Journal of oral Science, 49, 115-120.

158
PANICH, M. & POOLTHONG, S. 2009. The effect of casein phosphopeptide-
amorphous calcium phosphate and a cola soft drink on in vitro enamel hardness.
Journal of the American Dental Association (1939), 140, 455-460.
PETERSSON, G. H. & BRATTHALL, D. 1996. The caries decline: a review of
reviews. European Journal of Oral Sciences, 104, 436-443.
PITTS, N. & EKSTRAND, K. 2013. International Caries Detection and Assessment
System (ICDAS) and its International Caries Classification and Management System
(ICCMS)–methods for staging of the caries process and enabling dentists to manage
caries. Community Dentistry and Oral Epidemiology, 41, e41-e52.
PITTS, N., DUCKWORTH, R., MARSH, P., MUTTI, B., PARNELL, C. & ZERO, D.
2012. Post-brushing rinsing for the control of dental caries: exploration of the available
evidence to establish what advice we should give our patients. British dental journal,
212, 315-320.
PLISKA, B. T., WARNER, G. A., TANTBIROJN, D. & LARSON, B. E. 2012.
Treatment of white spot lesions with ACP paste and microabrasion. The Angle
Orthodontist, 82, 765-769.
POT, T. & GROENEVELD, A. 1976. Het ontstaan en gedrag van de witte vlek;
overwegingen aan de hand van klinische waarnemingen. Ned Tijdschr Τ, 83, 464-471.
PRESTON, K., HIGHAM, S. & SMITH, P. 2007. The efficacy of techniques for the
disinfection of artificial sub-surface dentinal caries lesions and their effect on
demineralization and remineralization in vitro. Journal of dentistry, 35, 490-495.
PRETTY, I. A. 2006. Caries detection and diagnosis: novel technologies. Journal of
dentistry, 34, 727-739.
PRETTY, I., EDGAR, W. & HIGHAM, S. 2002a. The effect of ambient light on QLF
analyses. Journal of oral rehabilitation, 29, 369-373.

159
PRETTY, I., HALL, A., SMITH, P., EDGAR, W. & HIGHAM, S. 2002b. The intra-and
inter-examiner reliability of quantitative light-induced fluorescence (QLF) analyses.
British dental journal, 193, 105-109.
PRETTY, I., EDGAR, W. & HIGHAM, S. 2004. The effect of dehydration on
quantitative light‐induced fluorescence analysis of early enamel demineralization.
Journal of oral rehabilitation, 31, 179-184.
RAHIOTIS, C. & VOUGIOUKLAKIS, G. 2007. Effect of a CPP-ACP agent on the
demineralization and remineralization of dentine in vitro. Journal of dentistry, 35, 695-
698.
RAMALINGAM, L., MESSER, L. & REYNOLDS, E. 2005. Adding casein
phosphopeptide-amorphous calcium phosphate to sports drinks to eliminate in vitro
erosion. Pediatric dentistry, 27, 61-67.
RANJITKAR, S., KAIDONIS, J. A., RICHARDS, L. C. & TOWNSEND, G. C. 2009.
The effect of CPP–ACP on enamel wear under severe erosive conditions. Archives of
oral biology, 54, 527-532.
REYNOLDS, E. 1987. The prevention of sub-surface demineralization of bovine
enamel and change in plaque composition by casein in an intra-oral model. Journal of
dental Research, 66, 1120-1127.
REYNOLDS, E. 1997. Remineralization of enamel subsurface lesions by casein
phosphopeptide-stabilized calcium phosphate solutions. Journal of Dental Research, 76,
1587-1595.
REYNOLDS, E. C. 1998. Anticariogenic complexes of amorphous calcium phosphate
stabilized by casein phosphopeptides: a review. Special Care in Dentistry, 18, 8-16.
REYNOLDS, E. 2008. Calcium phosphate‐based remineralization systems: scientific
evidence? Australian dental journal, 53, 268-273.
REYNOLDS, E. 2009. Casein phosphopeptide-amorphous calcium phosphate: the
scientific evidence. Advances in Dental Research, 21, 25-29.
160
REYNOLDS, E. & JOHNSON, I. 1981. Effect of milk on caries incidence and bacterial
composition of dental plaque in the rat. Archives of Oral Biology, 26, 445-451.
REYNOLDS, E., CAIN, C., WEBBER, E., BLACK, C., RILEY, P., JOHNSON, I. &
PERICH, J. 1995. Anticariogenicity of calcium phosphate complexes of tryptic casein
phosphopeptides in the rat. Journal of Dental Research, 74, 1272-1279.
REYNOLDS, E., BLACK, C., CAI, F., CROSS, K., EAKINS, D., HUQ, N.,
MORGAN, M., NOWICKI, A., PERICH, J. & RILEY, P. 1999. Advances in enamel
remineralization: casein phosphopeptide-amorphous calcium phosphate. Journal of
Clinical Dentistry, 10, 86-88.
REYNOLDS, E., CAI, F., SHEN, P. & WALKER, G. 2003. Retention in plaque and
remineralization of enamel lesions by various forms of calcium in a mouthrinse or
sugar-free chewing gum. Journal of Dental Research, 82, 206-211.
REYNOLDS, E., CAI, F., COCHRANE, N., SHEN, P., WALKER, G., MORGAN, M.
& REYNOLDS, C. 2008. Fluoride and casein phosphopeptide-amorphous calcium
phosphate. Journal of dental research, 87, 344-348.
ROBINSON, C., WEATHERELL, J. & HALLSWORTH, A. 1983. Alterations in the
composition of permanent human enamel during carious attack. Demineralisation and
remineralisation of the teeth. IRL Press, Oxford, 209-233.
ROSE, R. 2000. Effects of an anticariogenic casein phosphopeptide on calcium
diffusion in streptococcal model dental plaques. Archives of oral biology, 45, 569-575.
ROSEN, S., MIN, D., HARPER, D., HARPER, W., BECK, E. & BECK, F. 1984.
Effect of cheese, with and without sucrose, on dental caries and recovery of
Streptococcus mutans in rats. Journal of dental research, 63, 894-896.
SCHIRRMEISTER, J. F., GEBRANDE, J. P., ALTENBURGER, M. J., MOENTING,
J. S. & HELLWIG, E. 2007a. Effect of dentifrice containing 5000 ppm fluoride on non-
cavitated fissure carious lesions in vivo after 2 weeks. American journal of dentistry, 20,
212-216.
161
SCHIRRMEISTER, J., SEGER, R., ALTENBURGER, M., LUSSI, A. & HELLWIG,
E. 2007b. Effects of various forms of calcium added to chewing gum on initial enamel
carious lesions in situ. Caries research, 41, 108-114.
SCHÜPBACH, P., NEESER, J., GOLLIARD, M., ROUVET, M. & GUGGENHEIM,
B. 1996. Incorporation of caseinoglycomacropeptide and caseinophosphopeptide into
the salivary pellicle inhibits adherence of mutans streptococci. Journal of dental
research, 75, 1779-1788.
SCHOENFELD, D. 2010. Statistical considerations for clinical trials and scientific
experiments [Online]. Massachusetts: MGH Mallinckrodt General Clinical Research
Center. [Accessed march 2011].
SHANNON, I. & EDMONDS, E. J. 1972. Effect of fluoride dosage on human parotid
saliva fluoride levels. Archives of oral biology, 17, 1303-1309.
SHAPIRO, S. & GUGGENHEIM, B. 1995. The action of thymol on oral bacteria. Oral
microbiology and immunology, 10, 241-246.
SHEN, P., CAI, F., NOWICKI, A., VINCENT, J. & REYNOLDS, E. 2001.
Remineralization of enamel subsurface lesions by sugar-free chewing gum containing
casein phosphopeptide-amorphous calcium phosphate. Journal of dental research, 80,
2066-2070.
SHIELDS, C., LEVERETT, D., ADAIR, S. & FEATHERSTONE, J. 1987. Salivary
fluoride levels in fluoridated and nonfluoridated communities. Journal of dental
research. . American Association of Dental Research 1619 DUKE ST, ALEXANDRIA,
VA 22314, 141-141.
SILVERSTONE, L. 1973. Structure of carious enamel, including the early lesion. Oral
sciences reviews, 3, 100.

162
SITTHISETTAPONG, T., PHANTUMVANIT, P., HUEBNER, C. & DEROUEN, T.
2012. Effect of CPP-ACP paste on dental caries in primary teeth a randomized trial.
Journal of dental research, 0022034512454296.
SJÖGREN, K. & BIRKHED, D. 1994. Effect of various post-brushing activities on
salivary fluoride concentration after toothbrushing with a sodium fluoride dentifrice.
Caries research, 28, 127-131.
SJÖGREN, K., BIRKHED, D. & RANGMAR, B. 1995. Effect of a modified toothpaste
technique on approximal caries in preschool children. Caries research, 29, 435-441.
SMITH, C. E., NANCI, A. & DENBESTEN, P. K. 1993. Effects of chronic fluoride
exposure on morphometric parameters defining the stages of amelogenesis and
ameloblast modulation in rat incisors. The Anatomical Record, 237, 243-258.
STOOKEY, G. K. 2005. Quantitative light fluorescence: a technology for early
monitoring of the caries process. Dental Clinics of North America, 49, 753-770.
SUDJALIM, T. R., WOODS, M. G., MANTON, D. J. & REYNOLDS, E. C. 2007.
Prevention of demineralization around orthodontic brackets in vitro. American journal
of orthodontics and Dentofacial orthopedics, 131, 705. e1-705. e9.
TAVSS, E., MELLBERG, J., JOZIAK, M., GAMBOGI, R. & FISHER, S. 2003.
Relationship between dentifrice fluoride concentration and clinical caries reduction.
American journal of dentistry, 16, 369-374.
TEN BOSCH, J. Light scattering and related methods in caries diagnosis. Proc. of the
1st Annual Indiana Conference, 1996. 81-90.
TEN BOSCH, J. & ANGMAR-MÅNSSON, B. 1991. Invited Review: A Review of
Quantitative Methods for Studies of Mineral Content of Intra-oral Incipient Caries
Lesions. Journal of dental research, 70, 2-14.
TEN CATE, J. 1999. Current concepts on the theories of the mechanism of action of
fluoride. Acta Odontologica, 57, 325-329.
163
TEN CATE, J. & ARENDS, J. 1978. Remineralization of artificial enamel lesions in
vitro. Caries research, 12, 213-222.
TEN CATE, J. & DUIJSTERS, P. 1982. Alternating demineralization and
remineralization of artificial enamel lesions. Caries Research, 16, 201-210.
TEN CATE, J. & IMFELD, T. 1996. Dental erosion, summary. European Journal of
Oral Sciences, 104, 241-244.
TEN CATE, J., JONGEBLOED, W. & ARENAS, J. 1981. Remineralization of artificial
enamel lesions in vitro. Caries research, 15, 60-69.
TEN CATE, J., EXTERKATE, R. & BUIJS, M. 2006. The relative efficacy of fluoride
toothpastes assessed with pH cycling. Caries research, 40, 136-141.
TICKLE, M. 2002. The 80: 20 phenomenon: help or hindrance to planning caries
prevention programmes? Community Dental Health, 19, 39-42.
TITLEY, K., TORNECK, C., SMITH, D. & ADIBFAR, A. 1988. Adhesion of
composite resin to bleached and unbleached bovine enamel. Journal of Dental
Research, 67, 1523-1528.
TRANÆUS, S., AL‐KHATEEB, S., BJÖRKMAN, S., TWETMAN, S. & ANGMAR‐
MÅNSSON, B. 2001. Application of quantitative light‐induced fluorescence to monitor
incipient lesions in caries‐active children. A comparative study of remineralisation by
fluoride varnish and professional cleaning. European journal of oral sciences, 109, 71-
75.
TRANÆUS, S., SHI, X.-Q., LINDGREN, L.-E., TROLLSÅS, K. & ANGMAR-
MÅNSSON, B. 2002. In vivo repeatability and reproducibility of the quantitative light-
induced fluorescence method. Caries research, 36, 3-9.
TWETMAN, S. 2009. Caries prevention with fluoride toothpaste in children: an update.
European Archives of Paediatric Dentistry, 10, 162-167.

164
UYSAL, T., AMASYALI, M., KOYUTURK, A. & OZCAN, S. 2010. Effects of
different topical agents on enamel demineralization around orthodontic brackets: an in
vivo and in vitro study. Australian dental journal, 55, 268-274.
VAN DER VEEN, M. & DE JOSSELIN DE JONG, E. 2000. Application of
quantitative light-induced fluorescence for assessing early caries lesions. Monographs
oral science,17:144-162.
VAN DER VEEN, M. H., BEERENS, M. W., VAN BEEK, H. & TEN CATE, J. M.
2009. Changes in plaque composition after orthodontic Treatment: The Influence of
CPP-ACP-f paste. Caries Research 40, 412-417.
VERDONSCHOT, E., KUIJPERS, J., POLDER, B., DE LENG-WORM, M. &
BRONKHORST, E. 1992. Effects of digital grey-scale modification on the diagnosis of
small approximal carious lesions. Journal of dentistry, 20, 44-49.
VONGSAWAN, K., SURARIT, R. & RIRATTANAPONG, P. 2010. The effects of
high calcium milk and casein phosphopeptide-amorphous calcium phosphate on enamel
erosion caused by cholinated water. Southeast Asian Journal of Tropical Medicine and
Public Health, 41, 1494.
WALKER, G., CAI, F., SHEN, P., REYNOLDS, C., WARD, B., FONE, C., HONDA,
S., KOGANEI, M., ODA, M. & REYNOLDS, E. 2006. Increased remineralization of
tooth enamel by milk containing added casein phosphopeptide-amorphous calcium
phosphate. Journal of dairy research, 73, 74-78.
WALKER, G., CAI, F., SHEN, P., BAILEY, D., YUAN, Y., COCHRANE, N.,
REYNOLDS, C. & REYNOLDS, E. 2009. Consumption of milk with added casein
phosphopeptide‐amorphous calcium phosphate remineralizes enamel subsurface lesions
in situ. Australian dental journal, 54, 245-249.
WALKER, G., CAI, F., SHEN, P., ADAMS, G., REYNOLDS, C. & REYNOLDS, E.
2010. Casein phosphopeptide-amorphous calcium phosphate incorporated into sugar
confections inhibits the progression of enamel subsurface lesions in situ. Caries
research, 44, 33-40.
165
WALSH, T., WORTHINGTON, H. V., GLENNY, A. M., APPELBE, P., MARINHO,
V. & SHI, X. 2010. Fluoride toothpastes of different concentrations for preventing
dental caries in children and adolescents. Cochrane Database Syst Rev, 1.
WANG, J., SAKUMA, S., YOSHIHARA, A., KOBAYASHI, S. & MIYAZAKI, H.
2000. An evaluation and comparison of visual inspection, Electrical Caries Monitor and
Caries Detector Dye methods in detecting early occlusal caries in vitro study. Journal of
dental health-Tokyo-, 50, 223-230.
WANG, X., MEGERT, B., HELLWIG, E., NEUHAUS, K. & LUSSI, A. 2011.
Preventing erosion with novel agents. Journal of dentistry, 39, 163-170.
WENNBER, A. & ORSTAVIK, D. 1990. Adhesion of root canal sealers to bovine
dentine and gutta‐percha. International Endodontic Journal, 23, 13-19.
WERNERSSON, J., DANIELSSON NIEMI, L., EINARSON, S., HERNELL, O. &
JOHANSSON, I. 2006. Effects of human milk on adhesion of Streptococcus mutans to
saliva-coated hydroxyapatite in vitro. Caries research, 40, 412-417.
WEST, N., MAXWELL, A., HUGHES, J., PARKER, D., NEWCOMBE, R. & ADDY,
M. 1998. A method to measure clinical erosion: the effect of orange juice consumption
on erosion of enamel. Journal of Dentistry, 26, 329-335.
WHITE, D. 1992. The comparative sensitivity of intra-oral, in vitro, and animal models
in the'profile'evaluation of topical fluorides. Journal of dental research, 71, 884-894.
WHITE, D. 1995. The application of in vitro models to research on demineralization
and remineralization of the teeth. Advances in dental research, 9, 175-193.
WHITE, G. E., TSAMTSOURIS, A. & WILLIAMS, D. L. 1978. Early detection of
occlusal caries by measuring the electrical resistance of the tooth. Journal of dental
research, 57, 195-200.
WHITE, S. C., GRATT, B. M. & BAUER, J. G. 1988. A clinical comparison of
xeroradiography and film radiography for the detection of proximal caries. Oral
Surgery, Oral Medicine, Oral Pathology, 65, 242-248.
166
WHITE, D., NELSON, D. & FALLER, R. 1994. Mode of action of fluoride: application
of new techniques and test methods to the examination of the mechanism of action of
topical fluoride. Advances in Dental Research, 8, 166-174.
WONG, M., GLENNY, A. M., TSANG, B. W., LO, E., WORTHINGTON, H. V. &
MARINHO, V. C. 2011. Cochrane review: Topical fluoride as a cause of dental
fluorosis in children. Evidence‐Based Child Health: A Cochrane Review Journal, 6,
388-439.
YAMAGUCHI, K., MIYAZAKI, M., TAKAMIZAWA, T., INAGE, H. &
KUROKAWA, H. 2007. Ultrasonic determination of the effect of casein
phosphopeptide-amorphous calcium phosphate paste on the demineralization of bovine
dentin. Caries research, 41, 204-207.
YAMAZAKI, H., LITMAN, A. & MARGOLIS, H. C. 2007. Effect of fluoride on
artificial caries lesion progression and repair in human enamel: Regulation of mineral
deposition and dissolution under -in vivo-like conditions. Archives of oral biology, 52,
110-120.
YASSEN, G. H., PLATT, J. A. & HARA, A. T. 2011. Bovine teeth as substitute for
human teeth in dental research: a review of literature. Journal of oral science, 53, 273-
282.
YENGOPAL, V. & MICKENAUTSCH, S. 2009. Caries preventive effect of casein
phosphopeptide-amorphous calcium phosphate (CPP-ACP): a meta-analysis. Acta
Odontologica, 67, 321-332.
YIN, W., FENG, Y., HU, D., ELLWOOD, R. & PRETTY, I. 2007. Reliability of
quantitative laser fluorescence analysis of smooth surface lesions adjacent to the
gingival tissues. Caries research, 41, 186-189.
ZERO, D. 1995. In situ caries models. Advances in Dental Research, 9, 214-230.
ZERO, D., MARINHO, V. & PHANTUMVANIT, P. 2012. Effective use of self-care
fluoride administration in Asia. Advances in dental research, 24, 16-21.

167
ZHANG, Q., ZOU, J., YANG, R. & ZHOU, X. 2011. Remineralization effects of casein
phosphopeptide‐amorphous calcium phosphate crème on artificial early enamel lesions
of primary teeth. International Journal of Paediatric Dentistry, 21, 374-381.
XIV
8.0 APPENDICES
List of Appendices
Appendix 1: Approval for collection of bovine teeth. ....................................................................... XV
Appendix 2: Normality Tests for ΔF at Baseline. ............................................................................. XVI
Appendix 3: Normality Tests for Difference in ΔF. ....................................................................... XVII
Appendix 4: Normality Tests for ΔQ at Baseline. ......................................................................... XVIII
Appendix 5: Normality Tests for Difference in ΔQ......................................................................... XIX
Appendix 6: Normality Tests for Area at Baseline. ........................................................................... XX
Appendix 7: Normality Tests for Difference in Area. ...................................................................... XXI
Appendix 8: Abstract of the Oral Presentation at the Leeds Dental Institute Research Day (July
2014). .................................................................................................................................... XXII

XV
Appendix 1: Approval for collection of bovine teeth.
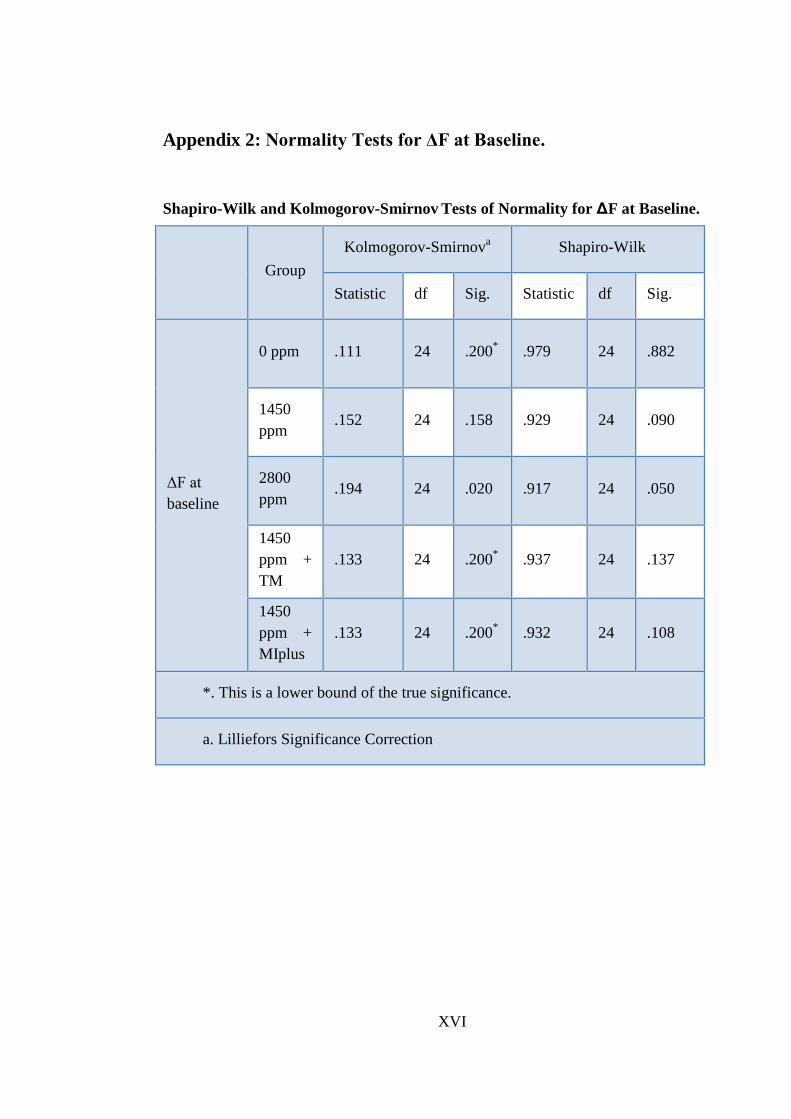
XVI
Appendix 2: Normality Tests for ΔF at Baseline.
Shapiro-Wilk and Kolmogorov-Smirnov Tests of Normality for ΔF at Baseline.
Group
Kolmogorov-Smirnova Shapiro-Wilk
Statistic df Sig. Statistic df Sig.
ΔF at
baseline
0 ppm .111 24 .200* .979 24 .882
1450
ppm .152 24 .158 .929 24 .090
2800
ppm .194 24 .020 .917 24 .050
1450
ppm +
TM
.133 24 .200* .937 24 .137
1450
ppm +
MIplus
.133 24 .200* .932 24 .108
*. This is a lower bound of the true significance.
a. Lilliefors Significance Correction
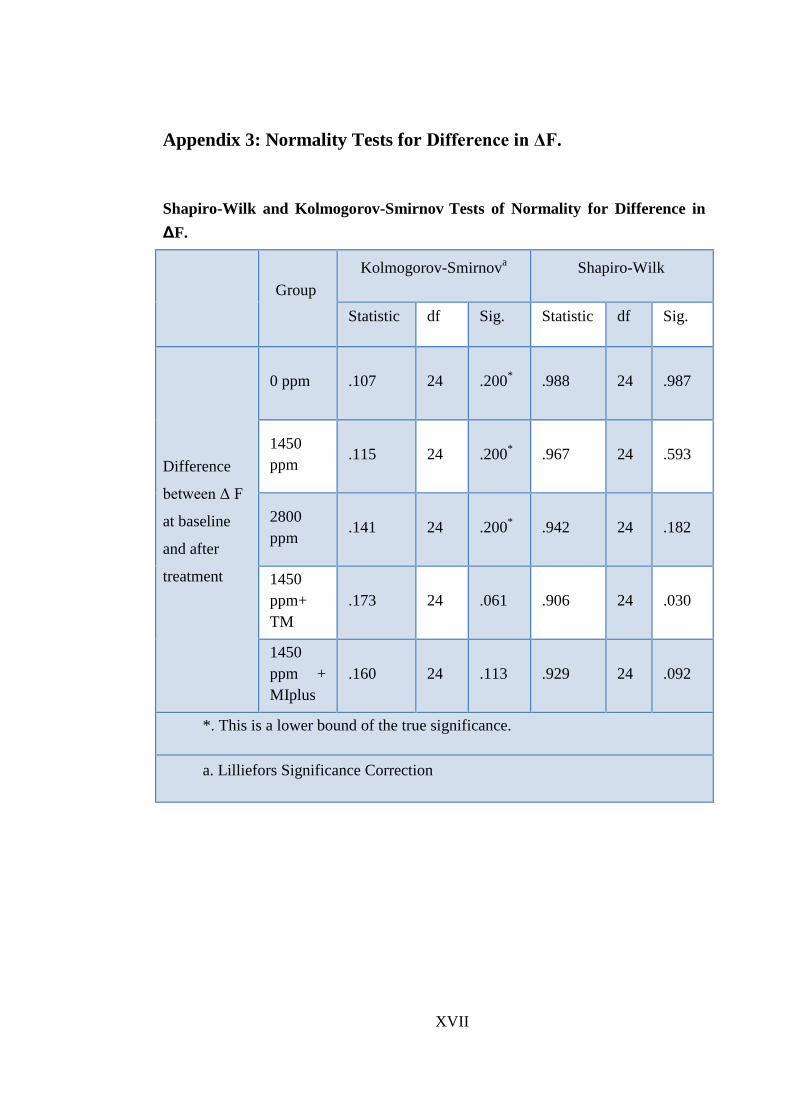
XVII
Appendix 3: Normality Tests for Difference in ΔF.
Shapiro-Wilk and Kolmogorov-Smirnov Tests of Normality for Difference in
ΔF.
Group
Kolmogorov-Smirnova Shapiro-Wilk
Statistic df Sig. Statistic df Sig.
Difference
between Δ F
at baseline
and after
treatment
0 ppm .107 24 .200* .988 24 .987
1450
ppm .115 24 .200
* .967 24 .593
2800
ppm .141 24 .200
* .942 24 .182
1450
ppm+
TM
.173 24 .061 .906 24 .030
1450
ppm +
MIplus
.160 24 .113 .929 24 .092
*. This is a lower bound of the true significance.
a. Lilliefors Significance Correction
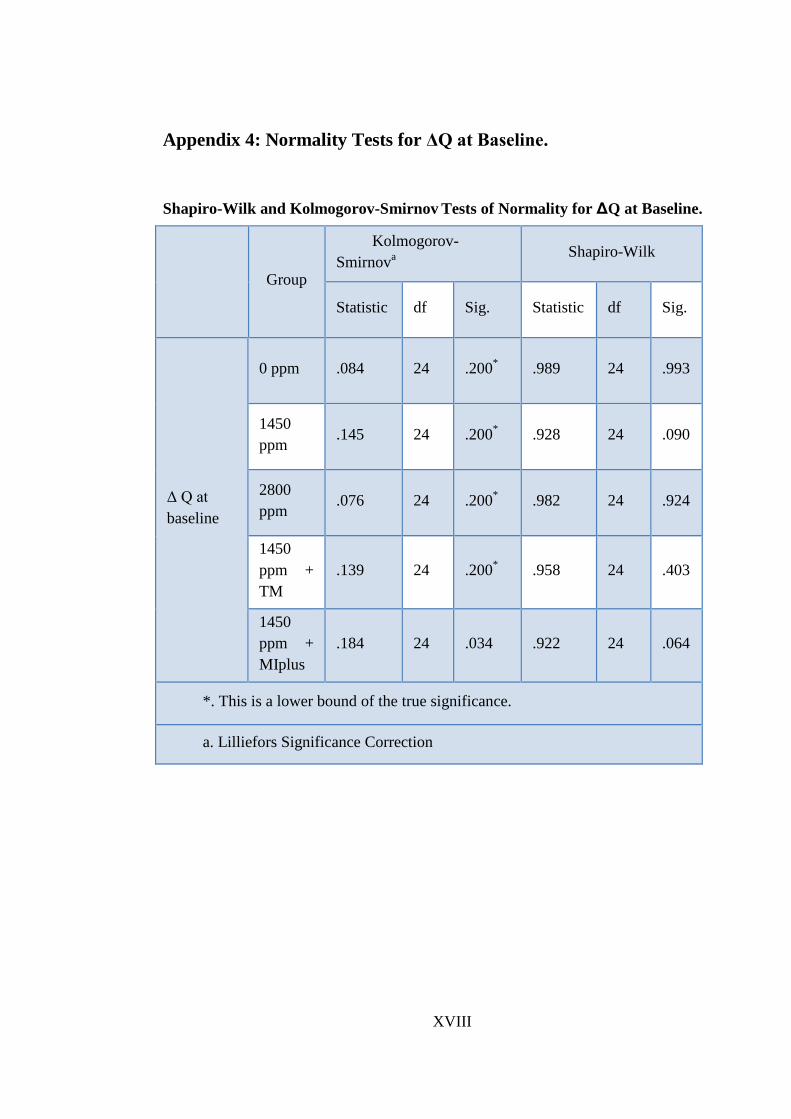
XVIII
Appendix 4: Normality Tests for ΔQ at Baseline.
Shapiro-Wilk and Kolmogorov-Smirnov Tests of Normality for ΔQ at Baseline.
Group
Kolmogorov-
Smirnova
Shapiro-Wilk
Statistic df Sig. Statistic df Sig.
Δ Q at
baseline
0 ppm .084 24 .200* .989 24 .993
1450
ppm .145 24 .200
* .928 24 .090
2800
ppm .076 24 .200
* .982 24 .924
1450
ppm +
TM
.139 24 .200* .958 24 .403
1450
ppm +
MIplus
.184 24 .034 .922 24 .064
*. This is a lower bound of the true significance.
a. Lilliefors Significance Correction
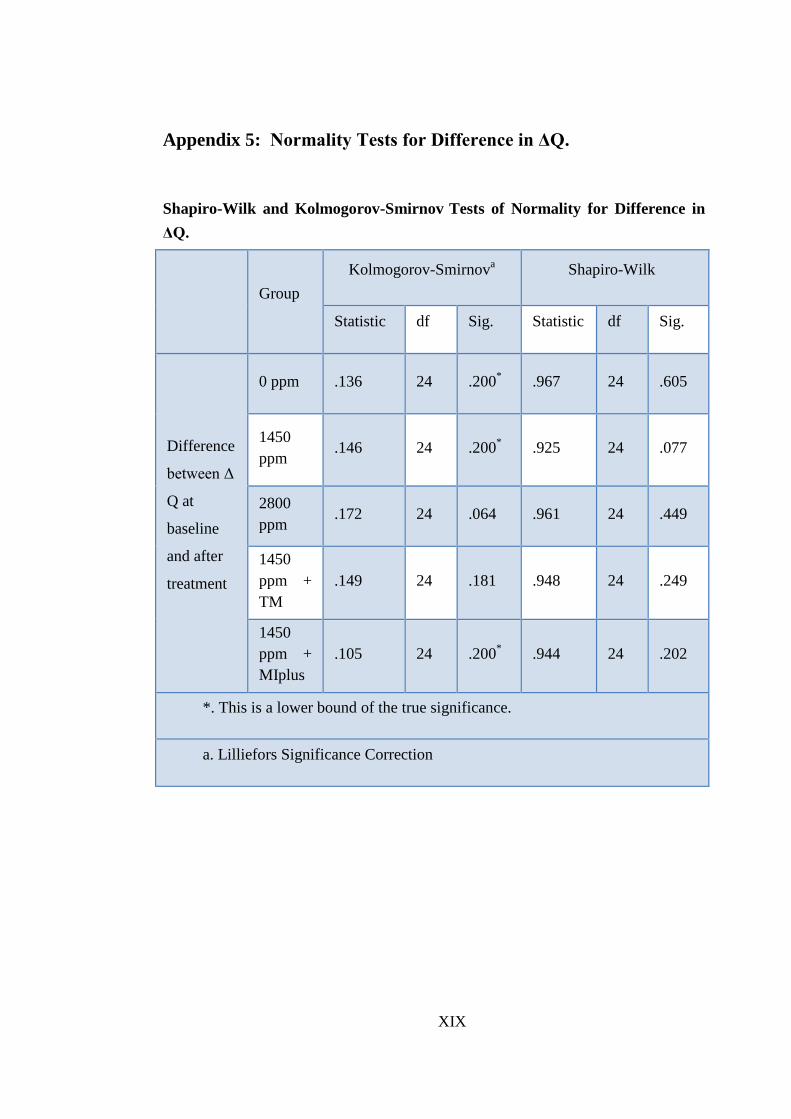
XIX
Appendix 5: Normality Tests for Difference in ΔQ.
Shapiro-Wilk and Kolmogorov-Smirnov Tests of Normality for Difference in
ΔQ.
Group
Kolmogorov-Smirnova Shapiro-Wilk
Statistic df Sig. Statistic df Sig.
Difference
between Δ
Q at
baseline
and after
treatment
0 ppm .136 24 .200* .967 24 .605
1450
ppm .146 24 .200
* .925 24 .077
2800
ppm .172 24 .064 .961 24 .449
1450
ppm +
TM
.149 24 .181 .948 24 .249
1450
ppm +
MIplus
.105 24 .200* .944 24 .202
*. This is a lower bound of the true significance.
a. Lilliefors Significance Correction
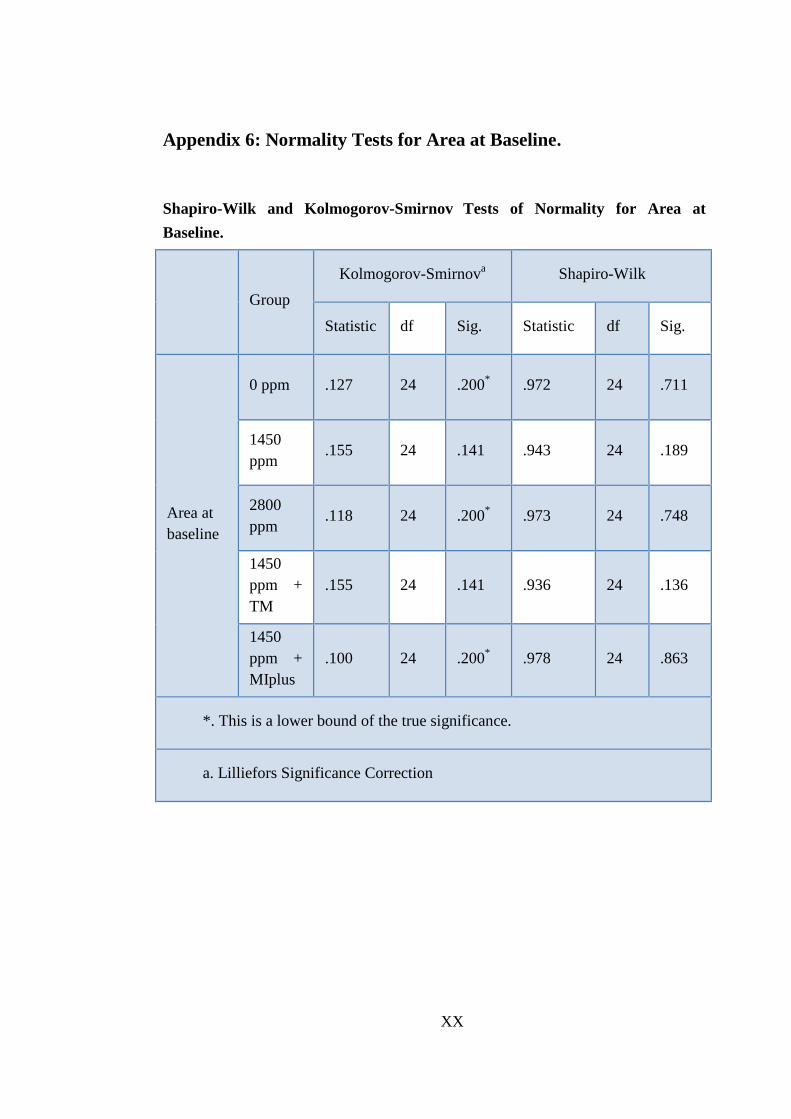
XX
Appendix 6: Normality Tests for Area at Baseline.
Shapiro-Wilk and Kolmogorov-Smirnov
Tests of Normality for Area at
Baseline.
Group
Kolmogorov-Smirnova Shapiro-Wilk
Statistic df Sig. Statistic df Sig.
Area at
baseline
0 ppm .127 24 .200* .972 24 .711
1450
ppm .155 24 .141 .943 24 .189
2800
ppm .118 24 .200
* .973 24 .748
1450
ppm +
TM
.155 24 .141 .936 24 .136
1450
ppm +
MIplus
.100 24 .200* .978 24 .863
*. This is a lower bound of the true significance.
a. Lilliefors Significance Correction

XXI
Appendix 7: Normality Tests for Difference in Area.
Shapiro-Wilk and Kolmogorov-Smirnov Tests of Normality for Difference in
Area.
Group
Kolmogorov-Smirnova Shapiro-Wilk
Statistic df Sig. Statistic df Sig.
Difference
between
area at
baseline
and after
treatment
0 ppm .266 24 .000 .878 24 .008
1450
ppm .119 24 .200* .888 24 .012
2800
ppm .230 24 .002 .886 24 .011
1450
ppm +
TM
.154 24 .144 .917 24 .050
1450
ppm +
MIplus
.127 24 .200* .967 24 .604
*. This is a lower bound of the true significance.
a. Lilliefors Significance Correction
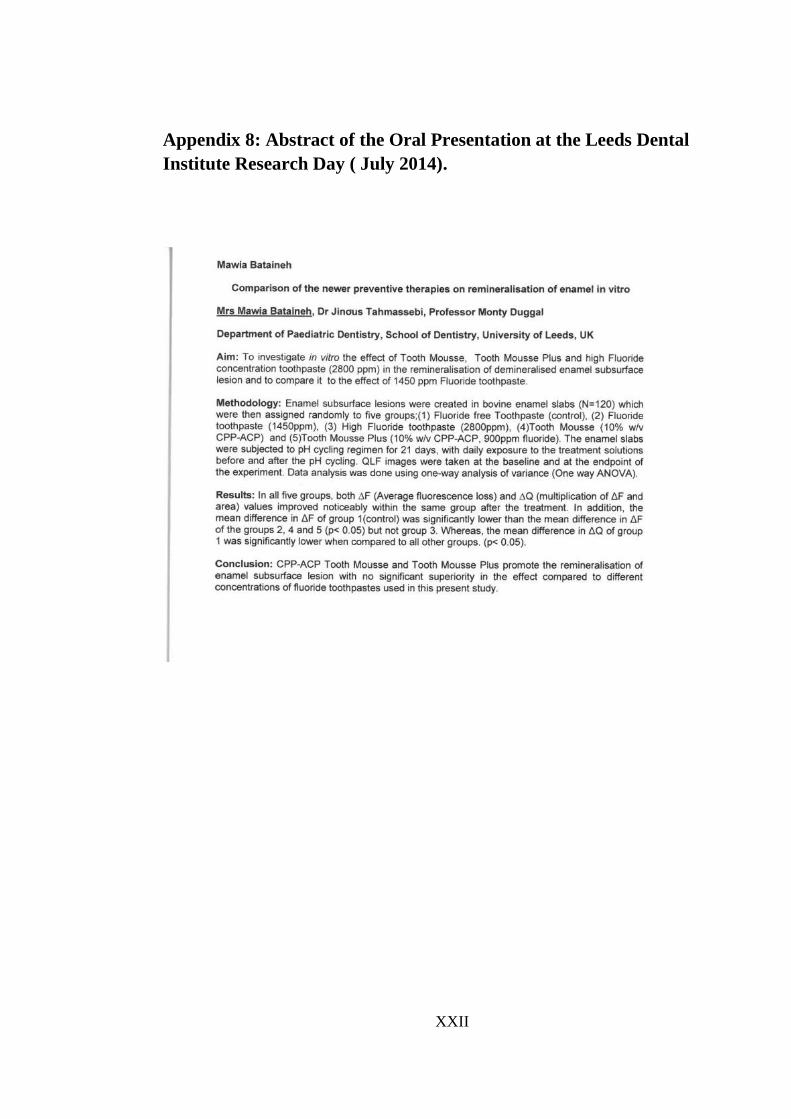
XXII
Appendix 8: Abstract of the Oral Presentation at the Leeds Dental
Institute Research Day ( July 2014).