Embed Size (px)
Citation preview
Comparison of the LHCP- and PORA-genepromotors using a GUS assay
Hill reaction in isolated pea thylakoidsChromatographic separation of chloroplast
pigmentsEffect of Norflurazone on mustard seedling
growth
(A, H, I, J)Authors:
Niels Sievertsen, [email protected] Zeyen, [email protected]
Connie Muller, [email protected] Weis, [email protected]
Assistant:Yvonne Steinbach, [email protected]
05. June 2013
1 Objective
The main goals of these experiments were to study the expression of LHCPand PORA reporter genes in Arabidopsis thaliana seedlings, the effects ofinterrupting the electron transport chain using Atrazine by observing theHill reaction, the separation of chloroplastic pigments using chromatographymethods and the effect of Norflurazone on mustard seedling growth.
1
2 INTRODUCTION
2 Introduction
Plants use light as their energy source in the processes of photosynthesis.Photosynthesis can be divided into two separate processes: the light reac-tions and the Calvin cycle. The first processes are light dependent andinclude hydrolysis of water to oxygen and two electrons. The two electronsthen travel through the electron transport chain causing the formation of anelectrochemical photon gradient and ATP synthesis. Furthermore, NADP+
is reduced to NADPH. The absorption of photons in the light harvestingcomplexes (LHC I and II) and its photosynthetic pigments drive these pro-cesses. Two molecules synthesized in the light reactions, ATP and NADPH,are then used to reduce fixed carbon dioxide to an aldehyde within the Calvincycle.Some herbicides are able to interfere with the electron transport chain andinterrupt its function. In order to show the influence of select herbicidessuch as 3-(3,4-Dichlorophenyl)-1,1-dimethylurea (DCMU) and 1-Chloro-3-ethylamino-5-isopropylamino-2,4,6-triazine (Atrazine) on the electron trans-port chain, chloroplasts of pea leaves were lysed and later treated with an arti-ficial electron acceptor molecule Dichlorophenolindophenol (DCPIP). DCPIPcan easily be detected spectrometrically by a blue to transparent color shiftfrom its oxidized to reduced state and is suitable for photosynthesis underin vitro laboratory conditions. DCPIP is referred to as the Hill reagent andreacts as shown in equation 1.
2H2O + 2DCPIP −→ 2DCPIPH2 +O2 (1)
Any photoautotrophic organism harvests light using certain photosyntheticpigments. The three classes of of pigments associated with photosynthesis arechlorophylls, carotenoids, and phycobillines. They are all tightly associatedwith integral membrane proteins of the thylakoid membranes of chloroplasts,the light harvesting complexes (LHC) mentioned earlier. Each pigment ab-sorbs light of specific wavelengths and some pigments have the capability toprotect the leaves from harmful UV radiation.Thin-layer Chromatography (DC) is a widely used technique to separatephotosynthetic pigments by their size. These pigments are soluble apolarsolvents such as benzine but unlike other plant components, they cannot bebrought in water or acetone. After a successful DC experiment, the differentpigments are visible as clearly distinct bands on our DC plates. In our ex-periment, we expected a band for each of the pigments present in the used
2
2 INTRODUCTION
leaves. Namely, they include carotene, pheophytine, chlorophyll a, chloro-phyll b, lutein, violacanthine, and neoxanthine. Chlorophylls absorb blueand red light and therefore reflect green light. This observation accounts forthe natural green color of leaves that we are used to.In plants, a light harvesting complex protein (LHCP) gene codes for a cer-tain light harvesting complex’s component called cab3, the chlorophyll abinding protein. The PORA gene codes for NADPH protochlorophyllide ox-idoreducase A and inhibits the interconversion from protochlorophyllide a tochlorophyll a very effectively. Phytochromes are photoreceptor proteins andcontrol photomorphogenesis through a signal pathway while measuring farred light absorption levels. For example, phytochromes control the activity ofthe LHCP and PORA promotors. An increase of red light absorbance leadsto an increase in cab3 protein expression and a decrease in PORA proteinsynthesis. This can be observed in sunlight, for example. PORA, in contrast,is expressed more frequently, if there is little or no light. In order to actuallyvisualize the changes in expression levels of the above named genes, trans-genic Arabitopsis seedlings had these two gene promotors coupled with theuidA gene and were monitored afterwards. uidA codes for β-Glucuronidase(GUS) and is widely used as a reporter gene in plants by promotor fusions.In our experiment, it is used to detect if the PORA or LHCP promotorhas been activated. GUS catalyzes the cleavage of glucoronic acids off ofits substrate 5-Bromo-4-chloro-1H-indol-3-yl β–D-glucopyranosiduronic acid(X-Gluc) which is then easily identified by its characteristic indigo blue color.Staining of wild type and transgenic seedlings can be compared. The indigoblue color should only be visible with cab3::GUS fused plants grown in lightand PORA::GUS fused plants grown in the dark because of the coupled GUSexpression to the two promotors. Wild type seedlings without the coupledpromotor::gene constructs are used for control. They are assumed to remaincolorless because they do not own the uidA gene coding for the GUS en-zyme.The second class of pigments are carotenoids. They are known for theirlipophilic properties as well as their red, orange, or yellow color. Besidesexpanding the effective range of photosynthesis by their absorbance at wave-lengths of 400 to 500 nm, their main task is to protect the photosynthesissystem from photooxidative damages. Furthermore, carotenoids are dividedin the two groups of xanthophylls and carotines. In order to increase cropyields, herbicides are often used to kill weeds. Genetically modified cropsare resistant towards these herbicides and not affected as surrounding weeds
3
3 METHODS
wither. Norflurazone is a herbicide which effectively inhibits the phytoenedesaturase (PDS) protein. Phytoene is normally converted into the pigmentε-carotene via the intermediate phytofluene. Therefore, PDS can be regardedas one of the essential factors in carotenoid synthesis. If PDS is inhibited,photooxidative damages cannot be prevented and accumulate to the point ofreaching cell death. The effect of Norflurazone on mustard seedling growthis analyzed in strong light as well as dim light.
3 Methods
3.1 A - Comparison of the LHCP and PORA genepromotors using a GUS assay
During the laboratory course, the method guidelines in the course materialwere followed as seen in figure 1. However, in order to stain the two columnsindependently in light and dark environments, the columns were actuallylocated on two different plates. Each of the wells on a micro titer plate werefilled with 750 µl GUS staining solution which was provided by the assistants.Afterwards, three to five days old seedlings of each strain and grown on thesame agar plate were added to the correspondingly labelled wells for wildtype, cab3::GUS, and PORA::GUS on the micro titer plate. After incubationin light or sealed without any light, the GUS staining solution was removedand 80% EtOH was added into the wells. The plates were then heated insidea microwave, accelerating the outflow of chlorophyll out of the leaves. Theseleaves were then analyzed under a light microscope.
4

3.1 A - Comparison of the LHCP and PORA gene promotors using a GUSassay 3 METHODS
Figure 1: Experimental setup for experiment A as seen in the course mate-rial. In our experiment, the columns incubated in light and dark environ-ments were separated in order to ensure that no light would enter the ”dark”column.
5
3.2 H - Hill reaction in isolated pea thylakoids 3 METHODS
3.2 H - Hill reaction in isolated pea thylakoids
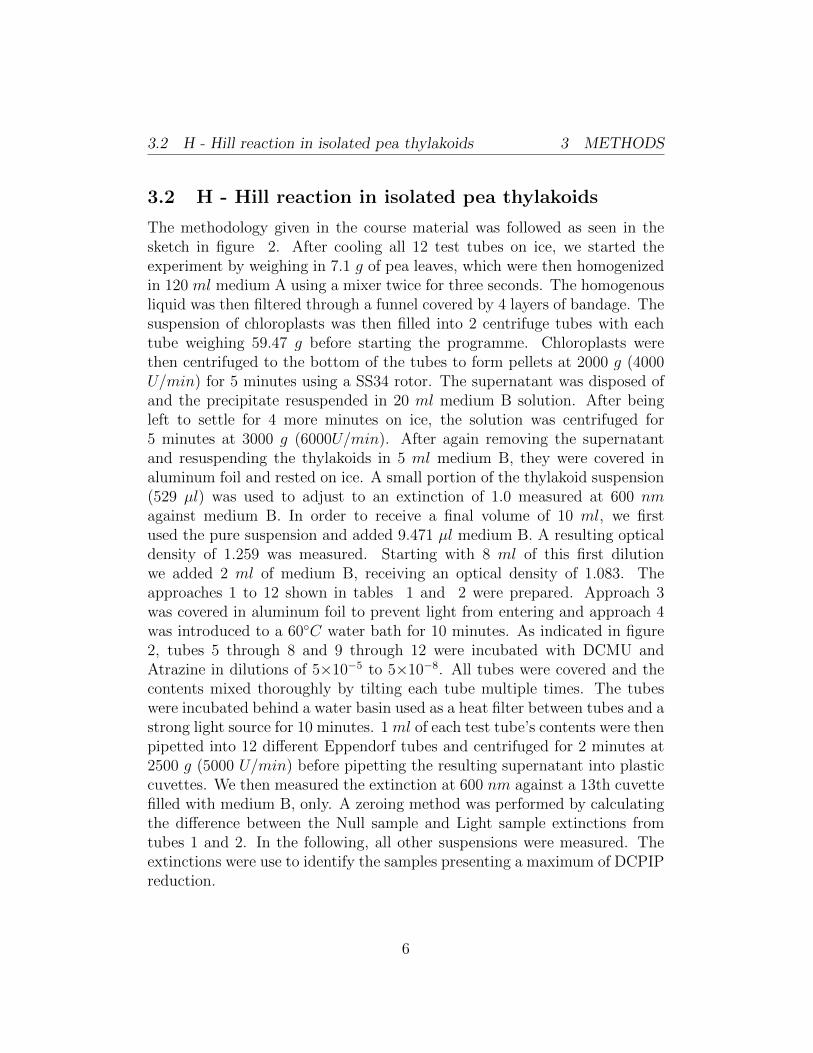
The methodology given in the course material was followed as seen in thesketch in figure 2. After cooling all 12 test tubes on ice, we started theexperiment by weighing in 7.1 g of pea leaves, which were then homogenizedin 120 ml medium A using a mixer twice for three seconds. The homogenousliquid was then filtered through a funnel covered by 4 layers of bandage. Thesuspension of chloroplasts was then filled into 2 centrifuge tubes with eachtube weighing 59.47 g before starting the programme. Chloroplasts werethen centrifuged to the bottom of the tubes to form pellets at 2000 g (4000U/min) for 5 minutes using a SS34 rotor. The supernatant was disposed ofand the precipitate resuspended in 20 ml medium B solution. After beingleft to settle for 4 more minutes on ice, the solution was centrifuged for5 minutes at 3000 g (6000U/min). After again removing the supernatantand resuspending the thylakoids in 5 ml medium B, they were covered inaluminum foil and rested on ice. A small portion of the thylakoid suspension(529 µl) was used to adjust to an extinction of 1.0 measured at 600 nmagainst medium B. In order to receive a final volume of 10 ml, we firstused the pure suspension and added 9.471 µl medium B. A resulting opticaldensity of 1.259 was measured. Starting with 8 ml of this first dilutionwe added 2 ml of medium B, receiving an optical density of 1.083. Theapproaches 1 to 12 shown in tables 1 and 2 were prepared. Approach 3was covered in aluminum foil to prevent light from entering and approach 4was introduced to a 60◦C water bath for 10 minutes. As indicated in figure2, tubes 5 through 8 and 9 through 12 were incubated with DCMU andAtrazine in dilutions of 5×10⁻⁵ to 5×10⁻⁸. All tubes were covered and thecontents mixed thoroughly by tilting each tube multiple times. The tubeswere incubated behind a water basin used as a heat filter between tubes and astrong light source for 10 minutes. 1 ml of each test tube’s contents were thenpipetted into 12 different Eppendorf tubes and centrifuged for 2 minutes at2500 g (5000 U/min) before pipetting the resulting supernatant into plasticcuvettes. We then measured the extinction at 600 nm against a 13th cuvettefilled with medium B, only. A zeroing method was performed by calculatingthe difference between the Null sample and Light sample extinctions fromtubes 1 and 2. In the following, all other suspensions were measured. Theextinctions were use to identify the samples presenting a maximum of DCPIPreduction.
6
3.2 H - Hill reaction in isolated pea thylakoids 3 METHODS
Figure 2: Experimental setup for experiment H as seen in the course material.The zero, light, dark, and heat approaches were used for zeroing and referencewhen analysing the DCMU and Atrazine dilutions.
7
3.3 I - Chromatographic separation of chloroplast pigments3 METHODS
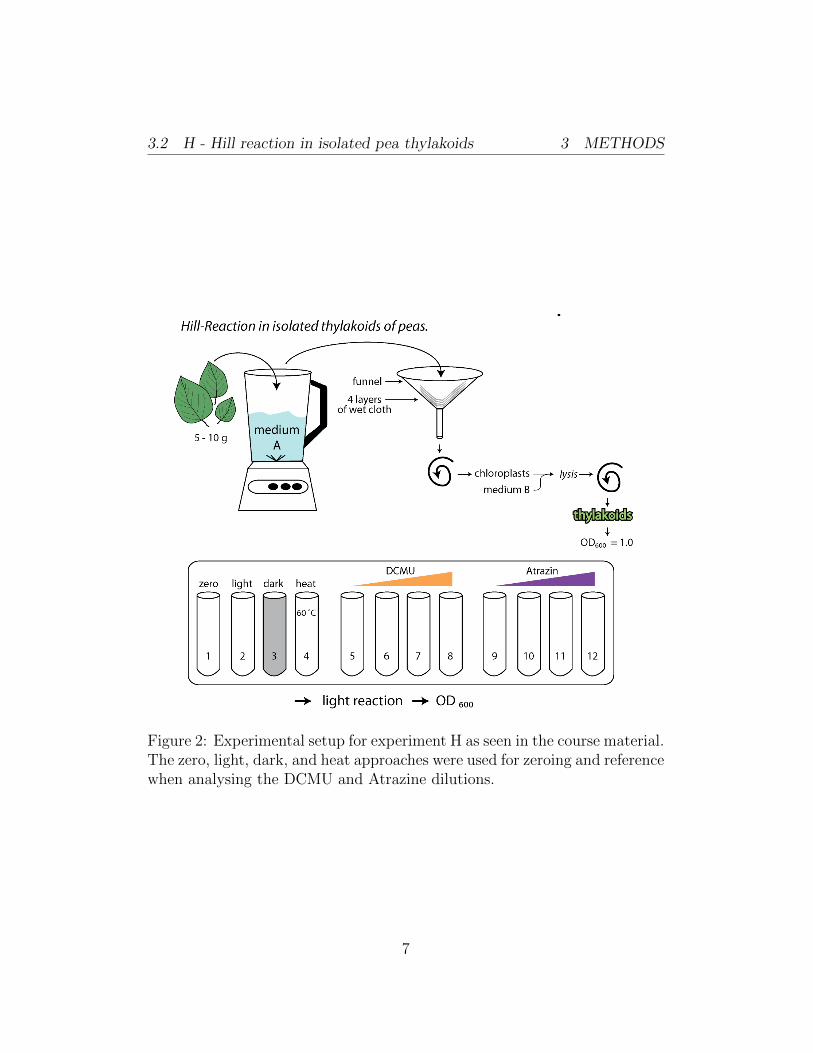
Sample 1(Null) 2(Light) 3(Dark) 4(Heat activated)
Thylakoids - 500 µl 500 µl 500 µlMedium B 3500 µl 3000 µl 3000 µl 3000 µl
DCMU - - - -Atrazine - - - -DCPIP 200 µl 200 µl 200 µl 200 µlWater fill up 300 µl 300 µl 300 µl
Table 1: Approaches used for optical density measurements (references).
Sample 5-8(DCMU) 9-12(Atrazine)
Thylakoids 500 µl 500 µlMedium B 3000 µl 3000 µl
DCMU 200 µl -Atrazine - 200 µlDCPIP 200 µl 200 µlWater 300 µl 300 µl
Table 2: Approaches used for herbicide treated thylakoids.
3.3 I - Chromatographic separation of chloroplast pig-ments
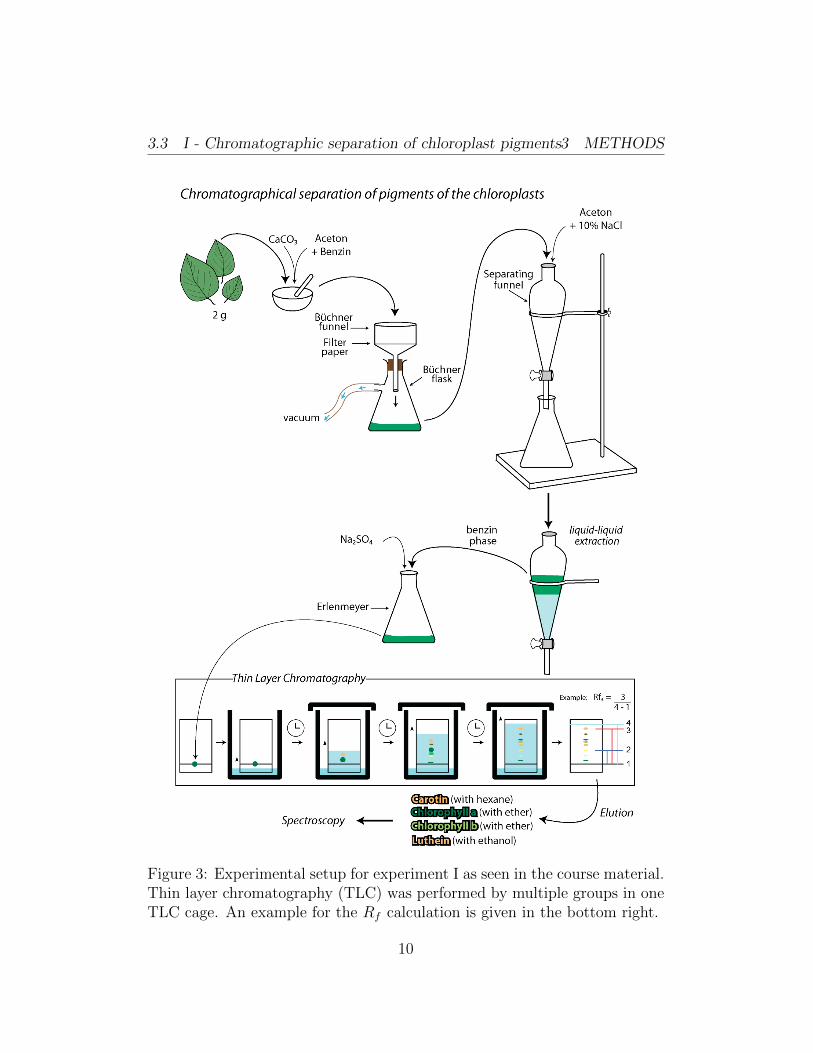
The methodology given in the course material was followed as seen in figure3. We began the experiment by weighing in 2 g of pea leaves and grindedthem in a bowl using a pestle and a small spatula of CaCO3. We graduallyadded a total of 5 ml of benzene and 50 ml of acetone in order to introducethe apolar and polar phases used in the next step of the experiment. Wefiltered the grounded suspension using a Bchner funnel and Bchner flaskwith a vacuum and were able to remove all larger structural leaf elements.We filled the remaining pigment solution into a separation funnel along withanother 30 ml acetone and 50 ml 10% NaCl solution. After a few thoroughturns of the closed funnel to mix all the components, we left it to settleand waited for the phases to separate. After 5 minutes, we opened thefunnel and removed the acetone and water phases. The benzene phase withits chloroplast pigments was washed two more times with water and thendried in an Erlenmeyer flask using some spatulas of Na2SO4. Our Prakikum
8
3.3 I - Chromatographic separation of chloroplast pigments3 METHODS
water bottles possibly had traces of detergent inside them, possibly remainingfrom the last group, which caused our solution not to separate well in thefirst of two washing steps. We changed the bottle for the second step. TheDC (Dunnschichtchromatographie) or thin layer chromatography (TLC) wasperformed. We added thin straight lines of the chloroplast pigment solutionon the carrier material of the DC plate, the stationary phase of this DCexperiment. In this experiment, we used silica as our carrier and waitedfor the pigment solution to separate clearly into the different photosyntheticpigments. We marked the distance travelled by the eluent and dried theplate. The retention factors for each pigment were calculated using equation2 and the relative mobility of the different pigments was interpreted.
Rf =S
L(2)
In order to perform a UV/V IS spectroscopy experiment and analyze thelight absorbance in relation to the wavelength, we had to scratch the carotine,chlorophyll a and b as well as the luthein bands off the DC plate. Carotinewas eluted in 1 ml hexane, the two chlorophyll species were eluted in 2 mldiethyl ether and the luthein was resuspended in 1 ml ethanol. Directlyafter zeroing the spectrometer using a cuvette filled with the correspondingpure solvent, the four pigment dilutions were fixed in a cuvette for UV/V ISanalysis.
9
3.3 I - Chromatographic separation of chloroplast pigments3 METHODS
Figure 3: Experimental setup for experiment I as seen in the course material.Thin layer chromatography (TLC) was performed by multiple groups in oneTLC cage. An example for the Rf calculation is given in the bottom right.
10
3.4 J - Effect of Norflurazone on mustard seedling growth 3 METHODS
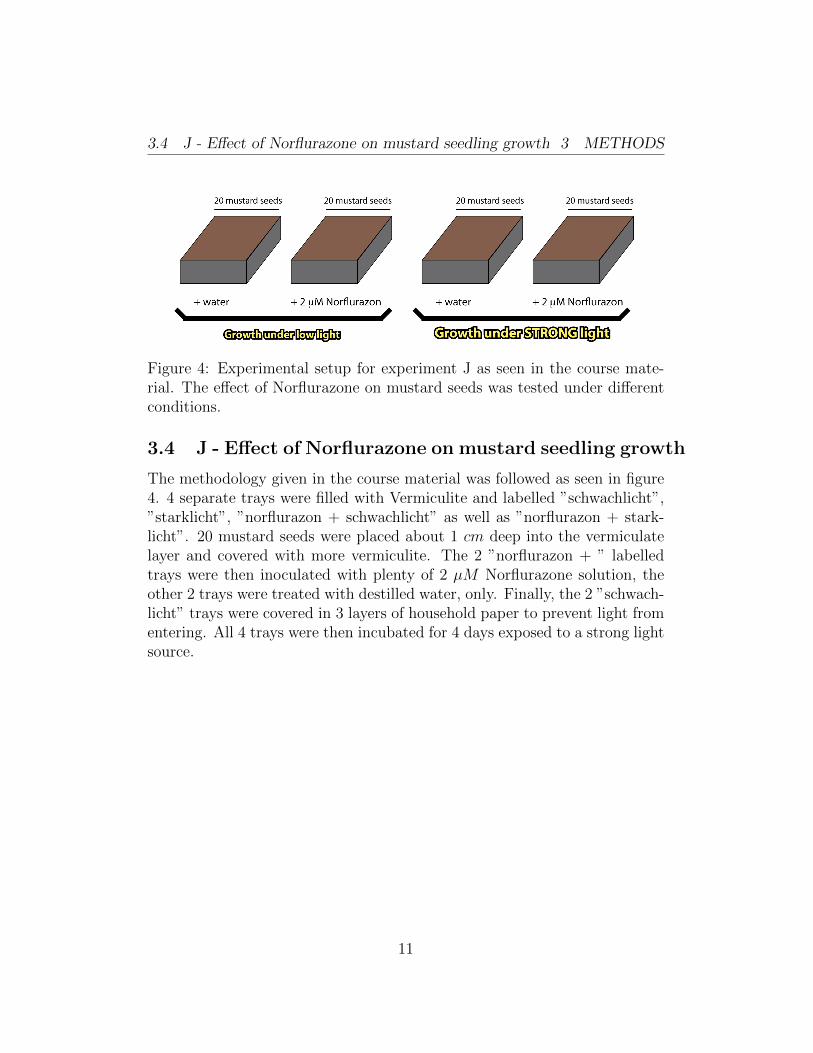
Figure 4: Experimental setup for experiment J as seen in the course mate-rial. The effect of Norflurazone on mustard seeds was tested under differentconditions.
3.4 J - Effect of Norflurazone on mustard seedling growth
The methodology given in the course material was followed as seen in figure4. 4 separate trays were filled with Vermiculite and labelled ”schwachlicht”,”starklicht”, ”norflurazon + schwachlicht” as well as ”norflurazon + stark-licht”. 20 mustard seeds were placed about 1 cm deep into the vermiculatelayer and covered with more vermiculite. The 2 ”norflurazon + ” labelledtrays were then inoculated with plenty of 2 µM Norflurazone solution, theother 2 trays were treated with destilled water, only. Finally, the 2 ”schwach-licht” trays were covered in 3 layers of household paper to prevent light fromentering. All 4 trays were then incubated for 4 days exposed to a strong lightsource.
11
4 RESULTS & DISCUSSION
4 Results & Discussion
4.1 A - Comparison of the LHCP and PORA genepromotors using a GUS assay
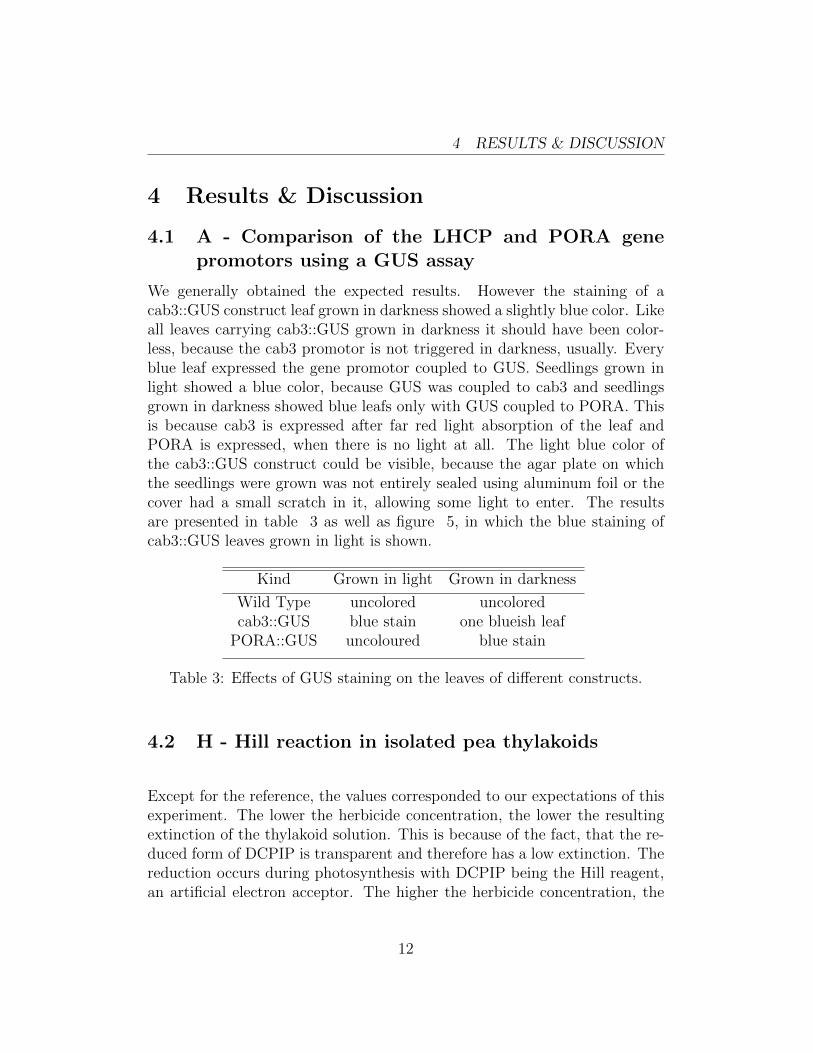
We generally obtained the expected results. However the staining of acab3::GUS construct leaf grown in darkness showed a slightly blue color. Likeall leaves carrying cab3::GUS grown in darkness it should have been color-less, because the cab3 promotor is not triggered in darkness, usually. Everyblue leaf expressed the gene promotor coupled to GUS. Seedlings grown inlight showed a blue color, because GUS was coupled to cab3 and seedlingsgrown in darkness showed blue leafs only with GUS coupled to PORA. Thisis because cab3 is expressed after far red light absorption of the leaf andPORA is expressed, when there is no light at all. The light blue color ofthe cab3::GUS construct could be visible, because the agar plate on whichthe seedlings were grown was not entirely sealed using aluminum foil or thecover had a small scratch in it, allowing some light to enter. The resultsare presented in table 3 as well as figure 5, in which the blue staining ofcab3::GUS leaves grown in light is shown.
Kind Grown in light Grown in darkness
Wild Type uncolored uncoloredcab3::GUS blue stain one blueish leaf
PORA::GUS uncoloured blue stain
Table 3: Effects of GUS staining on the leaves of different constructs.
4.2 H - Hill reaction in isolated pea thylakoids
Except for the reference, the values corresponded to our expectations of thisexperiment. The lower the herbicide concentration, the lower the resultingextinction of the thylakoid solution. This is because of the fact, that the re-duced form of DCPIP is transparent and therefore has a low extinction. Thereduction occurs during photosynthesis with DCPIP being the Hill reagent,an artificial electron acceptor. The higher the herbicide concentration, the
12

4.2 H - Hill reaction in isolated pea thylakoids4 RESULTS & DISCUSSION
Figure 5: The cab3::GUS construct carrier leaves grown in light after stainingas seen under a light microscope. The blue GUS staining is visible in eachleaf.
13
4.2 H - Hill reaction in isolated pea thylakoids4 RESULTS & DISCUSSION
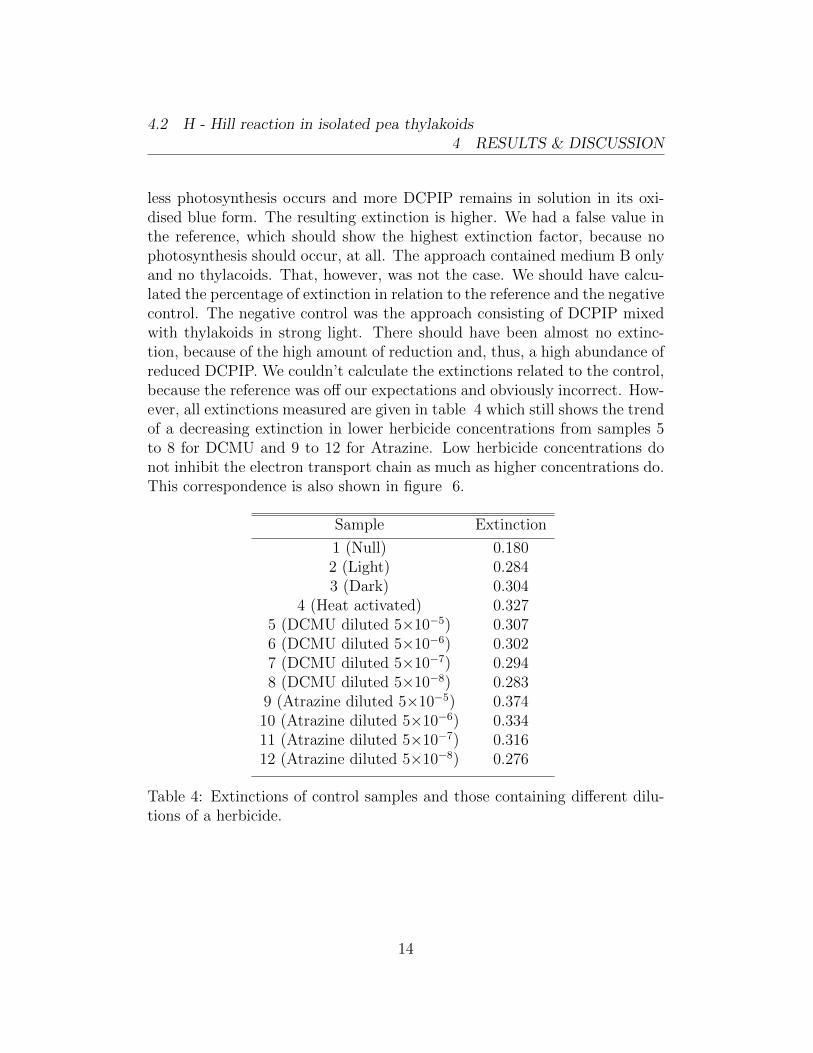
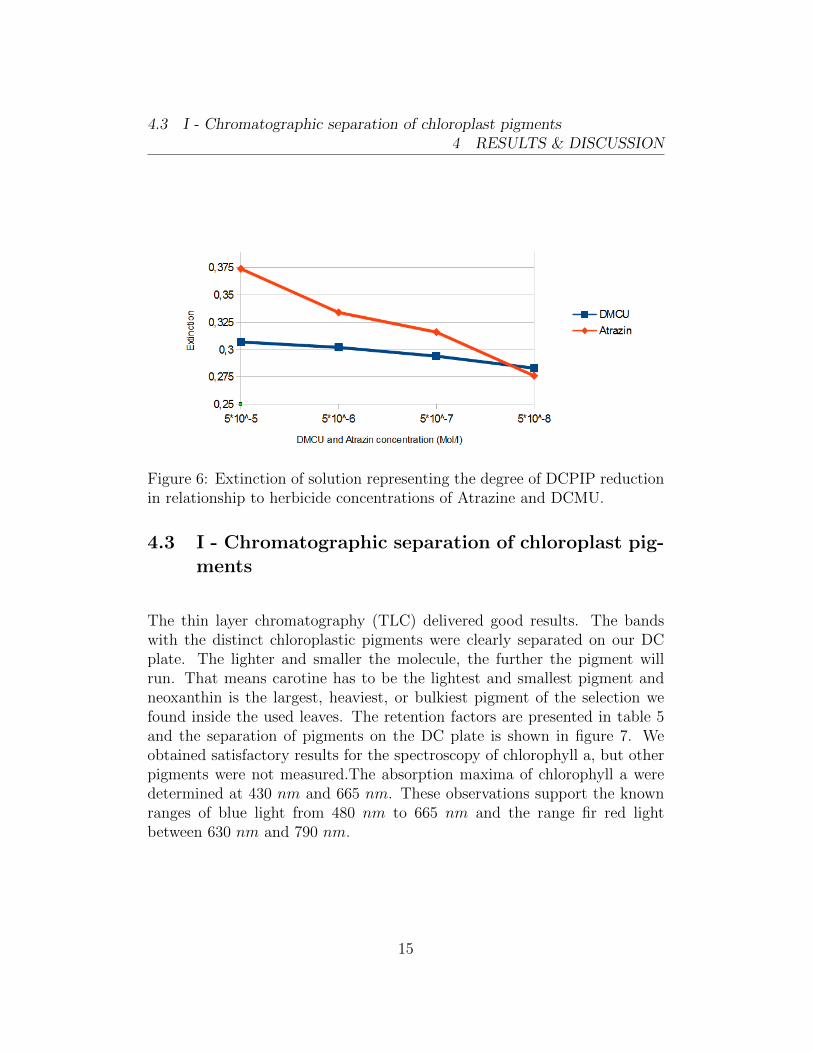
less photosynthesis occurs and more DCPIP remains in solution in its oxi-dised blue form. The resulting extinction is higher. We had a false value inthe reference, which should show the highest extinction factor, because nophotosynthesis should occur, at all. The approach contained medium B onlyand no thylacoids. That, however, was not the case. We should have calcu-lated the percentage of extinction in relation to the reference and the negativecontrol. The negative control was the approach consisting of DCPIP mixedwith thylakoids in strong light. There should have been almost no extinc-tion, because of the high amount of reduction and, thus, a high abundance ofreduced DCPIP. We couldn’t calculate the extinctions related to the control,because the reference was off our expectations and obviously incorrect. How-ever, all extinctions measured are given in table 4 which still shows the trendof a decreasing extinction in lower herbicide concentrations from samples 5to 8 for DCMU and 9 to 12 for Atrazine. Low herbicide concentrations donot inhibit the electron transport chain as much as higher concentrations do.This correspondence is also shown in figure 6.
Sample Extinction
1 (Null) 0.1802 (Light) 0.2843 (Dark) 0.304
4 (Heat activated) 0.3275 (DCMU diluted 5×10⁻⁵) 0.3076 (DCMU diluted 5×10⁻⁶) 0.3027 (DCMU diluted 5×10⁻⁷) 0.2948 (DCMU diluted 5×10⁻⁸) 0.283
9 (Atrazine diluted 5×10⁻⁵) 0.37410 (Atrazine diluted 5×10⁻⁶) 0.33411 (Atrazine diluted 5×10⁻⁷) 0.31612 (Atrazine diluted 5×10⁻⁸) 0.276
Table 4: Extinctions of control samples and those containing different dilu-tions of a herbicide.
14
4.3 I - Chromatographic separation of chloroplast pigments4 RESULTS & DISCUSSION
Figure 6: Extinction of solution representing the degree of DCPIP reductionin relationship to herbicide concentrations of Atrazine and DCMU.
4.3 I - Chromatographic separation of chloroplast pig-ments
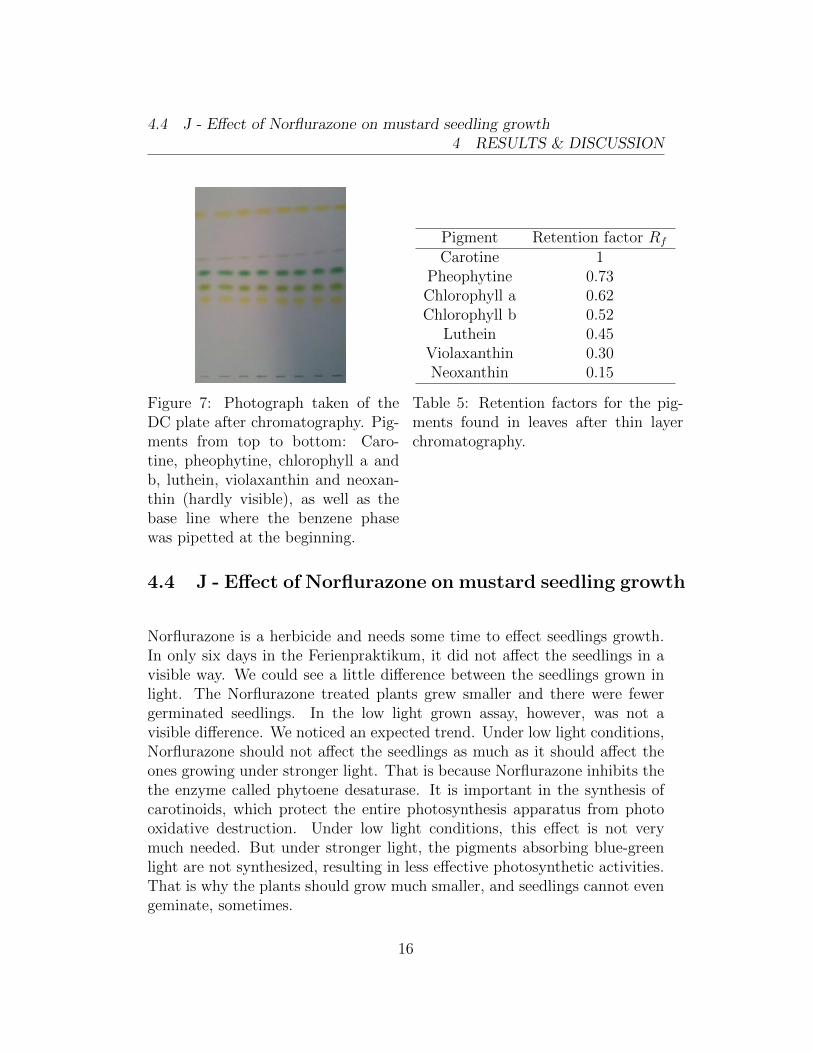
The thin layer chromatography (TLC) delivered good results. The bandswith the distinct chloroplastic pigments were clearly separated on our DCplate. The lighter and smaller the molecule, the further the pigment willrun. That means carotine has to be the lightest and smallest pigment andneoxanthin is the largest, heaviest, or bulkiest pigment of the selection wefound inside the used leaves. The retention factors are presented in table 5and the separation of pigments on the DC plate is shown in figure 7. Weobtained satisfactory results for the spectroscopy of chlorophyll a, but otherpigments were not measured.The absorption maxima of chlorophyll a weredetermined at 430 nm and 665 nm. These observations support the knownranges of blue light from 480 nm to 665 nm and the range fir red lightbetween 630 nm and 790 nm.
15
4.4 J - Effect of Norflurazone on mustard seedling growth4 RESULTS & DISCUSSION
Figure 7: Photograph taken of theDC plate after chromatography. Pig-ments from top to bottom: Caro-tine, pheophytine, chlorophyll a andb, luthein, violaxanthin and neoxan-thin (hardly visible), as well as thebase line where the benzene phasewas pipetted at the beginning.
Pigment Retention factor Rf
Carotine 1Pheophytine 0.73Chlorophyll a 0.62Chlorophyll b 0.52
Luthein 0.45Violaxanthin 0.30Neoxanthin 0.15
Table 5: Retention factors for the pig-ments found in leaves after thin layerchromatography.
4.4 J - Effect of Norflurazone on mustard seedling growth
Norflurazone is a herbicide and needs some time to effect seedlings growth.In only six days in the Ferienpraktikum, it did not affect the seedlings in avisible way. We could see a little difference between the seedlings grown inlight. The Norflurazone treated plants grew smaller and there were fewergerminated seedlings. In the low light grown assay, however, was not avisible difference. We noticed an expected trend. Under low light conditions,Norflurazone should not affect the seedlings as much as it should affect theones growing under stronger light. That is because Norflurazone inhibits thethe enzyme called phytoene desaturase. It is important in the synthesis ofcarotinoids, which protect the entire photosynthesis apparatus from photooxidative destruction. Under low light conditions, this effect is not verymuch needed. But under stronger light, the pigments absorbing blue-greenlight are not synthesized, resulting in less effective photosynthetic activities.That is why the plants should grow much smaller, and seedlings cannot evengeminate, sometimes.
16