Embed Size (px)
Citation preview

J Am Acad Audiol 8 : 342-354 (1997)
Comparison of the Intersubject and Intrasubj ect Variability of Exogenous and Endogenous Auditory Evoked Potentials Susan D . Dalebout* Randall R. Robey*
Abstract
The variability, both between subjects (intersubject variability) and within subjects (intrasub-ject variability), of the P300 event-related potential was compared to that of early and middle latency components using coefficients of variation . For each of five waveform components, 12 amplitude measures (two trials on each of six measurement occasions) and 12 latency measures were obtained for each of eight subjects . P300 intersubject variability was com-parable to that of the most stable early components (ABR waves III and V), both in terms of amplitude and latency. Intrasubject variability was considerably greater for P300 than for the early components ; even so, multiple waveforms collected from the same subject tended to fit within an envelope bounded by ±1 standard deviation from the mean (averaged) response to oddball stimuli . The variability of MLR component Pa exceeded that of all other compo-nents.
Key Words: Auditory evoked potentials, intersubject variability, intrasubject variability, P300
Abbreviations: ABR =auditory brainstem response, CS =coefficient of stability, CV = coef-ficient of variation, EP = evoked potential, MLR = middle latency response, Q2 = variance
T
he auditory evoked response includes a sequence of at least 15 peaks that begins about 1 msec following the onset of an
auditory signal. These peaks, presumed to reflect aspects of human information processing, are classified according to their latencies as early (1-10 msec), middle (10-50 msec), or late (50-500 msec) (Jerger and Jerger, 1985). These same components also may be classified as exogenous or endogenous. Exogenous or evoked potentials (EPs) are obligatory neural responses evoked by events extrinsic to the nervous system; their variance is primarily accounted for by varia-tions in the physical parameters of the stimu-lus. The early components (i .e ., the auditory brainstem response, or ABR), middle compo-nents (i .e ., the middle latency response, or MLR), and late components (i.e ., P1, N1, P2) are exam-ples of exogenous components .
*Communications Disorders Program, University of Vir-ginia, Charlottesville, Virginia
Reprint requests : Susan D . Dalebout, 2205 Fontaine Avenue, Suite 202, Charlottesville, VA 22906 ; Tel : (804) 924-4618 ; Fax : (804) 924-4621
Endogenous or event-related potentials also are triggered by external events ; however, their variance is primarily determined by variations in the task assigned to the subject. An example is the P300 component, which, given an appro-priately structured task, follows the exogenous P1, N1 and P2 components . The P300 is typically elicited in an oddball paradigm in which a task-relevant, oddball (target) stimulus occurs ran-domly within a series of repeating (nontarget) stimuli that occur more frequently. The subject is asked to respond to target events in some manner (e.g ., by silently counting the target stimuli or by pressing a button upon hearing the target stimuli) . Whereas the obligatory P1, N1, and P2 components are elicited by both target and nontarget stimuli, generation of a P300 component requires attention to, and discrimi-nation of, stimulus differences . Therefore, the P300 component is evident in the averaged response to target stimuli but not in the aver-aged response to nontarget stimuli.
In a typical EP paradigm, variation in a waveform component (e .g., latency or ampli-tude) is associated with experimentally manip-ulated variables of interest (e .g ., stimulus
342

Variability of AEPs/Dalebout and Robey
intensity or task difficulty) or with subject trait variables (e.g ., subject age or cognitive ability) . However, as Segalowitz and Barnes (1993) noted, there are additional variance components related to variables that are neither manipulated nor measured by an experimenter. For example, a subject's arousal level may vary from one exper-imental trial to the next but may not be a vari-able in the experimental design. Segalowitz and Barnes (1993) also recognized as a source of variance the inherent unreliability of the wave-form components themselves, that is, instabil-ity in the generation of specific components and the difficulty involved in identifying and mea-suring those components .
Segalowitz and Barnes (1993) conceptualized the variance in an evoked potential measure as a combination of several factors :
2 2 2 2 2 Q EP - Q TRAIT + Q STIM + (T STATE + Q MEASURE
where Q2 EP is the variance in the EP-dependent measure of interest, such as component ampli-tude or latency ; Q2 TRAIT represents stable char-acteristics of the subject that may affect the EP outcome ; U2STIM represents the various stimulus factors that may affect the EP outcome ; U2 STATE represents aspects of the subject's psychological or physiologic state that may affect the EP, inde-pendent of any manipulation in the experi-mental paradigm; and Q2 MEASURE represents the measurement error, which also includes the instability of the components themselves.
Most investigations involve manipulation of the variance due to subject trait (e.g., subject gen-der or patient diagnosis) or changes in the exper-imental paradigm (e.g ., properties of the stimulus or salience of the target) . The expectation is that the uncontrolled variance due to subject state (e.g., high vs low levels of arousal) and mea-surement error will be sufficiently overwhelmed by the strength of the manipulated variance component to unambiguously reveal the rela-tionship of interest (Segalowitz and Barnes, 1993) . However, the combination of the last two variance components (Q2 STATE and
o.2 MEASURE) is
critical because it limits the validity of the EP measure as a true indicator of any hypothesized effect .
EP variability has been studied indirectly by assessing test-retest reliability and expressed using a variety of reliability coefficients (Roth et al, 1975; Lewis, 1984 ; Sklare and Lynn, 1984 ; Polich, 1986 ; Fabiani et al, 1987; Kileny and Kripal, 1987 ; Karniski and Blair, 1989 ; Pollock and Schneider,1992 ; Sinha et al, 1992; Segalowitz
and Barnes, 1993). Although these studies rep-resent different methodologies and their findings cannot be compared directly, their collective results have indicated that N1, P2, and P300 latencies and amplitudes are reproducible for groups of normal subjects over multiple trials within a single session, as well as over multiple sessions separated by as much as 2 years.
Only Lauter et al (Lauter and Loomis, 1986, 1988 ; Lauter and Karzon, 1990a, 1990b) have conducted investigations in which the variance in latency and amplitude characteristics of var-ious waveform components has been assessed directly, both among (intersubject variability) and within subjects (intrasubject variability). Mea-sures of intersubject and intrasubject variabil-ity were expressed using the coefficient of stability (CS), the reciprocal of the coefficient of variation (CV) . The more conventional coeffi-cient of variation is the standard deviation expressed as a percentage of the corresponding mean (i .e ., the standard deviation divided by the mean). In the Lauter et al studies, an inter-subject CS for each peak was calculated by com-puting a CS for each session using data from all subjects . The mean of the values for each of eight sessions became the mean intersubject CS for each peak . An intrasubject CS for each peak was calculated for each subject across all eight sessions . The mean of the values from each subject became the mean intrasubject CS for each peak .
Lauter and Loomis (1986, 1988) studied the variance of ABR waveform components exclu-sively. Lauter and Karzon (1990a, 1990b), how-ever, compared the intersubject and intrasubject variability of a variety of waveform components (ABR components I, II, III, IV, V; MLR compo-nents No, Po, Pa, Nb; and late components Nl, P2, and N2). In the latter studies, ABR and MLR data were collected from subjects in one group (N = 7) and ABR and late response data were collected from subjects in a second group (N = 8). For latency (Lauter and Karzon, 1990a), CVs were distributed trimodally, with ABR peak V in one category, characterized by low intra-subject variability and high intersubject vari-ability; ABR peaks II, III, and IV and MLR peak No in a second category of intermediate intra-subject variability and high intersubject vari-ability; and ABR peak I and all other peaks in a third category, in which intrasubject vari-ability approached intersubject variability. Inter-subject variability exceeded intrasubject variability for all waveform components and was relatively constant across waveform
343

Journal of the American Academy of Audiology/Volume 8, Number 5, October 1997
components . Intrasubject variability was sig-nificantly less for the early (ABR) components (except wave 1) than for the middle and late components .
Results were similar for amplitude vari-ability. Lauter and Karzon (1990b) reported that intersubject variability was equally great for all peaks but there were significant differences in intrasubject values, with ABR peak V show-ing less amplitude variability than any of the other peaks. As with latency, there was a tri-modal distribution of amplitude variability val-ues: the variability ofABR peak V was less than that of ABR peaks 1, 11, III, and IV, which were less variable than all MLR and late EPs. In all cases, amplitude variability exceeded latency variability and, as with latency, intersubject variability exceeded intrasubject variability.
The studies of Lauter et al did not include measurement of the endogenous potential, P300 . The variability of endogenous potentials might be expected to differ from that of exogenous potentials (e .g., Michalewski et al [19861 sug-gested that N1-P2 and N2-P3 represent inde-pendent, perhaps parallel, processing phases). Also, although Lauter and Karzon (1990a, 1990b) compared the intersubject and intrasubject vari-ability of ABR components, MLR components, and late components, comparisons across wave-form components were not made for the same subjects . That is, ABR and MLR data were col-lected from one group of subjects and ABR and late evoked response data were collected from another group of subjects .
Thus, the general purpose of the present study was to extend the findings of Lauter and Karzon (1990a, 1990b) to include the P300 cor-tical event-related potential. Furthermore, this study was designed to compare the variability of the P300 to that of more familiar ABR and MLR components in the same group of subjects .
The specific purposes of the present study were to :
1 . quantify the intersubject and intrasubject variability associated with the amplitude and latency of the P300 cortical event-related potential . With subject-trait and stimulus variables held constant, measures of inter-subject and intrasubject variability should represent the variance components, uIsTATE and 0r2 MEASURE' described by Segalowitz and Barnes (1993) ;
2 . compare the intersubject and intrasubject variability associated with the P300 corti-cal event-related potential to that of early
(ABR waves 1,111, V) and middle (MLR com-ponent Pa) latency potentials ;
3. determine whether the relationship between amplitude and latency variability observed in the ABR extends to the P300 ;
4. explore whether unique patterns of vari-ability across waveform components exist for individual subjects ; and
5. explore whether trends in P300 latency or P300 amplitude are observed over multiple sessions in individual subjects .
In the absence of information about the variability of the P300 in individual subjects, any potential it may have as a clinical tool cannot be realized . However, if this response is shown to be sufficiently stable in individual subjects, it may be useful as a means for identifying indi-viduals whose ability to use auditory informa-tion is delayed or disordered (e.g., Jirsa and Clontz, 1990) or as a pretreatment versus post-treatment measure (Jirsa, 1992). Whereas dif-ferences in the P300 have been demonstrated for groups of disordered subjects, information regarding variability among and within indi-vidual subjects is a prerequisite for clinical use.
METHOD
E ight female graduate students between the ages of 21 and 24 years served as subjects .
All subjects reported a negative history of head trauma and neurological disorders at the time of testing. All were right-handed (as per subject report). Each demonstrated normal hearing sen-sitivity (pure-tone air-conduction thresholds of 20 dB HL or better) and normal middle ear func-tion (normal tympanograms bilaterally) .
Each subject was tested in six separate weekly sessions . Each subject's sessions were scheduled at the same time of day and on the same day of the week . Hearing and middle ear function were screened prior to each session.
Each session comprised a collection of two trial blocks each of ABR, MLR, and P300 poten-tials for one ear. As a result, the experimental design comprised two within factors: sessions (six levels) and trials (two levels), yielding a total of 12 measurement occasions . The ear condition (right ear vs left ear) was randomized across ses-sions, with the constraint that each ear was tested on an equal number of occasions (i .e ., six trials in three sessions). P300 potentials were always collected first in an effort to maximize subject attention and level of arousal. ABR and
344

Variability of AEPs/Dalebout and Robey
MLR testing followed ; the order was randomized across sessions .
The test parameters used to collect ABR, MLR, and P300 data are shown in Table 1. Stim-uli were presented monaurally through an Ety-motic ER-3A insert earphone . Evoked and event-related responses were recorded between the vertex and ipsilateral earlobe (Cz/Al or Cz/A2, depending on the ear tested during a given session), with the forehead as ground. Electrode impedances were maintained below 3000 ohms. Interelectrode impedances did not exceed 1000 ohms . During P300 data collection, subjects were asked to press a button upon hear-ing the oddball tone. Subjects were asked to recline and relax during ABR and MLR testing.
During P300 testing, eye artifact was recorded with a bipolar electrode montage, using supraorbital and infraorbital electrodes around the left eye. Single trials contaminated by eye movement (+ 100 [V) were eliminated from the averaged responses. In addition, eye artifact was removed from the data by applying an auto-matic ocular artifact reduction algorithm offline . The recording epoch for the P300 response included a 50-msec prestimulus baseline and a 738-msec post-stimulus period . Single trial responses were referenced to the prestimulus baseline and linear trends were removed from the data prior to averaging. Responses elicited by nontarget stimuli and those elicited by tar-get stimuli were averaged separately offline .
Waveform Analysis
P300 responses were analyzed indepen-dently by a panel of three evaluators . Visual identification of the P300 component was based on a comparison between the averaged response to nontarget stimuli and the averaged response to target stimuli. Specifically, the N1 compo-nent in the averaged response to target stimuli was overlaid on the N1 component in the aver-aged response to nontarget stimuli; the second positive peak obvious in the response to target, stimuli, occurring between 250 to 500 msec, was identified as the P300 component. Although this component occasionally was discernible in the response to nontarget stimuli as well, it was of notably smaller amplitude in the nontarget response . Each evaluator was asked to rate the level of confidence (0- to 3-point scale) associated with their visual identification of the P300 com-ponent. Waveforms in which identification of the P300 component received a mean confidence rating of less than "2" ("confident; although waveform component is more difficult to iden-tify") were eliminated from further analysis .
P300 components tend to be broad and mul-tipeaked . Thus, an intersect method was chosen for determining latency (Sklare and Lynn, 1984 ; Kileny and Kripal, 1987; Wall et al, 1991). In this study, the latency value (in msec) taken from the point at which the leading slope of the visually identified P300 component crossed the baseline
Table 1 Stimulus and Acquisition Parameters for ABR, MLR, and P300 Data Collection
Parameter ABR MLR P300
Stimulus Rarefaction click Alternating click Pure tone Nontarget frequency 1000 Hz Target frequency 2000 Hz Nontarget/target probability ratio 85/15 (Pseudorandom sequence with two constraints)
Stimulus duration 100 ,sec 100 wsec 90 msec (30 msec rise/fall)
Recording window -3 to 15 msec -3 to 100 msec -50 to 738 msec Number of sweeps 2000 1500 250 Stimulus rate 11 .3/sec 7 .1 /sec 1 .1 /sec Stimulus intensity 80 dB nHL 80 dB nHL 80 dB nHL Filter settings 100-3000 Hz 30-1500 Hz 1-100 Hz Electrode montage Cz/A1 or Cz/A2 Cz/A1 or Cz/A2 Cz/A1 or Cz/A2
Forehead Forehead Forehead ground ground ground
EOC* Subject's task None None Button press in
response to target
*Electro-ocular (eye artifact) channel: supra- and infraorbital electrodes around the left eye .
345

Journal of the American Academy of Audiology/Volume 8, Number 5, October 1997
was subtracted from the latency value taken from the point at which the trailing slope crossed the baseline . This value was then divided in half and the quotient was added to the latency value taken from the point at which the leading slope crossed the baseline . The resultant latency value approximated the midpoint of the wave-form component, although it did not necessar-ily coincide with the component peak . Amplitude was determined by comparing the maximum positive amplitude of the P300 component to the maximum negative amplitude of the peak that preceded it (i .e ., N2). Measures of peak-to-peak amplitude have been shown to be more stable than peak-to-baseline measures (Sega-lowitz and Barnes, 1993).
ABR and MLR data were analyzed inde-pendently by two evaluators . Component latency (in msec) was defined as the most positive point on the visually identified waveform peak, using the microvoltages associated with each sam-pling point to make the determination. For cases in which there was a plateau in amplitude at the apex of a peak, as determined by the microvolt values, the point in the middle of the plateau (for a plateau consisting of an odd number of data points) or the point to the right of the middle point (for a plateau consisting of an even num-ber of data points) was selected (J . L. Lauter, per-sonal communication, July 27, 1995) . This method was chosen for two reasons: (a) using microvoltages to select the most positive point on a waveform component, rather than select-ing it visually, is completely objective and there-fore likely to be highly reliable ; and (b) this method could be used to determine the latency of all of the early and middle components ana-lyzed in this study.
For the ABR components, peak-to-peak amplitude was determined by comparing the maximum positive amplitude of the component peak to the maximum negative amplitude of the peak (i .e ., trough) that followed . For the Pa component of the MLR, peak-to-peak amplitude was computed by comparing the maximum pos-itive amplitude of the Pa component peak to the maximum negative amplitude of the peak (i .e ., trough) that preceded it.
Coefficients of Variation
By definition, the scales of measurement for Wave V and P300 latencies (i .e ., the range of times) are vastly different. A distribution of val-ues centered around 5 msec has a smaller vari-ance than a distribution centered around 300
msec due to nothing more than differences in scale. Also, because the amplitude values of some waveforms are very differently scaled than those of others, the same problem extends to questions regarding variability in that domain as well .
As Lauter and Karzon (1990a, 1990b) pointed out, the solution to this mathematical problem is to compare the values of coefficients of variation rather than those of raw variances . Similar to the way that two very differently scaled raw scores (e.g ., height and weight) can be compared by means of a standard-score trans-formation (e.g., a z score) that converts both observations to values sharing a common scale (in the case of z scores, a mean of zero and a stan-dard deviation of unity), differently scaled vari-ances are compared through transformation to standard-scale values in the form of coefficients of variation. In this way, a comparison of indices of relative variability was made possible through the transformation of raw variances to coeffi-cients of variation.
For each waveform component (i .e ., wave I, wave III, wave V Pa, and P300), 12 amplitude measures (two trials on each of six measurement occasions) and 12 latency measures were obtained for each subject. As a result, 60 data points for amplitude (12 amplitude measures for each of five waveform components) and 60 data points for latency were obtained for each subject. In all calculations, amplitude values and latency values were treated separately.
Intrasubject variability of amplitude for wave I was indexed as the coefficient of varia-tion (CV) for all 12 wave I amplitude values obtained from a particular subject. The same cal-culations were carried out on the amplitude data obtained from that subject for each of the remaining four waveform components . The same set of calculations was then carried out for that subject's latency data. The entire process was then repeated for each subject. As a result, 10 intrasubject coefficients of variation were cal-culated for each subject: an amplitude CV for each of five waveform components and a latency CV for each of those five components .
Coefficients of variation also indexed inter-subject variability. Beginning again with the wave I amplitude data obtained from a partic-ular subject, a mean~was calculated for the 12 values . This pooled value was then treated as the best estimate of wave I amplitude for that sub-ject . This preliminary calculation on amplitude was carried out for each of the remaining four waveform components . As a result, the 60
346
Variability of AEPs/Dalebout and Robey
amplitude values for a subject (i .e ., 12 observa-tions of five waveform components) were reduced to five best estimates of peak amplitude for that subject (i .e ., one for each waveform component). The process was repeated for latency values obtained from the same subject. The entire process was then carried out for each subject. The intersubject CV for wave I amplitude was cal-culated on eight data points : one best estimate of wave I amplitude given by each subject. Inter-subject CVs were calculated for the amplitudes and latencies of each waveform component.
In summary, each intrasubject CV was cal-culated from 12 raw data points yielding five amplitude CVs (i .e ., one for each waveform com-ponent) and, similarly, five latency CVs for each of eight subjects . Each intersubject CV was cal-culated from eight average values (i.e., the means of 12 measurements for each of eight subjects) yielding a total of five amplitude CVs and five latency CVs .
hypothesis was rejected . A third preliminary analysis examined for systematic influence on the variances obtained in each of the six sessions . No session differences were found among the wave 1, wave III, wave V or P300 data . The Pa data resulted in four rejections of the null hypoth-esis . For amplitude data, Session 4 yielded a sig-nificantly smaller variance. than all others and Session 6 yielded a significantly larger variance than all others . A similar outcome characterized the Pa latency data : the smallest (Session 1) and the largest (Session 3) of the variances were significantly different from the remaining ses-sion variances. Obviously, no pattern charac-terizes these differences in Pa session variances; furthermore, the total number of rejections is proportionately below the level expected due to chance ; nevertheless, the fact that only Pa evinced unusually large and small variances over sessions does not seem to be a random occurrence .
RESULTS
Preliminary Examination of the Raw Data
To test for the possibility of systematic influ-ence among values obtained from left ears ver-sus those obtained from right ears, each left-right pair of variances was submitted to a statistical test of the null hypothesis that two variances equal one another (Dowdy and Wearden, 1983). For example, a variance of like values obtained from the left ear (e.g., all left ear amplitude val-ues for wave I in Trial 1 of all sessions) was tested as being different from the analogous set of right ear values (e.g ., all right ear amplitude values for wave I in Trial 1 of all sessions). This left-versus-right comparison of variances for wave I amplitude data was repeated for values obtained in Trial 2 of all sessions . The process was then repeated for each waveform component. The entire process was then carried out on latency values . Each left-right comparison was tested with Type I error tolerance set at 0.05 as a liberal criterion for left-right difference . None of the left-right comparisons caused the null hypothesis to be rejected . On that basis (i .e ., having no evidence that the variances of left and right observations differed), the left-right distinction was ignored in subsequent analy-ses.
The possibility of a systematic influence on the variances of Trial 1 observations versus variances of Trial 2 observations was examined in the same fashion. Once again, not one null
P300 Intersubject Variability versus P300 Intrasubject Variability
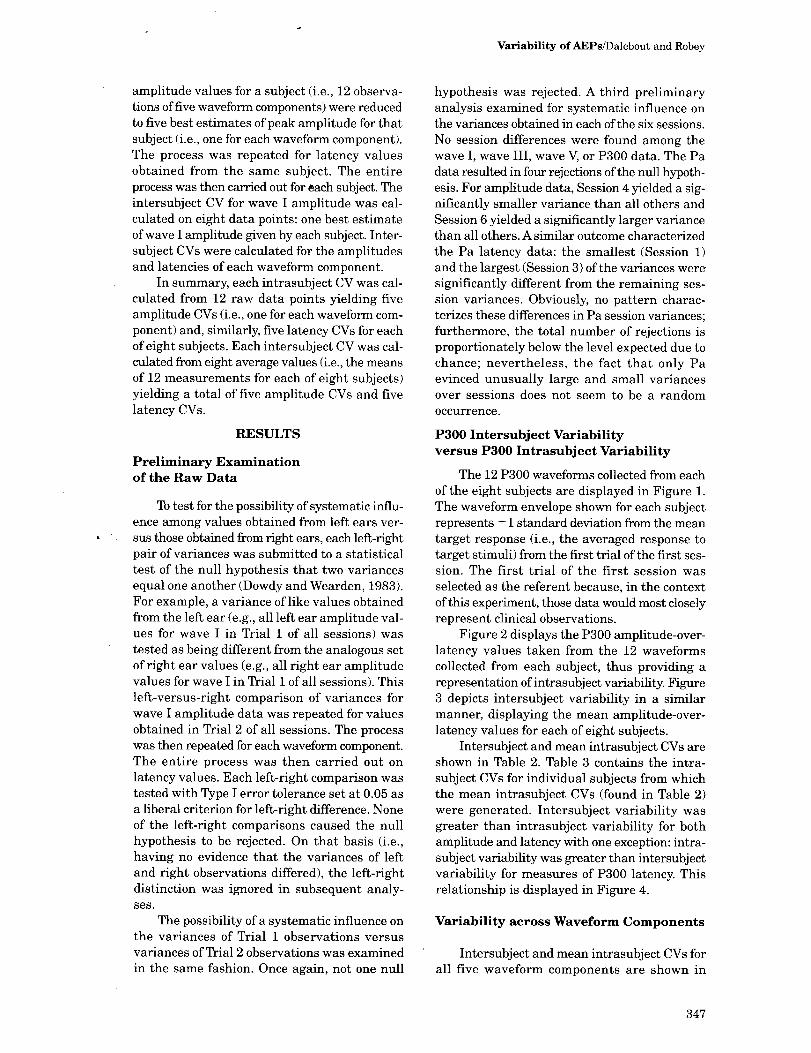
The 12 P300 waveforms collected from each of the eight subjects are displayed in Figure 1. The waveform envelope shown for each subject represents -} 1 standard deviation from the mean target response (i .e ., the averaged response to target stimuli) from the first trial of the first ses-sion . The first trial of the first session was selected as the referent because, in the context of this experiment, those data would most closely represent clinical observations .
Figure 2 displays the P300 amplitude-over-latency values taken from the 12 waveforms collected from each subject, thus providing a representation of intrasubject variability. Figure 3 depicts intersubject variability in a similar manner, displaying the mean amplitude-over-latency values for each of eight subjects .
Intersubject and mean intrasubject CVs are shown in Table 2 . Table 3 contains the intra-subject CVs for individual subjects from which the mean intrasubject CVs (found in Table 2) were generated. Intersubject variability was greater than intrasubject variability for both amplitude and latency with one exception: intra-subject variability was greater than intersubject variability for measures of P300 latency. This relationship is displayed in Figure 4.
Variability across Waveform Components
Intersubject and mean intrasubject CVs for all five waveform components are shown in
347

Journal of the American Academy of Audiology/Volume 8, Number 5, October 1997
60
20
0
E -20 Q
-40
Q -40
0 100 200 300 400 500 600 700 800 0 100 200 300 400 500 600 700 800
0 100 200 300 400 500 600 700 800 0 100 200 300 400 500 600 700 800
-40 0 100 200 300 400 500 600 700 800 0 100 200 300 400 500 600 700 800
Latency in msec Latency in msec
Figure l Twelve P300 waveforms collected from each of eight subjects (A-H) on six measurement occasions . The wave-form envelope shown for each subject represents ±1 standard deviation from the subject's mean (averaged) response to deviant stimuli from the first trial of the first session.
Table 2. Intersubject and intrasubject variabil-ity were less for wave V than for any other wave-form component, both in terms of amplitude and latency. For measures of latency, the inter-
60
40
20
0 100 200 300 400 500 600 700 800 0 100 200 300 400 500 600 700 800
subject CVs for wave V, wave III, and P300 were similar and markedly smaller than those for wave I and Pa. For measures of amplitude, the intersubject CVs for wave V and P300 were
348

Variability of AEPs/Dalebout and Robey
0 100 200 300 400 500 600 700 800
.Q -20
E Q -40 L-~
0 100 200 300 400 500 600 700 800
0 100 200 300 400 500 600 700 800
0 100 200 300 400 500 600 700 800
Latency in msec
60
40
20
0
-20
0 100 200 300 400 500 600 700 800
0 100 200 300 400 500 600 700 800
0 100 200 300 400 500 600 700 800
-40 0 100 200 300 400 500 600 700 800
Latency in msec
Figure 2 Individual data points representing amplitude-over-latency values taken from 12 P300 waveforms collected from each of eight subjects (A-H).
similar and somewhat smaller than those of the other three components . Trends were different when intrasubject CVs were compared across
waveform components . For both measures of amplitude and latency, the intrasubject CVs for all three of the ABR waveform components
349

Journal of the American Academy of Audiology/Volume 8, Number 5, October 1997
60
-40
0
~ r----------- 0 100 200 300 400 500 600 700 800
Latency in msec
Figure 3 Data points representing mean P300 ampli-tude-over-latency values for each of eight subjects (A-H).
(waves I, III, V) were similar to one another and smaller than those of Pa and P300 . These relationships are displayed in Figure 4.
Amplitude Variability versus Latency Variability
Intersubject and mean intrasubject CVs for amplitude and latency are shown in Table 2. Measures of amplitude were considerably more variable than measures of latency for all five waveform components . This was true for both intersubject (i .e ., intersubject amplitude CVs vs intersubject latency CVs) and intrasubject (i .e ., intrasubject amplitude CVs vs intrasubject latency CVs) comparisons. At the very least, amplitude was nearly three times as variable as latency (Pa) ; however, for wave III, amplitude was greater than 15 times more variable than latency (intersubject comparison). The relative differences between amplitude and latency were greatest for waves III and V when intersubject values were compared . These relationships are displayed in Figure 4.
Patterns of Variability for Individual Subjects
Unique patterns of variability across wave-form components were not apparent for indi-vidual subjects (see CVs for individual subjects contained in Table 3) . For example, patterns of unusually high or unusually low variability across all waveform components were not observed for any subject, nor were patterns of relatively greater variability at higher levels of the auditory system than at lower levels (or vice versa) .
Trends in P300 Amplitude and Latency across Multiple Sessions
Clear trends in P300 amplitude and latency were not observed across multiple sessions . That is, trends toward increased versus decreased amplitude or increased versus decreased latency were not observed in individual or group data over multiple sessions .
DISCUSSION
~t tandard deviations computed from P300 amplitude and latency measurements taken in the present study are compared to previously reported values in Table 4. The values included in Table 4 were taken from studies in which the subjects were young adults . The values are suf-ficiently similar to establish the validity of the present results.
P300 Intersubject Variability versus P300 Intrasubject Variability
Lauter and Karzon (1990a, b) reported that for the EPs measured in their study, intersub-ject variability was always greater than intra-subject variability. They reported that this was true at all levels of the auditory system, from
Table 2 Intersubject and Mean Intrasubject Coefficients of Variation (CVs) Derived from Amplitude and Latency Measurements Taken from Five Waveform Components
Amplitude
Waveform Component Intersubject
Wave I 43 .41 Wave 111 42.75 Wave V 33.88 MLR Pa 42.03 P300 37.94
Latency
Intrasubject Intersubject Intrasubject
14 .6 11 .52 2 .2 16 .7 2.75 2.0 13 .7 2.64 1 .6 24.9 14.86 8.9 31 .7 3.94 5 .6
350

Variability of AEPs/Dalebout and Robey
Table 3 Individual Intrasubject Coefficients of Variation (CVs) for Amplitude (Amp) and Latency (Lat) for each Waveform Component
Subject Wave
Amp
1
Lat
Wave
Amp
111
Lat
Wave
Amp
V
Lat
Pa
Amp Lat
P300
Amp Lat
1 38 .5 2 .9 3$ .6 2 .8 17 .6 2 .5 55 .6 15 .4 22 .1 4 .4 2 8 .7 1 .5 20 .5 2 .4 19 .3 1 .1 21 .9 11 .3 50 .4 2.9 3 12 .1 1 .4 20 .2 6 .2 9 .6 2 .1 19 .6 4 .9 27.9 6 .5 4 6 .6 3 .8 10 .9 1 .4 36 .7 2 .8 20 .3 4 .0 27.3 13 .3 5 17 .9 1 .7 16 .6 0 .9 4 .7 1 .1 22 .7 9 .1 17 .8 3 .9 6 8 .4 2 .2 11 .2 0 .9 8 .7 2 .4 14.9 8 .5 20.4 6 .3 7 8 .1 2 .2 5 .9 0 .6 5 .8 0 .4 28 .5 4 .1 64 .0 4 .7 8 16 .8 1 .6 13 .6 1 .0 7 .4 0 .8 16 .0 13 .8 24 .0 3 .2
auditory nerve to cortex, and observed in both amplitude and latency data . This trend is also evident in data from the present study, with one noteworthy exception: for latency, P300 intrasubject variability was greater than inter-subject variability. Whether this unexpected finding is unique to the small sample of subjects used in this study requires further investigation .
Lauter and Karzon (1990a, b) reported that subjects look more like themselves than like each other; apparently, this is true whether ABR waveform components, MLR waveform compo-nents, or P300 waveforms are used as the index. Figure 1 displays the P300 waveforms of eight subjects collected over 12 trials . Despite the fact that a comparison between the intersubject and intrasubject CVs for latency suggests that P300 intrasubject variability exceeds intersubject variability, multiple waveforms from individ-ual subjects are remarkably similar yet clearly distinctive when compared to those collected from other subjects . Further, multiple wave-forms collected from the same subject tend to fit within an envelope bounded by ± 1 standard deviation from the mean target response (i .e ., the
t Intersubject amplitude Intrasubject amplitude
t Intersubject latency Intrasubject latency
III V Pa P300
Waveform Component
Figure 4 Intersubject and mean intrasubject coeffi-cients of variation (CVs) for amplitude and latency for each of five waveform components .
averaged response to target stimuli) from the first trial. This suggests, for example, that a P300 waveform might be collected from a patient prior to the initiation of an intervention proto-col and additional waveforms might be collected during and following training . Without inter-vention, the post-training P300 waveform might be expected to fall within -} 1 standard deviation from the pretraining mean . Variation beyond this envelope might indicate change beyond that associated with normal variability. Obviously, further experimentation is required to refine the clinical reference.
It should be noted that the present find-ings and their implications are limited to sim-ple stimuli presented in a simple paradigm . The use of more complex stimuli (e.g ., speech) pre-sented in more complex paradigms may increase both the intersubject and intrasubject variabil-ity of the P300 .
Differences in Variability across Waveform Components
It has been assumed that long-latency EPs are more variable than the brief, early potentials (Sklare and Lynn, 1984 ; Jerger and Jerger, 1985 ;
Table 4 P300 Latency and Amplitude Standard Deviations from Six Investigations
in Which Subjects Were Young Adults
Study Amplitude SD Latency SD
Kileny and Kripal (1987) 5.67*A" 35.02 msec Michalewski et al (1986) Not reported 25 .1 Polich (1986) 4.831 26.95 Segalowitz and 8.651 24.02
Barnes (1993) Sklare and Lynn (1984) Not reported 15 .35 Present study 8.24* 20.61
*Peak-to-peak amplitude measurement ; speak-to-baseline amplitude measurement .
351

Journal of the American Academy of Audiology/Volume 8, Number 5, October 1997
Jirsa and Clontz, 1990; Hall, 1992 ; Jirsa, 1992 ; Kraus and McGee, 1992, 1994; Butcher, 1994 ; Musiek et al, 1994). In particular, it has been assumed that endogenous potentials (e .g ., P300) are more variable than exogenous, obligatory potentials (e .g ., components of the ABR). How-ever, results from this study suggest that the intersubject variability of the P300 event-related potential is remarkably similar to that of the most stable components of the ABR (i.e ., Waves III and V), both in terms of amplitude and latency. With the effects of scale removed, the intersubject variability of P300 is far more sim-ilar to that of ABR waves III and V than it is to that of Pa. Thus, the intersubject variability EPs does not become progressively greater at higher levels of the auditory system .
In contrast to intersubject variability, the intrasubject variability associated with P300 appears to be considerably greater than that of the ABR components, both in terms of amplitude and latency. This observation is not surprising given that a subject's responses to identical stimuli are not likely to be static at the level of the cortex. As higher levels of the auditory sys-tem are engaged, inputs presumably are not automatically switched to outputs; rather, the system is dynamic, continuously generating hypotheses about the environment and allocat-ing available resources to various tasks. Indeed, it was anticipated that intrasubject variability would be greater for the P300 cortical event-related potential than for early responses gen-erated in the brain stem . However, despite the fact that the intrasubject variability of the P300 was greater than that of the early components, multiple waveforms collected from the same subject on multiple occasions were remarkably similar.
Lauter and Karzon (1990a, b) compared and contrasted the variability of ABR compo-nents I, II, III, IV, V; MLR components No, Po, Pa, Nb ; and late components N1, P2, and N2. The variability of P300 was not measured. Dramatic differences in variability across waveform com-ponents were reported, both in terms of ampli-tude and latency. These differences were seen primarily in intrasubject variability : the intra-subject variability associated with wave V was less than that of any other component, and the intrasubject variability of the early components in general (i .e ., waves I, II, III, IV, V) was markedly less than that of the middle and late components . Intersubject variability was greater than intrasubject variability and (for latency) the variability of wave I was significantly greater
than that of the other ABR components (Lauter and Loomis, 1986 ; Lauter and Karzon, 1990a) . Results from the present study are consistent with those findings .
In the present study, the variability of com-ponent Pa was greater than that of the other waveform components in nearly every compar-ison . Only in the intersubject amplitude vari-ability comparison, in which differences in variability across waveform components were relatively small, was the variability of Pa less than that of any other component(s) (waves I and III) . Thus, for this small sample, variabil-ity did not increase as successively higher lev-els of the auditory system were engaged; rather, the variability associated with the Pa component of the MLR was exceptional. This suggests that further investigation of Pa as a clinical tool is warranted.
Clinical use of the ABR typically involves obtaining one or more averaged responses from a subject, measuring the latency of individual peaks, then comparing the peak latencies (and derivations thereof, such as interpeak laten-cies) to a set of normative values (Oyler et al, 1991). Because of the high degree of intersub-ject variability presumably associated with the later potentials, the suitability of such a model for interpretation of P300 data has been ques-tioned . However, the results of the present study suggest that, with additional refinement, such a model might indeed be viable . For example, when the mean amplitude-over-latency values for all eight subjects in this study are compared (see Fig. 3), they fall within a reasonably nar-row range. Critical to the successful use of such a model, however, would be the consistent appli-cation of strict criteria for determining amplitude and latency values . Since P300 waveform com-ponents tend to be broad and multipeaked, use of an intersect or midpoint method to determine latency is recommended (Wall et al, 1991).
Amplitude Variability versus Latency Variability
There exists a large body of research in which the characteristics of P300 responses obtained from groups of disordered subjects have been compared to those obtained from groups of nondisordered subjects . For example, the P300 has been studied in groups of subjects with Alzheimer's disease and other dementing illnesses, cerebrovascular lesions, aphasia, head trauma, brain tumors, epilepsy, multiple scle-rosis, autism, schizophrenia, Parkinson's disease,
352

Variability of AEPs/Dalebout and Robey
alcoholism, Down syndrome, central auditory processing deficits, reading disabilities, hyper-activity, and other disorders. In many of these studies, patient groups have demonstrated P300 amplitude characteristics that differ from those of nonpatient groups . Results of the present study suggest that such amplitude findings should be interpreted with caution. Although con-tinued research may reveal that variations in P300 amplitude reflect differences in the allo-cation of attentional resources, task difficulty, confidence in a response, or other cognitive fac-tors, the usefulness of P300 amplitude data for the diagnosis of individual patients or for dif-ferential diagnosis of various disorders may be limited by its variability.
SUMAL4,RY
T he major findings of this study were as follows:
are compared, subjects look more like them-selves than like one another. Perhaps even more remarkable, responses collected from individual subjects, even endogenous responses, can be compared to those of other subjects . Although the responses of individuals look different from one another, they are similar when reduced to strictly defined amplitude and latency values . Thus, although the human brain processes information flexibly, and therefore variably, even responses generated at the highest levels of the auditory system appear to be repeatable within subjects . and comparable among subjects .
Acknowledgments. The authors wish to thank Dr. Roger Ruth, Dr. Janet Stack, and three anonymous reviewers for their helpful suggestions regarding an ear-lier version of this manuscript. We are also grateful to Lisa Hamstead for her assistance in data analysis .
Portions of this paper were presented at the 1995 American Speech-Language-Hearing Association Con-vention, Orlando, FL .
1. In general, intersubject variability was greater than intrasubject variability for all waveform components . Despite the fact that, for latency, the P300 intrasubject CV exceeded the intersubject CV, multiple wave-forms from individual subjects were remark-ably similar yet clearly distinctive when compared to those from other subjects .
2. P300 intersubject variability was compara-ble to that of the most stable ABR compo-nents, both in terms of amplitude and latency.
3. Intrasubject variability was considerably greater for P300 than for the ABR compo-nents; even so, multiple waveforms collected from the same subject tended to fit within an envelope bounded by ± 1 standard devi-ation from the averaged (mean) response to target stimuli.
4. Using strict criteria for determining P300 amplitude and latency values, data points fell within a reasonably narrow range when compared among and within subjects .
5. The variability of the MLR component, Pa, was exceptional.
6. Amplitude was markedly more variable than latency for all waveform components .
The results of the present study suggest that despite the brain's tremendous capacity for flexibility, which manifests as variability, averaged responses from individual subjects are stable and repeatable . That is, when waveforms
REFERENCES
Butcher J. (1994) . Cognitive auditory responses . In : Jacobson JT, ed . Principles and Applications in Auditory Evoked Potentials . Needham Heights, MA: Allyn and Bacon, 219-235.
Dowdy S, Wearden S. (1983). Statistics for Research . New York : Wiley & Sons .
Fabiani M, Gratton G, Karis D, Donchin E. (1987) . Definition, identification, and reliability of measurement of the P300 component of the event-related brain poten-tial . In : Ackles PK, Jennings JR, Coles MGH, eds . Advances in Psychophysiology. Vol. 2. London : JAI Press, 1-78 .
Hall JW (1992) . Handbook ofAuditory Evoked Responses. Needham Heights, MA : Allyn and Bacon, 3-41 .
Jerger J, Jerger S. (1985). Audiologic applications of early, middle, and late auditory evoked potentials . Hear J 38:31-36 .
Jirsa RE . (1992) . The clinical utility of the P3 AERP in children with auditory processing disorders. J Speech Hear Res 35:903-912 .
Jirsa RE, Clontz KB . (1990) . Long latency auditory event-related potentials from children with auditory processing disorders. Ear Hear 11 :222-232 .
Karniski W Blair RC . (1989) . Topographical and tempo-ral stability of the P300 . Electroencephalogr Clin Neurophysiol 72:373-383 .
Kileny PR, Kripal JP. (1987) . Test-retest variability of auditory event-related potentials . Ear Hear 8:110-114 .
Kraus N, McGee T. (1992) . Electrophysiology of the human auditory system . In : Fay D, Popper A, eds. The Mam-malian Auditory System . Vol. 2. New York : Springer-Verlag, 335-403.
353

Journal of the American Academy of Audiology/Volume 8, Number 5, October 1997
Kraus N, McGee T. (1994) . Mismatch negativity in the assessment of central auditory function . Am J Audiol 3:39-49 .
Musiek FE, Baran JA, Pinheiro ML, (1994) . Neuro-Audiology: Case Studies, San Diego: Singular Publishing Company, 20-21.
Lauter JL, Karzon RG. (1990a). Individual differences in auditory electric responses: comparisons of between-subject and within-subject variability. IV. Latency-variability comparisons in early, middle, and late responses. Scand Audiol 19:175-182 .
Lauter JL, Karzon RG . (1990b). Individual differences in auditory electric responses: comparisons of between-subject and within-subject variability. V. Amplitude-variability comparisons in early, middle, and late responses. Scand Audiol 19:201-206 .
Lauter JL, Loomis RL . (1986) . Individual differences in auditory electric responses: comparisons of between-sub-ject and within-subject variability. I . Absolute latencies of brainstem vertex-positive peaks. Scand Audiol 15 : 167-172.
Lauter JL, Loomis RL. (1988) . Individual differences in auditory electric responses: comparisons of between-sub-ject and within-subject variability. II . Amplitude of brainstem vertex-positive peaks. Scand Audiol 17:87-92 .
Lewis GW (1984) . Temporal stability of multichannel, multimodal ERP recordings . Int J Neurosci 25:131-144 .
Michalewski HJ, Prasher DK, Starr A. . (1986) . Latency variability and temporal interrelationships of the audi-tory event-related potentials (N1, P2, N2, and P3) in normal subjects. Electroencephalogr Clin Neurophysiol 65:59-71 .
Oyler RF, Lauter JL, Matkin ND . (1991) . Intrasubject variability in absolute latency of the auditory brainstem response . J Am Acad Audiol 2:206-213 .
Polich J. (1986) . Normal variation of P300 from auditory stimuli. Electroencephalogr Clin Neurophysiol 65:236-240 .
Pollock VE, Schneider LS . (1992) . Reliability of late pos-itive component activity (P3) in healthy elderly adults . J Gerontol 47:88-92.
Roth WT, Kopell BS, Tinklenberg JR, Huntsberger GE, Kraemer HC. (1975) . Reliability of the contingent nega-tive variation and the auditory evoked potential . Electroencephalogr Clin Neurophysiol 38:45-50 .
Segalowitz SJ, Barnes KL . (1993) . The reliability of ERP components in the auditory oddball paradigm . Psycho-physiology 30:451-459.
Sinha R, Bernardy N, Parsons OA . (1992) . Long-term test-retest reliability of event-related potentials in nor-mals and alcoholics . Biol Psychiatry 3:992-1003.
Sklare DA, Lynn GE . (1984) . Latency of the P3 event-related potential: normative aspects and within-subject variability. Electroencephalogr Clin Neurophysiol 59 : 420-424.
Wall LG, Davidson SA, Dalebout SD . (1991) . Determining latency and amplitude for multiple peaked P300 wave-forms . J Am Acad Audiol 2:189-194 .