Embed Size (px)
Citation preview
Page 1 of 26
Comparison of Student Learning in a Virtual and Physical Unit Operations Laboratories
Theodore F. Wiesner, PhD, PE, William Lan, PhD *, Karlene A. Hoo, PhD, Charles Smith, MS, and Jason Williams
Department of Chemical Engineering/*College of Education
Texas Tech University Lubbock, TX 79409 Abstract
In the traditional chemical engineering unit operations laboratory, students conduct
experiments on lab-scale physical equipment. However, the chemical process industries are
tending toward computer-based simulations rather than the traditional pilot-scale experiments.
This trend suggests the need to modernize the unit operations pedagogy to keep the course
relevant to industrial needs. The following question arises: to what extent can computer
simulation replace physical experiments? There is a dearth of studies reporting the extent to
which simulations can replace physical experiments without compromising student learning.
We conducted an assessment designed to elucidate the impact of virtual experiments
upon student learning. Quizzes measuring students’ learning in the two conditions, physical and
virtual, were compared to investigate the effects of the different instruction modes on students’
learning. No significant difference in learning between the two instructional modes was found.
Introduction
In the traditional pedagogy of the chemical engineering unit operations laboratory,
students are required to conduct experiments on lab-scale physical equipment. This practice may
lead to a mismatch between the students’ learning experiences and later employment
expectations. Due to equipment costs, safety concerns, human resource limitations, and the
availability of computers, the chemical process industries (CPI) are tending toward computer-
based simulations rather than the traditional pilot-scale experiments[1]. Most of the time, the
Page 2 of 26
engineer will be working from a control room, or at least from behind a computer screen. Rarely
will an engineer be out in the field adjusting valves, flow rates, and temperatures, etc.
This trend suggests the need to modernize the unit operations pedagogy to keep the
course relevant to industrial needs. Modernization of the unit operations laboratory supports the
trend in higher education to increase authenticity of instruction. Authenticity of instruction is the
relevance of pedagogy to the professional practice of a discipline. It is one of the major
principles of effective learning and instruction [2,3,4]. Researchers in course design recommend
that authenticity be the first issue addressed in the design of any learning environment[5].
Authentic instruction maximizes students' learning by incorporating into learning situations the
fidelity and complexity of real-life tasks that students will encounter in their future careers [6,5].
Computer simulations are authentic in the sense that they are widely used in the chemical
process industries. The use of steady-state simulators is not new. However, the use of dynamic
simulators is growing because understanding and interpreting transient behavior is crucial when
addressing control and operability issues.
However the following question arises: how much is student learning compromised by
the reduction of tactile or “hands-on” learning? Experience has shown that the computer cannot
replace the physical laboratory, but can greatly enhance the understanding of real world
situations[7]. Computer-based experiments in various disciplines for teaching purposes started
appearing in the early 1990s. The keyword search “virtual laboratory” of the peer-reviewed
literature yielded 42 articles concerning virtual laboratories in fields ranging from basic sciences
to clinical medicine to architecture. The majority of these reports concern research and
development laboratories rather than teaching laboratories. With regard to virtual engineering
teaching laboratories, we found reports of computer simulations of complex physical phenomena
Page 3 of 26
such as fluid flows [8], a virtual control laboratory [9], a virtual lab for electric motors [10], and
mechanical engineering lab courses[11]. A search of the WWW using the keywords “virtual
engineering laboratory” yielded a plethora of sites, indicating much effort in developing this
concept[12]. There were no reports of a virtual unit operations laboratory.
On the more general topic of research into technology-mediated instruction, Kadiyala and
Crynes[13] published an exhaustive overview of findings and trends over the past 15 years.
Reviewing 760 reports, they found convincing evidence that information technologies can
enhance learning when the pedagogy is sound, and when there is a good match of technology,
techniques, and objectives. However, they could not restrict their reviews to only chemical
engineering and related subjects, for there were too few studies that met their criteria. They did
summarize two studies of sophomore chemical engineering courses. The first study [14] found
that student performance improved when Resource Based Education (i.e. computer-aided
learning packages, software tools, etc.) was employed. The second study [15] reported that
students’ satisfaction and attitudes improved using multimedia and cooperative learning.
In summary, the state of the field, information technologies have the potential to
significantly enhance student learning when appropriately applied. However, there is a dearth of
studies evaluating their effectiveness in chemical engineering curricula and to what extent they
can replace physical experiments.
In the fall of 2002, we conducted an experiment in the Unit Operations class designed to
elucidate the impact of virtual experiments upon student learning. The TTU College of
Education assessed the results of the experiment. In this report, we describe our virtual
experiments and results of the assessment. We then recommend to what extent physical
experiments can be replaced with virtual experiments without compromising student learning.
Page 4 of 26
Methods
Design of Virtual Experiments
The unit operations laboratory at Texas Tech University is employed to reinforce to
senior chemical engineering students the basic chemical engineering principles associated with
various pieces of equipment. The unit operations laboratory is also used to familiarize the
students with the safety concerns regarding each piece of equipment and about operational
issues. The equipment used is comparable to pilot-scale units of industrial laboratories. The
major pieces of equipment used in our laboratory include a double-pipe heat exchanger, an
packed column ammonia absorber, a cooling tower, and a distillation column. The knowledge
and skills we expect the students to acquire in our unit operations laboratory are 1) the
understanding and the ability to operate the unit operations of gas absorption, heat transfer,
humidification, and distillation, 2) ability to conduct a Hazard and Operability Analysis
(HAZOP), and 3) ability to scale pilot data to industrial levels. in addition to these specific
chemical engineering skills, we require competence in ABET criteria a-k.
To acquire the aforementioned knowledge and skills, each student in the fall of 2002
performed 2 physical and 2 virtual experiments. Which students performed the virtual versions
of a particular experiment was varied systematically among the class so that we could assess the
differential impact of virtual experiments upon student learning. We modified the standard
physical pedagogy in the following ways.
1. The partial replacement of selected lab-scale physical unit operations experiments with
computer visualization of data from full-scale, industrial chemical processes. Using the
process simulator, CHEMCAD™, we demonstrate the separation of mixture of organic acids
using multiple distillation columns in series. The module simulates an actual separation train
Page 5 of 26
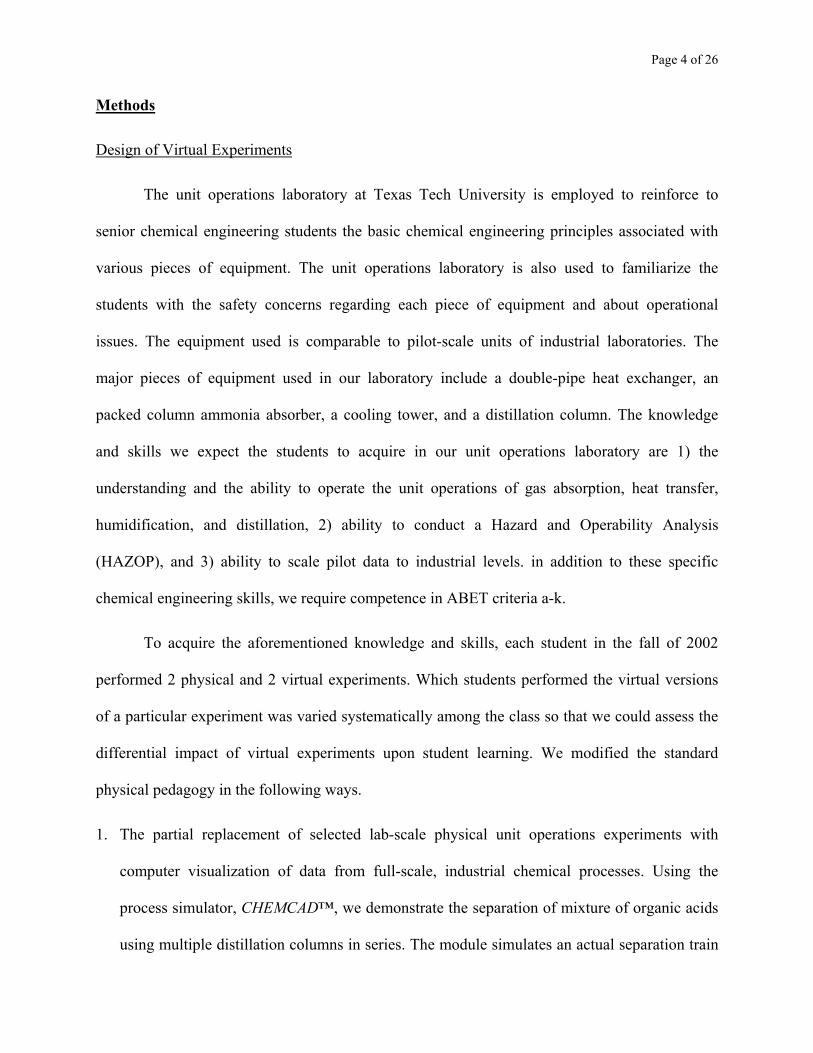
at the Celanese plant in Pampa, TX (figure 1). We also explore process conditions and
alternative designs with the module, as would be done in an industrial process engineering
group.
2. Virtual analogs to the lab scale unit operations experiments of heat exchange, mass transfer,
and humidification. Using LabVIEW software, we have developed a realistic control room
interface overlaying a mathematical model of the unit operation. The student conducts the
virtual experiment in the same fashion as the physical experiment.
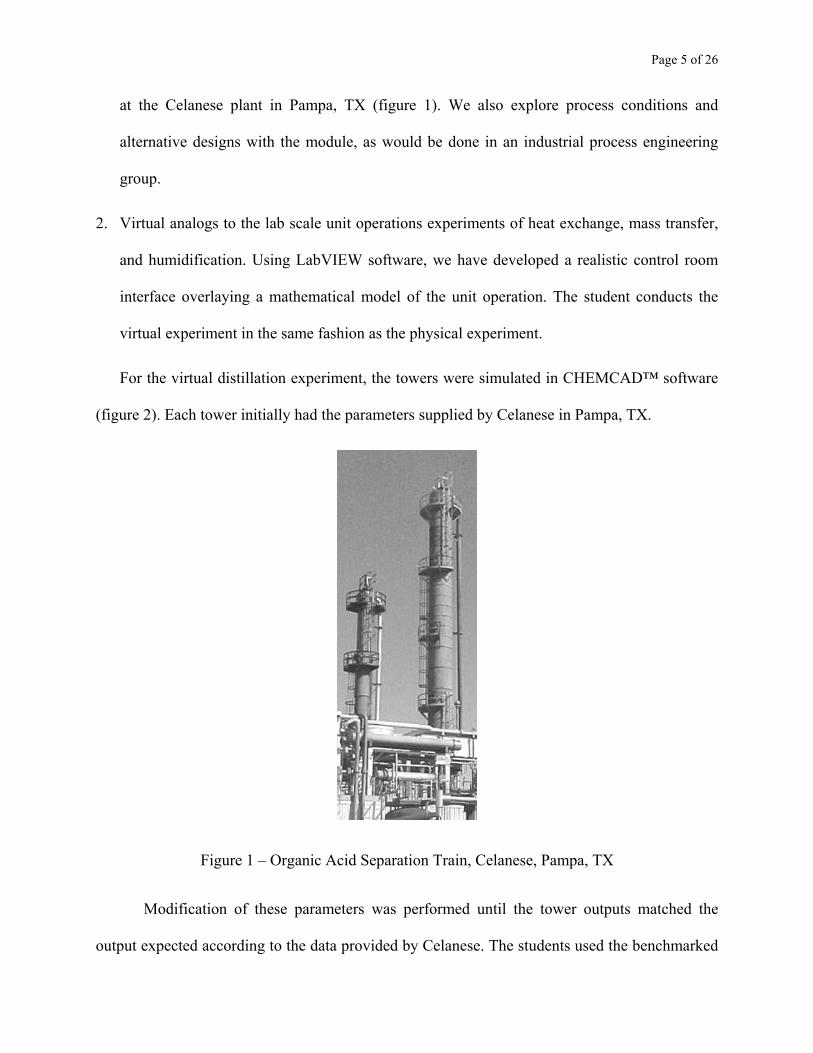
For the virtual distillation experiment, the towers were simulated in CHEMCAD™ software
(figure 2). Each tower initially had the parameters supplied by Celanese in Pampa, TX.
Figure 1 – Organic Acid Separation Train, Celanese, Pampa, TX
Modification of these parameters was performed until the tower outputs matched the
output expected according to the data provided by Celanese. The students used the benchmarked
Page 6 of 26
simulator to investigate the control of distillation towers. They tuned PI controllers based upon
steady state, open loop, and closed loop responses.
Figure 2 Flowsheet Simulation of Celanese Towers T-54 and T-15.
With regard to the pilot-scale experiments (heat exchangers, cooling tower, and gas
absorber), interfaces were created in LabVIEW resembling the interfaces of our physical
equipment. i.e. the double-pipe heat exchanger, the ammonia gas absorber, and the cooling
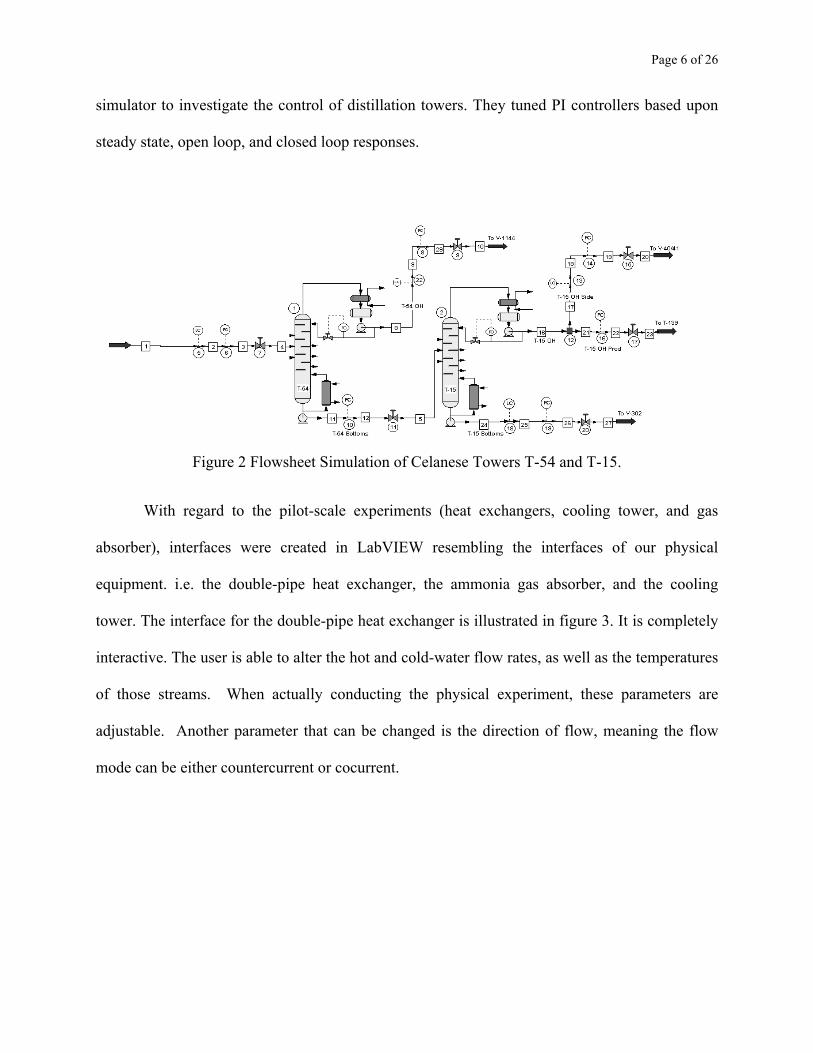
tower. The interface for the double-pipe heat exchanger is illustrated in figure 3. It is completely
interactive. The user is able to alter the hot and cold-water flow rates, as well as the temperatures
of those streams. When actually conducting the physical experiment, these parameters are
adjustable. Another parameter that can be changed is the direction of flow, meaning the flow
mode can be either countercurrent or cocurrent.
Page 7 of 26
Figure 3 – Virtual Heat Exchanger Interface
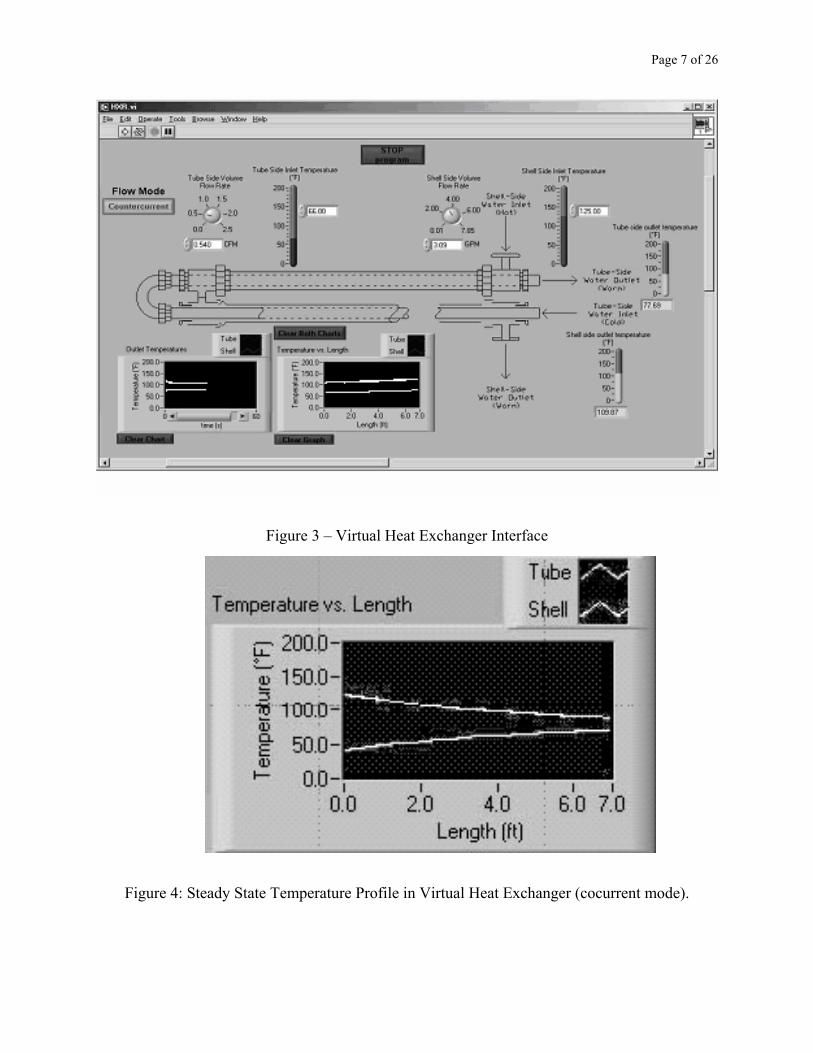
Figure 4: Steady State Temperature Profile in Virtual Heat Exchanger (cocurrent mode).
Page 8 of 26
The interface features 2 graphs. One shows the outlet temperatures of both the shell and tube
sides progressing with time. These values change until the system reaches a steady state, a
change in an inlet temperature will affect both the outlet temperatures. The magnitude of the
change is dependent on both the inlet temperatures and both the shell and tube-side flowrates.
The other shows the temperature profile along the length of the exchanger for both tube and
shell-side. With a countercurrent flow mode, this graph has two parallel lines, as in figure 3,
along the length of the exchanger. In a cocurrent flow mode, this graph as two lines that
converge toward the steady state temperature, as shown in figure 4. In both the physical and
virtual versions of the heat exchanger, the students vary the shell-side flow rate, and compare the
resulting Nusselt numbers with the Sieder-Tate correlation.
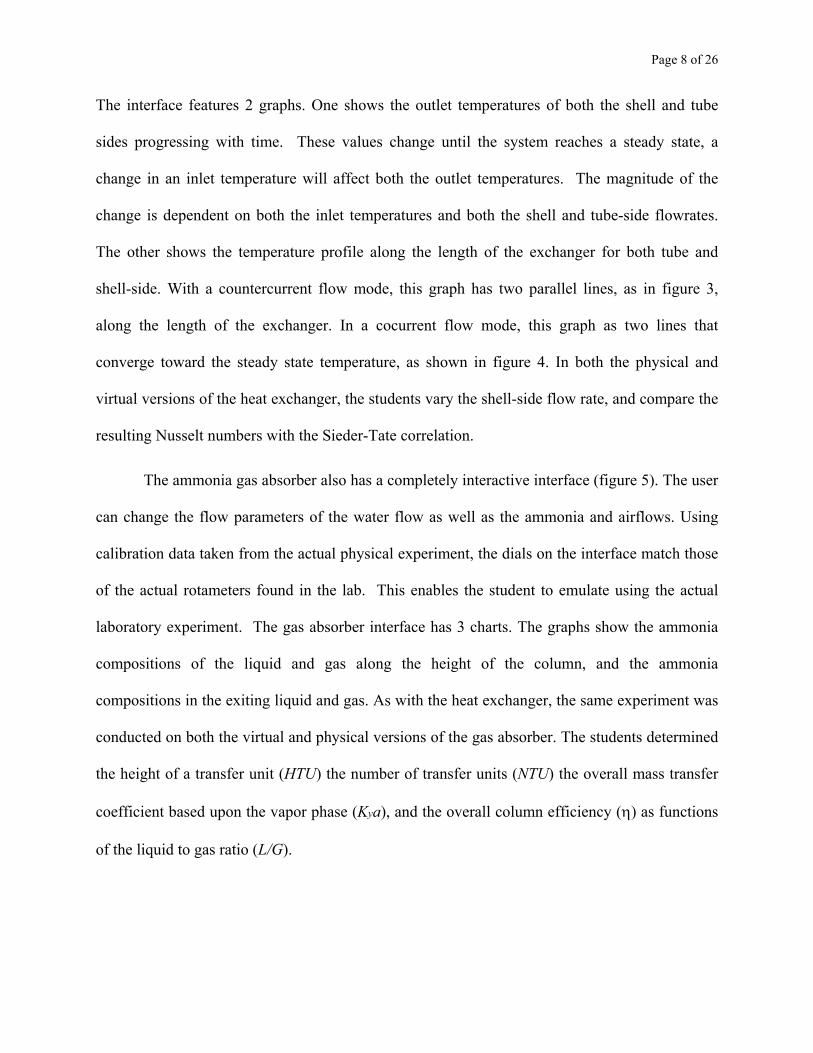
The ammonia gas absorber also has a completely interactive interface (figure 5). The user
can change the flow parameters of the water flow as well as the ammonia and airflows. Using
calibration data taken from the actual physical experiment, the dials on the interface match those
of the actual rotameters found in the lab. This enables the student to emulate using the actual
laboratory experiment. The gas absorber interface has 3 charts. The graphs show the ammonia
compositions of the liquid and gas along the height of the column, and the ammonia
compositions in the exiting liquid and gas. As with the heat exchanger, the same experiment was
conducted on both the virtual and physical versions of the gas absorber. The students determined
the height of a transfer unit (HTU) the number of transfer units (NTU) the overall mass transfer
coefficient based upon the vapor phase (Kya), and the overall column efficiency (η) as functions
of the liquid to gas ratio (L/G).
Page 9 of 26
Figure 5 – Virtual Gas Absorber Interface
The cooling tower interface (not shown) is similar to the heat exchanger and the gas absorber and
is also completely interactive. This interface uses the inlet air wet and dry bulb temperatures, fan
speed, and the temperature and flow of inlet water, to determine the outlet temperatures of the
water and air. The students determined the heat transfer coefficient, mass transfer coefficient,
and the height of a transfer unit, as a function of inlet liquid flow rate
Page 10 of 26
The models for the pilot-scale experiments were developed from unsteady mass and energy
balances. These were then discretized into recurrence formulae in the time dimension to provide
an open-ended simulation. By way of example, we illustrate the mathematical treatment of the
double pipe heat exchanger. The governing equations for this experiment are given in equations
(1) and (2)[16].
( )1
4 (tube-side)sp
T T Uv T Tt z C Dρ
∂ ∂+ = −
∂ ∂ (1)
( ) ( )1
2 22 1
4sgn (shell-side)s ss s
s ps
T T DUv T Tt z C D Dρ
∂ ∂+ = −
∂ ∂ − (2)
The exchanger is subject to the following initial and boundary conditions.
(3)
0
0
s,
s,
( ,0) ( )( ,0) ( )(0, ) ( ) (0, ) ( ) cocurrent( , ) ( ) countercurrent
s s
inlet
s inlet
s inlet
T z T zT z T zT t T tT t T tT L t T t
====
=
T is the tube side temperature, t is time, and v is the tube side velocity averaged across the cross-
section. z is the distance along the exchanger, U is the overall heat transfer coefficient, and D1 is
the diameter of the inner tube. Ts is the shell side temperature. ρ and Cp are the density and the
heat capacity of the tube side fluid. The subscript s indicates properties of the shell side fluid.
The subscript 0 indicates initial conditions. sgn = +1 or -1, indicating cocurrent or countercurrent
flow respectively. L is the length of the exchanger.
We now introduce the following dimensionless variables and multiply by L/v.
dimensionless time tvL
τ = (4)
Page 11 of 26
dimensionless exchanger length zZL
= (5)
,
dimensionless tube-side temperature inlet
s inlet inlet
T TT T
θ −=
− (6)
,
dimensionless shell-side temperature s inlets
s inlet inlet
T TT T
θ −=
− (7)
The non-dimensionalized energy balances produce a pair of partial differential equations (PDEs)
(equations (8) and (9))
( saZ
)θ θ θ θτ∂ ∂
+ = ⋅ −∂ ∂
(8)
and
(s s )s saZ
θ θγ θ θτ
∂ ∂± ⋅ = ⋅ −
∂ ∂ (9)
The dimensionless initial and boundary conditions become equations (10).
0
0
( ,0) ( )( ,0) ( )
(0, ) 0(0, ) 1 cocurrent flow(1, ) 1 countercurrent flow
s s
s
s
Z ZZ Z
θ θθ θθ τθ τθ τ
=====
(10)
The quantities a, as, and γ are lumped parameters.
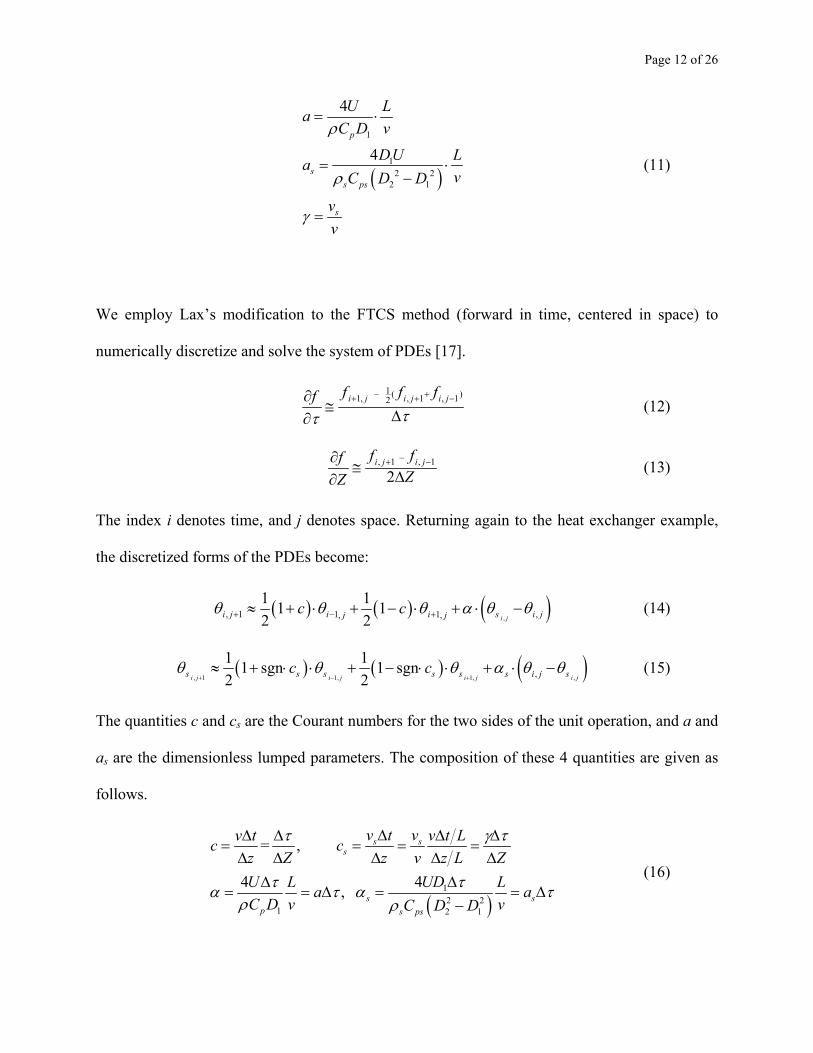
Page 12 of 26
( )
1
12 2
2 1
4
4p
ss ps
s
U LaC D v
DU LavC D D
vv
ρ
ρ
γ
= ⋅
=−
=
⋅ (11)
We employ Lax’s modification to the FTCS method (forward in time, centered in space) to
numerically discretize and solve the system of PDEs [17].
1 ( )1, , 1 , 12i j i j i jf f ffττ
− ++ + −∂≅ ∆∂
(12)
, 1 , 1
2i j i jf ff
ZZ−+ −∂
≅ ∆∂ (13)
The index i denotes time, and j denotes space. Returning again to the heat exchanger example,
the discretized forms of the PDEs become:
( ) ( ) ( ),, 1 1 1 ,, ,1 11 12 2 i ji j i i s i jj jc cθ θ θ α θ+ − +≈ + ⋅ + − ⋅ + ⋅ −θ (14)
( ) ( ) ( ), 1 1, 1, ,,1 11 sgn 1 sgn2 2i j i j i j i js s s s s s ic cθ θ θ α
+ − +≈ + ⋅ ⋅ + − ⋅ ⋅ + ⋅ −j sθ θ (15)
The quantities c and cs are the Courant numbers for the two sides of the unit operation, and a and
as are the dimensionless lumped parameters. The composition of these 4 quantities are given as
follows.
( )12 2
1 2 1
= ,
44 ,
s ss
s sp s ps
v t vv t v t Lc cz Z z v z L Z
UDU L La aC D v vC D D
τ γ τ
ττα τ α τρ ρ
∆∆ ∆ ∆ ∆= = = =∆ ∆ ∆ ∆ ∆
∆∆= = ∆ = =
−∆
(16)
Page 13 of 26
We performed similar procedures utilizing ammonia balances on the gas and liquid phases of the
gas absorber[16], and energy balances on the air and water phases of the cooling tower[18].
Interestingly and conveniently, the dimensionless models for all three experiments have the same
generic form as equations (8) and (9). Thus we obtained recurrence formulae in the time
dimension similar to equations (14) and (15) for the absorber and cooling tower as well.
Assessment
To examine the efficacy of virtual experiments in the unit operations laboratory, we have
examined 3 data sources.
1. The first source is a comprehensive exam over the course. On each experiment, 8 questions
were asked regarding theory, safety, data collection, and data analysis. We compared the
scores obtained by those who conducted the virtual versions of the experiment with those
obtained by those who performed the physical versions. The assessment was conducted by
the Texas Tech University College of Education.
2. The second source is the oral presentations each student had to make to the class as a whole.
The presentations were jointly given by two students, one who had conducted the physical
version of the experiment, and one who had conducted the virtual version of the experiment.
The students were asked to assess the strengths and weaknesses of both types of experiments
and recommend to what extent computer simulation should be used in the unit operations
laboratory. Of 12 presentation teams, 9 recommended a combination of physical and virtual
experiments, and 3 recommended a purely physical lab. No teams recommended a
completely virtual lab.
Page 14 of 26
3. The third source was a questionnaire anonymously answered by students regarding how the
ABET a-k criteria were met. These were compared to the same questionnaire given to
students taking the class in the fall of 2001, when no virtual modules were employed.
Results
Student Performance on Written Examination
To investigate the differences in learning between the two modes of instruction (physical
vs. virtual labs), students’ test scores on courses quizzes were collected and compared. Students
in the course conducted experiments in three modules of the class: humidification, gas
absorption, and heat transfer, and they were alternated to learn the three modules in either
physical or virtual labs. A quiz was administered for each module to measure their learning. The
quiz consisted of eight items in four aspects of module content: two items for theory, one item
for safety, three items for operation, and two items for analysis. Analyses to compare students’
learning between the physical laboratory and virtual laboratory were conducted at three levels:
sub-areas of the modules, modules, and individuals.
Comparison of Students’ Learning at the Sub-area Level
Students’ performance on the four aspects of a module, theory, safety, operation, and
analysis, was utilized as four subscales in the analysis. The subscales were defined as the means
of the items. The four subscales in each of the four modules were positively correlated, which
justified the use of multivariate analysis for this comparison.
For the module of humidification, 17 students conducted experiments of the module in
the physical laboratory and 7 in the virtual lab. Correlation coefficients between the four learning
subscales ranged between 0.20 and 0.44. Students’ scores in the four subscales indicated that
Page 15 of 26
students in the virtual laboratory performed better on the quiz of humidification than those in the
physical lab. Means of the subscale of theory were 2.86 (SD = 0.85) and 1.85 (SD = 1.32) for the
virtual and physical groups, respectively; Means of the subscale of safety were 3.57 (SD = 0.53)
and 2.76 (SD = 1.39) for the two groups, respectively; Means were 3.38 (SD = 0.36) and 2.61
(SD = 0.91) for the subscale of operation and 2.79 (SD = 0.99) and 2.09 (SD = 1.23) for the
subscale of analysis for the two groups. Both were in favor of the virtual condition.
MANOVA was conducted to test the hypothesis that students learned equally well in the
two laboratory conditions for the humidification module. The hypothesis was retained, Wilks’
Lambda (4, 19) was 1.75, p = .18. However, univariate analyses on the subscales showed
noticeable better performance of the students in the virtual laboratory condition in the subscales
of theory and operation than those in the physical laboratory condition. With the small sample
size involved, the univariate analysis on the subscale of theory produced nearly significant mode
effect, F(1, 22) = 3.41, p = 0.08, eta2 = .13. The comparison on the subscale of operation between
the two conditions was significant, F(1, 22) = 4,61, p = .043, eta2 = .17. Judging from the values
of the eta2, we conclude that the effect sizes were medium or large.
For the module of gas absorption, 16 students conducted experiments of the module in
the physical laboratory and 8 in the virtual one. Correlation coefficients between the four
learning subscales ranged between 0.15 and 0.53. Students’ performance on the four aspects of
the module showed a mixed pattern. Students in the virtual laboratory outperformed those in the
physical laboratory in the areas of safety and analysis. Means of safety were 3.88 (SD = 0.35)
and 3.56 (SD = 1.09) for the virtual and physical groups, respectively, and were 2.56 (SD = 1.12)
and 2.06 (SD = 1.52) for the two groups in the area of analysis. However, students in the
physical laboratory condition outperformed those in the virtual laboratory condition in the other
Page 16 of 26
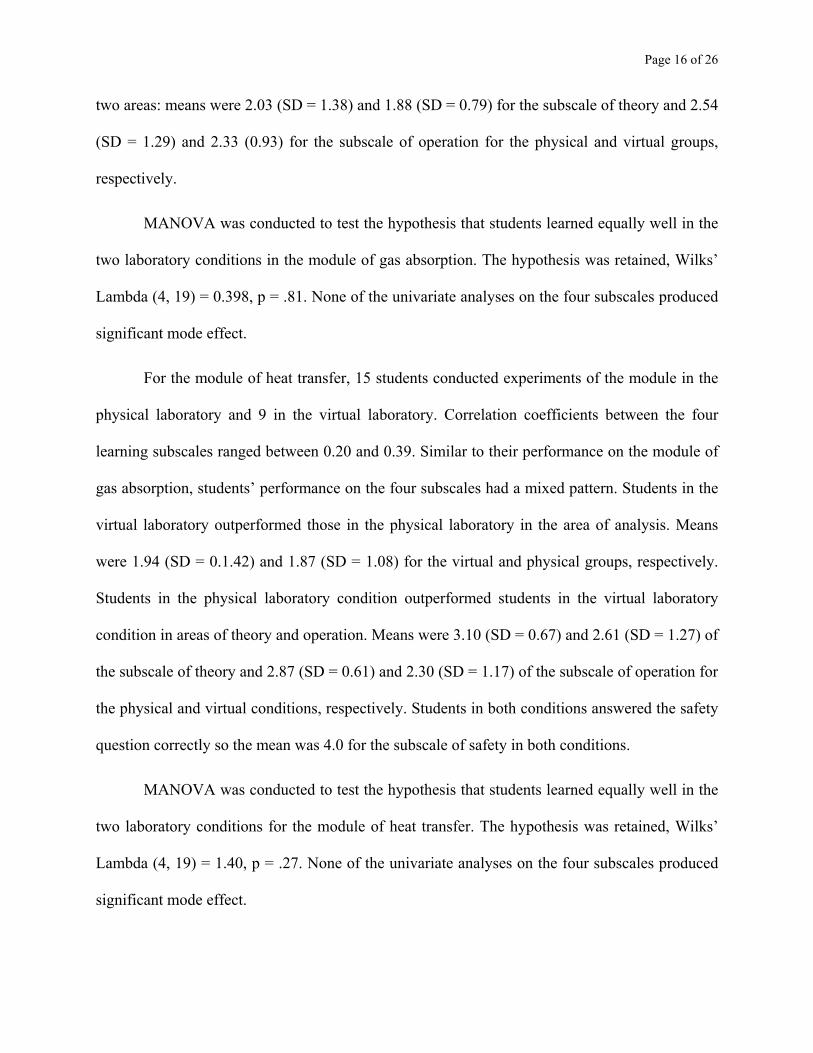
two areas: means were 2.03 (SD = 1.38) and 1.88 (SD = 0.79) for the subscale of theory and 2.54
(SD = 1.29) and 2.33 (0.93) for the subscale of operation for the physical and virtual groups,
respectively.
MANOVA was conducted to test the hypothesis that students learned equally well in the
two laboratory conditions in the module of gas absorption. The hypothesis was retained, Wilks’
Lambda (4, 19) = 0.398, p = .81. None of the univariate analyses on the four subscales produced
significant mode effect.
For the module of heat transfer, 15 students conducted experiments of the module in the
physical laboratory and 9 in the virtual laboratory. Correlation coefficients between the four
learning subscales ranged between 0.20 and 0.39. Similar to their performance on the module of
gas absorption, students’ performance on the four subscales had a mixed pattern. Students in the
virtual laboratory outperformed those in the physical laboratory in the area of analysis. Means
were 1.94 (SD = 0.1.42) and 1.87 (SD = 1.08) for the virtual and physical groups, respectively.
Students in the physical laboratory condition outperformed students in the virtual laboratory
condition in areas of theory and operation. Means were 3.10 (SD = 0.67) and 2.61 (SD = 1.27) of
the subscale of theory and 2.87 (SD = 0.61) and 2.30 (SD = 1.17) of the subscale of operation for
the physical and virtual conditions, respectively. Students in both conditions answered the safety
question correctly so the mean was 4.0 for the subscale of safety in both conditions.
MANOVA was conducted to test the hypothesis that students learned equally well in the
two laboratory conditions for the module of heat transfer. The hypothesis was retained, Wilks’
Lambda (4, 19) = 1.40, p = .27. None of the univariate analyses on the four subscales produced
significant mode effect.
Page 17 of 26
Comparison of Students’ Learning at the Module Level
We averaged students’ four subscale scores in each module to create three module
learning scores: learning in humidification, gas absorption, and heat transfer. The module
learning scores, then, were used as dependent variable in the comparisons between the students
learning the modules in either physical or virtual laboratory conditions.
For the module of humidification, students in the virtual laboratory condition had better
performance than the students in the physical laboratory condition. Means were 3.13 (SD = 0.40)
and 2.31 (SD = 0.73) for the virtual and physical conditions, respectively. ANOVA with the
module learning score as the dependent variable and instruction mode as the independent
variable showed a significant mode effect, (1, 22) = 7.60, p = .012.
Learning of the module of gas absorption was about the same for the two groups. Means
of the module learning score were 2.42 (SD = 1.06) and 2.47 (SD = 0.46) for the physical and
virtual conditions, respectively. The mode effect was not significant, F(1, 22) = 0.014, p = .91 for
the comparison between the two conditions.
For the module of heat transfer, the module learning score of students in the physical
laboratory condition (M = 2.82, SD = 0.45) was higher than that of students in the virtual
laboratory condition (M = 2.50, SD = 0.83). The difference was not significant, F (1, 22) = 1.51,
p =.23.
Comparison of Students’ Learning within Individuals
Every student in the course experienced both physical and virtual laboratory conditions.
Students took the course in three different manners: eight students took the modules of
humidification and heat transfer in the physical laboratory and the module of gas absorption in
Page 18 of 26
the virtual laboratory; nine students took the modules of humidification and gas absorption in the
physical laboratory and the module of heat transfer in the virtual one, and 7 students took the
modules of gas absorption and heat transfer in the physical laboratory and the module of
humidification in the physical laboratory. Each student’s scores in the quizzes of the three
modules were averaged, depending on the manner he or she learned the modules, to produce two
scores: a physical laboratory learning score and a virtual laboratory learning score. For example,
if a student learned the modules of humidification and heat transfer in the physical laboratory
and the module of gas absorption in the virtual laboratory, the physical laboratory learning score
was the mean of his or her scores on the two quizzes on humidification and heat transfer and the
virtual laboratory learning score was his or her score on the quiz of gas absorption. These two
scores were compared to examine the effect of instruction mode on learning of individual
students.
The physical learning score and virtual learning score were submitted to a repeated
ANOVA as the dependent variables with the instruction mode as a within-subject independent
variable. Means of the physical laboratory learning score and the virtual laboratory learning
score were 2.54 and 2.64, respectively. The difference was not significant, F (1, 23) = 0.75, p =
0.40.
As a summary of the results of the exams assessing differential learning, students learned
conducting experiments in chemical engineering in the physical and virtual laboratory situations.
Quizzes measuring students’ learning in the two conditions were compared to investigate the
effects of the different instruction modes on students’ learning. Except for the module of
humidification with which students learned better in the virtual laboratory than did they in the
Page 19 of 26
physical laboratory, no significant difference in learning between the two instructional modes
was found.
Student Responses to ABET Questionnaire
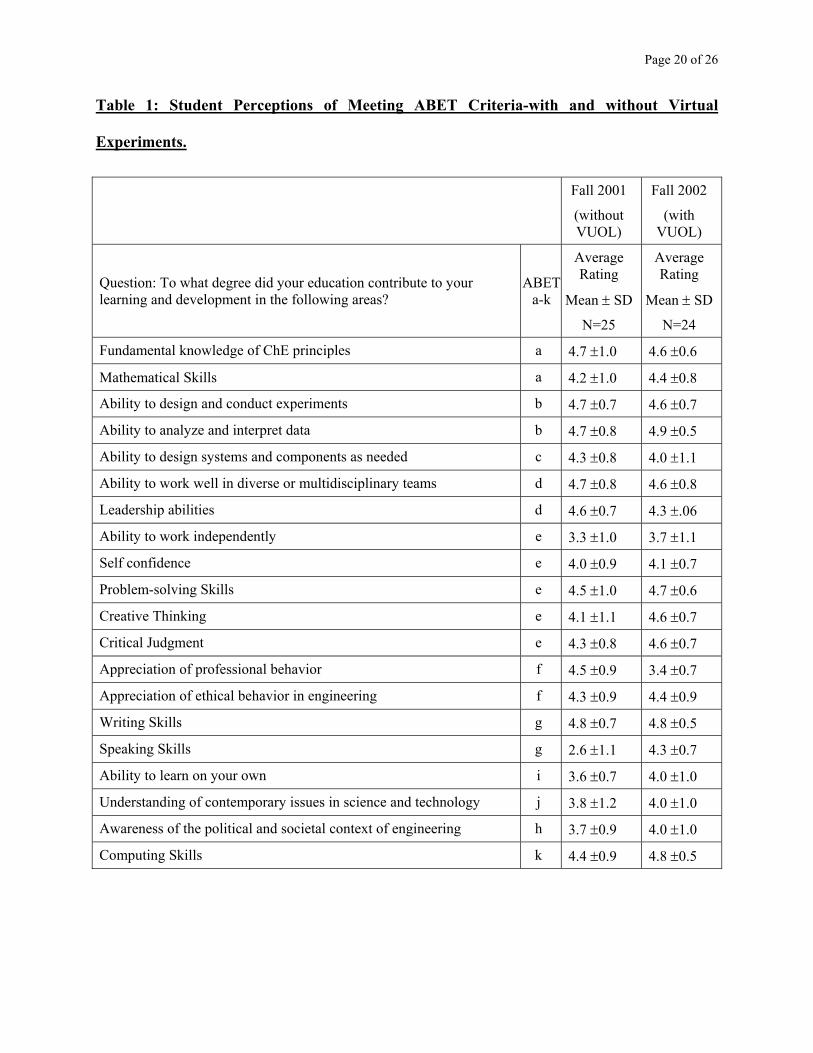
With regard to the effect of virtual learning upon ABET a-k criteria, we compared how
the 2002 class as a whole perceived their learning in these areas to the perceptions of the 2001
class. The 2001 class did not conduct virtual experiments, while the 2002 class did conduct
virtual experiments. Students were asked “To what degree did your education contribute to your
learning and development in the following areas”. The students then assigned a numerical value
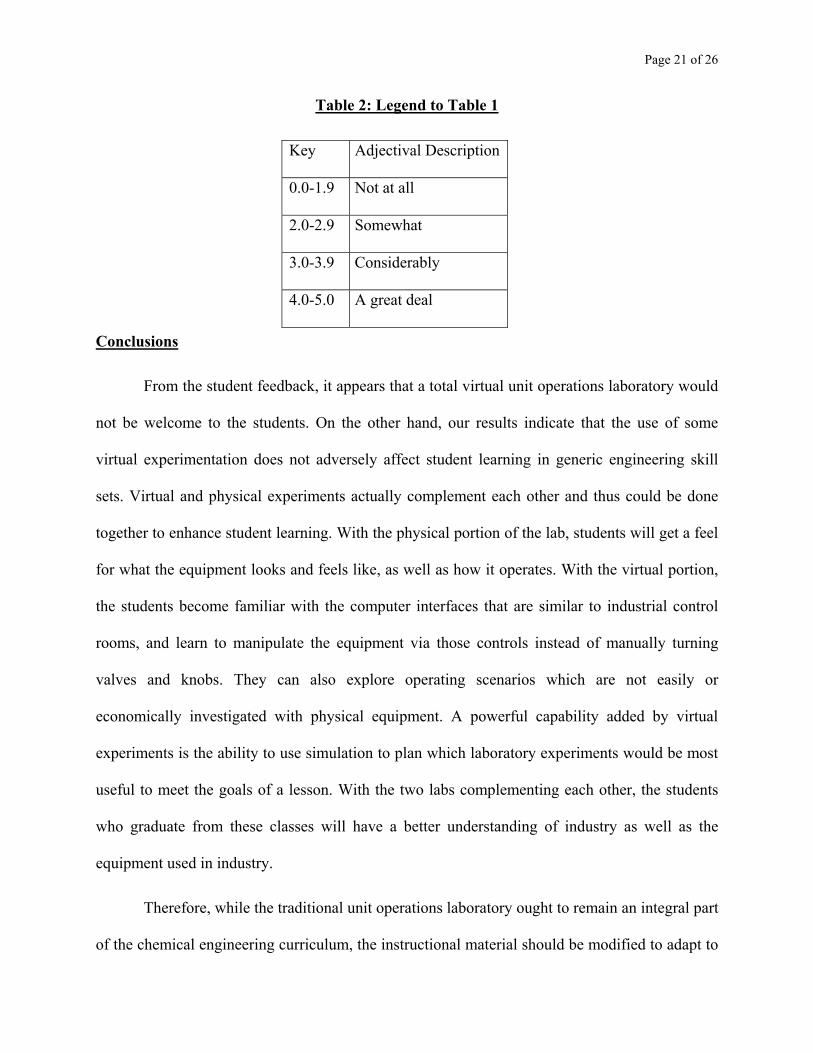
to each of 20 questions about ABET a-k criteria. The results are given in Table 1. The adjectival
description of the numerical values is given in Table 2.
Two results are apparent from the results in Table 1. The first is that, in both terms, the
students felt that the class contributed either a great deal or considerably in all areas of ABET
criteria a-k. The second result is that there is no significant difference in the student perception to
their learning in 18 out of 20 areas, either in the presence or absence of virtual unit operations
experiments. The only 2 areas which display significant differences between the control and
experimental groups are “Speaking Skills” and “Appreciation of Professional Behavior”. The
perception without virtual experiments is lower in the former area. The difference is attributable
to the fact that oral presentations were not required in the class in the Fall of 2001. The
perception of learning in the area of professional behavior is lower in the presence of virtual
experiments. The source of this difference is not known, but is likely attributable to differing
emphases by the two different instructors for each term, and not to the mode in which the
experiments were conducted.
Page 20 of 26
Table 1: Student Perceptions of Meeting ABET Criteria-with and without Virtual
Experiments.
Fall 2001
(without VUOL)
Fall 2002
(with VUOL)
Question: To what degree did your education contribute to your learning and development in the following areas?
ABET a-k
Average Rating
Mean ± SD
N=25
Average Rating
Mean ± SD
N=24
Fundamental knowledge of ChE principles a 4.7 ±1.0 4.6 ±0.6
Mathematical Skills a 4.2 ±1.0 4.4 ±0.8
Ability to design and conduct experiments b 4.7 ±0.7 4.6 ±0.7
Ability to analyze and interpret data b 4.7 ±0.8 4.9 ±0.5
Ability to design systems and components as needed c 4.3 ±0.8 4.0 ±1.1
Ability to work well in diverse or multidisciplinary teams d 4.7 ±0.8 4.6 ±0.8
Leadership abilities d 4.6 ±0.7 4.3 ±.06
Ability to work independently e 3.3 ±1.0 3.7 ±1.1
Self confidence e 4.0 ±0.9 4.1 ±0.7
Problem-solving Skills e 4.5 ±1.0 4.7 ±0.6
Creative Thinking e 4.1 ±1.1 4.6 ±0.7
Critical Judgment e 4.3 ±0.8 4.6 ±0.7
Appreciation of professional behavior f 4.5 ±0.9 3.4 ±0.7
Appreciation of ethical behavior in engineering f 4.3 ±0.9 4.4 ±0.9
Writing Skills g 4.8 ±0.7 4.8 ±0.5
Speaking Skills g 2.6 ±1.1 4.3 ±0.7
Ability to learn on your own i 3.6 ±0.7 4.0 ±1.0
Understanding of contemporary issues in science and technology j 3.8 ±1.2 4.0 ±1.0
Awareness of the political and societal context of engineering h 3.7 ±0.9 4.0 ±1.0
Computing Skills k 4.4 ±0.9 4.8 ±0.5
Page 21 of 26
Table 2: Legend to Table 1
Key Adjectival Description
0.0-1.9 Not at all
2.0-2.9 Somewhat
3.0-3.9 Considerably
4.0-5.0 A great deal
Conclusions
From the student feedback, it appears that a total virtual unit operations laboratory would
not be welcome to the students. On the other hand, our results indicate that the use of some
virtual experimentation does not adversely affect student learning in generic engineering skill
sets. Virtual and physical experiments actually complement each other and thus could be done
together to enhance student learning. With the physical portion of the lab, students will get a feel
for what the equipment looks and feels like, as well as how it operates. With the virtual portion,
the students become familiar with the computer interfaces that are similar to industrial control
rooms, and learn to manipulate the equipment via those controls instead of manually turning
valves and knobs. They can also explore operating scenarios which are not easily or
economically investigated with physical equipment. A powerful capability added by virtual
experiments is the ability to use simulation to plan which laboratory experiments would be most
useful to meet the goals of a lesson. With the two labs complementing each other, the students
who graduate from these classes will have a better understanding of industry as well as the
equipment used in industry.
Therefore, while the traditional unit operations laboratory ought to remain an integral part
of the chemical engineering curriculum, the instructional material should be modified to adapt to
Page 22 of 26
the increasing use of information technology in the chemical process industries. It is expected
that with an increase in the authenticity and reliability of this form of pedagogy, student learning
will be enhanced. A simultaneous benefit is a reduction in the financial burden associated with
purchasing and maintaining expensive physical laboratory equipment and supplies.
Acknowledgments
This work is supported by a Special Grant in the Chemical Sciences from the Camille and Henry
Dreyfus Foundation; fund number SG-01-090. The authors thank Marcus Hilliard for his
invaluable assistance in formulating and programming the mathematical models.
Page 23 of 26
References
1. TTU Chemical Engineering Advisory Board. Fall Meeting Minutes. (1998)
2. Chavez, M. M. Learner's Perspectives of Authenticity. American Council on the Teaching of Foreign Languages (1994)
3. Koschmann, T. D., A. C. Myers, P. J. Feltovich, and H. S. Barrow. Using technology to assist in realizing effective learning and instruction. Journal of the Learning Sciences. 3 227-264. (1994)
4. Newmann, F. M., H. M. Marks, and A. Gamoran. Authentic pedagogy and student performance. American Journal of Education. 104(4): 280-312. (1996)
5. Collins, A. Design Issues for a Learning Environment. Program Description for the Center for Technology in Education.(1993)
6. Lebow, D. G. and W. W. Wager. Authentic activity as a model for appropriate learning activity: Implications for design of computer-based simulations. Proc. Selected Research and Development Presentations (1994)
7. Jackson, N. B. Virtually Science. New York Times.(2000)
8. Deitz, D. Impact Codes for the Virtual Laboratory. Mechanical Engineering. 117(5): 66-70. (1995)
9. Schmid, C. The virtual control lab VCLAB for education on the web. Proceedings of Amer.Contr.Conf. 2 1314-1318. (1998)
10. Abe, N. M. and J. R. Cardoso. A virtual lab for electric motors and drives. Ieee Transactions on Magnetics. 35(3): 1674-1677. (1999)
11. McStravick, D. M. and J. L. Kelly. Mechanical engineering lab courses using virtual instrument computer software. Laboratory Robotics and Automation. 10(2): 83-87. (1998)
Page 24 of 26
12. Karweit, M. A Virtual Engineering/Science Laboratory Course. http://www.jhu.edu/%7evirtlab/virtlab.html Johns Hopkins University.(1997)
13. Kadiyala, M. and B. Crynes. A Review of Literature on Effectiveness of Use of Information Technology in Education. Journal of Engineering Education. 89(2): 177-189. (2000)
14. Baxter, E. P. Comparing Conventional and Resource Based Education in Chemical-Engineering - Student Perceptions of A Teaching Innovation. Higher Education. 19(3): 323-340. (1990)
15. Clark, W. Using Multimedia and Cooperative Learning In and Out of Class. Proceedings of the Frontiers in Education Conference (1997)
16. Schiesser, W. and C. A. Silebi. Computational Transport Phenomena. Cambridge University Press. Cambridge, UK. pp. 289-329. (1997)
17. Pozrikidis, C. Numerical Computation in Science and Engineering. Oxford University Press. New York. pp. 555-567. (1998)
18. Al Nimr, M. A. Dynamic thermal behaviour of cooling towers. Energy Conversion and Management. 39(7): 631-636. (1998)
Page 25 of 26
Biographical Sketches of the Authors
Theodore. F. Wiesner PhD, PE is an associate professor of chemical engineering at Texas Tech
University. His research interests are computer-based instruction, biomedical engineering, and
bioprocess engineering. Prior to entering academia, Dr. Wiesner worked in the chemical process
industries in the areas of polymer manufacture and wastewater treatment. He earned his BS
degree from Kansas State University, his MS from the University of Houston, and his doctorate
from the Georgia Institute of Technology. He is a member of AIChE, ASEE, ACS, the
Biomedical Engineering Society, and the Biophysical Society.
Address: Department of Chemical Engineering Texas Tech University P. O. Box 43121
Lubbock, Texas 79409-3121 phone: (806)-742-1448 fax: (806)-742-3552
email:[email protected]
Wililam Lan, Ph.D, is an associate professor of Educational Psychology in the College of
Education at Texas Tech University. His research interests include self-regulated learning,
student motivation, and analysis of dropout and at-risk students with national databases. He has
been a faculty member at Texas Tech University for 13 years since graduating from University
of Iowa. He is a member of American Educational Research Association, American Education
Research Association, ex-President (1999-2001) and member of Chi Chapter, Phi Beta Delta, the
Honor Society for International Scholars, member of Chinese American Educational Research
and Development Society (CAERDS), and Member of Teaching Academy, Texas Tech
University.
Address: P. O. Box 41071, Lubbock, Texas 79409-1071, College of Education, Texas Tech
University. Phone: (806) 742-2338, fax: (806) 742-2179, email: [email protected].
Page 26 of 26
Karlene A. Hoo PhD, is an associate professor of chemical engineering at Texas Tech
University. Her research interests are linear and nonlinear control, multivariate statistics,
modeling, and system identification of chemical and biological systems. Dr. Hoo received her
BS from Univ. Pennsylvania and her MS and PhD from Univ. Notre Dame. All her degrees are
in chemical engineering. Prior to her academic career she was employed for six years with the
Dupont Company where her primary responsibilities involved modeling and control of batch and
continuous chemical and fiber making processes. Dr. Hoo is the recipient of a Mortar Board
award and a Halliburton award for Teaching Excellence; and an ASEE Dow Outstanding New
Faculty award.
Address: Department of Chemical Engineering Texas Tech University P. O. Box 43121
Lubbock, Texas 79409-3121 phone: (806)-742-4079 fax: (806)-742-3552 email:
Charles Smith MS is a process engineer for Ticona plastics in Shelby, NC. He earned is BS and
MS degrees from Texas Tech University.
Jason L. Williams is a Ph.D. student in Chemical Engineering at Texas Tech University. His
research interests and dissertation field is modeling atmospheric particulate transport around
trees. His work on the Virtual Unit Operations Project was conducted as an undergraduate under
the advisement of Dr. Theodore F. Wiesner.
Address: Department of Chemical Engineering Texas Tech University P. O. Box 43121
Lubbock, Texas 79409-3121 phone: (806)-742-0449 fax: (806)-742-3552 email: