Embed Size (px)
Citation preview
Vol. 80, No. 6, 2003 745
Comparison of Starch Pasting Properties at Various Cooking Conditions Using the Micro Visco-Amylo-Graph and the Rapid Visco Analyser
Dong Soon Suh1 and Jay-lin Jane1,2
ABSTRACT Cereal Chem. 80(6):745–749
Pasting profiles of selected starches were compared by using a Micro Visco-Amylo-Graph (MVA) and a Rapid Visco Analyser (RVA). Effects of cooking (heating/cooling) rate and stirring speed on starch pasting properties were examined. The pasting viscosity of a starch suspension (8%, w/w, dsb) was measured at a fast (6°C/min) and slow (1.5°C/min) cooking rate while being stirred at either 75 rpm or 160 rpm. The pasting temperatures (PT) of all starches were higher when measured at the fast cooking rate than those at the slow cooking rate, except for wheat measured by using the RVA. PT was also higher when measured at the
slow stirring speed (75 rpm) than at the fast stirring speed (160 rpm) in both RVA and MVA. When stirring speed increased from 75 rpm to 160 rpm, peak viscosity of all starch pastes except potato decreased measured by using the RVA, but increased by using the MVA. In general, amylograms of these starches obtained by using the MVA showed less breakdown, but greater setback viscosity than did that obtained by using the RVA. Differences in starch pasting properties between MVA and RVA, measured at the same cooking and stirring rates, were attributed mainly to the difference in spindle structure.
Pasting properties of starches are measured by using various
instruments such as Brabender Visco-Amylograph (BVA, A.W. Brabender Instrument Inc., South Hackensack, NJ), Rapid Visco Analyser (RVA), Ottawa starch viscometer (Doublier et al 1987; Voisey et al 1977), and Haake viscometer (Lee et al 1995). Among these instruments, BVA and RVA are the most commonly used instru-ments. A number of studies have been reported on the pasting behavior of starch suspension with RVA (Bahnassey and Breene 1994; Haase et al 1995; Shim and Mulvaney 1999) and BVA (Doublier 1987; Leelavathi et al 1987; Aerts and Verspaille 2001).
In the early studies, the BVA was widely used to measure the pasting profile of starch. BVA measures the torque on a spindle while rotating the measuring bowl. The standard test procedure requires over 2 hr and a large sample size (450 g of starch sus-pension, containing ≈27–45 g of starch (dry starch basis, dsb). RVA was developed more recently for measuring sprout damage in wheat but later it was adopted for the characterization of the pasting properties of starches (Wrigley et al 1996). RVA measures the viscosity on a disposable plastic stirring paddle while the paddle is rotating in the aluminum sample canister. RVA requires a smaller size sample (28 g of starch suspension, containing 1.68–2.80 g starch, dsb) and provides a rapid test (it is possible in 13 min). While BVA measures viscosity in arbitrary Brabender units (BU) or torque (cm⋅g), RVA measures either in arbitrary Rapid Viscosity units (RVU) or in absolute centipoises (cp) units.
Some comparative studies have been performed between BVA and RVA (Thiewes and Steeneken 1997; Deffenbaugh and Walker 1989; Haase et al 1995; Pérez et al 1998; Limpisut and Jindal 2002). These studies observed higher pasting temperatures as well as temperatures of peak viscosity when measured by the RVA. A larger breakdown was also observed in the RVA profile. Thiewes and Steeneken (1997) reported that BVA showed better discrimi-nation, or a more detailed analysis of starch, when the two methods were compared. Most of these studies, however, were conducted at different heating/cooling rates and stirring speeds. A direct compari-son between RVA and BVA, therefore, was not possible.
Even with the better analytical power of BVA, the large quan-tity of sample and long testing time limits its application. To overcome this disadvantage, a new model of Micro Visco-Amylo-Graph (MVA, A.W. Brabender Instrument Inc., South Hackensack,
NJ) was developed. This instrument is designed on similar prin-ciples as the BVA, but differs in sample size, cooking speed, and spindle design. The total size of the sample suspension is ≈100 g and contains 6–10 g of starch (dsb). Fast heating and cooling rates are available. There are no reports found in the literature on the starch pasting properties measured by using the MVA method.
In this study, we compared pasting properties of selected starches from different botanical sources using the MVA and the RVA under the same conditions to provide guidelines for choice of instrument. At the present time, the effect of processing factors such as heating or cooling rate and stirring speed during pasting on the pasting properties of starch are not fully understood. Therefore, we examined the effects of cooking (heating/cooling) rate, stirring speed, and the design of the spindle on the pasting properties of starches by using the RVA and MVA methods.
MATERIALS AND METHODS
Five different commercial starches were selected in this study. Normal and waxy corn starches were provided by Cerestar USA Inc. (Hammond, IN). Potato starch was purchased from Sigma Chemical (Cat no. S 4251, St. Louis, MO). Wheat starch was a gift of Midwest Grain Products (Atchison,�KS), and tapioca starch was a gift from National Starch and Chemical (Bridgewater, NJ). Deionized water used for sample analysis was treated by using the Milli-Q reagent water system (Millipore, Bedford, MA).
Preparation of Starch Suspension Pasting properties of the starch suspension (8%, w/w, dsb) were
measured by using the MVA (A.W. Brabender Instruments, South Hackensack, NJ) and the RVA (Model RVA-4, Newport Scientific, Warriewood, Australia). Starch suspensions of 28 g and 100 g containing 2.24 g and 8.0 g starch (dsb) were used for the RVA and the MVA test, respectively. For the RVA test, 2.24 g of starch (dsb) was directly weighed into an aluminum sample canister, and water was added up to a total weight of 28 g of suspension. For the MVA test, 8.0 g (dsb) of starch was directly weighed into a stainless steel measuring bowl, and water was added up to 100 g suspension. The viscosity, using the MVA, was measured at 110 c⋅mg cartridge.
Cooking Conditions To examine the effect of cooking (heating/cooling) rate and
stirring speed on the starch pasting properties measured using the MVA and the RVA, starch suspensions were cooked at a fast (6°C/min) or slow (1.5°C/min) cooking rate and stirred at 75 or 160 rpm rotation speed. For the fast cooking process, starch
1 Department of Food Science and Human Nutrition, Iowa State University, Ames, IA 50011.
2 Corresponding author. Phone: 1-515-294-9892. Fax: 1-515-294-8181. E-mail:[email protected].
Publication no. C-2003-1003-06R. © 2003 American Association of Cereal Chemists, Inc.
746 CEREAL CHEMISTRY
suspensions were equilibrated at 30°C for 1 min, heated to 95°C at 6°C/min, held at 95°C for 5 min, cooled to 30°C at 6°C/min, and held at 30°C for 1 min. Total running time of the fast cooking process was 25 min 20 sec. For the slow cooking process, starch suspensions were equilibrated at 30°C for 1 min, heated to 95°C at 1.5°C/min, held at 95°C for 30 min, cooled to 30°C at 1.5°C/min, and held at 30°C for 30 min (Medcalf and Jilles 1965). Total running time of the slow cooking process was 134 min, 20 sec. All samples were analyzed in triplicate for each pasting condition.
Data Analysis Pasting temperature, peak viscosity, breakdown, and setback
viscosity were recorded from MVA and RVA pasting viscosity pro-files. The breakdown and setback viscosity were defined as the difference between the peak and the minimum viscosity, and the increase in viscosity during cooling, respectively. Pasting temperatures were shown as the average values with standard deviation of triplicate analyses.
RESULTS AND DISCUSSION
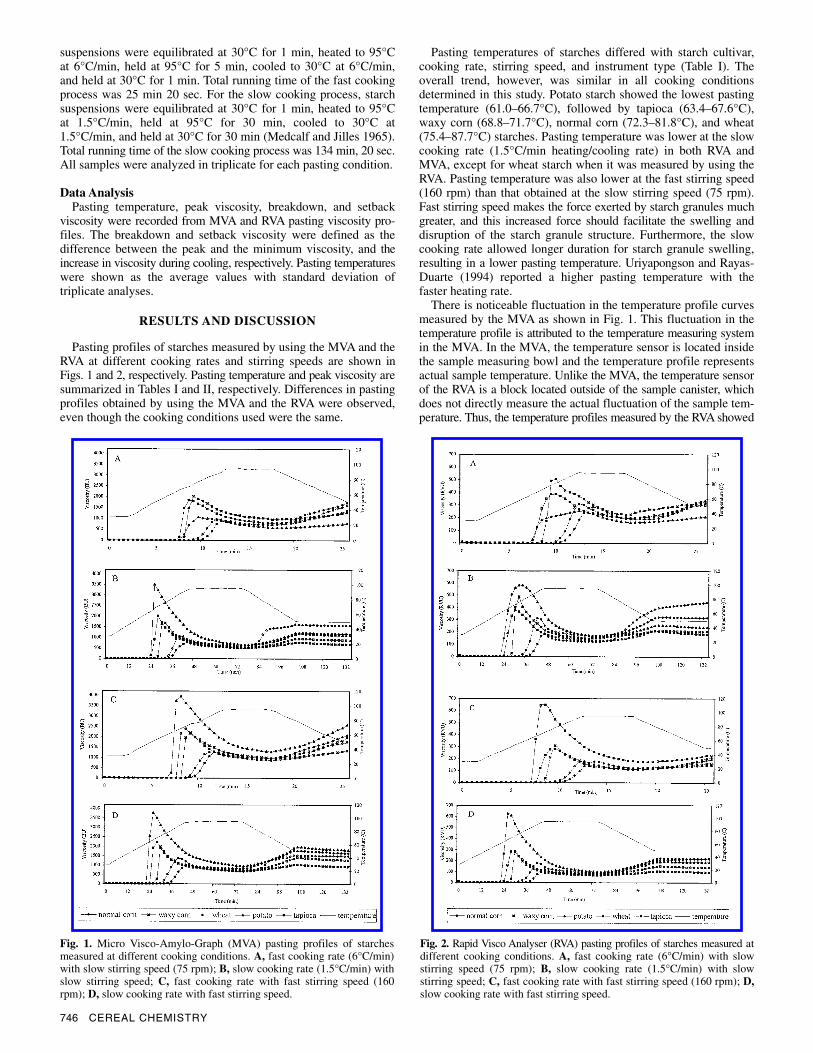
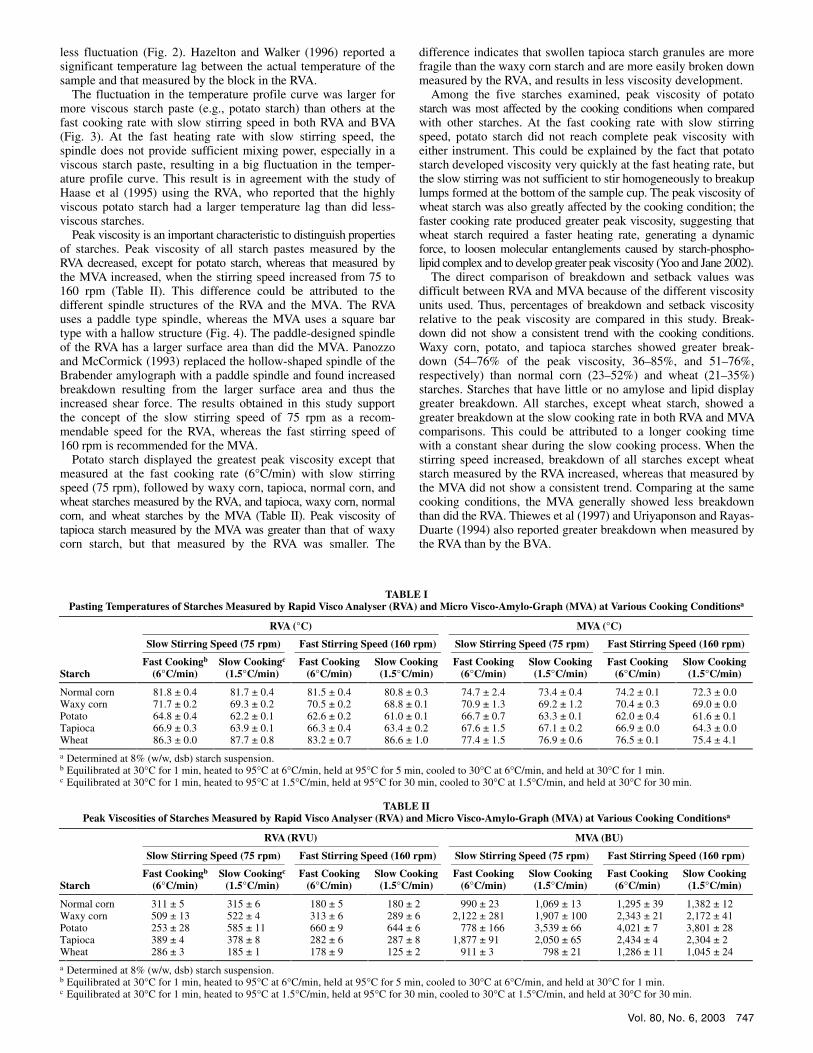
Pasting profiles of starches measured by using the MVA and the RVA at different cooking rates and stirring speeds are shown in Figs. 1 and 2, respectively. Pasting temperature and peak viscosity are summarized in Tables I and II, respectively. Differences in pasting profiles obtained by using the MVA and the RVA were observed, even though the cooking conditions used were the same.
Pasting temperatures of starches differed with starch cultivar, cooking rate, stirring speed, and instrument type (Table I). The overall trend, however, was similar in all cooking conditions determined in this study. Potato starch showed the lowest pasting temperature (61.0–66.7°C), followed by tapioca (63.4–67.6°C), waxy corn (68.8–71.7°C), normal corn (72.3–81.8°C), and wheat (75.4–87.7°C) starches. Pasting temperature was lower at the slow cooking rate (1.5°C/min heating/cooling rate) in both RVA and MVA, except for wheat starch when it was measured by using the RVA. Pasting temperature was also lower at the fast stirring speed (160 rpm) than that obtained at the slow stirring speed (75 rpm). Fast stirring speed makes the force exerted by starch granules much greater, and this increased force should facilitate the swelling and disruption of the starch granule structure. Furthermore, the slow cooking rate allowed longer duration for starch granule swelling, resulting in a lower pasting temperature. Uriyapongson and Rayas-Duarte (1994) reported a higher pasting temperature with the faster heating rate.
There is noticeable fluctuation in the temperature profile curves measured by the MVA as shown in Fig. 1. This fluctuation in the temperature profile is attributed to the temperature measuring system in the MVA. In the MVA, the temperature sensor is located inside the sample measuring bowl and the temperature profile represents actual sample temperature. Unlike the MVA, the temperature sensor of the RVA is a block located outside of the sample canister, which does not directly measure the actual fluctuation of the sample tem-perature. Thus, the temperature profiles measured by the RVA showed
Fig. 1. Micro Visco-Amylo-Graph (MVA) pasting profiles of starches measured at different cooking conditions. A, fast cooking rate (6°C/min) with slow stirring speed (75 rpm); B, slow cooking rate (1.5°C/min) with slow stirring speed; C, fast cooking rate with fast stirring speed (160 rpm); D, slow cooking rate with fast stirring speed.
Fig. 2. Rapid Visco Analyser (RVA) pasting profiles of starches measured at different cooking conditions. A, fast cooking rate (6°C/min) with slow stirring speed (75 rpm); B, slow cooking rate (1.5°C/min) with slow stirring speed; C, fast cooking rate with fast stirring speed (160 rpm); D,slow cooking rate with fast stirring speed.
Vol. 80, No. 6, 2003 747
less fluctuation (Fig. 2). Hazelton and Walker (1996) reported a significant temperature lag between the actual temperature of the sample and that measured by the block in the RVA.
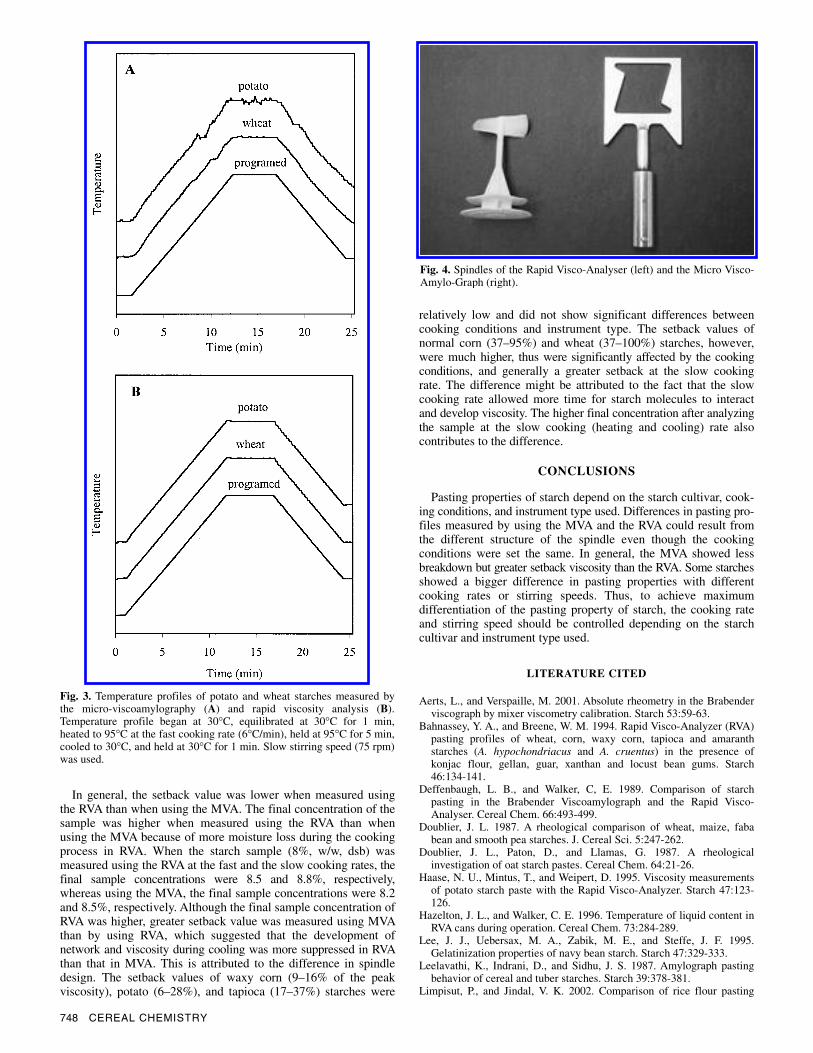
The fluctuation in the temperature profile curve was larger for more viscous starch paste (e.g., potato starch) than others at the fast cooking rate with slow stirring speed in both RVA and BVA (Fig. 3). At the fast heating rate with slow stirring speed, the spindle does not provide sufficient mixing power, especially in a viscous starch paste, resulting in a big fluctuation in the temper-ature profile curve. This result is in agreement with the study of Haase et al (1995) using the RVA, who reported that the highly viscous potato starch had a larger temperature lag than did less-viscous starches.
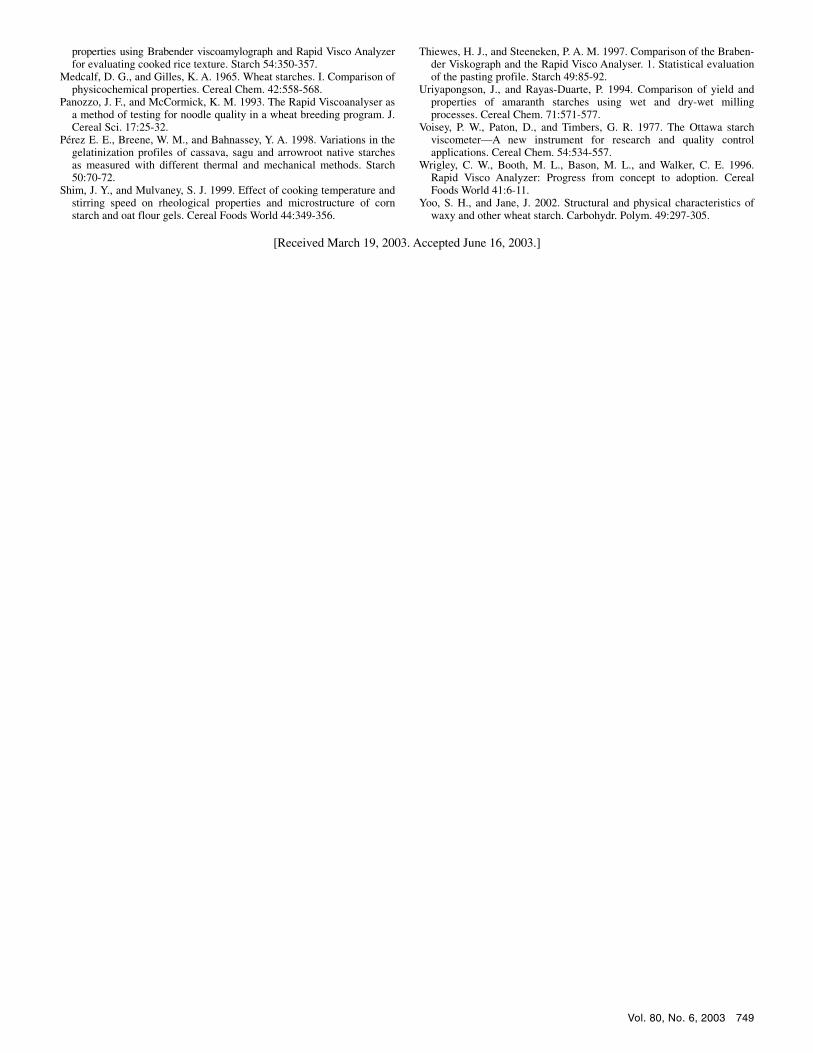
Peak viscosity is an important characteristic to distinguish properties of starches. Peak viscosity of all starch pastes measured by the RVA decreased, except for potato starch, whereas that measured by the MVA increased, when the stirring speed increased from 75 to 160 rpm (Table II). This difference could be attributed to the different spindle structures of the RVA and the MVA. The RVA uses a paddle type spindle, whereas the MVA uses a square bar type with a hallow structure (Fig. 4). The paddle-designed spindle of the RVA has a larger surface area than did the MVA. Panozzo and McCormick (1993) replaced the hollow-shaped spindle of the Brabender amylograph with a paddle spindle and found increased breakdown resulting from the larger surface area and thus the increased shear force. The results obtained in this study support the concept of the slow stirring speed of 75 rpm as a recom-mendable speed for the RVA, whereas the fast stirring speed of 160 rpm is recommended for the MVA.
Potato starch displayed the greatest peak viscosity except that measured at the fast cooking rate (6°C/min) with slow stirring speed (75 rpm), followed by waxy corn, tapioca, normal corn, and wheat starches measured by the RVA, and tapioca, waxy corn, normal corn, and wheat starches by the MVA (Table II). Peak viscosity of tapioca starch measured by the MVA was greater than that of waxy corn starch, but that measured by the RVA was smaller. The
difference indicates that swollen tapioca starch granules are more fragile than the waxy corn starch and are more easily broken down measured by the RVA, and results in less viscosity development.
Among the five starches examined, peak viscosity of potato starch was most affected by the cooking conditions when compared with other starches. At the fast cooking rate with slow stirring speed, potato starch did not reach complete peak viscosity with either instrument. This could be explained by the fact that potato starch developed viscosity very quickly at the fast heating rate, but the slow stirring was not sufficient to stir homogeneously to breakup lumps formed at the bottom of the sample cup. The peak viscosity of wheat starch was also greatly affected by the cooking condition; the faster cooking rate produced greater peak viscosity, suggesting that wheat starch required a faster heating rate, generating a dynamic force, to loosen molecular entanglements caused by starch-phospho-lipid complex and to develop greater peak viscosity (Yoo and Jane 2002).
The direct comparison of breakdown and setback values was difficult between RVA and MVA because of the different viscosity units used. Thus, percentages of breakdown and setback viscosity relative to the peak viscosity are compared in this study. Break-down did not show a consistent trend with the cooking conditions. Waxy corn, potato, and tapioca starches showed greater break-down (54–76% of the peak viscosity, 36–85%, and 51–76%, respectively) than normal corn (23–52%) and wheat (21–35%) starches. Starches that have little or no amylose and lipid display greater breakdown. All starches, except wheat starch, showed a greater breakdown at the slow cooking rate in both RVA and MVA comparisons. This could be attributed to a longer cooking time with a constant shear during the slow cooking process. When the stirring speed increased, breakdown of all starches except wheat starch measured by the RVA increased, whereas that measured by the MVA did not show a consistent trend. Comparing at the same cooking conditions, the MVA generally showed less breakdown than did the RVA. Thiewes et al (1997) and Uriyaponson and Rayas-Duarte (1994) also reported greater breakdown when measured by the RVA than by the BVA.
TABLE I Pasting Temperatures of Starches Measured by Rapid Visco Analyser (RVA) and Micro Visco-Amylo-Graph (MVA) at Various Cooking Conditionsa
RVA (°C) MVA (°C)
Slow Stirring Speed (75 rpm) Fast Stirring Speed (160 rpm) Slow Stirring Speed (75 rpm) Fast Stirring Speed (160 rpm)
Starch
Fast Cookingb
(6°C/min) Slow Cookingc
(1.5°C/min) Fast Cooking
(6°C/min) Slow Cooking (1.5°C/min)
Fast Cooking (6°C/min)
Slow Cooking (1.5°C/min)
Fast Cooking (6°C/min)
Slow Cooking (1.5°C/min)
Normal corn 81.8 ± 0.4 81.7 ± 0.4 81.5 ± 0.4 80.8 ± 0.3 74.7 ± 2.4 73.4 ± 0.4 74.2 ± 0.1 72.3 ± 0.0 Waxy corn 71.7 ± 0.2 69.3 ± 0.2 70.5 ± 0.2 68.8 ± 0.1 70.9 ± 1.3 69.2 ± 1.2 70.4 ± 0.3 69.0 ± 0.0 Potato 64.8 ± 0.4 62.2 ± 0.1 62.6 ± 0.2 61.0 ± 0.1 66.7 ± 0.7 63.3 ± 0.1 62.0 ± 0.4 61.6 ± 0.1 Tapioca 66.9 ± 0.3 63.9 ± 0.1 66.3 ± 0.4 63.4 ± 0.2 67.6 ± 1.5 67.1 ± 0.2 66.9 ± 0.0 64.3 ± 0.0 Wheat 86.3 ± 0.0 87.7 ± 0.8 83.2 ± 0.7 86.6 ± 1.0 77.4 ± 1.5 76.9 ± 0.6 76.5 ± 0.1 75.4 ± 4.1
a Determined at 8% (w/w, dsb) starch suspension. b Equilibrated at 30°C for 1 min, heated to 95°C at 6°C/min, held at 95°C for 5 min, cooled to 30°C at 6°C/min, and held at 30°C for 1 min. c Equilibrated at 30°C for 1 min, heated to 95°C at 1.5°C/min, held at 95°C for 30 min, cooled to 30°C at 1.5°C/min, and held at 30°C for 30 min.
TABLE II
Peak Viscosities of Starches Measured by Rapid Visco Analyser (RVA) and Micro Visco-Amylo-Graph (MVA) at Various Cooking Conditionsa
RVA (RVU) MVA (BU)
Slow Stirring Speed (75 rpm) Fast Stirring Speed (160 rpm) Slow Stirring Speed (75 rpm) Fast Stirring Speed (160 rpm)
Starch
Fast Cookingb
(6°C/min) Slow Cookingc
(1.5°C/min) Fast Cooking
(6°C/min) Slow Cooking (1.5°C/min)
Fast Cooking (6°C/min)
Slow Cooking (1.5°C/min)
Fast Cooking (6°C/min)
Slow Cooking (1.5°C/min)
Normal corn 311 ± 5 315 ± 6 180 ± 5 180 ± 2 990 ± 23 1,069 ± 13 1,295 ± 39 1,382 ± 12 Waxy corn 509 ± 13 522 ± 4 313 ± 6 289 ± 6 2,122 ± 281 1,907 ± 100 2,343 ± 21 2,172 ± 41 Potato 253 ± 28 585 ± 11 660 ± 9 644 ± 6 778 ± 166 3,539 ± 66 4,021 ± 7 3,801 ± 28 Tapioca 389 ± 4 378 ± 8 282 ± 6 287 ± 8 1,877 ± 91 2,050 ± 65 2,434 ± 4 2,304 ± 2 Wheat 286 ± 3 185 ± 1 178 ± 9 125 ± 2 911 ± 3 798 ± 21 1,286 ± 11 1,045 ± 24
a Determined at 8% (w/w, dsb) starch suspension. b Equilibrated at 30°C for 1 min, heated to 95°C at 6°C/min, held at 95°C for 5 min, cooled to 30°C at 6°C/min, and held at 30°C for 1 min. c Equilibrated at 30°C for 1 min, heated to 95°C at 1.5°C/min, held at 95°C for 30 min, cooled to 30°C at 1.5°C/min, and held at 30°C for 30 min.
748 CEREAL CHEMISTRY
In general, the setback value was lower when measured using the RVA than when using the MVA. The final concentration of the sample was higher when measured using the RVA than when using the MVA because of more moisture loss during the cooking process in RVA. When the starch sample (8%, w/w, dsb) was measured using the RVA at the fast and the slow cooking rates, the final sample concentrations were 8.5 and 8.8%, respectively, whereas using the MVA, the final sample concentrations were 8.2 and 8.5%, respectively. Although the final sample concentration of RVA was higher, greater setback value was measured using MVA than by using RVA, which suggested that the development of network and viscosity during cooling was more suppressed in RVA than that in MVA. This is attributed to the difference in spindle design. The setback values of waxy corn (9–16% of the peak viscosity), potato (6–28%), and tapioca (17–37%) starches were
relatively low and did not show significant differences between cooking conditions and instrument type. The setback values of normal corn (37–95%) and wheat (37–100%) starches, however, were much higher, thus were significantly affected by the cooking conditions, and generally a greater setback at the slow cooking rate. The difference might be attributed to the fact that the slow cooking rate allowed more time for starch molecules to interact and develop viscosity. The higher final concentration after analyzing the sample at the slow cooking (heating and cooling) rate also contributes to the difference.
CONCLUSIONS
Pasting properties of starch depend on the starch cultivar, cook-ing conditions, and instrument type used. Differences in pasting pro-files measured by using the MVA and the RVA could result from the different structure of the spindle even though the cooking conditions were set the same. In general, the MVA showed less breakdown but greater setback viscosity than the RVA. Some starches showed a bigger difference in pasting properties with different cooking rates or stirring speeds. Thus, to achieve maximum differentiation of the pasting property of starch, the cooking rate and stirring speed should be controlled depending on the starch cultivar and instrument type used.
LITERATURE CITED
Aerts, L., and Verspaille, M. 2001. Absolute rheometry in the Brabender viscograph by mixer viscometry calibration. Starch 53:59-63.
Bahnassey, Y. A., and Breene, W. M. 1994. Rapid Visco-Analyzer (RVA) pasting profiles of wheat, corn, waxy corn, tapioca and amaranth starches (A. hypochondriacus and A. cruentus) in the presence of konjac flour, gellan, guar, xanthan and locust bean gums. Starch 46:134-141.
Deffenbaugh, L. B., and Walker, C, E. 1989. Comparison of starch pasting in the Brabender Viscoamylograph and the Rapid Visco-Analyser. Cereal Chem. 66:493-499.
Doublier, J. L. 1987. A rheological comparison of wheat, maize, faba bean and smooth pea starches. J. Cereal Sci. 5:247-262.
Doublier, J. L., Paton, D., and Llamas, G. 1987. A rheological investigation of oat starch pastes. Cereal Chem. 64:21-26.
Haase, N. U., Mintus, T., and Weipert, D. 1995. Viscosity measurements of potato starch paste with the Rapid Visco-Analyzer. Starch 47:123-126.
Hazelton, J. L., and Walker, C. E. 1996. Temperature of liquid content in RVA cans during operation. Cereal Chem. 73:284-289.
Lee, J. J., Uebersax, M. A., Zabik, M. E., and Steffe, J. F. 1995. Gelatinization properties of navy bean starch. Starch 47:329-333.
Leelavathi, K., Indrani, D., and Sidhu, J. S. 1987. Amylograph pasting behavior of cereal and tuber starches. Starch 39:378-381.
Limpisut, P., and Jindal, V. K. 2002. Comparison of rice flour pasting
Fig. 3. Temperature profiles of potato and wheat starches measured by the micro-viscoamylography (A) and rapid viscosity analysis (B). Temperature profile began at 30°C, equilibrated at 30°C for 1 min, heated to 95°C at the fast cooking rate (6°C/min), held at 95°C for 5 min, cooled to 30°C, and held at 30°C for 1 min. Slow stirring speed (75 rpm) was used.
Fig. 4. Spindles of the Rapid Visco-Analyser (left) and the Micro Visco-Amylo-Graph (right).
Vol. 80, No. 6, 2003 749
properties using Brabender viscoamylograph and Rapid Visco Analyzer for evaluating cooked rice texture. Starch 54:350-357.
Medcalf, D. G., and Gilles, K. A. 1965. Wheat starches. I. Comparison of physicochemical properties. Cereal Chem. 42:558-568.
Panozzo, J. F., and McCormick, K. M. 1993. The Rapid Viscoanalyser as a method of testing for noodle quality in a wheat breeding program. J. Cereal Sci. 17:25-32.
Pérez E. E., Breene, W. M., and Bahnassey, Y. A. 1998. Variations in the gelatinization profiles of cassava, sagu and arrowroot native starches as measured with different thermal and mechanical methods. Starch 50:70-72.
Shim, J. Y., and Mulvaney, S. J. 1999. Effect of cooking temperature and stirring speed on rheological properties and microstructure of corn starch and oat flour gels. Cereal Foods World 44:349-356.
Thiewes, H. J., and Steeneken, P. A. M. 1997. Comparison of the Braben-der Viskograph and the Rapid Visco Analyser. 1. Statistical evaluation of the pasting profile. Starch 49:85-92.
Uriyapongson, J., and Rayas-Duarte, P. 1994. Comparison of yield and properties of amaranth starches using wet and dry-wet milling processes. Cereal Chem. 71:571-577.
Voisey, P. W., Paton, D., and Timbers, G. R. 1977. The Ottawa starch viscometer—A new instrument for research and quality control applications. Cereal Chem. 54:534-557.
Wrigley, C. W., Booth, M. L., Bason, M. L., and Walker, C. E. 1996. Rapid Visco Analyzer: Progress from concept to adoption. Cereal Foods World 41:6-11.
Yoo, S. H., and Jane, J. 2002. Structural and physical characteristics of waxy and other wheat starch. Carbohydr. Polym. 49:297-305.
[Received March 19, 2003. Accepted June 16, 2003.]