Embed Size (px)
Citation preview
ONCOLOGY LETTERS 16: 4656-4662, 20184656
Abstract. Acute myeloid leukemia associated with t(8;21)(q22;q22)/runt related transcription factor (RUNX)1-RUNX1 translocation partner 1 has been reported to exhibit a favor-able outcome. The quantitative polymerase chain reaction is a reliable method for assessing minimal residual disease persis-tence, and peripheral blood (PB) samples are as informative as bone marrow (BM) samples during follow-up monitoring. However, few studies have compared the spatial organization of leukemia‑specific chromosomes between BM and PB. In the present study, paired BM and PB samples were extracted from 6 patients with acute myeloid leukaemia-M2 and compared using three‑dimensional fluorescence in situ hybridization. Cells were classified into three types: Normal, proximal and malignant. Comparisons of proportions (% of all cells) of different cell types revealed no significant difference between BM and PB samples. The relative radial positions (RRPs; d/R) of chromosomes 8 and 21 were consistent for 2/3 of BM and PB samples. The RRPs of chromosomes in proximal pairs were more interior in nuclei compared with chromosomes in normal pairs for BM and PB samples. The consistency of the spatial organization of chromosomes between BM and PB
suggests that PB may be an alternative to BM for research and clinical diagnosis.
Introduction
Core-binding factor (CBF) acute myeloid leukemia (AML) associated with t(8;21; q22;q22)/runt related transcription factor (RUNX)1-RUNX1 translocation partner 1 (T1) or inv(16; p13q22)/t(16;16; p13;q22)/CBFβ subunit-myosin heavy chain 11 has been reported to exhibit a favorable outcome (1-3). Jourdan et al (4) reported that, compared with gene mutations, minimal residual disease (MRD) levels play a more important role in predicting early relapse in patients with CBF-AML. Two popular approaches to detect MRD persistence are quan-titative polymerase chain reaction (qPCR) and multiparametric flow cytometry, which possess increased submicroscopic sensitivity compared with that possessed by conventional morphology (5-7). Although multiple studies are attempting to stratify patients into low- or high-risk relapse groups, the threshold to do so remains controversial (8-11). Since it is affected by many technical and clinical factors, a universal cut-off remains to be agreed upon at present. Furthermore, for children with AML, PCR and multiparametric flow cytometry have been associated with inconsistent results (5,7).
Spatially proximal heterogeneous chromosomes are more likely to cause chromosomal translocations compared with spatially distant heterogeneous chromosomes, and these trans-location-prone chromosomes are frequently located towards the center of the nucleus (12-15). To further understand the clinical features and treatment response, our previous study followed up with a patient with AML with maturation to delineate the spatial organization of leukemia-specific chromosomes using three‑dimensional fluorescence in situ hybridization (3D‑FISH) as a means to detect MRD persis-tence (16). Disease deterioration was detected using 3D‑FISH [with 37% malignant cells (MCs); P<0.05] 4 months prior to final relapse, whereas the PCR and 2D‑FISH results were negative with no gene fusion transcripts or chromosomal trans-locations. 3D‑FISH analysis in the study provided information that may assist in predicting early relapse (16).
Studies using PCR to monitor MRD persistence in AML have demonstrated that peripheral blood (PB) samples were as informative as bone marrow (BM) samples in identifying
Comparison of spatial chromosomal organization between bone marrow and peripheral blood in acute myeloid leukemia
XUELI TIAN1*, YANFANG WANG2*, YU LIU1, JUN YIN1, DIEYAN CHEN1, XIAOYAN KE2 and WANYUN MA1,3
1State Key Laboratory of Low‑Dimensional Quantum Physics, Department of Physics, Tsinghua University, Beijing 100084; 2Department of Hematology, Peking University Third Hospital, Beijing 100191;
3Collaborative Innovation Centre of Quantum Matter, Beijing 100084, P.R. China
Received July 24, 2016; Accepted July 20, 2017
DOI: 10.3892/ol.2018.9228
Correspondence to: Professor Wanyun Ma, State Key Laboratory of Low‑Dimensional Quantum Physics, Department of Physics, Tsinghua University, 30 ShuangQing Road, Beijing 100084, P.R. ChinaE-mail: [email protected]
Professor Xiaoyan Ke, Department of Hematology, Peking University Third Hospital, 49 North Garden Road, Beijing 100191, P.R. ChinaE-mail: [email protected]
*Contributed equally
Abbreviations: NP, normal pair; PP, proximal pair; NC, normal cell; PC, proximal cell; MC, malignant cell; RRP, relative radial position
Key words: acute myeloid leukemia, spatial organization, bone marrow, peripheral blood, three-dimensional fluorescence in situ hybridization

TIAN et al: CHROMOSOMAL STRUCTURE IN BONE MARROW AND PERIPHERAL BLOOD 4657
patients at high risk of relapse and may represent an alterna-tive source of cells for diagnosis (17-20). To further assess the similarities and differences between BM and PB, the present study compared the spatial organization of leukemia‑specific chromosomes between BM and PB samples from 6 patients with AML‑M2 using 3D‑FISH with a confocal laser scanning microscope system.
Materials and methods
Materials. Paired BM and PB samples were collected from 6 patients (aged 24-47 years, including 5 males and 1 female) with AML-M2, including 5 RUNX1-RUNX1T1+ patients (numbered as 1‑5 in Table I) at three different stages (initial diagnosis, post-chemotherapy and remittent) and 1 RUNX1-RUNX1T1- patient at initial diagnosis (numbered as 6 in Table I), who were treated at Peking University Third Hospital (Beijing, China) between December 2012 and September 2015. All patients provided written informed consent to participate in the present study. The present study was approved by the Ethics Committee of Peking University Third Hospital.
Reverse transcription‑quantitative poylermase chain reac‑tion (RT‑qPCR). Mononuclear cells (MNCs) from the BM were isolated using Ficoll-Hypaque lymphocyte separation medium (Lonza Group, Ltd., Basel, Switzerland). Furthermore, RNA was extracted from MNCs using TRIzol (Invitrogen; Thermo Fisher Scientific, Inc.) according to the manufacturer's guidelines. cDNA was generated using the Maxima H Minus First Strand cDNA Synthesis kit (Thermo Fisher Scientific, Inc., Waltham, MA, USA). Cycling conditions were 25˚C for 10 min, followed by 50˚C for 15 min and the reaction was terminated at 85˚C for 5 min. RT‑qPCR was performed to monitor the RUNX1-RUNX1T1 transcripts according to the manufacturer's standard protocol (RUNX1‑RUNX1T1 Fusion gene Quant® kit; YuanQi Biomedical, Ltd., Shanghai, China) using the ABI PRISM 7500 DNA Sequence Detection system (Applied Biosystems; http://home.appliedbiosystems.com). The reference gene was Abelson (ABL). The fluoro-phore of TaqMan and primers (RUNX1-RUNX1T1 fusion gene: Forward, 5'‑AAT CAC AGT GGA TGG GCC C‑3' and reverse, 5'‑GAG TCT GGC ATT GTG GAG TGC‑3'. ABL gene: Forward, 5'‑TGG AGA TAA CAC TCT AAG C‑3' and reverse, 5'‑GAT GTA GTT GCT TGG GAC CCA‑3') were all included in the kit. Cycling conditions were 42˚C for 30 min, initial denaturation at 94˚C for 5 min, followed by 40 cycles of denaturation (at 94˚C for 15 sec) and annealing (at 60˚C for 15 sec). Clinical RT-qPCR results showed that the relative RUNX1-RUNX1T1 transcripts, which were calculated using the 2-ΔΔCq method (7,21), for BM samples from the 6 patients were 52.00, 0.09, 0.05, 0.00, 1.80 and 0.00%, which approxi-mately described the disease conditions of the patients that the initial diagnosed patient showed high RUNX1-RUNX1T1 transcripts (52.00%) and remitted or RUNX1-RUNX1T1- patients showed low RUNX1-RUNX1T1 transcripts (0.09, 0.05, 0.00, 1.80 and 0.00%).
3D‑FISH and imaging. MNCs were obtainedd using Ficol-Hypaque density gradient centrifugation as previously
described (22), and ≥60 interphase cells from each sample were analyzed in 3D‑FISH experiments, which were performed as previously described (22). Suspended MNCs were adhered onto the rough surface of a microscope slide following incubation for 150 min at 37˚C with 5% CO2. Subsequently, MNCs were fixed in 4% paraformaldehyde for 10 min at room temperature and then underwent certain pre-treatments (22) to increase the likelihood of successful hybridization. Whole chromosome 8 probes (green; Kreatech Diagnostics; Leica Biosystems, Wetzlar, Germany) labeled with fluorescein isothiocyanate (FITC) and whole chromo-some 21 probes (red; Kreatech Diagnostics; Leica Biosystems) labeled with tetramethylrhodamine isothiocyanate were used to label chromosome 8 and 21, respectively, in a hybridiza-tion oven (ThermoBrite S500; StatSpin, Inc., Westwood, MA, USA; www.statspin.com) with denaturation for 5 min at 75˚C and then hybridization for 48 h at 37˚C. Following washing with Igepal CA‑630 (21), 10 µl diamidinophenylindole (blue; 0.1 µg/ml) was used to counterstain the nuclei at ‑20˚C for more than 15 min.
Image stacks were acquired using a Nikon A1Rsi confocal microscope system with a Plan Apo 100x/1.4 NA oil immersion objective lens. Excitation spectrums for diamidinophenylin-dole, FITC, and tetramethylrhodamine isothiocyanate were 405, 488, and 561 nm, respectively. The size of the x-y optical sections was 512x512 pixels with a pixel size of 80x80 nm, and the axial step was 500 nm.
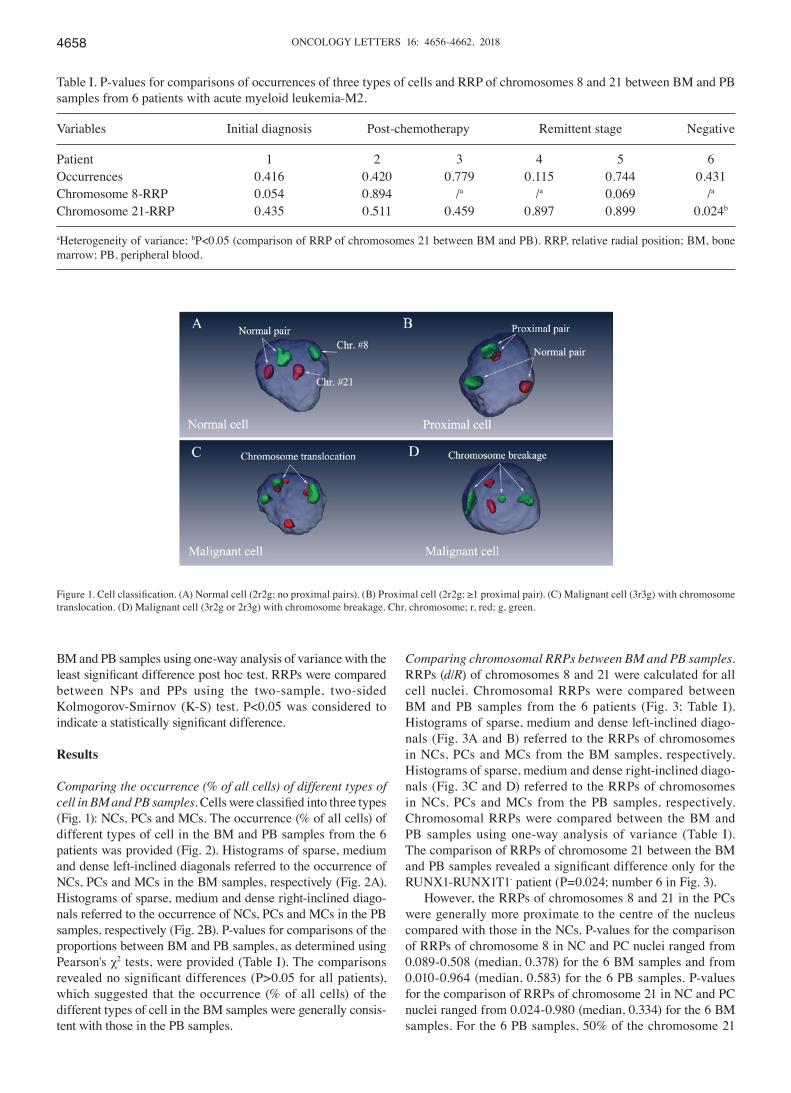
Statistical analysis. The 3D views of the nuclei were recon-structed using Amira 5.4.3 software (FEI; Thermo Fisher Scientific, Inc.; Fig. 1). Green signals indicated chromosome 8 and red signals referred to chromosome 21. The blue spheres represented the nuclei. Only cells that exhibited ≥2 green signals and 2 red signals were considered in the analysis. According to the number and spatial relative positions of the green/red signals, the present study classified the cells into three types: Normal cells (NCs; Fig. 1A), proximal cells (PCs; Fig. 1B) and malignant cells (MCs; Fig. 1C and D). Cells that exhibited 3 green or red signals (3g or 3r) were identified as MCs with chromosomal translocations and breakages. Cells that possessed 2 red and 2 green signals (2r2g) were further categorized according to the characterization of the physical contact between the heterogeneous chromosomes. In cells that exhibited 2r2g signals, heterogeneous chromosomes touching or intermingling with each other were considered proximal and categorized as proximal pairs (PPs); chromosomes located distantly from each other were categorized as normal pairs (NPs). Cells that exhibited 2r2g signals were classified as NCs when all heterogeneous chromosomes were NPs, and were classified as PCs when there was at least one PP in the nucleus.
The present study calculated the relative radial positions [RRPs; the distance from the center of mass of chromosome 8 or 21 to the center of mass of the nucleus (d)/the radius of the nucleus (R)] of chromosomes 8 and 21 in all cell nuclei. No less than 60 cells were calculated for each sample during the analysis. RRPs of chromosomes are presented as mean ± standard error of the mean. SPSS 16.0 (SPSS Inc., Chicago, IL, USA) was used to perform statistical analysis. The frequencies of different types of cell were compared between BM and PB samples using Pearson's χ2 test. Chromosomal RRPs were compared between
ONCOLOGY LETTERS 16: 4656-4662, 20184658
BM and PB samples using one-way analysis of variance with the least significant difference post hoc test. RRPs were compared between NPs and PPs using the two-sample, two-sided Kolmogorov‑Smirnov (K‑S) test. P<0.05 was considered to indicate a statistically significant difference.
Results
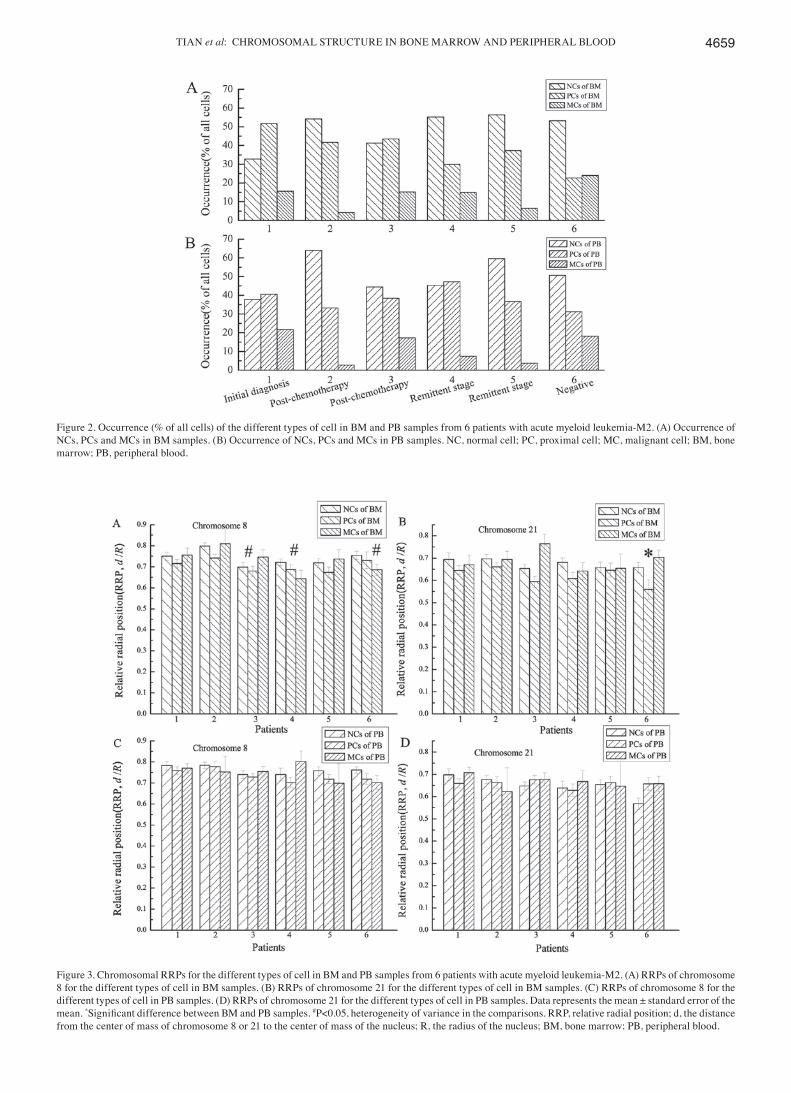
Comparing the occurrence (% of all cells) of different types of cell in BM and PB samples. Cells were classified into three types (Fig. 1): NCs, PCs and MCs. The occurrence (% of all cells) of different types of cell in the BM and PB samples from the 6 patients was provided (Fig. 2). Histograms of sparse, medium and dense left-inclined diagonals referred to the occurrence of NCs, PCs and MCs in the BM samples, respectively (Fig. 2A). Histograms of sparse, medium and dense right-inclined diago-nals referred to the occurrence of NCs, PCs and MCs in the PB samples, respectively (Fig. 2B). P-values for comparisons of the proportions between BM and PB samples, as determined using Pearson's χ2 tests, were provided (Table I). The comparisons revealed no significant differences (P>0.05 for all patients), which suggested that the occurrence (% of all cells) of the different types of cell in the BM samples were generally consis-tent with those in the PB samples.
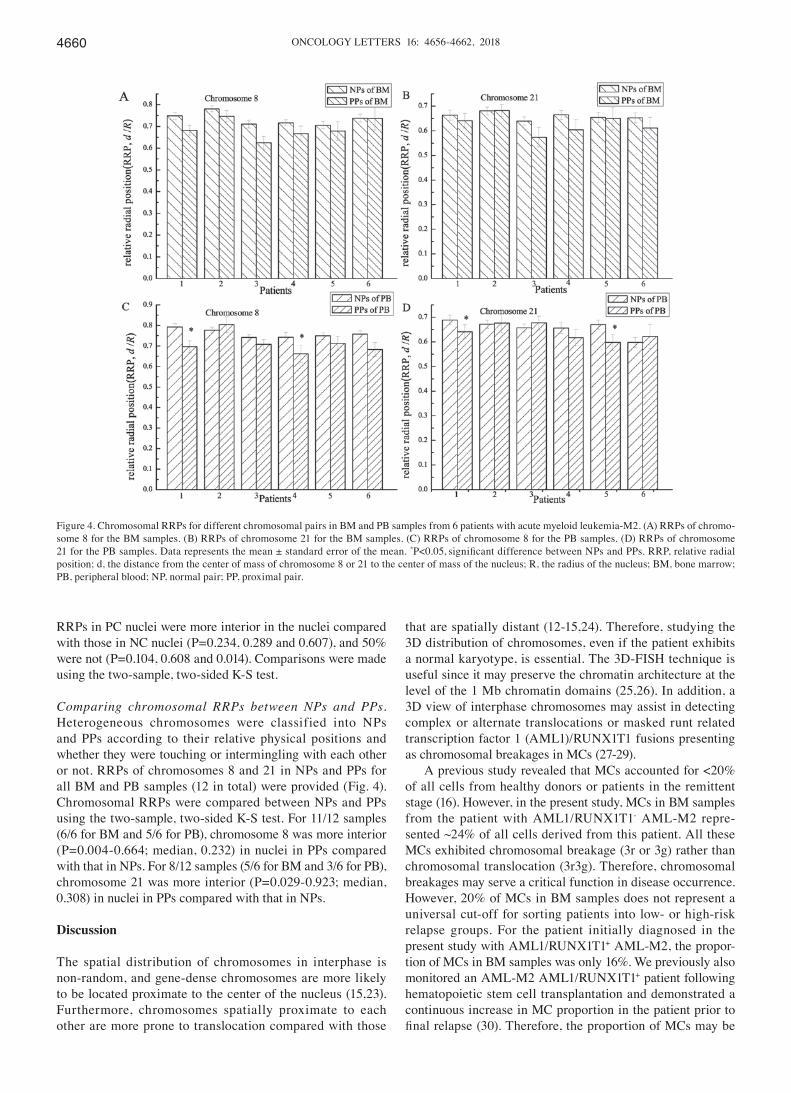
Comparing chromosomal RRPs between BM and PB samples. RRPs (d/R) of chromosomes 8 and 21 were calculated for all cell nuclei. Chromosomal RRPs were compared between BM and PB samples from the 6 patients (Fig. 3; Table I). Histograms of sparse, medium and dense left-inclined diago-nals (Fig. 3A and B) referred to the RRPs of chromosomes in NCs, PCs and MCs from the BM samples, respectively. Histograms of sparse, medium and dense right-inclined diago-nals (Fig. 3C and D) referred to the RRPs of chromosomes in NCs, PCs and MCs from the PB samples, respectively. Chromosomal RRPs were compared between the BM and PB samples using one‑way analysis of variance (Table I). The comparison of RRPs of chromosome 21 between the BM and PB samples revealed a significant difference only for the RUNX1-RUNX1T1- patient (P=0.024; number 6 in Fig. 3).
However, the RRPs of chromosomes 8 and 21 in the PCs were generally more proximate to the centre of the nucleus compared with those in the NCs. P-values for the comparison of RRPs of chromosome 8 in NC and PC nuclei ranged from 0.089-0.508 (median, 0.378) for the 6 BM samples and from 0.010-0.964 (median, 0.583) for the 6 PB samples. P-values for the comparison of RRPs of chromosome 21 in NC and PC nuclei ranged from 0.024-0.980 (median, 0.334) for the 6 BM samples. For the 6 PB samples, 50% of the chromosome 21
Table I. P‑values for comparisons of occurrences of three types of cells and RRP of chromosomes 8 and 21 between BM and PB samples from 6 patients with acute myeloid leukemia-M2.
Variables Initial diagnosis Post‑chemotherapy Remittent stage Negative
Patient 1 2 3 4 5 6Occurrences 0.416 0.420 0.779 0.115 0.744 0.431Chromosome 8-RRP 0.054 0.894 /a /a 0.069 /a
Chromosome 21-RRP 0.435 0.511 0.459 0.897 0.899 0.024b
aHeterogeneity of variance; bP<0.05 (comparison of RRP of chromosomes 21 between BM and PB). RRP, relative radial position; BM, bone marrow; PB, peripheral blood.
Figure 1. Cell classification. (A) Normal cell (2r2g; no proximal pairs). (B) Proximal cell (2r2g; ≥1 proximal pair). (C) Malignant cell (3r3g) with chromosome translocation. (D) Malignant cell (3r2g or 2r3g) with chromosome breakage. Chr, chromosome; r, red; g, green.
TIAN et al: CHROMOSOMAL STRUCTURE IN BONE MARROW AND PERIPHERAL BLOOD 4659
Figure 3. Chromosomal RRPs for the different types of cell in BM and PB samples from 6 patients with acute myeloid leukemia-M2. (A) RRPs of chromosome 8 for the different types of cell in BM samples. (B) RRPs of chromosome 21 for the different types of cell in BM samples. (C) RRPs of chromosome 8 for the different types of cell in PB samples. (D) RRPs of chromosome 21 for the different types of cell in PB samples. Data represents the mean ± standard error of the mean. *Significant difference between BM and PB samples. #P<0.05, heterogeneity of variance in the comparisons. RRP, relative radial position; d, the distance from the center of mass of chromosome 8 or 21 to the center of mass of the nucleus; R, the radius of the nucleus; BM, bone marrow; PB, peripheral blood.
Figure 2. Occurrence (% of all cells) of the different types of cell in BM and PB samples from 6 patients with acute myeloid leukemia-M2. (A) Occurrence of NCs, PCs and MCs in BM samples. (B) Occurrence of NCs, PCs and MCs in PB samples. NC, normal cell; PC, proximal cell; MC, malignant cell; BM, bone marrow; PB, peripheral blood.
ONCOLOGY LETTERS 16: 4656-4662, 20184660
RRPs in PC nuclei were more interior in the nuclei compared with those in NC nuclei (P=0.234, 0.289 and 0.607), and 50% were not (P=0.104, 0.608 and 0.014). Comparisons were made using the two‑sample, two‑sided K‑S test.
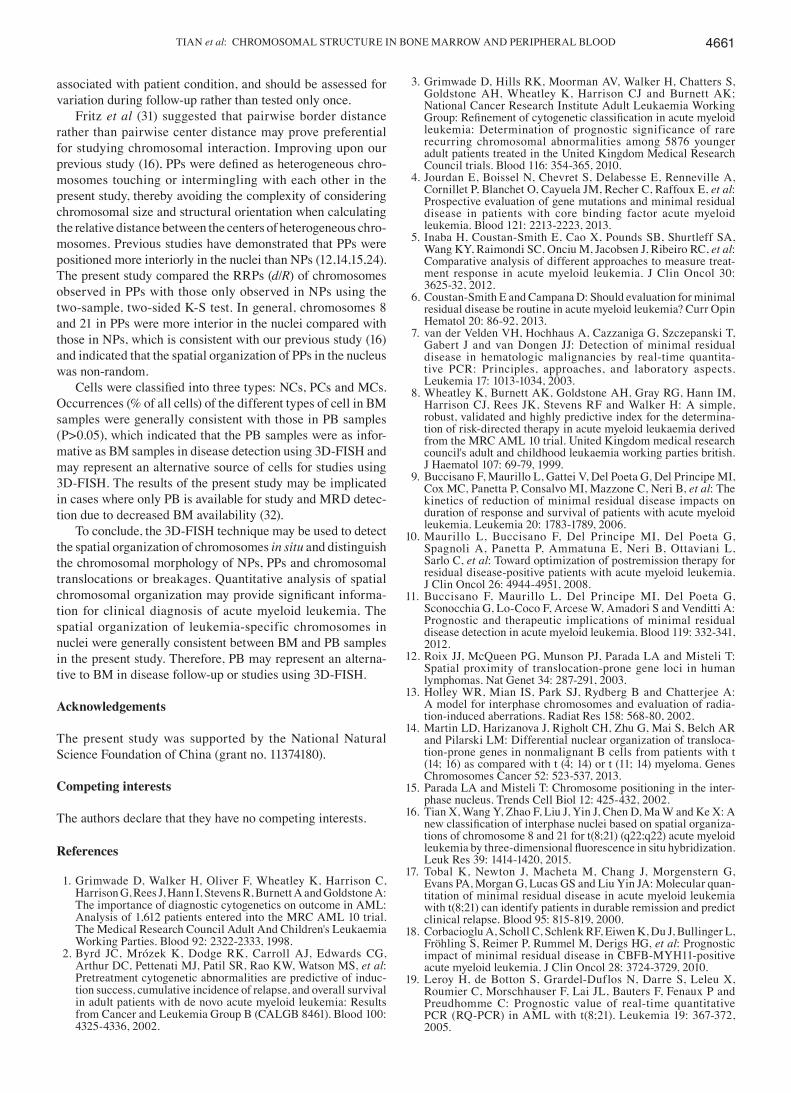
Comparing chromosomal RRPs between NPs and PPs. Heterogeneous chromosomes were classified into NPs and PPs according to their relative physical positions and whether they were touching or intermingling with each other or not. RRPs of chromosomes 8 and 21 in NPs and PPs for all BM and PB samples (12 in total) were provided (Fig. 4). Chromosomal RRPs were compared between NPs and PPs using the two‑sample, two‑sided K‑S test. For 11/12 samples (6/6 for BM and 5/6 for PB), chromosome 8 was more interior (P=0.004-0.664; median, 0.232) in nuclei in PPs compared with that in NPs. For 8/12 samples (5/6 for BM and 3/6 for PB), chromosome 21 was more interior (P=0.029-0.923; median, 0.308) in nuclei in PPs compared with that in NPs.
Discussion
The spatial distribution of chromosomes in interphase is non-random, and gene-dense chromosomes are more likely to be located proximate to the center of the nucleus (15,23). Furthermore, chromosomes spatially proximate to each other are more prone to translocation compared with those
that are spatially distant (12-15,24). Therefore, studying the 3D distribution of chromosomes, even if the patient exhibits a normal karyotype, is essential. The 3D‑FISH technique is useful since it may preserve the chromatin architecture at the level of the 1 Mb chromatin domains (25,26). In addition, a 3D view of interphase chromosomes may assist in detecting complex or alternate translocations or masked runt related transcription factor 1 (AML1)/RUNX1T1 fusions presenting as chromosomal breakages in MCs (27-29).
A previous study revealed that MCs accounted for <20% of all cells from healthy donors or patients in the remittent stage (16). However, in the present study, MCs in BM samples from the patient with AML1/RUNX1T1- AML-M2 repre-sented ~24% of all cells derived from this patient. All these MCs exhibited chromosomal breakage (3r or 3g) rather than chromosomal translocation (3r3g). Therefore, chromosomal breakages may serve a critical function in disease occurrence. However, 20% of MCs in BM samples does not represent a universal cut-off for sorting patients into low- or high-risk relapse groups. For the patient initially diagnosed in the present study with AML1/RUNX1T1+ AML-M2, the propor-tion of MCs in BM samples was only 16%. We previously also monitored an AML-M2 AML1/RUNX1T1+ patient following hematopoietic stem cell transplantation and demonstrated a continuous increase in MC proportion in the patient prior to final relapse (30). Therefore, the proportion of MCs may be
Figure 4. Chromosomal RRPs for different chromosomal pairs in BM and PB samples from 6 patients with acute myeloid leukemia-M2. (A) RRPs of chromo-some 8 for the BM samples. (B) RRPs of chromosome 21 for the BM samples. (C) RRPs of chromosome 8 for the PB samples. (D) RRPs of chromosome 21 for the PB samples. Data represents the mean ± standard error of the mean. *P<0.05, significant difference between NPs and PPs. RRP, relative radial position; d, the distance from the center of mass of chromosome 8 or 21 to the center of mass of the nucleus; R, the radius of the nucleus; BM, bone marrow; PB, peripheral blood; NP, normal pair; PP, proximal pair.
TIAN et al: CHROMOSOMAL STRUCTURE IN BONE MARROW AND PERIPHERAL BLOOD 4661
associated with patient condition, and should be assessed for variation during follow-up rather than tested only once.
Fritz et al (31) suggested that pairwise border distance rather than pairwise center distance may prove preferential for studying chromosomal interaction. Improving upon our previous study (16), PPs were defined as heterogeneous chro-mosomes touching or intermingling with each other in the present study, thereby avoiding the complexity of considering chromosomal size and structural orientation when calculating the relative distance between the centers of heterogeneous chro-mosomes. Previous studies have demonstrated that PPs were positioned more interiorly in the nuclei than NPs (12,14,15,24). The present study compared the RRPs (d/R) of chromosomes observed in PPs with those only observed in NPs using the two‑sample, two‑sided K‑S test. In general, chromosomes 8 and 21 in PPs were more interior in the nuclei compared with those in NPs, which is consistent with our previous study (16) and indicated that the spatial organization of PPs in the nucleus was non-random.
Cells were classified into three types: NCs, PCs and MCs. Occurrences (% of all cells) of the different types of cell in BM samples were generally consistent with those in PB samples (P>0.05), which indicated that the PB samples were as infor-mative as BM samples in disease detection using 3D‑FISH and may represent an alternative source of cells for studies using 3D‑FISH. The results of the present study may be implicated in cases where only PB is available for study and MRD detec-tion due to decreased BM availability (32).
To conclude, the 3D‑FISH technique may be used to detect the spatial organization of chromosomes in situ and distinguish the chromosomal morphology of NPs, PPs and chromosomal translocations or breakages. Quantitative analysis of spatial chromosomal organization may provide significant informa-tion for clinical diagnosis of acute myeloid leukemia. The spatial organization of leukemia-specific chromosomes in nuclei were generally consistent between BM and PB samples in the present study. Therefore, PB may represent an alterna-tive to BM in disease follow‑up or studies using 3D‑FISH.
Acknowledgements
The present study was supported by the National Natural Science Foundation of China (grant no. 11374180).
Competing interests
The authors declare that they have no competing interests.
References
1. Grimwade D, Walker H, Oliver F, Wheatley K, Harrison C, Harrison G, Rees J, Hann I, Stevens R, Burnett A and Goldstone A: The importance of diagnostic cytogenetics on outcome in AML: Analysis of 1,612 patients entered into the MRC AML 10 trial. The Medical Research Council Adult And Children's Leukaemia Working Parties. Blood 92: 2322-2333, 1998.
2. Byrd JC, Mrózek K, Dodge RK, Carroll AJ, Edwards CG, Arthur DC, Pettenati MJ, Patil SR, Rao KW, Watson MS, et al: Pretreatment cytogenetic abnormalities are predictive of induc-tion success, cumulative incidence of relapse, and overall survival in adult patients with de novo acute myeloid leukemia: Results from Cancer and Leukemia Group B (CALGB 8461). Blood 100: 4325-4336, 2002.
3. Grimwade D, Hills RK, Moorman AV, Walker H, Chatters S, Goldstone AH, Wheatley K, Harrison CJ and Burnett AK; National Cancer Research Institute Adult Leukaemia Working Group: Refinement of cytogenetic classification in acute myeloid leukemia: Determination of prognostic significance of rare recurring chromosomal abnormalities among 5876 younger adult patients treated in the United Kingdom Medical Research Council trials. Blood 116: 354-365, 2010.
4. Jourdan E, Boissel N, Chevret S, Delabesse E, Renneville A, Cornillet P, Blanchet O, Cayuela JM, Recher C, Raffoux E, et al: Prospective evaluation of gene mutations and minimal residual disease in patients with core binding factor acute myeloid leukemia. Blood 121: 2213-2223, 2013.
5. Inaba H, Coustan‑Smith E, Cao X, Pounds SB, Shurtleff SA, Wang KY, Raimondi SC, Onciu M, Jacobsen J, Ribeiro RC, et al: Comparative analysis of different approaches to measure treat-ment response in acute myeloid leukemia. J Clin Oncol 30: 3625-32, 2012.
6. Coustan-Smith E and Campana D: Should evaluation for minimal residual disease be routine in acute myeloid leukemia? Curr Opin Hematol 20: 86-92, 2013.
7. van der Velden VH, Hochhaus A, Cazzaniga G, Szczepanski T, Gabert J and van Dongen JJ: Detection of minimal residual disease in hematologic malignancies by real-time quantita-tive PCR: Principles, approaches, and laboratory aspects. Leukemia 17: 1013-1034, 2003.
8. Wheatley K, Burnett AK, Goldstone AH, Gray RG, Hann IM, Harrison CJ, Rees JK, Stevens RF and Walker H: A simple, robust, validated and highly predictive index for the determina-tion of risk-directed therapy in acute myeloid leukaemia derived from the MRC AML 10 trial. United Kingdom medical research council's adult and childhood leukaemia working parties british. J Haematol 107: 69-79, 1999.
9. Buccisano F, Maurillo L, Gattei V, Del Poeta G, Del Principe MI, Cox MC, Panetta P, Consalvo MI, Mazzone C, Neri B, et al: The kinetics of reduction of minimal residual disease impacts on duration of response and survival of patients with acute myeloid leukemia. Leukemia 20: 1783-1789, 2006.
10. Maurillo L, Buccisano F, Del Principe MI, Del Poeta G, Spagnoli A, Panetta P, Ammatuna E, Neri B, Ottaviani L, Sarlo C, et al: Toward optimization of postremission therapy for residual disease-positive patients with acute myeloid leukemia. J Clin Oncol 26: 4944-4951, 2008.
11. Buccisano F, Maurillo L, Del Principe MI, Del Poeta G, Sconocchia G, Lo-Coco F, Arcese W, Amadori S and Venditti A: Prognostic and therapeutic implications of minimal residual disease detection in acute myeloid leukemia. Blood 119: 332-341, 2012.
12. Roix JJ, McQueen PG, Munson PJ, Parada LA and Misteli T: Spatial proximity of translocation-prone gene loci in human lymphomas. Nat Genet 34: 287-291, 2003.
13. Holley WR, Mian IS, Park SJ, Rydberg B and Chatterjee A: A model for interphase chromosomes and evaluation of radia-tion-induced aberrations. Radiat Res 158: 568-80, 2002.
14. Martin LD, Harizanova J, Righolt CH, Zhu G, Mai S, Belch AR and Pilarski LM: Differential nuclear organization of transloca-tion-prone genes in nonmalignant B cells from patients with t (14; 16) as compared with t (4; 14) or t (11; 14) myeloma. Genes Chromosomes Cancer 52: 523-537, 2013.
15. Parada LA and Misteli T: Chromosome positioning in the inter-phase nucleus. Trends Cell Biol 12: 425-432, 2002.
16. Tian X, Wang Y, Zhao F, Liu J, Yin J, Chen D, Ma W and Ke X: A new classification of interphase nuclei based on spatial organiza-tions of chromosome 8 and 21 for t(8;21) (q22;q22) acute myeloid leukemia by three‑dimensional fluorescence in situ hybridization. Leuk Res 39: 1414-1420, 2015.
17. Tobal K, Newton J, Macheta M, Chang J, Morgenstern G, Evans PA, Morgan G, Lucas GS and Liu Yin JA: Molecular quan-titation of minimal residual disease in acute myeloid leukemia with t(8;21) can identify patients in durable remission and predict clinical relapse. Blood 95: 815-819, 2000.
18. Corbacioglu A, Scholl C, Schlenk RF, Eiwen K, Du J, Bullinger L, Fröhling S, Reimer P, Rummel M, Derigs HG, et al: Prognostic impact of minimal residual disease in CBFB-MYH11-positive acute myeloid leukemia. J Clin Oncol 28: 3724-3729, 2010.
19. Leroy H, de Botton S, Grardel-Duflos N, Darre S, Leleu X, Roumier C, Morschhauser F, Lai JL, Bauters F, Fenaux P and Preudhomme C: Prognostic value of real-time quantitative PCR (RQ‑PCR) in AML with t(8;21). Leukemia 19: 367-372, 2005.
ONCOLOGY LETTERS 16: 4656-4662, 20184662
20. Stentoft J, Hokland P, Ostergaard M, Hasle H and Nyvold CG: Minimal residual core binding factor AMLs by real time quanti-tative PCR ‑ Initial response to chemotherapy predicts event free survival and close monitoring of peripheral blood unravels the kinetics of relapse. Leuk Res 30: 389-395, 2006.
21. Livak KJ and Schmittgen TD: Analysis of relative gene expression data using real-time quantitative PCR and the 2(-Delta Delta C(T)) method. Methods 25: 402-408, 2001.
22. Zhao F, Yang X, Chen D, Ma W, Zheng J and Zhang X: A method for simultaneously delineating multiple targets in 3D‑FISH using limited channels, lasers, and fluorochromes. Eur Biophys J 43: 53-58, 2014.
23. Parada LA, Sotiriou S and Misteli T: Spatial genome organiza-tion. Exp Cell Res 296: 64-70, 2004.
24. Branco MR and Pombo A: Intermingling of chromosome territories in interphase suggests role in translocations and transcription-dependent associations. PLoS Biol 4: e138, 2006.
25. Solovei I, Cavallo A, Schermelleh L, Jaunin F, Scasselati C, Cmarko D, Cremer C, Fakan S and Cremer T: Spatial preserva-tion of nuclear chromatin architecture during three-dimensional fluorescence in situ hybridization (3D‑FISH). Exp Cell Res 276: 10-23, 2002.
26. Manvelyan M, Hunstig F, Mrasek K, Bhatt S, Pellestor F, Weise A and Liehr T: Position of chromosomes 18, 19, 21 and 22 in 3D-preserved interphase nuclei of human and gorilla and white hand gibbon. Mol Cytogenet 1: 9, 2008.
27. Liu S, Li Q, Pang W, Bo L, Qin S, Liu X, Teng Q, Qian L and Wang J: A new complex variant t(4;15;17) in acute promyelocytic leukemia: Fluorescence in situ hybridization confirmation and literature review. Cancer Genet Cytogenet 130: 33-37, 2001.
28. Hiorns LR, Min T, Swansbury GJ, Zelent A, Dyer MJS and Catovsky D: Interstitial insertion of retinoic acid receptor‑alpha gene in acute promyelocytic leukemia with normal chromosomes 15 and 17. Blood 83: 2946-29451, 1994.
29. Brockman SR, Paternoster SF, Ketterling RP and Dewald GW: New highly sensitive fluorescence in situ hybridization method to detect PML/RARA fusion in acute promyelocytic leukemia. Cancer Genet Cytogenet 145: 144-151, 2003.
30. Tian X, Wang Y, Chen D, Ke X and Ma W: Significance of spatial organization of chromosomes in the progression of acute myeloid leukemia. Chin J Cancer 36: 40, 2017.
31. Fritz AJ, Stojkovic B, Ding H, Xu J, Bhattacharya S, Gaile D and Berezney R: Wide-scale alterations in inter-chromosomal organization in breast cancer cells: Defining a network of interacting chromosomes. Hum Mol Genet 23: 5133-5146, 2014.
32. Satake N, Maseki N, Kozu T, Sakashita A, Kobayashi H, Sakurai M, Ohki M and Kaneko Y: Disappearance of AML1-MTG8(ETO) fusion transcript in acute myloid-leukemia patients with t(8-21) in long-term remission. Br J Haematol 91: 892-898, 1995.