Embed Size (px)
Citation preview

Comparison of some Transcom Continuous Experiment results for Hegyhatsal and Cabauw tall towers
A.T. Vermeulen*, G. Pieterse, L. Haszpra, and the Transcom Continuous experiment participants
CarboEurope-IP: Open Science Conference on the GHG Cycle in the Northern
Hemisphere, Crete, Nov 2006 Transcom continuous: comp. with obs at CBW and HUN
2
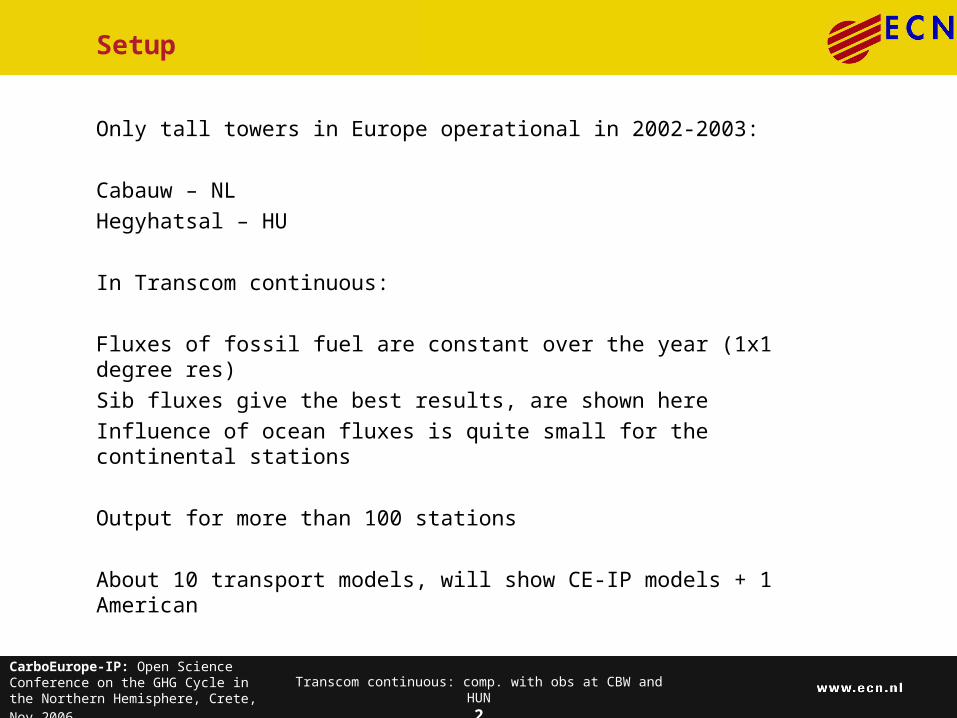
Setup
Only tall towers in Europe operational in 2002-2003:
Cabauw – NL
Hegyhatsal – HU
In Transcom continuous:
Fluxes of fossil fuel are constant over the year (1x1 degree res)
Sib fluxes give the best results, are shown here
Influence of ocean fluxes is quite small for the continental stations
Output for more than 100 stations
About 10 transport models, will show CE-IP models + 1 American

CarboEurope-IP: Open Science Conference on the GHG Cycle in the Northern
Hemisphere, Crete, Nov 2006 Transcom continuous: comp. with obs at CBW and HUN
3
TM5
REMO
TM3vfg
CarboEurope-IP: Open Science Conference on the GHG Cycle in the Northern
Hemisphere, Crete, Nov 2006 Transcom continuous: comp. with obs at CBW and HUN
4
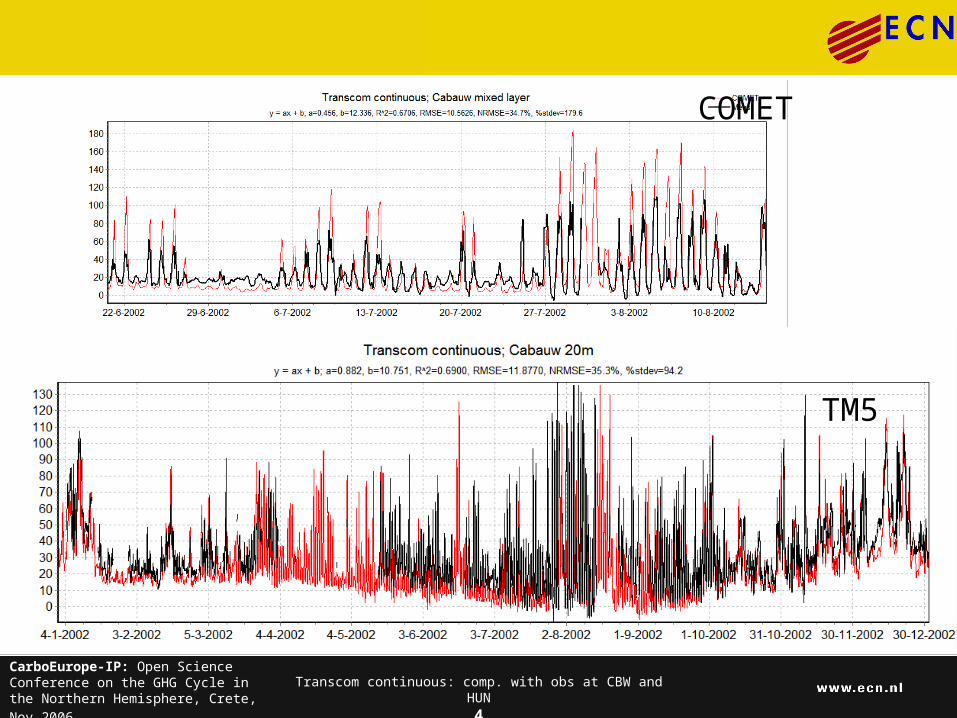
TM5
COMET

CarboEurope-IP: Open Science Conference on the GHG Cycle in the Northern
Hemisphere, Crete, Nov 2006 Transcom continuous: comp. with obs at CBW and HUN
5
CarboEurope-IP: Open Science Conference on the GHG Cycle in the Northern
Hemisphere, Crete, Nov 2006 Transcom continuous: comp. with obs at CBW and HUN
6
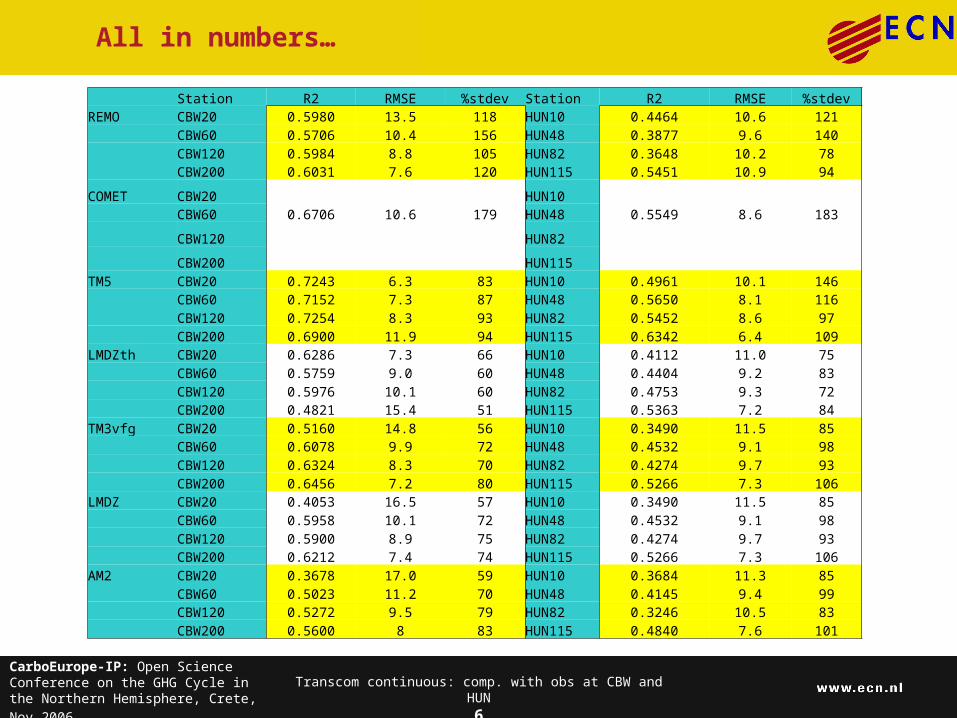
All in numbers…
Station R2 RMSE %stdev Station R2 RMSE %stdevREMO CBW20 0.5980 13.5 118 HUN10 0.4464 10.6 121 CBW60 0.5706 10.4 156 HUN48 0.3877 9.6 140 CBW120 0.5984 8.8 105 HUN82 0.3648 10.2 78 CBW200 0.6031 7.6 120 HUN115 0.5451 10.9 94
COMET CBW20 HUN10 CBW60 0.6706 10.6 179 HUN48 0.5549 8.6 183
CBW120 HUN82
CBW200 HUN115 TM5 CBW20 0.7243 6.3 83 HUN10 0.4961 10.1 146 CBW60 0.7152 7.3 87 HUN48 0.5650 8.1 116 CBW120 0.7254 8.3 93 HUN82 0.5452 8.6 97 CBW200 0.6900 11.9 94 HUN115 0.6342 6.4 109LMDZth CBW20 0.6286 7.3 66 HUN10 0.4112 11.0 75 CBW60 0.5759 9.0 60 HUN48 0.4404 9.2 83 CBW120 0.5976 10.1 60 HUN82 0.4753 9.3 72 CBW200 0.4821 15.4 51 HUN115 0.5363 7.2 84TM3vfg CBW20 0.5160 14.8 56 HUN10 0.3490 11.5 85 CBW60 0.6078 9.9 72 HUN48 0.4532 9.1 98 CBW120 0.6324 8.3 70 HUN82 0.4274 9.7 93 CBW200 0.6456 7.2 80 HUN115 0.5266 7.3 106LMDZ CBW20 0.4053 16.5 57 HUN10 0.3490 11.5 85 CBW60 0.5958 10.1 72 HUN48 0.4532 9.1 98 CBW120 0.5900 8.9 75 HUN82 0.4274 9.7 93 CBW200 0.6212 7.4 74 HUN115 0.5266 7.3 106AM2 CBW20 0.3678 17.0 59 HUN10 0.3684 11.3 85 CBW60 0.5023 11.2 70 HUN48 0.4145 9.4 99 CBW120 0.5272 9.5 79 HUN82 0.3246 10.5 83 CBW200 0.5600 8 83 HUN115 0.4840 7.6 101
CarboEurope-IP: Open Science Conference on the GHG Cycle in the Northern
Hemisphere, Crete, Nov 2006 Transcom continuous: comp. with obs at CBW and HUN
7
Conclusions
Exercise demonstrates big progress in modelling: higher resolution models represent the tall tower sites quite well: models agree more than less!
CBW is predicted to be dominated by fossil fuel fluxes, still influence of biosphere is detectable
CBW is represented better in the models than HUN
Still significant differences between models despite equal input fluxes
More detailed study will be needed to look at: influence of vertical resolution+diffusion scheme other surface station data
Tall tower data + models form great combination for update on flux schemes
Potential for increased perfomance when fluxes are optimised (COMET CH4: R2=0.9; CO2: R2=0.6)