Embed Size (px)
Citation preview
Journal of Ocean and Wind Energy (ISSN 2310-3604) http://www.isope.org/publications/publications.htmCopyright © by The International Society of Offshore and Polar EngineersVol. 2, No. 3, August 2015, pp. 129–137; http://dx.doi.org/10.17736/jowe.2015.jcr34
Comparison of Simulations and Offshore Measurement Data of a Combined FloatingWind and Wave Energy Demonstration Platform
Anders Yde, Torben J. Larsen and Anders M. HansenDTU Wind Energy, Risø Campus
Roskilde, Denmark
Miguel Fernandez and Sarah BellewFloating Power PlantHellerup, Denmark
In this paper, results from comparisons of simulations and measured offshore data from a floating combined wind and waveenergy conversion system are presented. The numerical model of the platform is based on the aeroelastic code, HAWC2,developed by DTU Wind Energy, which is coupled with a special external system that reads the output generated directly bythe wave analysis software WAMIT. The main focus of the comparison is on the statistical trends of the platform motion,mooring loads, and turbine loads in measurements and simulations during different operational conditions. Finally, challengesand possible approaches for further model development and validation are discussed.
INTRODUCTION
There is increased attention on exploring renewable energyon offshore sites; however, useful sites with sufficient resourcesin shallow waters are limited. This has directed the focus fromtraditional bottom-fixed foundations, which are currently onlyeconomically feasible up to approximately 50 m water depth,toward floating concepts. In order to exploit the potential ofthe deepwater sites, floating foundations have to become costeffective. This motivates the idea of reducing installation costs bycombining different types of renewable energy technologies thatcan share expensive system components, such as mooring lines,transformer stations, and grid integration equipment. Recently,both the industry and the scientific community have started toinvestigate the potential of developing renewable multipurposefloating platforms in different international research projects, suchas the MARINA Platform project (www.marina-platform.info) andthe H2Ocean project (www.h2ocean-project.eu), both funded by theEuropean Union Seventh Framework Programme. The MARINAPlatform Project focuses on a preliminary investigation of combiningvarious concepts of wind turbines and wave energy convertersand makes assessments mainly by cost of energy, constructability,installability, operation and maintenance, and survivability. TheH2Ocean project aims at developing proof-of-concept designs offully integrated multipurpose platforms to maximize the utilityof sea resources, including activities such as renewable powerharvesting, aquaculture, and environmental monitoring.
One of the most important steps in the development of a floatingcombined wind and wave energy conversion system is to be ableto predict the system response in terms of motions and loads inorder to create a cost-effective and reliable design. This requiresdevelopment of accurate simulation models that include all theimportant effects (aerodynamic, wind turbine control, hydrodynamic,mooring components, and structural flexibility). Most aeroelasticcodes used in the wind industry have a primary focus on the wind-
Received March 24, 2015; revised manuscript received by the editors June8, 2015. The original version was submitted directly to the Journal.
KEY WORDS: Loads, wind turbine, control, aeroelasticity, floating, waves,hydrodynamics.
induced forces, whereas the hydrodynamic forces are includedby using simplified methods like the Morison formula, normallyapplicable for slender structures such as wind turbine monopilesubstructures.
The advanced hydrodynamics of the complex geometry of floatingplatforms necessitate the inclusion of more general hydrodynamicmodels that can capture the hydrodynamic interaction of thesekinds of substructures. DTU Wind Energy has extended theiraeroelastic code, HAWC2 (Larsen and Hansen, 2012; Larsen et al.,2013; Kim et al., 2013) with an interface to the frequency-basedradiation/diffraction floating body analysis tool WAMIT (Lee,1995). The external system reads the output generated directly byWAMIT and then generates a system with the same response in thetime domain.
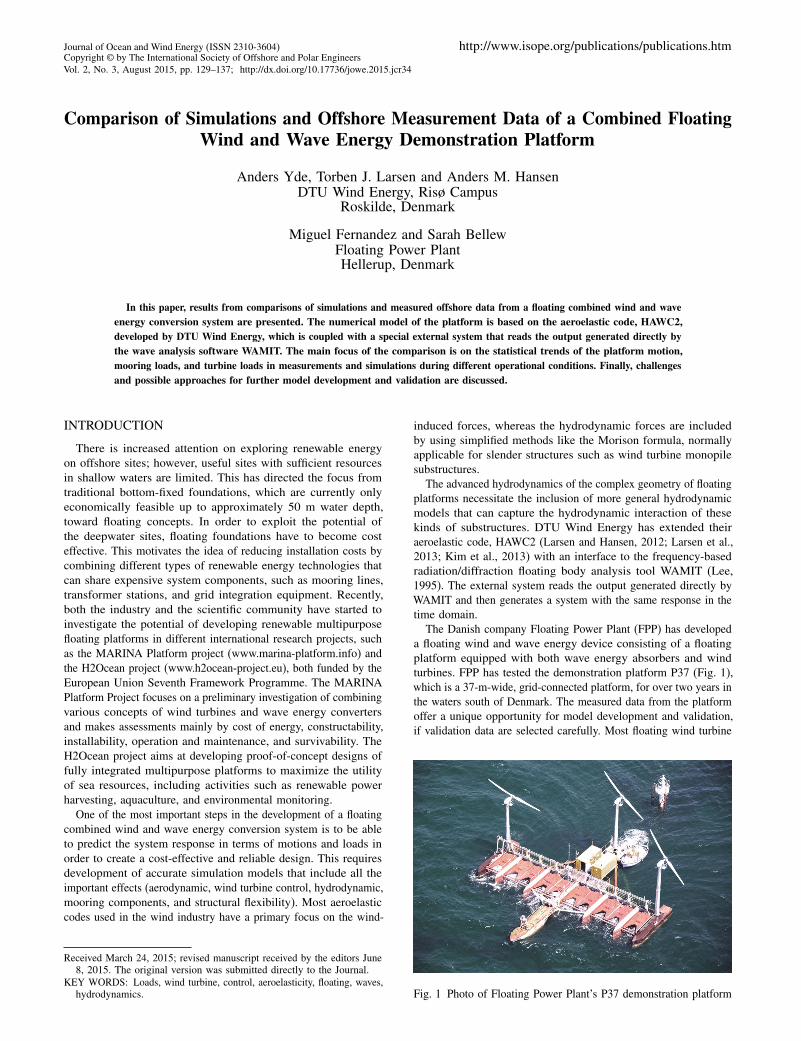
The Danish company Floating Power Plant (FPP) has developeda floating wind and wave energy device consisting of a floatingplatform equipped with both wave energy absorbers and windturbines. FPP has tested the demonstration platform P37 (Fig. 1),which is a 37-m-wide, grid-connected platform, for over two years inthe waters south of Denmark. The measured data from the platformoffer a unique opportunity for model development and validation,if validation data are selected carefully. Most floating wind turbine
Fig. 1 Photo of Floating Power Plant’s P37 demonstration platform
130 Comparison of Simulations and Offshore Measurement Data of a Combined Floating Wind and Wave Energy Demonstration Platform
concepts have been tested in small-scale basin tests; however, thereare very little empirical data available from large-scale tests tovalidate numerical models. FPP has tested its combined wind andwave energy device extensively in wave flumes and wave basins;last but not least, it has tested the P37 in four complete offshore testphases in which platform motions and accelerations were measuredtogether with strain gauges in the turbine tower, nacelle, and bladesof the three turbines. Previous work on these measurements can befound in Kallesøe et al. (2011a), Kallesøe et al. (2011b), Larsenet al. (2011), and Yde et al. (2014). The motion of wave absorbersand data from load cells in the mooring line system were alsorecorded. The offshore test is the focus of this article. In thecomparison between measurements and simulations, the focus is onstatistical trends of the platform motions, mooring loads, and turbineloads during different operational conditions, such as increasingwind speed, wave height, and wind/wave misalignment, from thethird and fourth offshore test phases of P37. The paper begins witha description of the numerical model and a description of the extentto which each of the subcomponents has been validated beforethis offshore comparison. A detailed description of the P37 deviceand its corresponding offshore measured data are then presented.The most suitable time periods in the data for application of thenumerical model in its current stage of development are selected,and the results of a statistical comparison are shown. Following thepositive early-stage comparison, a discussion follows on the nextsteps in model development, which will allow for comparison tofurther time periods in which more complex features of the deviceare included.
NUMERICAL MODEL DESCRIPTION
Several different tools that can simulate floating wind turbineshave been developed and compared (Robertson et al., 2014), but thegeometric complex substructure of P37 requires a more advancedapproach than simplified hydrodynamics calculation methods, likeMorison’s formula, which is mostly applicable to slender circularstructures. The challenge of modeling active absorbers is currentlybeyond the capabilities of existing numerical tools; therefore, thefocus will be primarily on representing the hydrodynamic forceson the platform with inactive wave absorbers raised into a stormposition. This means that they are fixed and effectively raised outof the water.
Previously, HAWC2 has been coupled to DHI’s radiation/diffraction floating body analysis tool, WAMSIM (Hansen et al.,2009), which is based on WAMIT, as described in Larsen et al.(2011). The WAMSIM coupling was restricted by the fact that theWAMSIM code is based on a fixed, outdated version of WAMIT.Furthermore, the program was unable to be installed on a computercluster, which made it impractical to execute a number of simula-tions. Recently, HAWC2 has been extended with a new externalsystem module that reads the output files generated directly byWAMIT in frequency domain and generates a system with thesame response in HAWC2 in time domain, which is used in thisstudy (Hansen, 2014).
HAWC2
HAWC2 (horizontal axis wind turbine simulation code, secondgeneration; hereafter referred to as PROG H) is an aeroelasticcode developed by DTU Wind Energy. The aerodynamic partof the code is based on the blade element momentum (BEM)theory but is extended from the classic steady-state description toinclude dynamic inflow, dynamic stall, skew inflow, and effectsof operation in sheared inflow. Variations in the induction over
the rotor, caused by operation in sheared inflow, are described inMadsen et al. (2012). The dynamic stall model (Hansen, 2004) isimplemented as a modified Beddoes–Leishman model (Leishmanand Beddoes, 1986) that includes the effects from shed vorticityfrom the trailing edge (Theodorsen, 1935), as well as the effectsof stall separation lag caused by an instationary trailing edgeseparation point. The inflow turbulence is generated by usingthe Mann model (Mann, 1998), which is a nonisotropic full 3Dcorrelated turbulent flow field corresponding to the Navier–Stokessolution of a turbulent flow. Tower shadow effects are included byusing a potential flow method. Wake effects are handled by thedynamic wake meander model, where the wakes of the upstreamturbines are modeled as areas of reduced wind speed with anincrease in high-frequency turbulence (Larsen et al., 2008; Madsenet al., 2010; Larsen et al., 2013). The structural part of the codeis based on a multibody formulation with the floating frame ofreference method, as described in Larsen and Hansen (2012) andKim et al. (2013). This means that the turbine structure is dividedinto a number of bodies and each body has its own coordinatesystem. Within each body, the structure consists of an assembly oflinear Timoshenko beam elements. The nonlinear effects of thebody motion (rotations and deformations) are accounted for inthe coupling constraints between the individual bodies, ensuringsmall deflections within the linear beam elements. This means thateffects of large rotations and deflections are included by using aproper subdivision of a blade into a number of bodies.
PROG H results have previously been validated against otheraeroelastic codes in the Offshore Code Comparison Collaboration(OC3) and Offshore Code Comparison Continuation (OC4) underthe IEA Wind Task described in Vorpahl et al. (2013), Popkoet al. (2012), and Robertson et al. (2014). OC4 consisted of twophases with analysis of a wind turbine on an offshore bottom-fixedjacket and analysis of a wind turbine on an offshore floating semi-submersible. The PROG H model representing the semi-submersiblewas implemented with beam elements subjected to hydrodynamicforces based on the Morison formula and also included a dynamicmooring line model for the mooring line system. The full-systemnatural frequencies, the dynamic loads, and the system responsesobtained by PROG H agreed well with other aeroelastic codes inthis comparison.
HAWC2–WAMIT Interface
PROG H is extended with a new external system that interfaceswith the hydrodynamic tool WAMIT (hereafter referred to asPROG W) (Hansen, 2014). The hydrodynamic forces in the externalsystem (in the time domain) are calculated based on PROG Wresult files (in the frequency domain). This enables aero-hydro-elastic simulations of general types of large floating structuresincluding combined wave/wind concepts.
The interface is implemented in a generalized external systemdynamic link library (DLL) (Larsen et al., 2014) coupled toPROG H where it is possible to set up user-specified, second-order,time-dependent differential equations. The equations are solvedby PROG H along with PROG H’s own equations for the rest ofthe structure. For the PROG W external system, the equationsimplemented are the equations of motion (EOMs) of the foundationaffected by the hydrodynamic forces calculated by PROG W. Inthe current implementation, the EOMs are limited to rigid bodymotions that correspond to six degrees of freedom (6-DOF; threedisplacements and three rotations) for a floating structure. The massof the floating structure is also included in the external system,which allows for user-defined positioning of the center of gravityand rotational inertia. In the implementation of the 6-DOF rigidbody EOMs for the floating structure, the following external forces
Journal of Ocean and Wind Energy, Vol. 2, No. 3, August 2015, pp. 129–137 131
are applied to the structure:• Gravity, in COG• Buoyancy, in center of buoyancy (COB), provided by PROG W• Linear and nonlinear damping forces, user specified• Linear stiffness, user specified• Hydrostatic forces, provided by PROG W• Radiation forces, provided by PROG W• Diffraction forces (wave forces), provided by PROG WThe hydrostatic forces are added to the linear stiffness matrix for
the system. The radiation and diffraction forces are implemented asconvolution integrals based on the frequency response functions(FRFs) provided by PROG W.
In order to connect the external system to other PROG H systems,such as a wind turbine and mooring line system, constraint equationsare also implemented for the PROG W external system. Thisenables integrated simulations where the radiation and diffractionforces are added to the EOMs of the foundation and PROG Hsolves the full set of coupled EOMs for the entire system. Thewave input is taken directly from the built-in wave kinematicsmodule in PROG H. This also allows for other wave-dependentmodules (e.g., mooring lines) to use the same input.
The PROG W external system has been verified by comparing theresponse of different PROG H implementations of a three-leggedsemi-submersible foundation with the IEA 5MW reference windturbine mounted on and moored with a catenary mooring system(see Vorpahl et al., 2013; Popko et al., 2012). The model alsoincluded a dynamic mooring line model for the mooring line system.The comparison was done by using the PROG W external system,WAMSIM (DHI’s implementation of PROG W in the time domain)and by using a stand-alone PROG H model consisting of beamsexposed to hydrodynamic forces from the Morison formula. Moredetails of this comparison can be found in Larsen et al. (2014).
P37 Demonstration Platform
Floating Power Plant (FPP) constructed a hybrid wind and waveenergy prototype model for offshore testing at the Vindeby offshorewind turbine park, 3 km off the coast of Lolland in Denmark. Thewater depth at the site is approximately 7 m. The demonstrationplatform, named Poseidon 37 (P37), is a semi-submersible with awater-plane area similar to its cross geometry. It is 37 m wide, 25 mlong, 6 m high and has an unballasted weight of approximately320 tons. Along the width of the platform there are six separatedwater channels wherein ten 14 kW pitching wave energy converters(WECs) are operated. A horizontal plate is located at the bottom ofthe water channels that traps the incoming waves and increasesthe efficiency of the WECs as the waves are compressed betweenthe WECs at the surface and the plate at the bottom. The WECscan be ballasted with water to tune their natural period to theincident waves, thereby increasing efficiency. Three Gaia 11 kWwind turbines are mounted on the platform, one on either side andone on the aft of the hull. The front of the cross-point is attachedto a mooring buoy where the platform is able to rotate (vane)360 degrees around the turret mooring system. This enables theplatform to rotate to face the incoming wind and wave direction.The wind turbines are two-bladed in a downwind configuration withfree passive yaw and teeter hub and are stall-operated. Multipleballast tanks are located inside the hull of the platform, in whichwater levels can be regulated to increase stability by trimming theplatform.
The design of P37 poses some challenges in cases of wind–wave misalignment where the turbine thrust at high wind speedscan push the platform away from the incoming wave direction,thereby reducing the efficiency of the wave absorbers. This issue is
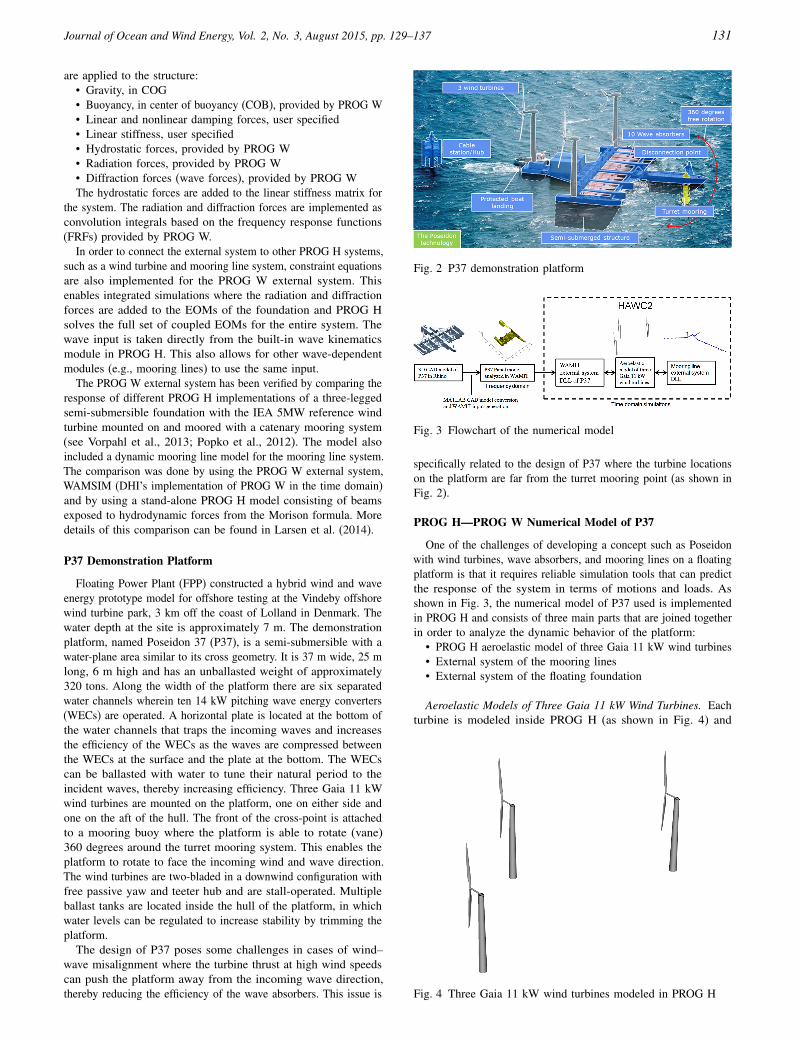
Fig. 2 P37 demonstration platform
Fig. 3 Flowchart of the numerical model
specifically related to the design of P37 where the turbine locationson the platform are far from the turret mooring point (as shown inFig. 2).
PROG H—PROG W Numerical Model of P37
One of the challenges of developing a concept such as Poseidonwith wind turbines, wave absorbers, and mooring lines on a floatingplatform is that it requires reliable simulation tools that can predictthe response of the system in terms of motions and loads. Asshown in Fig. 3, the numerical model of P37 used is implementedin PROG H and consists of three main parts that are joined togetherin order to analyze the dynamic behavior of the platform:
• PROG H aeroelastic model of three Gaia 11 kW wind turbines• External system of the mooring lines• External system of the floating foundation
Aeroelastic Models of Three Gaia 11 kW Wind Turbines. Eachturbine is modeled inside PROG H (as shown in Fig. 4) and
Fig. 4 Three Gaia 11 kW wind turbines modeled in PROG H
132 Comparison of Simulations and Offshore Measurement Data of a Combined Floating Wind and Wave Energy Demonstration Platform
Control Fixed speed, stall regulated
Cut in wind speed 3.5 m/sCut out wind speed 25 m/sRated wind speed 9.5 m/sRated power 11 kWRotor diameter 13 mDrivetrain High speed, 2 stageRotor speed 56 rpmTower height 12 mNacelle and rotor mass 900 kg
Table 1 Turbine properties
consists of flexible beam elements representing the distributedmass and stiffness properties of the turbine components: tower,nacelle frame, and blades (see Table 1). The free yaw bearing inthe connection between tower and nacelle is implemented as aDLL that works as a nonlinear spring system including stick-slipeffects. Another set of nonlinear springs is implemented in theconnection between the blades and the shaft to model the effectof the teeter movement and stop mechanism. The turbines arestall-controlled, and therefore a simplified generator model foran induction generator is implemented as a DLL and connectedto PROG H. The model is based on a linear relation betweenspeed and generator torque. A PROG H aeroelastic model of theGaia wind turbine has previously been tested and validated withmeasurements (Kallesøe et al., 2011b).
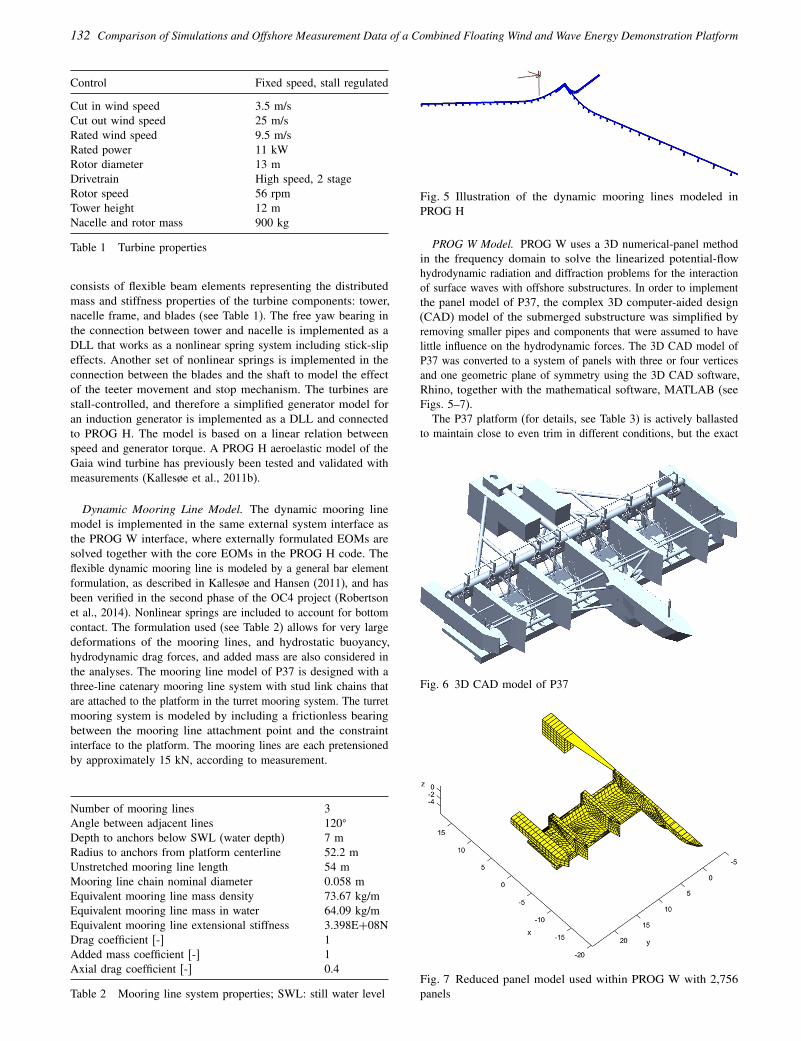
Dynamic Mooring Line Model. The dynamic mooring linemodel is implemented in the same external system interface asthe PROG W interface, where externally formulated EOMs aresolved together with the core EOMs in the PROG H code. Theflexible dynamic mooring line is modeled by a general bar elementformulation, as described in Kallesøe and Hansen (2011), and hasbeen verified in the second phase of the OC4 project (Robertsonet al., 2014). Nonlinear springs are included to account for bottomcontact. The formulation used (see Table 2) allows for very largedeformations of the mooring lines, and hydrostatic buoyancy,hydrodynamic drag forces, and added mass are also considered inthe analyses. The mooring line model of P37 is designed with athree-line catenary mooring line system with stud link chains thatare attached to the platform in the turret mooring system. The turretmooring system is modeled by including a frictionless bearingbetween the mooring line attachment point and the constraintinterface to the platform. The mooring lines are each pretensionedby approximately 15 kN, according to measurement.
Number of mooring lines 3Angle between adjacent lines 120�
Depth to anchors below SWL (water depth) 7 mRadius to anchors from platform centerline 52.2 mUnstretched mooring line length 54 mMooring line chain nominal diameter 0.058 mEquivalent mooring line mass density 73.67 kg/mEquivalent mooring line mass in water 64.09 kg/mEquivalent mooring line extensional stiffness 3.398E+08NDrag coefficient [-] 1Added mass coefficient [-] 1Axial drag coefficient [-] 0.4
Table 2 Mooring line system properties; SWL: still water level
Fig. 5 Illustration of the dynamic mooring lines modeled inPROG H
PROG W Model. PROG W uses a 3D numerical-panel methodin the frequency domain to solve the linearized potential-flowhydrodynamic radiation and diffraction problems for the interactionof surface waves with offshore substructures. In order to implementthe panel model of P37, the complex 3D computer-aided design(CAD) model of the submerged substructure was simplified byremoving smaller pipes and components that were assumed to havelittle influence on the hydrodynamic forces. The 3D CAD model ofP37 was converted to a system of panels with three or four verticesand one geometric plane of symmetry using the 3D CAD software,Rhino, together with the mathematical software, MATLAB (seeFigs. 5–7).
The P37 platform (for details, see Table 3) is actively ballastedto maintain close to even trim in different conditions, but the exact
Fig. 6 3D CAD model of P37
Fig. 7 Reduced panel model used within PROG W with 2,756panels
Journal of Ocean and Wind Energy, Vol. 2, No. 3, August 2015, pp. 129–137 133
Platform mass (including ballast) 5.716E+05 kgPlatform width 37 mPlatform length (including mooring buoy) 39 mPlatform draft 5 mWater depth 7 m
Table 3 Platform properties
ballasting configurations were not always recorded accurately andare not correlated with the processed measurement data. Therefore,the center of gravity and platform inertias have been calculated bynaval architects, based on the design conditions, and have beenkept constant in the simulations. This means that any static offsetin the platform motions due to different ballast situations wasnot included in the model. The PROG W computations were setup with multiple wave directions and a high period range andresolution to meet the requirements of the output to be used for thetime domain analysis in PROG H.
MEASUREMENT CAMPAIGN AND DATA FILTERING
FPP has previously performed hydrodynamic tests on their devicein different small scales and also tested the wave absorbers in waveflumes with a focus on design optimization (Yde et al., 2014).P37 has been designed as a demonstration platform purely forresearch and development of the technologies in the concept. Theplatform has been tested for four complete offshore test phases,which accounts for more than two years of offshore tests. Theplatform has been connected to the grid and achieved an importantbreakthrough where the platform produced electricity to the gridfrom both wind and waves.
The first two test phases focused on overall platform stability andthe impact of mounting wind turbines on the platform. The thirdtest phase had the main objective of testing a new power takeoff(PTO) system with a corresponding redesigned wave absorbersuited to the site wave conditions. The fourth test phase focused ontesting different control strategies for the new PTO system. Fortest periods three and four, additional sensors were installed onthe platform to get a more complete overview of the operationalconditions of the platform. This included additional accelerometerson the platform and inclinometers on all wave absorbers. Thedata used in this study are from the two last test phases with anupgraded measuring system. This period covers approximately fourmonths across the two following periods:
• Test period 3, 15 Nov 2012 to 13 Jan 2013; 7027 10-min files• Test period 4, 25 Sep 2013 to 28 Oct 2013; 4807 10-min files
Measurement System
P37 has been equipped with a large number of sensors to monitorthe wind turbines, wave absorbers, platform motions, PTO system,and the mooring line system. In total, the measurement system hascollected data from 126 sensors on the platform. A full descriptionof the sensors is given in Yde and Pedersen (2014) together withcalibrations in Pedersen and Yde (2014).
The primary measurement sensors used in this study are asfollows:
• Wind speed and wind direction, measured by a sonic anemome-ter placed on a small mast in the middle of the P37 platform
• Wave height and direction, measured by an acoustic Dopplercurrent profiler (ADCP)
• Current speed and direction, measured by the ADCP• Platform position and orientation, measured by GPS• Platform pitch and roll, measured by two inclinometers, in the
starboard turbine foundation
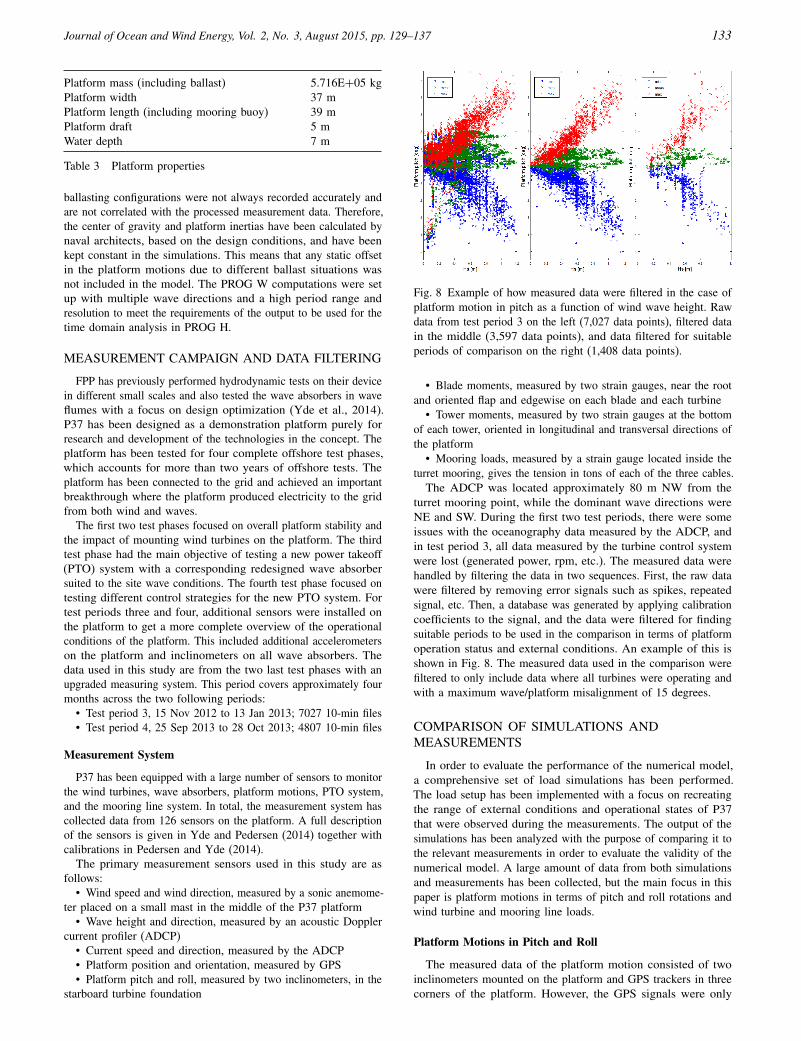
Fig. 8 Example of how measured data were filtered in the case ofplatform motion in pitch as a function of wind wave height. Rawdata from test period 3 on the left (7,027 data points), filtered datain the middle (3,597 data points), and data filtered for suitableperiods of comparison on the right (1,408 data points).
• Blade moments, measured by two strain gauges, near the rootand oriented flap and edgewise on each blade and each turbine
• Tower moments, measured by two strain gauges at the bottomof each tower, oriented in longitudinal and transversal directions ofthe platform
• Mooring loads, measured by a strain gauge located inside theturret mooring, gives the tension in tons of each of the three cables.
The ADCP was located approximately 80 m NW from theturret mooring point, while the dominant wave directions wereNE and SW. During the first two test periods, there were someissues with the oceanography data measured by the ADCP, andin test period 3, all data measured by the turbine control systemwere lost (generated power, rpm, etc.). The measured data werehandled by filtering the data in two sequences. First, the raw datawere filtered by removing error signals such as spikes, repeatedsignal, etc. Then, a database was generated by applying calibrationcoefficients to the signal, and the data were filtered for findingsuitable periods to be used in the comparison in terms of platformoperation status and external conditions. An example of this isshown in Fig. 8. The measured data used in the comparison werefiltered to only include data where all turbines were operating andwith a maximum wave/platform misalignment of 15 degrees.
COMPARISON OF SIMULATIONS ANDMEASUREMENTS
In order to evaluate the performance of the numerical model,a comprehensive set of load simulations has been performed.The load setup has been implemented with a focus on recreatingthe range of external conditions and operational states of P37that were observed during the measurements. The output of thesimulations has been analyzed with the purpose of comparing it tothe relevant measurements in order to evaluate the validity of thenumerical model. A large amount of data from both simulationsand measurements has been collected, but the main focus in thispaper is platform motions in terms of pitch and roll rotations andwind turbine and mooring line loads.
Platform Motions in Pitch and Roll
The measured data of the platform motion consisted of twoinclinometers mounted on the platform and GPS trackers in threecorners of the platform. However, the GPS signals were only
134 Comparison of Simulations and Offshore Measurement Data of a Combined Floating Wind and Wave Energy Demonstration Platform
Mode Frequency [Hz]
Surge 0.047Heave 0.108Pitch 0.216Roll 0.128
Table 4 Platform eigenfrequencies derived from the numericalmodel
recorded with low resolution, and therefore it was not possible tocompare measured platform translations with simulations. Systemeigenfrequencies were obtained from the numerical model by decaytests, as shown in Table 4.
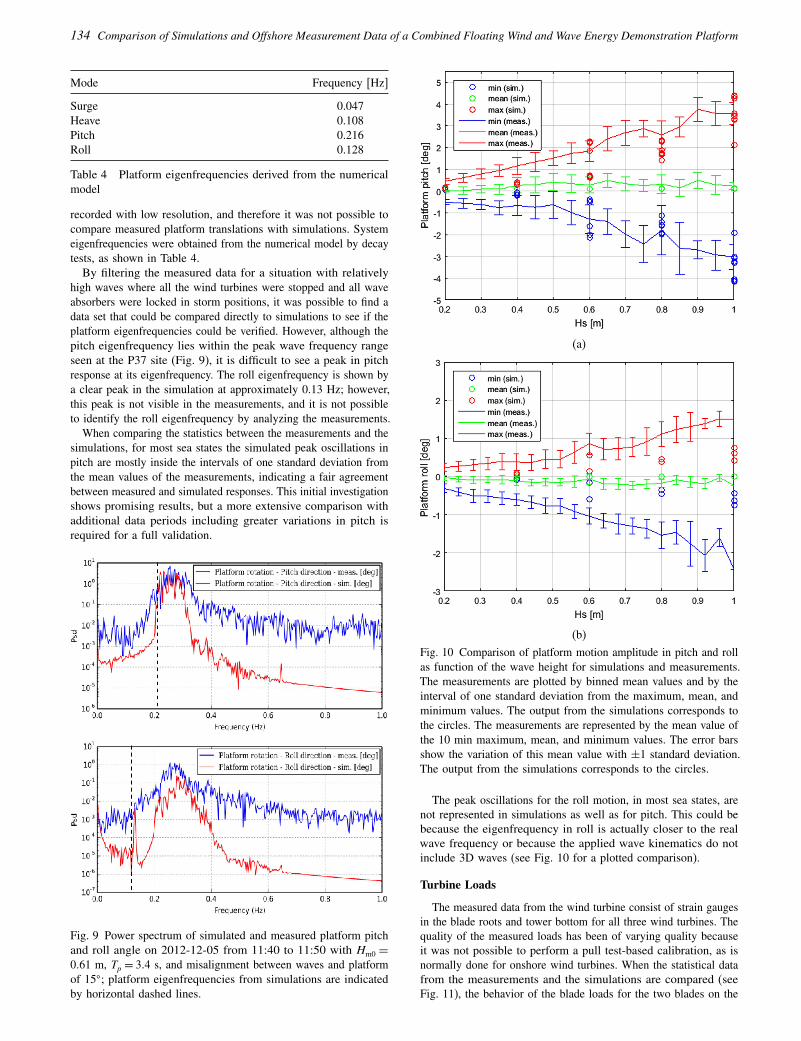
By filtering the measured data for a situation with relativelyhigh waves where all the wind turbines were stopped and all waveabsorbers were locked in storm positions, it was possible to find adata set that could be compared directly to simulations to see if theplatform eigenfrequencies could be verified. However, although thepitch eigenfrequency lies within the peak wave frequency rangeseen at the P37 site (Fig. 9), it is difficult to see a peak in pitchresponse at its eigenfrequency. The roll eigenfrequency is shown bya clear peak in the simulation at approximately 0.13 Hz; however,this peak is not visible in the measurements, and it is not possibleto identify the roll eigenfrequency by analyzing the measurements.
When comparing the statistics between the measurements and thesimulations, for most sea states the simulated peak oscillations inpitch are mostly inside the intervals of one standard deviation fromthe mean values of the measurements, indicating a fair agreementbetween measured and simulated responses. This initial investigationshows promising results, but a more extensive comparison withadditional data periods including greater variations in pitch isrequired for a full validation.
Fig. 9 Power spectrum of simulated and measured platform pitchand roll angle on 2012-12-05 from 11:40 to 11:50 with Hm0 =
0061 m, Tp = 304 s, and misalignment between waves and platformof 15�; platform eigenfrequencies from simulations are indicatedby horizontal dashed lines.
(a)
(b)
Fig. 10 Comparison of platform motion amplitude in pitch and rollas function of the wave height for simulations and measurements.The measurements are plotted by binned mean values and by theinterval of one standard deviation from the maximum, mean, andminimum values. The output from the simulations corresponds tothe circles. The measurements are represented by the mean value ofthe 10 min maximum, mean, and minimum values. The error barsshow the variation of this mean value with ±1 standard deviation.The output from the simulations corresponds to the circles.
The peak oscillations for the roll motion, in most sea states, arenot represented in simulations as well as for pitch. This could bebecause the eigenfrequency in roll is actually closer to the realwave frequency or because the applied wave kinematics do notinclude 3D waves (see Fig. 10 for a plotted comparison).
Turbine Loads
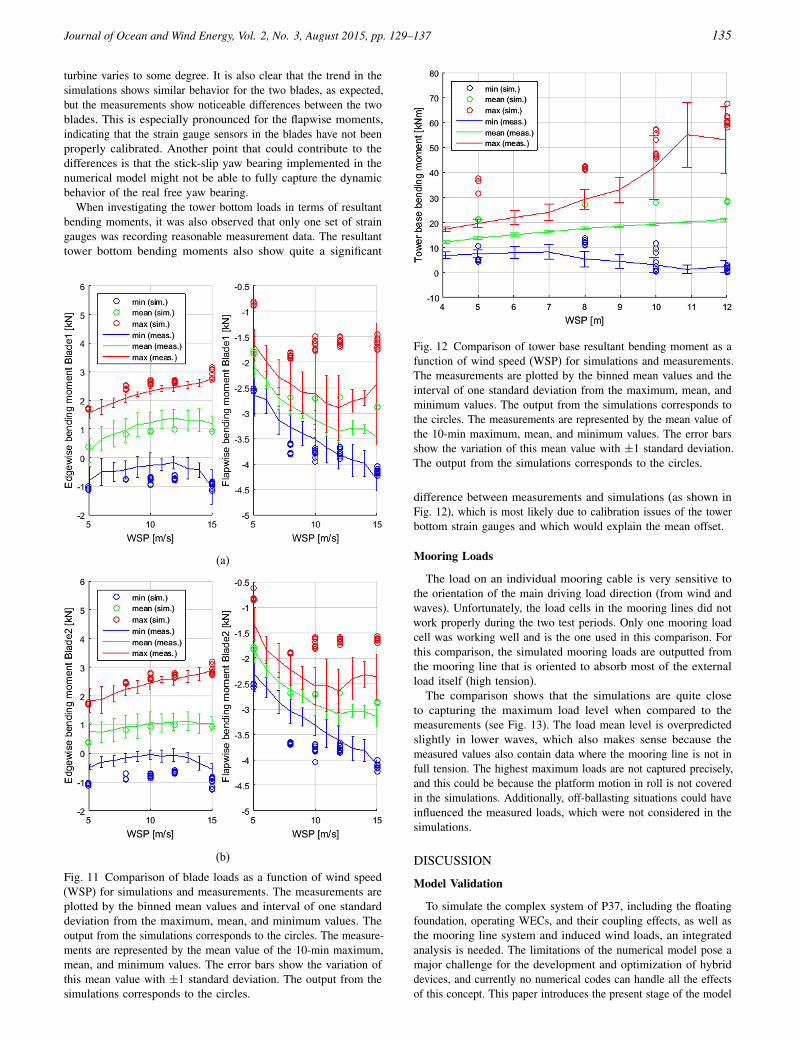
The measured data from the wind turbine consist of strain gaugesin the blade roots and tower bottom for all three wind turbines. Thequality of the measured loads has been of varying quality becauseit was not possible to perform a pull test-based calibration, as isnormally done for onshore wind turbines. When the statistical datafrom the measurements and the simulations are compared (seeFig. 11), the behavior of the blade loads for the two blades on the
Journal of Ocean and Wind Energy, Vol. 2, No. 3, August 2015, pp. 129–137 135
turbine varies to some degree. It is also clear that the trend in thesimulations shows similar behavior for the two blades, as expected,but the measurements show noticeable differences between the twoblades. This is especially pronounced for the flapwise moments,indicating that the strain gauge sensors in the blades have not beenproperly calibrated. Another point that could contribute to thedifferences is that the stick-slip yaw bearing implemented in thenumerical model might not be able to fully capture the dynamicbehavior of the real free yaw bearing.
When investigating the tower bottom loads in terms of resultantbending moments, it was also observed that only one set of straingauges was recording reasonable measurement data. The resultanttower bottom bending moments also show quite a significant
(a)
(b)
Fig. 11 Comparison of blade loads as a function of wind speed(WSP) for simulations and measurements. The measurements areplotted by the binned mean values and interval of one standarddeviation from the maximum, mean, and minimum values. Theoutput from the simulations corresponds to the circles. The measure-ments are represented by the mean value of the 10-min maximum,mean, and minimum values. The error bars show the variation ofthis mean value with ±1 standard deviation. The output from thesimulations corresponds to the circles.
Fig. 12 Comparison of tower base resultant bending moment as afunction of wind speed (WSP) for simulations and measurements.The measurements are plotted by the binned mean values and theinterval of one standard deviation from the maximum, mean, andminimum values. The output from the simulations corresponds tothe circles. The measurements are represented by the mean value ofthe 10-min maximum, mean, and minimum values. The error barsshow the variation of this mean value with ±1 standard deviation.The output from the simulations corresponds to the circles.
difference between measurements and simulations (as shown inFig. 12), which is most likely due to calibration issues of the towerbottom strain gauges and which would explain the mean offset.
Mooring Loads
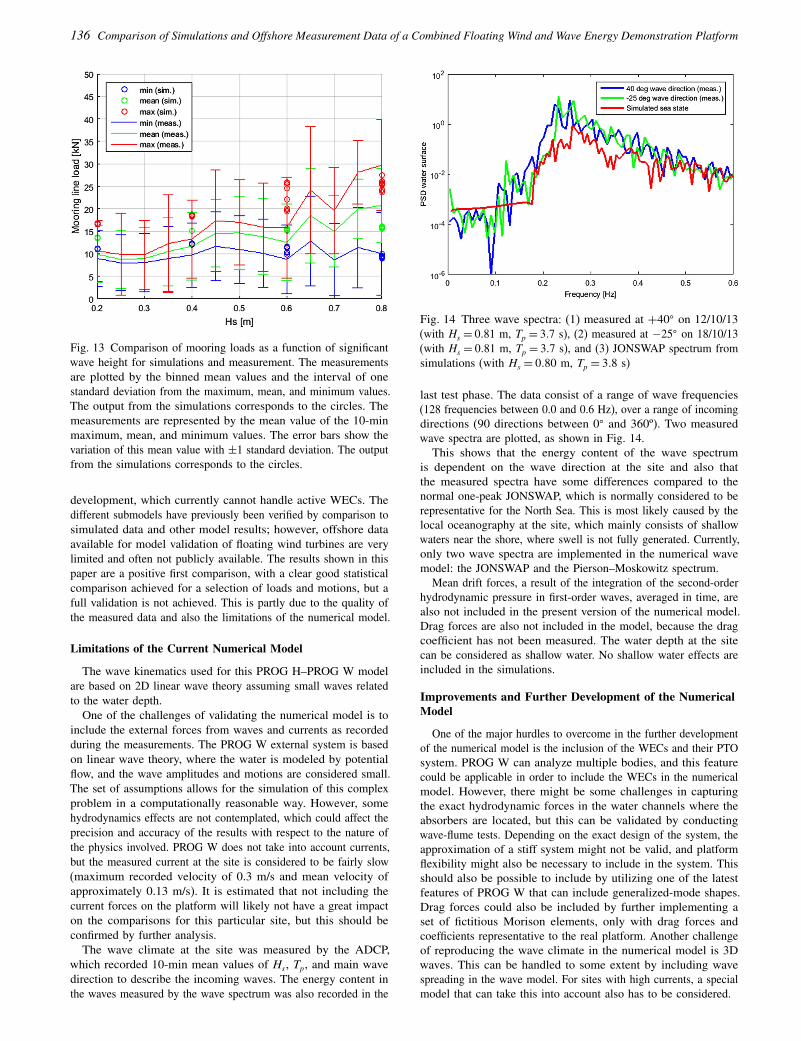
The load on an individual mooring cable is very sensitive tothe orientation of the main driving load direction (from wind andwaves). Unfortunately, the load cells in the mooring lines did notwork properly during the two test periods. Only one mooring loadcell was working well and is the one used in this comparison. Forthis comparison, the simulated mooring loads are outputted fromthe mooring line that is oriented to absorb most of the externalload itself (high tension).
The comparison shows that the simulations are quite closeto capturing the maximum load level when compared to themeasurements (see Fig. 13). The load mean level is overpredictedslightly in lower waves, which also makes sense because themeasured values also contain data where the mooring line is not infull tension. The highest maximum loads are not captured precisely,and this could be because the platform motion in roll is not coveredin the simulations. Additionally, off-ballasting situations could haveinfluenced the measured loads, which were not considered in thesimulations.
DISCUSSION
Model Validation
To simulate the complex system of P37, including the floatingfoundation, operating WECs, and their coupling effects, as well asthe mooring line system and induced wind loads, an integratedanalysis is needed. The limitations of the numerical model pose amajor challenge for the development and optimization of hybriddevices, and currently no numerical codes can handle all the effectsof this concept. This paper introduces the present stage of the model
136 Comparison of Simulations and Offshore Measurement Data of a Combined Floating Wind and Wave Energy Demonstration Platform
Fig. 13 Comparison of mooring loads as a function of significantwave height for simulations and measurement. The measurementsare plotted by the binned mean values and the interval of onestandard deviation from the maximum, mean, and minimum values.The output from the simulations corresponds to the circles. Themeasurements are represented by the mean value of the 10-minmaximum, mean, and minimum values. The error bars show thevariation of this mean value with ±1 standard deviation. The outputfrom the simulations corresponds to the circles.
development, which currently cannot handle active WECs. Thedifferent submodels have previously been verified by comparison tosimulated data and other model results; however, offshore dataavailable for model validation of floating wind turbines are verylimited and often not publicly available. The results shown in thispaper are a positive first comparison, with a clear good statisticalcomparison achieved for a selection of loads and motions, but afull validation is not achieved. This is partly due to the quality ofthe measured data and also the limitations of the numerical model.
Limitations of the Current Numerical Model
The wave kinematics used for this PROG H–PROG W modelare based on 2D linear wave theory assuming small waves relatedto the water depth.
One of the challenges of validating the numerical model is toinclude the external forces from waves and currents as recordedduring the measurements. The PROG W external system is basedon linear wave theory, where the water is modeled by potentialflow, and the wave amplitudes and motions are considered small.The set of assumptions allows for the simulation of this complexproblem in a computationally reasonable way. However, somehydrodynamics effects are not contemplated, which could affect theprecision and accuracy of the results with respect to the nature ofthe physics involved. PROG W does not take into account currents,but the measured current at the site is considered to be fairly slow(maximum recorded velocity of 0.3 m/s and mean velocity ofapproximately 0.13 m/s). It is estimated that not including thecurrent forces on the platform will likely not have a great impacton the comparisons for this particular site, but this should beconfirmed by further analysis.
The wave climate at the site was measured by the ADCP,which recorded 10-min mean values of Hs , Tp, and main wavedirection to describe the incoming waves. The energy content inthe waves measured by the wave spectrum was also recorded in the
Fig. 14 Three wave spectra: (1) measured at +40� on 12/10/13(with Hs = 0081 m, Tp = 307 s), (2) measured at −25� on 18/10/13(with Hs = 0081 m, Tp = 307 s), and (3) JONSWAP spectrum fromsimulations (with Hs = 0080 m, Tp = 308 s)
last test phase. The data consist of a range of wave frequencies(128 frequencies between 0.0 and 0.6 Hz), over a range of incomingdirections (90 directions between 0� and 360º). Two measuredwave spectra are plotted, as shown in Fig. 14.
This shows that the energy content of the wave spectrumis dependent on the wave direction at the site and also thatthe measured spectra have some differences compared to thenormal one-peak JONSWAP, which is normally considered to berepresentative for the North Sea. This is most likely caused by thelocal oceanography at the site, which mainly consists of shallowwaters near the shore, where swell is not fully generated. Currently,only two wave spectra are implemented in the numerical wavemodel: the JONSWAP and the Pierson–Moskowitz spectrum.
Mean drift forces, a result of the integration of the second-orderhydrodynamic pressure in first-order waves, averaged in time, arealso not included in the present version of the numerical model.Drag forces are also not included in the model, because the dragcoefficient has not been measured. The water depth at the sitecan be considered as shallow water. No shallow water effects areincluded in the simulations.
Improvements and Further Development of the NumericalModel
One of the major hurdles to overcome in the further developmentof the numerical model is the inclusion of the WECs and their PTOsystem. PROG W can analyze multiple bodies, and this featurecould be applicable in order to include the WECs in the numericalmodel. However, there might be some challenges in capturingthe exact hydrodynamic forces in the water channels where theabsorbers are located, but this can be validated by conductingwave-flume tests. Depending on the exact design of the system, theapproximation of a stiff system might not be valid, and platformflexibility might also be necessary to include in the system. Thisshould also be possible to include by utilizing one of the latestfeatures of PROG W that can include generalized-mode shapes.Drag forces could also be included by further implementing aset of fictitious Morison elements, only with drag forces andcoefficients representative to the real platform. Another challengeof reproducing the wave climate in the numerical model is 3Dwaves. This can be handled to some extent by including wavespreading in the wave model. For sites with high currents, a specialmodel that can take this into account also has to be considered.
Journal of Ocean and Wind Energy, Vol. 2, No. 3, August 2015, pp. 129–137 137
CONCLUSIONS
One of the key challenges in the development of combinedwind and wave energy devices is the development of reliablenumerical models to predict the loads and motions on the devicesunder different sea and wind conditions. The newly developedHAWC2–WAMIT interface shows that it, to some extent, cancapture platform motion when compared to measurements. Furtheranalyses should be carried out in order to clarify whether thediscrepancies in platform roll are due to the close coincidence ofplatform eigenfrequency and applied wave spectrum, to 3D waves,or to discrepancies in the recorded platform ballast system. Mooringloads show a reasonable comparison but include some uncertainty,because it was only possible to obtain mooring loads from one line.Turbine loads are captured to some extent, and the trend in theloads is comparable. More investigation into the load calibration isneeded in order to assess the quality of the measured turbine loads.The quality of the measurement data could be increased by revisingthe sensor calibration and potentially by including additional sensorfilters. Further model development in order to include active WECsin a coupled model could form the base for full validation of themodel by including additional measured data in a comparison. FFPis currently developing a commercial-size P80 supporting a 5 MWwind turbine and 2.6 MW wave power.
ACKNOWLEDGEMENTS
The work has been funded by Energinet.dk PSO under contractPSO-2011-1-10668 and by the European Regional DevelopmentFund.
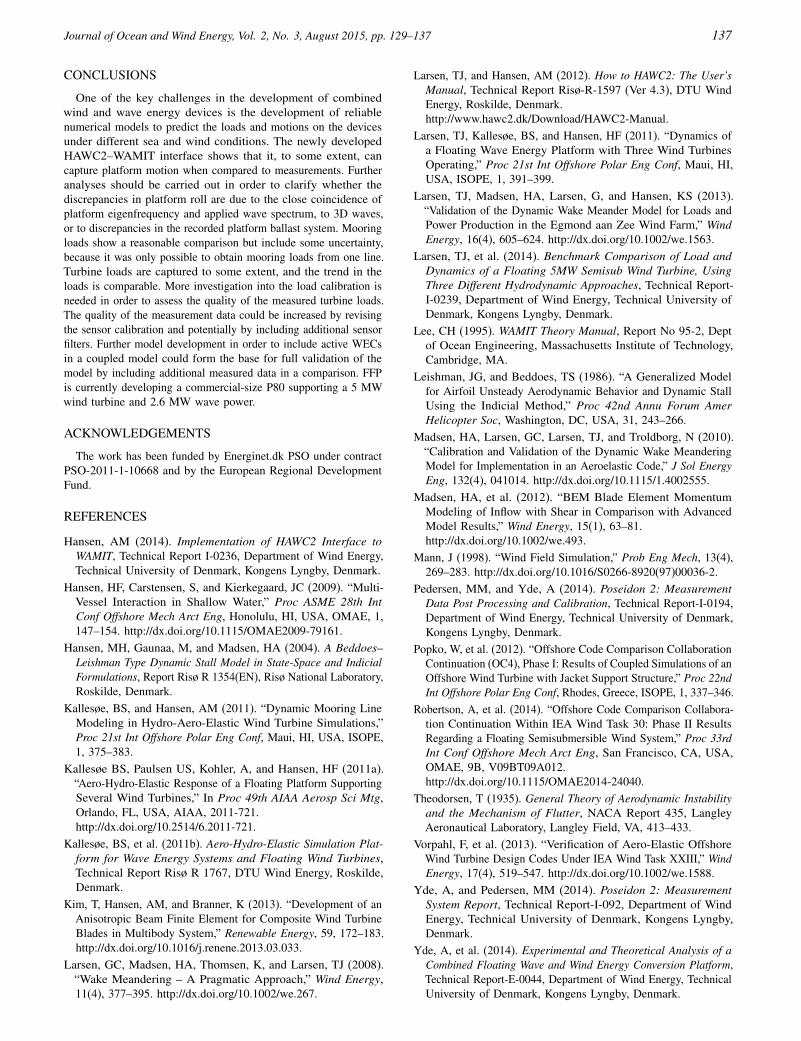
REFERENCES
Hansen, AM (2014). Implementation of HAWC2 Interface toWAMIT, Technical Report I-0236, Department of Wind Energy,Technical University of Denmark, Kongens Lyngby, Denmark.
Hansen, HF, Carstensen, S, and Kierkegaard, JC (2009). “Multi-Vessel Interaction in Shallow Water,” Proc ASME 28th IntConf Offshore Mech Arct Eng, Honolulu, HI, USA, OMAE, 1,147–154. http://dx.doi.org/10.1115/OMAE2009-79161.
Hansen, MH, Gaunaa, M, and Madsen, HA (2004). A Beddoes–Leishman Type Dynamic Stall Model in State-Space and IndicialFormulations, Report Risø R 1354(EN), Risø National Laboratory,Roskilde, Denmark.
Kallesøe, BS, and Hansen, AM (2011). “Dynamic Mooring LineModeling in Hydro-Aero-Elastic Wind Turbine Simulations,”Proc 21st Int Offshore Polar Eng Conf, Maui, HI, USA, ISOPE,1, 375–383.
Kallesøe BS, Paulsen US, Kohler, A, and Hansen, HF (2011a).“Aero-Hydro-Elastic Response of a Floating Platform SupportingSeveral Wind Turbines,” In Proc 49th AIAA Aerosp Sci Mtg,Orlando, FL, USA, AIAA, 2011-721.http://dx.doi.org/10.2514/6.2011-721.
Kallesøe, BS, et al. (2011b). Aero-Hydro-Elastic Simulation Plat-form for Wave Energy Systems and Floating Wind Turbines,Technical Report Risø R 1767, DTU Wind Energy, Roskilde,Denmark.
Kim, T, Hansen, AM, and Branner, K (2013). “Development of anAnisotropic Beam Finite Element for Composite Wind TurbineBlades in Multibody System,” Renewable Energy, 59, 172–183.http://dx.doi.org/10.1016/j.renene.2013.03.033.
Larsen, GC, Madsen, HA, Thomsen, K, and Larsen, TJ (2008).“Wake Meandering – A Pragmatic Approach,” Wind Energy,11(4), 377–395. http://dx.doi.org/10.1002/we.267.
Larsen, TJ, and Hansen, AM (2012). How to HAWC2: The User’sManual, Technical Report Risø-R-1597 (Ver 4.3), DTU WindEnergy, Roskilde, Denmark.http://www.hawc2.dk/Download/HAWC2-Manual.
Larsen, TJ, Kallesøe, BS, and Hansen, HF (2011). “Dynamics ofa Floating Wave Energy Platform with Three Wind TurbinesOperating,” Proc 21st Int Offshore Polar Eng Conf, Maui, HI,USA, ISOPE, 1, 391–399.
Larsen, TJ, Madsen, HA, Larsen, G, and Hansen, KS (2013).“Validation of the Dynamic Wake Meander Model for Loads andPower Production in the Egmond aan Zee Wind Farm,” WindEnergy, 16(4), 605–624. http://dx.doi.org/10.1002/we.1563.
Larsen, TJ, et al. (2014). Benchmark Comparison of Load andDynamics of a Floating 5MW Semisub Wind Turbine, UsingThree Different Hydrodynamic Approaches, Technical Report-I-0239, Department of Wind Energy, Technical University ofDenmark, Kongens Lyngby, Denmark.
Lee, CH (1995). WAMIT Theory Manual, Report No 95-2, Deptof Ocean Engineering, Massachusetts Institute of Technology,Cambridge, MA.
Leishman, JG, and Beddoes, TS (1986). “A Generalized Modelfor Airfoil Unsteady Aerodynamic Behavior and Dynamic StallUsing the Indicial Method,” Proc 42nd Annu Forum AmerHelicopter Soc, Washington, DC, USA, 31, 243–266.
Madsen, HA, Larsen, GC, Larsen, TJ, and Troldborg, N (2010).“Calibration and Validation of the Dynamic Wake MeanderingModel for Implementation in an Aeroelastic Code,” J Sol EnergyEng, 132(4), 041014. http://dx.doi.org/10.1115/1.4002555.
Madsen, HA, et al. (2012). “BEM Blade Element MomentumModeling of Inflow with Shear in Comparison with AdvancedModel Results,” Wind Energy, 15(1), 63–81.http://dx.doi.org/10.1002/we.493.
Mann, J (1998). “Wind Field Simulation,” Prob Eng Mech, 13(4),269–283. http://dx.doi.org/10.1016/S0266-8920(97)00036-2.
Pedersen, MM, and Yde, A (2014). Poseidon 2: MeasurementData Post Processing and Calibration, Technical Report-I-0194,Department of Wind Energy, Technical University of Denmark,Kongens Lyngby, Denmark.
Popko, W, et al. (2012). “Offshore Code Comparison CollaborationContinuation (OC4), Phase I: Results of Coupled Simulations of anOffshore Wind Turbine with Jacket Support Structure,” Proc 22ndInt Offshore Polar Eng Conf, Rhodes, Greece, ISOPE, 1, 337–346.
Robertson, A, et al. (2014). “Offshore Code Comparison Collabora-tion Continuation Within IEA Wind Task 30: Phase II ResultsRegarding a Floating Semisubmersible Wind System,” Proc 33rdInt Conf Offshore Mech Arct Eng, San Francisco, CA, USA,OMAE, 9B, V09BT09A012.http://dx.doi.org/10.1115/OMAE2014-24040.
Theodorsen, T (1935). General Theory of Aerodynamic Instabilityand the Mechanism of Flutter, NACA Report 435, LangleyAeronautical Laboratory, Langley Field, VA, 413–433.
Vorpahl, F, et al. (2013). “Verification of Aero-Elastic OffshoreWind Turbine Design Codes Under IEA Wind Task XXIII,” WindEnergy, 17(4), 519–547. http://dx.doi.org/10.1002/we.1588.
Yde, A, and Pedersen, MM (2014). Poseidon 2: MeasurementSystem Report, Technical Report-I-092, Department of WindEnergy, Technical University of Denmark, Kongens Lyngby,Denmark.
Yde, A, et al. (2014). Experimental and Theoretical Analysis of aCombined Floating Wave and Wind Energy Conversion Platform,Technical Report-E-0044, Department of Wind Energy, TechnicalUniversity of Denmark, Kongens Lyngby, Denmark.