Embed Size (px)
Citation preview

A COMPARISON OF SIMILAR SCALES ON THE STRONG VOCATIONALINTEREST BLANK AND THE KUDER OCCUPATIONAL
INTEREST SURVEY, FORM DD
by
ROBERT N. WILSON
B. A., Macalester College, 1966
A MASTER'S THESIS
submitted in partial fulfillment of the
requirements for the degree
MASTER OF SCIENCE
College of Education
KANSAS STATE UNIVERSITYManhattan, Kansas
1967
Approved by
Major Professor
IM-7
ACKNOWLEDGMENTS
The writer is especially grateful to his Major
Professor, Dr. Herbert E. Kaiser, Assistant Professor
of Education, Kansas State University, for his assist-
ance, guidance, and encouragement throughout the course
of this study.
The writer is also indebted to the College of
Education for help in providing the Kuder Occupational
Interest Surveys; to the Counseling Center for provid-
ing the Strong Vocational Interest Blanks; and to the
Men*s Physical Education Department for help and co-
operation in drawing the sample and administering the
tests.
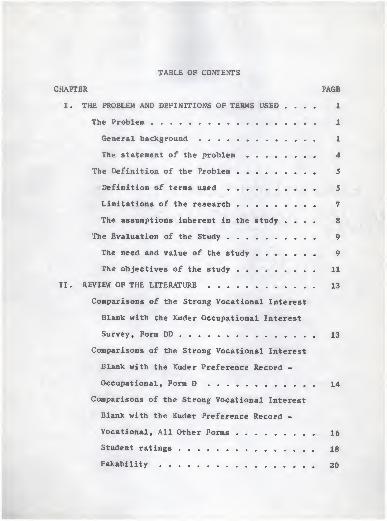
TABLE OF CONTENTS
CHAPTER PAGE
I. THE PROBLEM AND DEFINITIONS OF TERMS USED .... 1
The Problem 1
General background .... 1
The statement of the problem 4
The Definition of the Problem 5
Definition of terms used 5
Limitations of the research 7
The assumptions inherent in the study .... 8
The Evaluation of the Study 9
The need and value of the study 9
The objectives of the study 11
II. REVIEW OF THE LITERATURE 13
Comparisons of the Strong Vocational Interest
Blank with the Kuder Occupational Interest
Survey, Form DD 13
Comparisons of the Strong Vocational Interest
Blank with the Kuder Preference Record -
Occupational, Form D 14
Comparisons of the Strong Vocational Interest
Blank with the Kuder Preference Record -
Vocational, All Other Forms 16
Student ratings 18
Fakability 20

iv
CHAPTER PAGE
Predictive power 21
Comparison with self-ratings 22
Statistical comparisons 24
Word usage , 28
III. THE INSTRUMENTS 29
The Strong Vocational Interest Blank 29
Concurrent validity 29
Predictive validity 30
Split-half reliability 32
Test-retest reliability 32
Norm groups 33
The Kuder Occupational Interest Survey,
Form DD 33
Validity 33
Test-retest reliability 36
Norm groups 37
IV. PROCEDURES, METHODS, AND TECHNIQUES 38
Procedures 38
The sample 38
Administration of the tests 39
Scoring 40
Comparison of the tests 41
Methods 43
Techniques 44

V
CHAPTER PAGE
V. RESULTS 45
VI. SUMMARY, CONCLUSIONS, AND RECOMMENDATIONS .... 53
Summary 53
Conclusions • 54
Recommendations ..... 56
BIBLIOGRAPHY 59
APPENDIX A. CORRELATIONS BETWEEN KUDER PREFERENCE
RECORD SCALES AND STRONG VOCATIONAL
INTEREST BLANK KEYS. PROM A STUDY BY
TWIGGS 63
APPENDIX B. VALIDITY CHARACTERISTICS OP MEN'S SVIB
SCALES. PROM THE STRONG VOCATIONAL
INTEREST BLANK MANUAL, PAGE 35 66
APPENDIX C. PREDICTIVE VALIDITY OF SVIB SCALES OVER
18 YEARS. PROM THE STRONG VOCATIONAL
INTEREST BLANK MANUAL, PAGE 44 68
APPENDIX D. MEAN SCORES OF SIX OCCUPATIONAL GROUPS ON
THEIR "OWN 11 SCALE AND ON THEIR FIVE
OTHER HIGHEST SCORE SCALES ON HIGH
SCHOOL SENIOR AND ADULT SVIB's. FROM
THE STRONG VOCATIONAL INTEREST BLANK
MANUAL, PAGE 45 70
APPENDIX E. TEST-RETEST MEANS, STANDARD DEVIATIONS,
AND CORRELATIONS FOR SEVERAL GROUPS

vi
PAGE
OVER SEVERAL TIME INTERVALS. PROM
THE STRONG VOCATIONAL INTEREST BLANK
APPENDIX P.
MANUAL, PAGES 27-33 72
COMPARISON OP ERRORS OP CLASSIFICATION,
CORRECT CLASSIFICATIONS, AND TIES FOR
SIX OCCUPATIONAL GROUPS, OBTAINED FROM
TWO SCORING SYSTEMS. FROM THE KUDER
OCCUPATIONAL INTEREST SURVEY, FORM DD,
APPENDIX G.
76
DISTRIBUTION OF HIGHEST SCORE ON 30 OIS
CORE SCALES. FROM THE KUDER OCCUPA-
TIONAL INTEREST SURVEY, FORM DD,
APPENDIX H.
MANUAL, PAGES 30-31 79
PERCENTAGE OF OVERLAP FOR PAIRS OF GROUPS,
EACH GROUP SCORED ON 30 OIS CORE SCALES.
FROM THE KUDER OCCUPATIONAL INTEREST
SURVEY, FORM DD, MANUAL, PAGES 32-33 . . 82
APPENDIX I. RANK OF EACH CORE GROUP 1 S SCORES ON ITS
OWN OIS SCALE. FROM THE KUDER OCCUPA-
TIONAL INTEREST SURVEY, FORM DD, MANUAL,
APPENDIX J.
85
FREQUENCY OF DIFFERENCES, IN LAMBDA POINTS,
BETWEEN HIGHEST SCORE AND SCORE ON OWN
KEY. FROM THE KUDER OCCUPATIONAL

vii
PAGE
INTEREST SURVEY, FORM DD, MANUAL,
PAGE 36 87
APPENDIX K. EXPLANATORY LETTER RETURNED WITH INTEREST
PROFILES TO PARTICIPATING SUBJECTS ... 89
APPENDIX L. A BIBLIOGRAPHY LISTING OF ALL STUDIES
COMPARING THE STRONG VOCATIONAL INTEREST
BLANK WITH THE KUDER PREFERENCE RECORD -
VOCATIONAL, AS LISTED IN BUROS' MENTAL
MEASUREMENTS YEARBOOKS 92

LIST OP TABLES
TABLE PAGE
I. Correlation Coefficients for Identical Twin
Tests on the Kuder Preference Record -
Occupational, Form D, and the Strong Voca-
tional Interest Blank (Men) (N=464). Prom
a Study by King, Norrell, and Powers 17
II. Answers to Questions Evoking Pupil Reaction to
Inventories. From a Study by Gordon and
Herkness 19
III. Contingency Coefficients Showing Relationships
Between Self-Ratings of Vocational Interests
and Scores on the Strong Vocational Interest
Blank and on the Kuder Preference Record.
From a Study by Berdie 23
IV. Correlation Coefficients Between Twenty-Seven
Same-Named Scales on the Strong Vocational
Interest Blank and the Kuder Occupational
Interest Survey, Form DD (N 98) 47
V. Correlation Coefficients Between Forty-Nine
Similar Non-Same -Named Scales on the Strong
Vocational Interest Blank and the Kuder
Occupational Interest Survey, Form DD
(N = 98) 48

ix
TABLE PAGE
VI . Correlation Coefficients Between Same-Named
Scales on the Strong Vocational Interest
Blank and the Kuder Occupational Interest
Survey, Form DD, and the Kuder Preference
Record - Occupational, Form D 51

CHAPTER I
THE PROBLEM AND DEFINITIONS OP TERMS USED
Whenever two tests purport to measure the same factors,
it is both natural and desirable to compare them empirically
to determine to what extent they actually measure these same
factors. By using methods of concrete experimental compari-
son, more realistic decisions regarding both the use of these
tests and their relative effectiveness can be made.
I. THE PROBLEM
General background . Traditionally, there have been
two giants in the field of occupational interest testing:
The Strong Vocational Interest Blank and The Kuder Preference
Record - Vocational. Originally, these two occupational
interest tests used completely different methods. The Strong
provided an index of the similarity between a person's inter-
ests and those of successful men in each of a wide variety of
occupations. Strong accomplished this comparison by using a
criterion group (usually about 300) in each specified occupa-
tion. He actually administered the tests to the criterion
groups and then compared each individual student's profile
with the criterion group in each occupation. Thus, the Strong
gave the student a score in each of many occupations, showing
how similar his interests were to the interests of men who

2
had been successfully engaged in that occupation. These
scores were weighed according to the interests of a group
(men in general) on each scale. Strong has continued to use
this method of scoring since the original publication of his
tests. The only changes made in the Strong have been to
update and improve his criterion groups. 1
The Kuder Preference Record - Vocational was scored
by an entirely different method. The Kuder was unlike the
Strong in that it did not compare an individual's interest
pattern with those of successful men currently engaged in
specific occupations. The Kuder measured preference in ten
broad areas of interest. An individual's preferences indi-
cated that he liked certain types of activities. When his
preferences were identified, he could investigate the occupa-
tions that involved those activities. In this way he nar-
rowed the field of investigation to those occupations most
deserving of his attention. Kuder also has continued to use
his method of scoring (since the original publication) on his
2test, The Kuder Preference Record - Vocational.
In 1956, Kuder published a new form of the Kuder
Preference Record - Occupational, Form D. The form used the
Edward K. Strong, The Strong Vocational InterestBlank Manual (Stanford: The Stanford University Press, 1966).
oG. Frederic Kuder, Administrator's Manual , Kuder
Preference Record - Vocational , Form C (Chicago, Illinois:Science Research Associates, Inc . , 1960 )
.

3
same items as the old Kuder, but was scored in a new way,
very much like the Strong was scored. It gave the student a
score in each of forty-eight specific occupations, showing
how much his interests were similar to the interests of men
successfully engaged in those occupations. Two studies have
been made comparing the new Kuder Preference Record - Occu-
pational, Form D.with the Strong Vocational Interest Blank. 4
In both of the studies cited, several scales were found to be
named the same, but each pair had a very low relationship.
Again, in 1966, Kuder published another test using an
entirely different scoring method, the Occupational Interest
Survey, Form DD (01 S). Kuder stated that the new concept in
scoring resulted in better discrimination between occupational
groups than had been demonstrated by other approaches. The
traditional approach had been to compare the interests of the
members of a specific occupational group with those of a
general reference group, and to weigh the items accordingly.
The general reference group was used by both Strong and Kuder
3G. Frederic Kuder, Kuder Preference Record - Occupa-
tional , Form D, Manual (Chicago, Illinois: Science ResearchAssociates, Inc., 1956).
4Paul King, Gwendolyn Norrell, and G. Pat Powers,
"Relationships Between Twin Scales on the SVIB and the Kuder,"Journal of Counseling Psychology . 10:395-401, Winter, 1965;Michael P. Joseph, "The Strong Vocational Interest Blank andthe Kuder Preference Record - Occupational, Form D: A Com-parative Study of Eight Same-Named Scales," Yearbook of theNational Council of Measurement in Education . 18:145-54. 1961.

4
in developing norms for the Strong Vocational Interest Blank
and the Kuder Preference Record - Occupational, Form D.
In the OIS, better differentiation is achievedby eliminating the use of a general reference grouprepresentative of men in general. It can now besaid with considerably more confidence that a per-son's pattern of interests is, for example, morelike that typical of chemists than of pediatricians.*
No studies had been made comparing this new Kuder Occupational
Interest Survey, Form DD with the Strong Vocational Interest
Blank, prior to this study.
A major difference exists between the items of the
Strong Vocational Interest Blank and the Kuder Occupational
Interest Survey, Form DD. The Strong consists of 400 items
to which the student responds like, dislike, or indifferent.
The Kuder consists of 100 items and each item contains three
choices. The student marks the one most like him, the one
least like him, and leaves the other choice blank. In the
Kuder, the student is forced to choose between various
possibilities.
The statement of the problem . The purpose of the study
was to compare similar scales on the Strong Vocational Inter-
est Blank and the Kuder Occupational Interest Survey, Form DD,
to determine to what extent they actually measure the same
factors.
G. Frederic Kuder, Kuder Occupational Interest Survey,
Form DD, General Manual (Chicago, Illinois: Science ResearchAssociates, Inc., 1966).

5
The information resulting from the comparison would be
useful to counselors in deciding which interest test to use
in the counseling situation. The results would also point
out inconsistencies and contradictions in the use of both
interest tests with the same client.
II. THE DEFINITION OP THE PROBLEM
Definition of terms used . The following list of terms
was defined for clarification of the problem.
1. Vocational Interest - As used in this study, voca-
tional interest refers to a score for one specific occupation
on either the Strong Vocational Interest Blank or the Kuder
Occupational Interest Survey, Form DD.
2. Comparison - This term refers to the degree of
correlation between two sets of data as measured by the
Pearson* s Product Moment Correlation Coefficient.
3. Correlation Coefficient (r) - "A measure of the
degree of relationship, or 'going-togetherness,' between two
sets of measures for the same group of individuals." A
correlation coefficient can have a value ranging from 1 for
perfect positive correlation or relationship to a -1 for
perfect negative correlation or relationship, with a value of
for a complete lack of relationship.
Roger T. Lennon, "A Glossary of 100 MeasurementTerms," Test Service Notebook , No. 13, p. 2.

4. Significance - A statistical measure, such as the
correlation coefficient, is said to be significant if (within
certain limits of probability) it could not have occurred
merely by chance. Thus, if we say that the correlation
coefficient of .89 is significant at the .01 level, we mean
that only once in a hundred times would we expect to get .89
for a correlation coefficient between the two variables
merely by chance. This expression is written mathematically
r =* .89 (p .01).
All that a significant result implies is that onehas observed something relatively more likely givensome alternative situation. Statistical significanceis a statement about conditional probability, nothingelse. It does not guarantee that something important,or even meaningful, has been found.
7
Meaningfulness is shown by the magnitude of the correlation
coefficient.
5. Simple Random Sample - A random sample is a sample
so drawn that every single sampling unit in the population
has an equal chance of being drawn into the sample. In using
the technique of simple random sampling, each individual in
the population is assigned a number and these numbers are
drawn randomly for the sample by chance, as with a table of
random units.
7William L. Hays, Statistics Por Psychologists (New
York, New York: Holt, Rinehard and Winston, 1963), p. 299.ePred P. Barnes, Research Por The Practitioner In
Education (Washington, D.C., Maryland: Department of

7
6. Computer - The computer system used to analyze
the data was the IBM 1410 computer system, Kansas State
University. The program was written in Fortran.
Limitations of the research . The limitations of the
research are as follows:
1. A simple random sample of all freshman males at
Kansas State University, Manhattan, Kansas was used. The
results of the study statistically apply only to Kansas State
University freshman males since only these students had the
possibility of being included in the sample. Nevertheless,
the results should apply very accurately to other colleges
similar to Kansas State University in student occupational
interests. Also, the results should be useful to all persons
utilizing the two interest inventories in a counseling
situation.
2. Kansas State University is fully accredited by
the North Central Association of Colleges and Secondary
Schools and numerous professional organizations. The univer-
sity was established early in 1863 under provisions of the
Morrill Act. K-State is proud of its heritage as a land-
grant university. The university has changed with the
economy of Kansas. Launched primarily as an agricultural
Elementary School Principals, National Education Association,1964), p. 38.

8
school, it has evolved into an important engineering and
scientific institution. Course requirements have been
broadened to supplement specialized vocational training with
more liberal education. The university has developed over
fifty departments integrated under colleges of Agriculture,
Architecture and Design, Arts and Sciences, Commerce, Educa-
tion, Engineering, Home Economics, and Veterinary Medicine.
K-State has received wide recognition for its excellent
programs in Engineering and Veterinary Medicine. The enroll-
ment at K-State was approximately 11,000 in 1966-67, with
about 1,400 of these students being freshman males. The
students came from all parts of the United States and many
foreign countries. The largest percentage of students came
from Kansas, many of them from small Kansas towns. Kansas
State University is located in Manhattan, a second-class city
in northeastern Kansas. Manhattan has a population of
approximately 23, 000. 9
The assumptions inherent in the study . The assumptions
inherent in the research study were as follows:
1. One of the assumptions necessary in using Pearson's
Product Moment Correlation Coefficient is that the data must
Q'Kansas State University, Kansas State UniversityBulletin (Manhattan, Kansas: Kansas State University,October, 1966), pp. 3-9.

9
be normally distributed through the population. Thus, the
assumption was made that within each occupation the responses
on both the Strong Vocational Interest Blank and the Kuder
Occupational Interest Survey were normally distributed
throughout the freshman males at Kansas State University.
This assumption will have no effect on using the correlation
coefficient as an index of the extent to which the two
measurements are linearly related. For the purpose of making
statistical inferences, the use of Fisher's transformation
made normal tables and theory applicable.^
2. It is the duty of test makers to clearly delimit
the factors which their tests measure. When two tests purport
to measure the same factors but do not, only confusion, in-
consistency, and contradiction can result from their use.
III. THE EVALUATION OF THE STUDY
The need and value of the study . A number of studies
have been made attempting to show the relationship between
scores on the Kuder Preference Record - Vocational and the
Strong Vocational Interest Blank. But, as has been previously
mentioned, the two tests have completely different methods of
scoring, and completely different objectives in testing
' H. C. Fryer, Concepts and Methods of ExperimentalStatistics (Boston, Massachusetts: Allyn and Bacon, Inc.,1966, pp. 225-227.

10
interests. Strong compared a student's interests with
those of men within specific occupations, while Kuder
measured preference in ten broad areas of interests (Kuder
Preference Record - Vocational). Studies comparing the Strong
Vocational Interest Blank with the Kuder Preference Record -
Vocational, although of interest and use in determining
counseling applications of the two tests, really are not valid
because of differences in their objectives.
Two studies have been made comparing the Strong Voca-
tional Interest Blank with the Kuder Preference Record -
Occupational, Form D. The comparisons were appropriate
because the Kuder Preference Record - Occupational, Form D,
and the Strong Vocational Interest Blank both used the same
method of scoring and had the same objectives (comparing an
individual's interests with those of men within specific
occupations). *• One of these studies compared the two tests
in only nine occupations and the other, although an extensive
and interesting study, did not make use of random sampling,
thus precluding any statistical inferences to a larger
population.
There were several reasons for the need of this study:
(1) No studies had previously been found comparing the Strong
Sugra, Chapter I, pp. 1-2.
12King, Norrell, Powers, and Joseph, loc. cit.

11
Vocational Interest Blank with the Kuder Occupational
Interest Survey, Form DD, (2) Kuder claimed a better discrim-
ination between occupational groups using the new scoring
approach, (3) The previous studies which compared the Strong
Vocational Interest Blank with the Kuder Preference Record -
Occupational, Form D, reported low correlations, and (4) The
possibility existed of inconsistencies, contradictions, and
confusion as to the use of the two instruments. The compari-
son was appropriate because the two tests used similar methods
of scoring and had the same objectives (comparing an individ-
ual's interests to those of men within specific occupations).
The study was made in rigorous adherence to the principles of
research methods so that the results might be both valid and
useful in making inferences to larger groups than the sample.
The objectives of the study . There were two main
objectives in making this study:
1. The first objective was to point out the extent
to which the two interest tests measure the same factors so
that they may be more effectively used in counseling situ-
ations.
2. The second objective was to point out any incon-
sistencies or contradictions in the use of both interest
tests with the same client. While waiting for such incon-
sistencies to be rectified within the tests, it would be best

12
to continue using the test which had been shown useful over
the years. This does not imply that inconsistencies are the
result solely of one test or the other. Both tests could
probably be improved and perhaps some combination of the two
would result in an instrument more valid and useful than
either test taken separately. Hopefully, through the study,
instruments of testing interests will be improved to facili-
tate better and more accurate counseling of students.

CHAPTER II
REVIEW OP THE LITERATURE
The following analysis of research studies was related
to the problem of this investigation. Related studies were
discussed in reverse chronological order, beginning with the
most recent and most pertinent studies and proceeding back to
the oldest and least pertinent studies. Only those studies
which are especially pertinent were reviewed. The review of
literature included studies involved with (1) comparisons of
the Strong Vocational Interest Blank with the Kuder Occupa-
tional interest Survey, Form DD, (2) comparisons of the
Strong Vocational Interest Blank with the Kuder Preference
Record - Occupational, Form D, and (3) comparisons of the
Strong Vocational Interest Blank with the Kuder Preference
Record (all other forms).
I. COMPARISONS OF THE STRONG VOCATIONAL INTERESTBLANK WITH THE KUDER OCCUPATIONAL
INTEREST SURVEY, FORM DD
No studies have been found comparing the Strong Voca-
tional Interest Blank with the Kuder Occupational Interest
Survey, Form DD. The newness of the Kuder (published in 1966)
would account for the lack of research. No such studies were
mentioned in either the test manuals or in Buros* Sixth Mental
Measurements Yearbook. After conferring with several

14
prominent men in the field of vocational interest testing,
no current research comparing these two tests was discovered.
Some of the men contacted were: Dr. Danskin, Counseling
Center, Kansas State University; Dr. Wiesner, Counseling
Center, Kansas State University; a report made by a repre-
sentative of Science Research Association on the new Kuder
Occupational Interest Survey, Porm DD, at the National
Personnel and Guidance Association convention, 1967, Dallas,
Texas; and Dr. David P. Campbell, author of the current
manual for the Strong Vocational Interest Blank.
II. COMPARISONS OF THE STRONG VOCATIONAL INTERESTBLANK WITH THE KUDER PREFERENCE RECORD -
OCCUPATIONAL, FORM D
Two studies have been found comparing the Strong Voca-
tional Interest Blank with the Kuder Preference Record -
Occupational, Form D.
Michael P. Joseph compared eight same-named scales on
the Strong Vocational Interest Blank and the Kuder Preference
Record - Occupational, Form D. 13 Although the specific
reference could not be obtained, Dr. David P. Campbell did
make some comments on this study in his review of the test.
13Michael P. Joseph, 'The Strong Vocational Interest
Blank and the Kuder Preference Record - Occupational, FormD: A Comparative Study of Eight Same-Named Scales," Year-book of the National Council of Measurement in Education.18:145-54, 1961.

15
The study used forty-five students and compared their
responses on eight same-named scales with a median correla-
tion coefficient of .50. Another study was reported in the
same paper, using 164 students on ten same-named scales with
a median correlation coefficient of ,45. 14 The significance
levels of the two correlation coefficients were not reported,
but they were both significant at the .01 level. 15
A comprehensive study was made by Paul King, Gwendolyn
Norrell, and G. Pat Powers in which the relationships between
twin scales on the Strong Vocational Interest Blank and the
Kuder Preference Record - Occupational, Form D were studied.
Both tests were administered to 464 male students in the
College of Business at Michigan State University. Although
a high percentage of these students were freshmen, the group
was heterogeneous in terms of age and socioeconomic level.
In general, it was found that the correlations between
identical twin scales were rather low, the average coeffi-
cient being .370. Many twin scales correlated higher with
supposedly unrelated scales than they did with their identical
twin. The highest negative correlations were: SVIB - Parmer
14Oscar K. Buros, The Sixth Mental Measurements Year-
book (Highland Park, New Jersey: The Gryphen Press, 1965T7p. 1063.
J. P. Guilford, Fundamental Statistics in Psychologyand Education (New York, New York: McGraw-Hill Book Company.1965;, pp. 580-581. 7

16
and Kuder Industrial Psychologist, -.588; SVIB - Parser and
Kuder - High School Counselor, -.586; and SVIB - Parmer and
Kuder - Personnel Manager, -.574. The highest positive
correlations were: SVIB - Psychologist and Kuder - Psychology
Professor, .554; SVIB - Sales Manager and Kuder - Insurance
Agent, .554; and SVIB - Life Insurance Agent and Kuder -
Retail Clothier, .551. The correlation coefficients obtained
for identical twin scales on the two tests were recorded in
Table I. Two ways were indicated by which the counselor
might avoid the embarrassment of explaining incompatible test
findings to the client. The first was to assign only one
interest test. And, the second was to familiarize oneself
thoroughly with the tests one uses in his daily practice to
the extent that the counselor can help the client integrate
inconsistencies in test findings. 16
III. COMPARISONS OP THE STRONG VOCATIONAL INTERESTBLANK WITH THE KUDER PREFERENCE RECORD -
VOCATIONAL, ALL OTHER FORMS
Several studies have been made comparing the Strong
Vocational Interest Blank with the Kuder Preference Record -
Vocational.
Paul King, Gwendolyn Norvell, and G. Pat Powers,"Relationships Between Twin Scales on the SVIB and theKuder," Journal of Counseling Psychology . 10:395-401, 1963.

17
TABLE I
CORRELATION COEFFICIENTS FOR IDENTICAL TWIN TESTS ON THEKUDER PREFERENCE RECORD - OCCUPATIONAL, FORM D, ANDTHE STRONG VOCATIONAL INTEREST BLANK (MEN)(N=464).
FROM A STUDY BY KING, NORRELL, AND POWERS
Twin tests r coefficient
1. Farmer .4712. Forester .4493. Minister .5184. Physician .4115. Y.M.C.A. secretary .4366. School superintendent .4227. Accountant .2958. Journalist .3309. Architect .341
10. Lawyer .35211. Dentist .31812. Veterinarian .22113. Chemist .38614. Pharmacist (Druggist: Kuder) .087

18
Student ratings . Malcolm attempted to determine the
relative usefulness of four extensively used vocational
interest inventories in counseling at various academic levels.
The four inventories selected for study were believed to be
those most extensively used: Cleeton's Vocational Interest
Inventory, Kuder's Preference Record, Lee and Thorpe's
Occupational Interest Inventory, and Strong's Vocational
Interest Blank. The subjects were drawn from three distinct
sources: high school, college, and graduate school. There
was an equal number of men and women in each group. Each of
the interest inventories was administered to the three groups
of subjects and they were used in a counseling situation.
Then, both the subjects and the counselors rated the inven-
tories on a questionnaire. The Kuder was judged the most
useful inventory for all three women's groups and for high
school men, and was close second for college men. The Strong
was judged best for college and graduate men. The Lee-Thorpe
was second for all women's groups while the Cleeton ranked
fourth in almost every instance. 1^
In a study of fifty twelfth-grade boys by Gordon and
Herkness, the subjects were asked to rate seven different
interest inventories on five questions concerning their
relative usefulness. The results were shown in Table II.
17x' David Donald Malcolm, "Which Interest Inventory
Should I Use?" Journal of Educational Research, 44:91-8.October, 1950.

19
TABLE II
ANSWERS TO QUESTIONS EVOKING PUPIL REACTION TOINVENTORIES. PROM A STUDY BY GORDON
AND HERKNESS
c 41
o Bc w oo +» >s u 00 +*» •H u u V 1 W Hi u •p 1 3 u «V u c •o to U 3 •H«-i (d V 3 V *» £Z oo o o M J IA H H
1. Which of the seven inven-tories did you findeasiest to comprehend,both from directions, andfor answering and thephrasing of the questionsthemselves? 1 4 32 6 2 5 50
2. In which test did youfind it easiest to recordyour answers? 1 38 4 2 5 50
3. In which test did youfind the individual items(collectively) of greatestinterest and scope? 10 2 11 9 17 1 50
4. In which test was themechanical set-up mostattractive and interest-ing? 5 2 9 23 10 1 50
5. Which test yielded resultswhich were most satisfy-ing to you? (Not neces-sarily agreeing with pre-conceived ideas.) 3 5 13 10 1 15 3 50
c

20
The Kuder was rated highest on questions one, two, and four
while the Strong was rated highest on questions three and
five. The Strong Vocational Interest Blank for Men was
deemed most productive of answers that were satisfying. This
may mean that the scores were in agreement with the boys* own
pre-conceived notions of their interests. The entire group
of fifty boys, with three exceptions, expressed the opinion
that they had gained some useful knowledge of themselves and
some help in making choices of vocations.*-®
Pakability . Longstaff , in a study designed to compare
the fakability of the Strong Vocational Interest Blank and
the Kuder Preference Record with fifty-nine subjects, made
the following conclusions: (1) Both tests are decidedly
fakable, (2) Some interest categories are more fakable than
others, (3) Women are less successful in faking than men,
(4) The Strong test, in general, is easier to fake upward
than the Kuder, while the Kuder is easier to fake downward
than the Strong, (5) It does not follow that much faking goes
on in actual use of these tests. The potential danger is
present, however, (6) The interest maturity and occupational
level scores behave as would be expected. Further study of
the I.M. scale as an index of faking is indicated, (7) A new
18Hans C. Gordon and Walter W. Herkness, Jr., "PupilsAppraise Vocational Interest Blanks," Occupations , 20:100-2,November, 1941.

21
set of directions should probably be made for both tests in
order to minimize faking, (8) Further research is indicated
to explore the possibility of developing an empirical scale
to detect faking. It was found that 74 per cent of the male
subjects were able to successfully fake upward one or two
letter grades on seven out of eight of the interest cate-
gories on the Kuder.*"
Predictive power . Garrett compared the predictive
power of the Strong Vocational Interest Blank and the Kuder
Preference Record - Vocational on eighty-four graduated male
students from the University of Missouri. It was found that
when a background of interview information, personal data,
and results of other tests were available, college counselors
were able to predict occupational classification equally well
whether or not the Kuder Preference Record - Vocational or
the Strong Vocational Interest Blank was added. Neither
inventory, when added, produced a significant increase in
accuracy of prediction over that achieved through the use of
the basic data alone. Further tests indicated that predic-
tion, under all conditions and by all predictors, achieved a
Howard P. Longstaff, "Fakability of the StrongInterest Blank and the Kuder Preference Record," Journal ofApplied Psychology . 32:360-9, August, 1948.

greater accuracy than that to be expected by chance.
22
20
Comparison with self-ratings . In a study designed to
use the same method of determining the relative agreement
between test scores on both the Strong Vocational Interest
Blank and the Kuder Preference Record with students' self-
ratings, Berdie utilized 500 men who varied in age from 14 to
37. Kuder defines significant scores as being 75th percen-
tile and above. Strong stated that scores of A and B+ on his
test are significant. The number of significant scores, as
defined by these authorities, is much greater on the Kuder
test in eight of nine areas, and only one area, the sub-
professional or technical, has more significant scores on the
Strong test. The median contingency coefficient between the
Strong test and self-ratings was .43; between the Kuder test
and self-ratings, .52. The coefficients showing the degree
of relationship in each area between each of the two tests
and self-ratings were presented in Table III. The chi squares
were all statistically significant beyond the 1 per cent
level of probability. The results presented here were in
general agreement with the results obtained by other investi-
gators, and the correlation between measured and self-estimated
20"vGene Aubrey Garrett, "A Comparison of the PredictivePower of the Kuder Preference Record and the Strong VocationalInterest Blank in a Counseling Setting," Doctor's Thesis,1961 (DA 22:1506).

23
TABLE III
CONTINGENCY COEFFICIENTS SHOWING RELATIONSHIPS BETWEENSELF-RATINGS OF VOCATIONAL INTERESTS AND SCORES
ON THE STRONG VOCATIONAL INTEREST BLANKAND ON THE KUDER PREFERENCE RECORD.
FROM A STUDY BY BERDIE
Occupational areaC withStrong
C withKuder
TechnicalComputationalPhysical SciencesSocial ServiceMusicalSalesBiological SciencesVerbal - LiteraryArtisticClerical
.55
.61
.32
.43
.39
.58
.27
.51
.33
.61
.47
.34
.46
.52
.60
.58
.30
.61
.58
.52
24
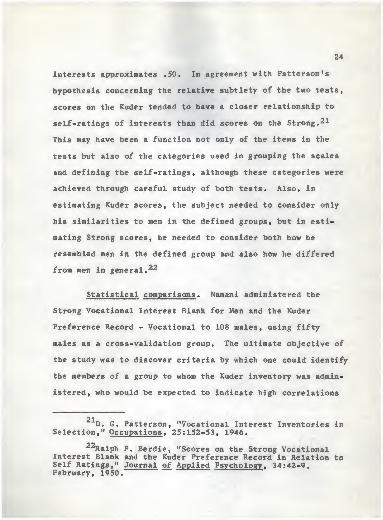
interests approximates .50. In agreement with Patterson's
hypothesis concerning the relative subtlety of the two tests,
scores on the Kuder tended to have a closer relationship to
self-ratings of interests than did scores on the Strong. 21
This may have been a function not only of the items in the
tests but also of the categories used in grouping the scales
and defining the self-ratings, although these categories were
achieved through careful study of both tests. Also, in
estimating Kuder scores, the subject needed to consider only
his similarities to men in the defined groups, but in esti-
mating Strong scores, he needed to consider both how he
resembled men in the defined group and also how he differed
from men in general. 22
Statistical comparisons . Namani administered the
Strong Vocational Interest Blank for Men and the Kuder
Preference Record - Vocational to 108 males, using fifty
males as a cross-validation group. The ultimate objective of
the study was to discover criteria by which one could identify
the members of a group to whom the Kuder inventory was admin-
istered, who would be expected to indicate high correlations
21D. G. Patterson, "Vocational Interest Inventories in
Selection," Occupations , 25:152-53, 1946.
22Ralph P. Berdie, "Scores on the Strong VocationalInterest Blank and the Kuder Preference Record in Relation toSelf Ratings," Journal of Applied Psychology , 34:42-9,February, 1950.

25
on the Kuder and the Strong if the second inventory was also
administered to them. Comparisons were made between the 25
per cent of the test group (27 cases) which displayed a rank
order correlation of #72 or greater and the 25 per cent of
test group (27 cases) which displayed a rank order correla-
tion of .31 or less. Two of the twenty-six factors studied
indicated relationships between the high and low groups which
were statistically significant. Students exhibiting "realism"
of occupations and "agreement" between their best-liked
subjects in high school and their related Kuder scores would
be expected to have a tendency (two to one) to have high
correlations (above .72) between their scores on the Kuder
and Strong inventories. 23
Peters administered the Kuder Preference Record to
twenty-four first-year college women who several months
previously had taken the Strong Vocational Interest Inventory
for Women. The scales of the Strong Inventory were placed
into related groups, and representative scales of each group
were studied with the comparable scales of the Kuder Pref-
erence Record. The students' new scores on each scale were
translated into percentile scores. The percentile scores
were studied with regard to the intercorrelations which
23' Abdel-Kader Namani, "Factors Associated with High
and Low Correlations Between Individuals' Scores on TwoInterest Inventories," Doctor's Thesis, Cornell University.1958 (DA 19:2538).

26
existed between each and every other representative scale of
the two inventories. From the original nine scales of the
two inventories, it was found that there exist five inter-
correlations which should be given serious consideration by
personnel workers and counselors: (1) the SVIB - Physicians
and the Kuder - Scientific Activities +.38; (2) the SVIB -
Office Workers and the Kuder - Computational Activities +.46;
(3) the SVIB - Authors and the Kuder - Literary Activities
+.42; (4) the SVIB - Lawyers and the Kuder - Scientific Activ-
ities +.41; and (5) the SVIB - Lawyers and the Kuder - Social
Service Activities +.52. None of these correlation coeffic-
ients were significant at even the .10 level. 24
Patterson compared Kuder and Strong interest profiles
for one subject and found that the Kuder and Strong were in
general agreement in the Sales and Social Service scales, but
were in violent disagreement on the clerical work scale.
Patterson believed that this disagreement was due primarily
to the fact that the Strong blank was more subtle than the
Kuder. The Kuder and the Strong both yield important informa-
tion about an individuals interest patterns when obtained in
a guidance situation. However, in a selection situation, it
would appear that the Strong was to be preferred because it
Edwin F. Peters, "Vocational Interests As Measuredby the Strong and Kuder Inventories," School and Society,55:453-5, April 18, 1942. L

27
was more subtle, and the vocational significance of liking
or disliking each of 400 items is not so readily apparent to
the person taking the test. This conclusion needs to be
verified from data drawn from additional cases. 25
Whittenborn, Triggs, and Peder made two studies com-
paring the Strong Vocational Interest Blank with the Kuder
Preference Record. They found high agreement between the
Kuder scientific area and the Strong II on the men's Strong
and group IV on the women's Strong. They also found positive
relationship between the Computational Scale on the Kuder and
Group VIII on the men's Strong and group II on the women's
Strong. Little agreement was expected or found between the
Kuder Musical Scale and the men's or women's Strong. The
extent of agreement between the Social Service key and the
corresponding key of the men's Strong was quite marked, but
the same extent of agreement fails to appear on the women's
Strong. These data should be considered tentative. 26
Triggs administered both the Strong Vocational Interest
Blank and the Kuder Preference Record to 166 men and corre-
lated the scores within each area of interest. The
25"-'Donald G. Patterson, "Vocational Interest Inven-
tories in Selection," Occupations . 25:152-3, December, 1946.
26J. R. Wittenburn, Oralind Triggs, and Daniel D.
Feder, "A Comparison of the Interest Measurement by the KuderPreference Record and the Strong Vocational Interest Blanksfor Men and Women," Educational and Psychological Measurement.3:239-57, August, 19JT.
' &

28
correlations ranged from -.52 to + .73 and include several
correlation coefficients of +.60 or above. The specific
correlation coefficients may be observed in Appendix A. On
the whole, Triggs* study has confirmed relationships which
one who was familiar with the instruments might expect to
find. A careful study of these data will help counselors to
understand and utilize interest measurement more meaningfully
in the counseling of students. 27
Word usage . Several studies have also been made which
compared the word usage of the Strong Vocational Interest
Blank and the Kuder Preference Record. It was questionable
whether either interest inventory was appropriate for ninth
grade students or younger without some readjustments of the
word usage in the tests. Generally, it was agreed that the
Kuder was appropriate for a lower level vocabulary than the
Strong. These results would have been expected, however,
because Strong advocates using this test only with persons
of age 17 or older. 28
27Francis Oralind Triggs, "A Purther Comparison of
Interest Measurement by the Kuder Preference Record and theStrong Vocational Interest Blank for Men," Journal of Educa-tional Research . 37:538-44, March, 1944.
28Edward C. Roeber, "A Comparison of Seven InterestInventories With Respect to Word Usage," Journal of Educa-tional Research . 42:8-17, September, 1948; Buford~Stefflre,The Reading Difficulty of Interest Inventories," Occupations.26:95-6, November, 1947. "

CHAPTER III
THE INSTRUMENTS
The two instruments used to measure vocational inter-
ests: the Strong Vocational Interest Blank and the Kuder
Occupational Interest Survey, Form DD f were examined for
validity, reliability, and normative criterion groups.
I. THE STRONG VOCATIONAL INTEREST BLANK
Concurrent validity . The occupational-interest scales
were developed to distinguish members of occupational groups
from people-in-general. To establish the validity of the
scales, it was necessary to show that they did separate
various groups. The statistic used to indicate the degree of
separation was the per cent overlap. This figure, with a
range from zero to 100 per cent, gave the per cent of scores
in one distribution that can be matched by scores in another
distribution. Per cent overlaps for each scale were pre-
sented in Appendix B. They ranged from 15 to 52, with a
median of 31 per cent overlap. That the Strong Vocational
Interest Blank scales do not separate all possible pairs of
occupations was probably not a reflection of poor validity
but an indication of similarity in interests between some
occupations. In general, the scales had little over-lap and

30
were successful in separating occupational groups from
people-in-general
,
29
Predictive validity . Since the Strong Vocational
Interest Blank was widely used in the guidance of young
people, it was necessary to show that interests did not
change appreciably over considerable periods of time, and
that there was agreement between interest test scores and
subsequent validity. Consistency of interests will be dis-
cussed under reliability.
Several studies have been made demonstrating good
predictive validity. Strong's classic 18-year follow-up of
633 Stanford University students revealed a high degree of
agreement between interest scores in 1927-30 and occupations
engaged in in 1949. Scores obtained for 663 students on
their "own" eventual occupational scales while they were in
college can be seen in Appendix C. These scores predicted
fairly accurately the occupations the students would be
engaged in eighteen years later. The expectancy ratios were
conservative estimates because they did not take into account
those who entered occupations closely related to the ones on
which they had obtained high scores earlier. ^0
29Edward K. Strong, The Strong Vocational Interest
Blank Manual (Stanford: The~"5"tani:ord university Press.
—
1966), pp. 32-36.
30Edward K. Strong, Jr., Vocational Interests 18 YearsAfter College (Minneapolis, Minnesota: The University or"Minnesota Press, 1955).

31
In two other prediction studies, Berdie reported
scores on the Strong Vocational Interest Blank. Some stu-
dents took the test while they were high school seniors;
others were graduating from medical school, law school,
dental school, journalism school, engineering school, archi-
tectural school, or as accountant majors from a business
school. The results showed that the seven groups differed
considerably in their measured interests while they were in
high school, but not always in the expected direction. **
Schletzer recently retested some of the students from
the Berdie groups after they had settled into their occupa-
tions, an average of eight years after the original high
school testing. The samples drawn were small, and conclusions
must be guarded. The mean for each group on its "own" scale,
both for the test taken during the fall of the high school
senior year and for the retest taken after two or three years
of occupational experience, is reported in Appendix D. The
results indicated moderate to good predictive power for the
high-school-senior Strongs.
^
2
31R. F. Berdie, "Strong Vocational Interest Blank
Scores of High School Seniors and Their Later OccupationalEntry," Journal of Applied Psychology , 44:161-165, 1960; R. P.Berdie, "Strong Vocational Interest Blank Scores of HighSchool Seniors and Their Later Occupational Entry, II,"Journal of Applied Psychology . 49:188-93, 1965.
32Vera M. Schletzer, "A Study of the Predictive Effec-tiveness of the Strong Vocational Interest Blank for JobSatisfaction," Doctor's Thesis, University of Minnesota, 1963.

32
In summary, most studies have shown good predictive
validity for the Strong Vocational Interest Blank.
Split-half reliability . The average split-half or
odd-even reliability coefficient is .88, as stated by Harold
D. Carter, Research Associate, Institute of Child Welfare,
The University of California, in a review of the test for
Buros ' Mental Measurements Yearbook. 33
Test-retest reliability . Test-retest data were re-
ported in Appendix E for several groups over several time
intervals. Means, standard deviations, and test-retest
correlations were reported for all scales for all groups.
The time intervals between the initial testing and the retest-
ing ranged from two weeks to thirty years, with corresponding
median correlation coefficients of reliability ranging from
.91 to .56. It should be reemphasized that the stability of
an individual's scores on the SVIB varied with his age when
first tested: after age 25, most people's interests changed
very little; between ages 20 and 25, some mild changes
appeared, but the usual finding was one of considerable sta-
bility; but between the ages of 15 and 20, there will be some
people whose results showed considerable change. 34
33Oscar K. Buros, The 1940 Mental Measurements Yearbook
(Stanford: The Stanford University Press, 1940), p. 1680T34
Edward K. Strong, The Strong Vocational Interest

33
Norm groups . The normative groups included from
147 to well over 1,000 persons, all of whom had been engaged
in the specific occupation for at least three years and
reported that they enjoyed their work. All of these people
were under 55 years of age. Whenever possible, some minimum
standard of success such as professional certification,
membership in a professional society, or supervisory ratings,
was established and used to eliminate the "marginal" members
of the occupation. A brief description of each occupational
norm group was given in the manual (pp. 56-67), including
the number, mean age, mean education, year tested, references,
and comments about the groups."'5
II. THE KUDER OCCUPATIONAL INTEREST SURVEY, PORM DD
Validity . Because the Kuder Occupational Interest
Survey, Form DD, is a new test (published in 1966), the only
studies found of either reliability or validity were those
studies reported in the manual.
The validity studies reported were concerned with
(1) errors of classification, or the frequency with which
members of an occupational group obtained a higher score on
a scale other than their own, (2) rank scores of core-group
B1*n£
M*"u>1 (Stanford: The Stanford University Press, 1966),pp. 26-29
.
35Ibid .. pp. 56-67.

34
members on their own scale, and (3) frequency of differences
between an individuals score on his own scale and his high-
est score. Job-satisfaction studies based on the OIS were
planned.
1. Errors of Classification - In order to compare a
scoring system involving use of a general reference group
with the new scoring system, responses for six cross-
validation groups of ninety subjects each were scored twice
on scales for their own occupation and the other five, once
using the scoring method of Form D and once using the new
scoring method of Form DD. A t alley was made of the fre-
quency with which an individual obtained a higher score on a
scale other than his own for each possible pairing of the six
scales involved - five comparisons for each of the 540 sub-
jects. On the scales developed with the use of the general
reference group, subjects obtained a higher score in an occu-
pation other than their own in 209 comparisons. When lambda
coefficients were used (the new OIS scoring system), this
number was reduced to 142 - a reduction of 32 per cent. The
incidence of misclassification averaged 6 per cent when ties
were counted as errors. See Appendix F for the comparison of
errors of classification for both methods of scoring. 36
Prederic Kuder, Kuder Occupational Interes t SurveyForm DD, General Manual (Chicago, Illinois: Science ResearchAssociates, Inc., 1966), pp. 29-34.

35
A second errors-of-classification study, designed to
determine the ability of the scales to differentiate between
groups, involved the thirty core groups scored on all thirty
scales. The distribution of highest scores was presented in
Appendix G. It should be noted that where misclassifications
appear to be somewhat more frequent, they usually occurred in
very closely related fields, and perhaps should not be
regarded as errors at all. The percentage of overlap between
the groups was shown in Appendix H. The overlap ranged from
to 29.1 per cent, with a median overlap of 5.12 per cent.
On the basis of the two studies described, it appeared to be
a reasonable assumption that there are some factors that are
common to most jobs, and therefore there is some genuine
overlapping of one criterion by another to begin with. 37
2. Rank of Score on Own Scale - A distribution of the
frequency of ranks, one through six or lower for an individ-
ual's score on his own scale, was obtained for the members of
the thirty-core groups - each scored across thirty scales
(Appendix I). 38
3. Frequency of Differences - The frequency of differ-
ences between an individual's score on his own scale and his
highest score was obtained for 3,000 core-group members. For
37Ibid., p. 24.
38Ibid., p. 34.

36
1,915 cases or 64 per cent of the total group, the score on
a subject's own scale was either his highest score or within
.009 of it; for 71 per cent, within .019 or one standard
error of measurement; and for 90 per cent, within .069.
Appendix J provided a graphic representation of the data
which illustrate the ability of the scales to classify indi-
39viduals correctly.
Test-retest reliability . Two studies were made to
determine the test-retest reliability for scores on the Kuder.
One hundred students (high school seniors and college stu-
dents of both sexes) were tested over a period of two weeks.
The median reliability was .90. For each of the two high
school groups, it was .91; for each of the two college groups,
.90.
In another study, individual test-retest reliabilities
were computed for 92 high school senior boys and 50 college
senior women on 142 scales. For the high school boys, the
median correlation coefficient was .93; for the college women,
it was .96.
Reliability of consistency of the differences between
scores also was computed. The differences between scores in
each possible pair on four scales obtained in two administra-
tions to 92 high school senior boys were correlated.
39Ibid. , pp. 34-37.

37
Correlations ranged from .84 to .92, demonstrating a high
degree of consistency for the scales involved. 40
Norm groups . The normative groups included from 100
to 500 persons. The subjects were between 25 and 65 years
of age, had been in the same occupation for at least 3
years, and met other standards of job satisfaction as used
in developing the scales. Data for the occupational norm
groups were collected between 1955 and 1965, for the most
part between 1960 and 1965. Unless otherwise specified in
the description of the criterion group, samples were selected
from all parts of the country insofar as possible in accord-
ance with the geographical distribution of members of the
occupation. A brief description of each occupational norm
group was given in the manual (pp. 43-49), including the
number, mean age, standard deviation, and breakdown according
to education. 41
40Ibid . t p. 37.
41Ibid . t pp. 43-49.

CHAPTER IV
PROCEDURES, METHODS, AND TECHNIQUES
In comparing the two interest tests which were
described in the preceding chapter, the following discussion
clearly stated and delimited the procedures which were car-
ried out, the methods which were used in carrying out the
procedures, and the techniques which were utilized in the
research.
I . PROCEDURES
The sample . The sample consisted of 100 male freshman
students who were randomly selected from the 1,400 male fresh-
men attending Kansas State University Spring Semester, 1967.
The writer was an instructor in the Physical Education
Department during the time of the study, which greatly facil-
itated the sampling and administration of the tests. Every
male student at Kansas State University was required to take
an activity course in Basic Physical Education each semester
of his freshman year. From the roll list of all Basic
Physical Education Activity Courses, each freshman male was
assigned a number. Then using the simple random sampling
technique, as described by Blalock on pages 393-396 of his
book Social Statistics and the corresponding table of random
units, pages 437-440, a sample of 100 freshman males was

39
drawn. 42 The sample then was a random representation of all
freshman males at Kansas State University Spring Semester,
1967.
Administration of the tests . Using the roll book
again for all Basic Physical Education Activity Courses, the
following information was obtained for each student: the
name of the Physical Education Activity Course, the time that
it met, the meeting place, and the name of the instructor who
taught the course. The writer obtained permission from each
instructor to administer the tests to each randomly selected
subject during class time. The selected students were dis-
missed from the Physical Education Activity classes for that
purpose. Two separate administration periods were required
for each activity class. Most subjects took about forty-five
minutes to complete the Strong Vocational Interest Blank and
about thirty minutes to complete the Kuder Occupational
Interest Survey, Form DD. At the end of the scheduled class
period, the few subjects who had not finished were given the
choice of either staying longer and finishing the test or
finishing it at home and turning it in at the Physical Educa-
tion Office. There were few subjects who did not finish the
Strong Vocational Interest Blank and all subjects finished
42Hubert M. Blalock, Jr., Social Statistics (New York,New York: McGraw-Hill Book Company, I960;, pp. 393-396, 437-440.
40
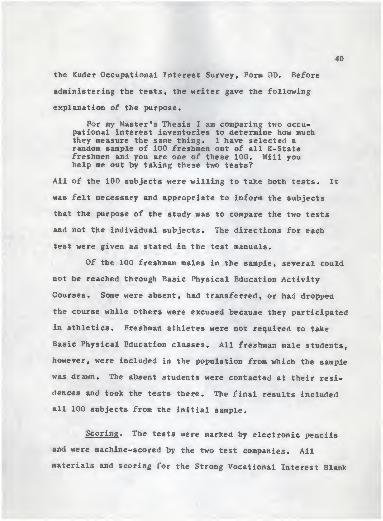
the Kuder Occupational Interest Survey, Form DD. Before
administering the tests, the writer gave the following
explanation of the purpose.
For my Master's Thesis I am comparing two occu-pational interest inventories to determine how muchthey measure the same thing. I have selected arandom sample of 100 freshmen out of all K-Statefreshmen and you are one of these 100. Will youhelp me out by taking these two tests?
All of the 100 subjects were willing to take both tests. It
was felt necessary and appropriate to inform the subjects
that the purpose of the study was to compare the two tests
and not the individual subjects. The directions for each
test were given as stated in the test manuals.
Of the 100 freshman males in the sample, several could
not be reached through Basic Physical Education Activity
Courses. Some were absent, had transferred, or had dropped
the course while others were excused because they participated
in athletics. Freshman athletes were not required to take
Basic Physical Education classes. All freshman male students,
however, were included in the population from which the sample
was drawn. The absent students were contacted at their resi-
dences and took the tests there. The final results included
all 100 subjects from the initial sample.
Scoring . The tests were marked by electronic pencils
and were machine-scored by the two test companies. All
materials and scoring for the Strong Vocational Interest Blank

41
were provided by the Counseling Center, Kansas State
University. Part of the materials and scoring for the Kuder
Occupational Interest Survey, Form DD, were provided by the
Education Department, Kansas State University.
Both test companies returned two copies of the inter-
est profiles for each student. One copy was kept for re-
search and further reference. The other copies of both tests,
along with a letter thanking the students for their coopera-
tion and explaining how they might interpret their scores and
where they could obtain additional help, were sent to each
subject who participated in the study. See Appendix K for a
copy of the letter. Dr. Danskin, head of the Counseling
Center, Kansas State University, also provided two days for
group interpretation for those subjects who were interested.
The policy was followed that whenever students are willing to
give their time and effort in cooperation with a research
project, they should be allowed to see the results and
receive any other information which may be helpful to them.
Comparison of the tests . After the tests had been
returned, they were examined for any irregularities or low
validities as given by the V scale on the Kuder Occupational
Interest Survey, Form DD. Two tests were discovered to be
highly irregular and were not used in the final comparison.
One of them, although having an adequate V score, had such

42
low interest scores (the highest being .13) that it was not
considered to be an appropriate measure of the individual's
interests. The other test had an extremely low validity
score and all of the interest scores were negative. In his
manual, Kuder advised that in cases with such scores the
results could not be considered a valid representation of the
individual's interest.'*^
The data were then regrouped so that each score for
an occupation on the Strong Vocational Interest Blank was
matched with the corresponding score for the comparable
occupation on the Kuder Occupational Interest Survey, Form
DD. The data were punched out on IBM computer cards and the
correlations for each pair of occupations to be compared were
calculated by the IBM 1410 Computer System, Kansas State
University.
The Pearson Product-moment correlation coefficients in
the study were computed by using the following equation: 44
Zxy „ **,JLZNpxy
^H-^h-^J43
G. Frederic Kuder, Kuder Occupational InterestSurvey . Form DD, General Manual (Chicago. IllinoTsl—ScienceResearch Associates, Inc., 1966), pp. 22-25.
William L. Hays, Statistics For Psychologists (NewYork, New York: Holt, Rinehart and Winston, 1963), p. 506.

43
The formula was derived from the standard formula where N was
the sample size (98) and x and y were the variables. The
significance of each correlation coefficient was determined
using a table from Guilford* s bock Fundamental Statistics in
Psychology and Education , designed to shew significance at
the .01 and .05 levels of given correlation coefficients and
given N's.
The Guilford table shows that with an N of 98, a
correlation coefficient would have to be .197 or greater to
be significant at the .05 level and would have to be .257 or
greater to be significant at the .01 level.
II. METHODS
The method used was predominantly descriptive to
determine what was the case with respect to the problem. 46
Data were classified, analyzed, and interpreted in order to
develop meanings that were instrumental in the solution of
the problem. The extent of relationship between the Strong
Vocational Interest Blank and the Kuder Occupational Interest
Survey, Form DD, resulted from the study. Given the data on
J. P. Guilford, Fundamental Statistics in Psychologyand Education (New York, New York: McGraw-Hill Book Company,1965), pp. 580-581.
46G. D. McGrath, James J. Jelinek, and Raymond E.
Wochner, Educational Research Methods (New York, New York:The Ronald Press Company, 1963) , pp. 65-69.

44
hand, the question answered was how much the two tests
Measured the same factors on specific occupational scales.
The valuational method (used to determine what should be the
case with respect to the problem) was utilized only in making
evaluational comments and recommendations in the chapter on
Summary and Conclusions. The study, then, was descriptive in
nature, with a few valuational comments at the end.
III. TECHNIQUES
The technique used in the study was analytical in that
the variables themselves were not manipulated to effect a
change and no control groups were utilized. 47 The purpose of
the study was to examine existing relationships between sets
of paired variables; that is, the sets of students' interest
scores for a given occupation on each test: the Strong
Vocational Interest Blank and the Kuder Occupational Interest
Survey, Form DD. The study was not predictive; no attempts
were made to use either test in predicting scores on the
other test. Yet the study was more than a mere description
of past or current events in that tests were given, variables
compared, comparisons analyzed, and inferences made.
Analysis was the major technique utilized in the research.
47Ibid. , pp. 69-89.

CHAPTER V
RESULTS
Student scores on the two tests: the Strong Vocation-
al Interest Blank and the Kuder Occupational Interest Survey,
Form DD, were compared on a total of seventy-six paired
scales. Of these seventy-six paired scales, twenty-seven
were named the same on both tests. Only scales which were
assumed to be measuring the same factors were compared.
The highest positive correlations were: SVIB -
Carpenter and Kuder - Carpenter, .672; SVIB - Parmer and
Kuder - Farmer, .577; SVIB - Engineer and Kuder - Electrical
Engineer, .527; SVIB - Psychiatrist and Kuder - Psychiatrist,
.515; and SVIB - Psychiatrist and Kuder - Clinical Psycholo-
gist, .507. The lowest correlations (and highest negative
correlations) were: SVIB - School Superintendent and Kuder -
School Superintendent, -.143; SVIB - Rehabilitation Counselor
and Kuder - Physical Therapist, -.138; SVIB - Personnel
Director and Kuder - Psychology Professor, -.092; SVIB -
Accountant and Kuder - Mathematician, -.060; SVIB - Mathemati-
cian and Kuder - Heating and Air Conditioning Engineer, -.036;
SVIB - Mathematician and Kuder - Industrial Engineer, -.023;
SVIB - Personnel Director and Kuder - Clinical Psychologist,
-.014; and SVIB - Life Insurance Salesman and Kuder - Insur-
ance Agent, 0.00.

46
Of the twenty-seven same-named scales, the highest
correlation was on Carpenter .672, followed by Farmer .577
and by Psychiatrist .515. The lowest correlation of the
twenty-seven same-named scales was on School Superintendent
-.143, followed by Journalist .142 and by Y.M.C.A. Secretary
.157. Pisher*s"Z transformations were used in averaging all
correlation coefficients of the twenty-seven same-named
scales. ° The mean correlation coefficient was .317 for
these scales. The mean correlation coefficient was increased
to .354 when correlation coefficients for the following
scales were included in the averaging: the SVIB Engineer
scale and the Kuder - Civil Engineer, Electrical Engineer,
Heating and Air Conditioning Engineer, Industrial Engineer,
Mechanical Engineer, Mining and Metal Engineer; between SVIB -
Psychologist and Kuder - Clinical Psychologist, Counseling
Psychologist, Industrial Psychologist; and between SVIB -
Social Worker and Kuder - Social Case Worker, Social Worker
Group, and Social Worker Psychiatric. The correlation coef-
ficients between the twenty-seven same-named scales are
listed in Table IV.
The correlation coefficients between the remaining
non-same-named scales (49) are listed in Table V. Fisher's
*hi. C. Fryer, Concepts and Methods of ExperimentalStatistics (Boston, Massachusetts: Allyn and Bacon, Inc.,1966), p. 227; E. S. Pearson and H. 0. Hartley, BiametrikaTables for Statisticians . Volume 1, Table 14.

47
TABLE IV
CORRELATION COEFFICIENTS BETWEEN TWENTY-SEVEN SAME-NAMEDSCALES ON THE STRONG VOCATIONAL INTEREST BLANK AND
THE KUDER OCCUPATIONAL INTEREST SURVEY,FORM DD (N 98)
Same-named scales r coefficient
1. Accountant .289**2. Architect .251**3. Banker .241*4. Purchasing Agent (Kuder - Buyer) .393**5. Carpenter .672**6. Chemist . 470**7. Dentist .289**8. Farmer .577**9. Forest Service Man (Kuder - Forester) .471**
10. Journalist .14211. Lawyer .215*12. Librarian .279**13. Mathematician .304**14. Math Science Teacher (Kuder - Math
Teacher, H.S.) .287**15. Minister .238*16. Osteopath .312**17. Personnel Director .15418. Pharmacist .226*19. Physician .385**20. Policeman .426**21. Printer .339**22. Psychiatrist .515**23. Real Estate Salesman .15824. Math Science Teacher (Kuder - Science
Teacher, H.S.) .292**25. School Superintendent -.14326. Veterinarian .374**27. Y.M.C.A. Secretary .157
Significant at the .05 level of confidence.**Significant at the .01 level of confidence.

48
TABLE V
CORRELATION COEFFICIENTS BETWEEN FORTY-NINE SIMILARNON-SAME-NAMED SCALES ON THE STRONG VOCATIONAL
INTEREST BLANK AND THE KUDER OCCUPATIONALINTEREST SURVEY, FORM DD (N - 98)
Strong scale
1. Senior CPA2. Artist3. Accountant4. Biologist5. Personnel Director6. Psychologist7. Psychiatrist8. Rehabilitation Counselor9. Y.M.C.A. Secretary
10. Engineer11. Mathematician12. Engineer13. Mathematician14. Engineer
15. Mathematician16. Engineer17. Mathematician18. Engineer19. Mathematician20. Engineer
21. Mathematician22. Life Insurance Salesman23. Accountant24. Computer Programmer25. Engineer26. Math Science Teacher27. Physician28. Rehabilitation Counselor29. Physician30. Psychologist31. Personnel Director32. Psychologist33. Psychiatrist34. Personnel Director
35. Psychologist
r coef-Kuder scale ficient
Accountant, Cert. P. .267**Architect .135Bookkeeper .218*Chemist .462**Counselor, H.S. .055
»t Tl .019»l tl .213*rt tt .135ft tt .115
Engineer, Civil .478**M tt .069
Engineer, Electrical .527**»» tt .107
Engineer, HeatingAir Conditioning .483**
tt tt -.036Engineer, Industrial .397**
»t n -.023Engineer, Mechanical .498**
»» tt .088Engineer, Mining
and Metal .476**tt tt
.130Insurance Agent 0.0Mathematician -.060
tt .395**tt .396**tt
.151Pediatrician .426**Physical Therapist -.138Podiatrist .245*Psychiatrist .322**Psychologist ,Clinical -.014
tt tt .323**tt tt .507**
Psychologist, Coun-seling .048
tt tt .234*

49
TABLE V (concl.)
r coef-Strong sc ale Kuder scale ficient
36. Psychiatrist Psychologist, Coun-seling .423**
37. Rehabilitation Counselor tt M .226*38. Psychologist Psychologist, Indus-
trial .11439. Psychiatrist n tt .292**40. Personnel Director Psychology Professor -.09241. Psychologist ft tt .289**42. Psychiatrist tt tt .413**43. Social Worker Social Case Worker .299**44. »t if Social Worker Group .342**45. Psychologist Social Worker, Psychi-
atric .222*46. Psychiatrist tt tt .453**47. Social Worker tt m .332**48. Mathematician Statistician .16049. Minister University Pastor .297**
*•Significant at the .05 level of confidence.
Significant at the .01 level of confidence.

50
z transformations were also used in averaging all seventy-six
correlation coefficients.^ The mean correlation coefficient
was .262 for all seventy-six scales.
As was mentioned earlier, a similar study was made by
King, Norrell, and Powers, comparing the Strong Vocational
Interest Blank with the Kuder Preference Record - Occupa-
tional, Form D.50 They also computed correlation coefficients
for identical twin tests (same-named scales), as shown in
Table I. In light of Kuder' s claims that the new concept in
scoring used by Form DD resulted in better discrimination
between occupational groups than the traditional approach
used by Form D and Strong, the results of the study comparing
Form D scales with the Strong were compared to the similar
scale correlations in this study. Table VI shows the corre-
lations between like-named scales on the Strong and Forms DD
and D of the Kuder. Five correlations were found to be
higher when the Strong was compared with Form DD than when
compared with Form D; lower correlations were found on nine
same-named scales. The mean correlation between the fourteen
same-named scales on the Strong and Form D was reported at
.370, using Fisher's z transformations. 51 The mean
49Ibid.
50Supra , Chapter II, p. 15.
51Fryer, Pearson, and Hartley, loc. cit .

51
TABLE VI
CORRELATION COEFFICIENTS BETWEEN SAME-NAMED SCALES ONTHE STRONG VOCATIONAL INTEREST BLANK AND THE KUDER
OCCUPATIONAL INTEREST SURVEY, FORM DD, AND THEKUDER PREFERENCE RECORD - OCCUPATIONAL,
FORM D
r coefficient r coefficientSane-named scales Strong with DD Strong with Da
1. Farmer .577** .471**2. Forester .471** .449**3. Minister .238* .518**4. Physician .385** .411**5. Y.M.C.A. Secretary .157 .436**6. School Superintendent -.143 .422**7. Accountant .289** .295**8. Journalist .142 .330**9. Architect .251** .341**
10. Lawyer .215* .352**11. Dentist .289** .318**12. Veterinarian .279** .221**13. Chemist .470** .386**14. Pharmacist .226* .087
**
From a study by King, Norrell, and Powers.
Significant at the .05 level of confidence.
Significant at the .01 level of confidence.

52
correlation between the same fourteen same-named scales on
the Strong and Form DD was .290. Thus, there was generally
lower correlation between same-named scales on the Strong and
Form DD than there was on the Strong and Form D. This result
was expected, however, because Form D and the Strong both
make use of men-in-general groups in their scoring procedure
while Form DD abolished the concept of the men -in-general
group, and used an entirely different scoring technique.
At any rate, the highest correlation coefficient
obtained on either study was .672 on this study between
SYIB - Carpenter and Kuder - Carpenter. For purposes of
prediction, a correlation coefficient of .672 would account
for only about 45 per cent of the variance, and most of the
correlation coefficients were well below .50 which would
account for less than 25 per cent of the variance. Correla-
tions from .35 to .50 are of little predictive value for
individuals and although one would not be interested in pre-
dicting one test score from the other, it is readily apparent
that these two tests are not measuring the same factors.

CHAPTER VI
SUMMARY, CONCLUSIONS, AND RECOMMENDATIONS
The following discussion consisted of a summary of
the study, conclusions drawn from the results of the study,
and the writer's recommendations for future use of the two
interest tests.
I . SUMMARY
The purpose of this study was to compare similar
scales on the Strong Vocational Interest Blank and the Kuder
Occupational Interest Survey, Form DD, to determine to what
extent they actually measure the same factors.
The information resulting from the comparison would
be useful to counselors in deciding which interest test to
use in the counseling situation. The results would also
point out inconsistencies and contradictions in the use of
both interest tests with the same client.
The sample consisted of 100 male freshman students who
were randomly selected from the 1,400 male freshmen attending
Kansas State University Spring Semester, 1967.
The data were reported in the form of Pearson product
moment correlation coefficients between the student's inter-
est scores on the two tests for seventy-six different occupa-
tions. Each pair of occupations compared was assumed to be
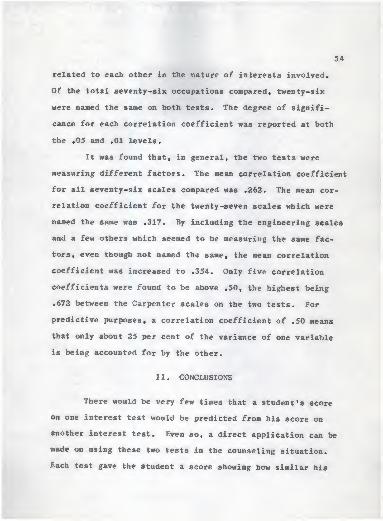
54
related to each other in the nature of interests involved.
Of the total seventy-six occupations compared, twenty-six
were named the same on both tests. The degree of signifi-
cance for each correlation coefficient was reported at both
the .05 and .01 levels.
It was found that, in general, the two tests were
measuring different factors. The mean correlation coefficient
for all seventy-six scales compared was .262. The mean cor-
relation coefficient for the twenty-seven scales which were
named the same was .317. By including the engineering scales
and a few others which seemed to be measuring the same fac-
tors, even though not named the same, the mean correlation
coefficient was increased to .354. Only five correlation
coefficients were found to be above .50, the highest being
.672 between the Carpenter scales on the two tests. Por
predictive purposes, a correlation coefficient of .50 means
that only about 25 per cent of the variance of one variable
is being accounted for by the other.
II. CONCLUSIONS
There would be very few times that a student's score
on one interest test would be predicted from his score on
another interest test. Even so, a direct application can be
made on using these two tests in the counseling situation.
Each test gave the student a score showing how similar his
55
interests were to those of men in each of many occupations.
For example, both tests gave the student a score showing how
similar his interests were to those of School Superintend-
ents. Yet f the results of this study showed that these two
different scales for School Superintendent correlated -.143.
That means that the two test scores will not guide the stu-
dent toward the same area, but will actually present to the
student contradictory and inconsistent leads.
The perceptive counselor will have to go much deeper
into these two tests than just looking at their scores. He
needs to know what both Kuder and Strong mean when they
compare a student's interest to that of a School Superintend-
ent. What groups of School Superintendents did each test
maker use as his criterion? Just looking into the brief
description of the normative groups, as stated in the two
test manuals, may help somewhat. Strong indicated his School
Superintendents were from cities of 10,000 population or
over, in all parts of the United States, of mean age 46, and
of mean education 46.9. Kuder' s School Superintendents were
from towns of 5,000 or more, of mean age 52.4, and all
college graduates. Would six years average age account for
such a great difference between the two scales? At any rate,
it is quite obvious that much more information is needed
about these two norm groups before the difference can be
accounted for in the correlation.

56
Perhaps the correlation coefficient was wrong. There
is always that chance, and more research in the area would
certainly be helpful.
In using these tests over many years, the perceptive
counselor will begin to draw out much more information than
just the scores. How does this student's low score, compared
to those of School Superintendents, fit into his entire
profile? How does his entire profile on one interest test
compare to his entire profile on the other? Many questions
need to be answered by and for the counselor before he can
skillfully make use of both of these interest tests.
III. RECOMMENDATIONS
There are advantages and disadvantages in using either
one of these two interest tests. The Strong Vocational
Interest Blank has been supported by much predictive validity
data and has several studies showing good long-term reli-
ability (.67 to .90). Kuder has not as yet published any
predictive validity data, and his test-retest reliability
studies were over a two-week period. The Kuder Occupational
Interest Survey, Form DD, compares students* interest scores
to norms which were developed between 1955 and 1965—for the
most part, between 1960 and 1965- Several of Strong's norm
groups were developed as long ago as 1934.

57
Until many questions are answered more clearly and
more directly, the writer can only recommend that a counselor
who wishes to use both of these tests should study them very
carefully, attempting to determine why their scales are
measuring different factors and what factors each scale is
measuring. A counselor who wishes to choose between the two
tests for a counseling situation would be well advised to
stay with the Strong Vocational Interest Blank until the
Kuder Occupational Interest Survey, Form DD, has more predic-
tive validity data and long-term reliability data to back it
up.

BIBLIOGRAPHY

BIBLIOGRAPHY
Barnes, Fred P. Research for the Practitioner in Education .
Washington, D.C., Maryland: Department of ElementarySchool Principals, National Education Association, 1964.
Berdie, R. F. "Strong Vocational Interest Blank Scores ofHigh School Seniors and Their Later Occupational Entry,"Journal of Applied Psychology t 44:161-165, 1960.
"Strong Vocational Interest Blank Scores of HighSchool Seniors and Their Later Occupational Entry, II,"Journal of Applied Psychology , 49:188-93, 1965.
"Scores on the Strong Vocational Interest Blankand the Kuder Preference Record in Relation to SelfRatings," Journal of Applied Psychology, 34:42-9.February, 1950":
""
Blalock, Hubert M., Jr. Social Statistics . New York:McGraw-Hill Book Company, 1960.
Buros, Oscar K. The 1940 Mental Measurements Yearbook .
Stanford: The Stanford University Press, 1940.
• The Sixth Mental Measurements Yearbook . HighlandPark, New Jersey*: The Gryphen Press, 1965.
Fryer, H. C. Concepts and Methods of Experimental StatisticsBoston, Massachusetts: Allyn and Bacon, Inc., 1966.
Garrett, Gene Aubrey. "A Comparison of the Predictive Powerof the Kuder Preference Record and the Strong VocationalInterest Blank in a Counseling Setting," Doctor's Thesis.1961 (DA 19:2538).
Gordon, Hans C, and Walter W. Herkness, Jr. "PupilsAppraise Vocational Interest Blanks," Occupations, 20:100-2, November, 1941.
"
Guilford, J. P. Fundamental Statistics in Psychology andEducation . New York: McGraw-Hill Book Company, 1965.
Hays, William L. Statistics for Psychologists . New York:Holt, Rinehart and Winston, 1963.

60
Joseph, Michael P. "The Strong Vocational Interest Blankand the Kuder Preference Record - Occupational, Form D:"A Comparative Study of Eight Same-Named Scales,"Yearbook of the National Council of Measurement inEducation , 18:145-54, 1961.
Kansas State University, Kansas State University Bulletin(Manhattan, Kansas: Kansas State University, October,1966).
King, Paul, Gwendolyn Norrell, and G. Pat Powers."Relationships Between Twin Scales on the SVIB and theKuder," Journal of Counseling Psychology, 10:395-401,Winter, IttT.
""
Kuder, G. Frederic. Kuder Preference Record - Occupational ,
Form D, Manual . Chicago, Illinois! Science ResearchAssociates, Inc., 1956.
Administrator's Manual, Kuder Preference Record -
Vocational , Form C. Chicago, Illinois! Science ResearchAssociates, Inc., 1960.
Kuder Occupational Interest Survey , Form DP , GeneralManual . Chicago, Illinois: Science Research Associates,Inc., 1966.
Lennon, Roger T. "A Glossary of 100 Measurement Terms,"Test Service Notebook , No. 13, p. 2.
Longstaff, Howard P. "Fakability of the Strong InterestBlank and the Kuder Preference Record," Journal ofApplied Psychology . 32:360-9, August, 1948.
Malcolm, David Donald. "Which Interest Inventory Should IUse?" Journal of Educational Research, 44:91-8, October.1950.
McGrath, G. D., James J. Jelinek, and Raymond E. Wochner.Educational Research Methods . New York: The RonaldPress Company, 1963.
Namani, Abdel-Kader, "Factors Associated with High and LowCorrelations Between Individuals* Scores on Two InterestInventories," Doctor's Thesis, Cornell University, 1958(DA 19:2538).
Patterson, D. G. "Vocational Interest Inventories inSelection," Occupations . 25:152-53, December, 1946.

61
Pearson, E. S., and H. 0. Hartley. Biometrika Tables forStatisticians , Volume 1, Table 14.
Peters, Edwin P. "Vocational Interests as Measured by theStrong and Kuder Inventories," School and Society ,
55:453-5, April 18, 1942.
Roeber, Edward C. "A Comparison of Seven Interest Inven-tories with Respect to Word Usage," Journal of Educa-
tional Research , 42:8-17, September, 1948.
, and Buford Stefflre. 'The Reading Difficulty ofInterest Inventories," Occupations , 26:95-6, November,1947.
Schletzer, Vera M. "A Study of the Predictive Effectivenessof the Strong Vocational Interest Blank for Job Satis-faction," Doctor's Thesis, University of Minnesota, 1963.
Stefflre, Bufford. "The Reading Difficulty of InterestInventories," Occupations , 26:95-6, November, 1947.
Strong, Edward K. Vocational Interests 18 Years AfterCollege . Minneapolis, Minnesota: The University ofMinnesota Press, 1955.
The Strong Vocational Interest Blank Manual . TheStanford University Press, 1966.
Triggs, Francis Oralind. "A Further Comparison of InterestMeasurement by the Kuder Preference Record and the StrongVocational Interest Blank for Men," Journal of Educa-tional Research , 37:538-44, March, 1944.
Wittenburn, J. R., Oralind Triggs, and Daniel D. Feder."A Comparison of the Interest Measurement by the KuderPreference Record and the Strong Vocational InterestBlanks for Men and Women," Educational and PsychologicalMeasurement . 3:239-57, August, 1943.

APPENDIX A
CORRELATIONS BETWEEN KUDER PREFERENCE RECORD SCALESAND STRONG VOCATIONAL INTEREST BLANK KEYS.
PROM A STUDY BY TRIGGS

Table I
Correlations Between Ruder Preference Record Scales and StrongVocational Interest Blank Keys Which Comprise the
gteative-scentific occupational area
(X = 166 Men)
63
Strong VocationalInterest Blank Keys
Artist
Psychologist..ArchitectPhysicianDentist
Kuder rrGfornr.ee Record Scalojj
Me-!
ICompu- Srien- Per- Artis- Liter- Mus- : SocialI
Clcri-
chan-l
tation- tifiC sua- tic ary ical i Ser- 1 cat
ical al sivej
v;cc
-
.
.07 —. 36* . 56* . 10 O !•| G
-1
t23*
.005 I— 1 2 . r.o* 1— , 41* . lR . 17 .14t
-07 '—. 30*
.-"> v 22» no. —
. 44* . 67* —.0-1 . 18 -.21*j—.28*
. 1
1
.— . 10 . 50* 1— . r>5* .32* —.07 .07 . 05 '— . 36*
. 37* ,— . o-i . 45 |-.49* .45* —.18 —.01 .07 —-31"
(For an N of 166, according to Linc;ui*t's TnUr, n correlation must at least have the value of .208 to
be significant a I the one percent level. Asterisk indicates significance).
Table III
Correlations Between Kuder Preference Record Scales and StrongVocational Interest Blank Keys Which Comprise the
Sub-Professional Occupations
(X = 166 Men)
Strong VocationalInterest Blank Keys
Production Manager.
Kuder I'refcrenco Record Scales
Me-chan-ical
Compu- Scion- ( lVr-j
A/t.ia-
talion-|
tide | sua- ticaia-aive
Liter-IMk-
;Social ' Cleri-
ary]
icaiI
Scr- cal
! vice !
.1 .36* .07 .03 —. 2C* —.16
i-arrr.or 64* ,— .11 ! .35*Carpenter I
.67* —. 02i
.26*Printer
i . 53* J—. 12 I—. 03Mathematics—physical
Sc. Teacher:
.-17* .09 I .40"Policeman
j.53* ;—.02 I .23*
Forest Service Man .59* i— . 18 !
.27*—.20—. 24*
26*— 03—. 16
.17 '—.50* —.16. 28* —. 45* —. 12.23* —.22* —.04
.01 !— . 27* j—. 12—.08 —.31* —.26*
. 14 i—. 36* — . 30*
-. 001
—.07 —.31*. OS . 13
—.14
— . 05.06.06
—.18
. 19
.09
I
Table II
Correlations Between Kuder Preference Record Scales and StrongVocational Interest Blank Keys Which Comprise the
Scientific Occupational Area
(X = 166 Men)
Strong Vocal im.nlIntercut Blank Keys
-
Kudor Preference Record Scales
chnn-ical
Compu- Scien-tation- 1 ti;'ic
al
Per- Artis- Liter- : Mum- i Social . Cleri-sua-
i
tic u-y 1 ical j Ser- calsivo 1 vice ;
' : ' i
MathematicianEngineer _
Chemist _
.14 —. 14S
. 4T».14
i.54*
. 08|
. 73*
—.49*—.31*—.52*
.14 —.02 1 .06
. 26* '—. 2.1" — . 24*
.20 j—. 21* 1—. 09
—. 03 ;— . 07—.19 —.20—. 12 —. 34*

Taiii.e IV
Correlations Between Kudek r.,n-. „,....... .,...;- Scales and StrongVocational Interest Blank Keys Which Comprise tub
Social Service Area
(N = 166 Men)
Strong VocationalInterest Blank Keys
YMCA PhysicalDirector
".'. : .. ;.;,'! Malinger.V MCA Secretary. ..
Social S.-.> :•..-. HighSchool Teacher...
City School Super*.intendent..
Minister
Mo- Compu- Scionchiin-
jlation-
]tide
leal al
Kudor Preference llecord Seal
TIVr- Artis-KUa-
j lie
Musician
.01— . OS
-. 11
-.OX
-. cs
. 1H—. 11—
. 1
G
—.OK
. 30*
.of,—. 10
—.30*
—. 10
.02
. nr,
-. on.07
-.20
-. 11
Liter* Mua-ical
Social,Clcri-
Ser- eal
—.07 —.01. 2/.* .03.14 . 03
.18 j .07
.20
. 17
.07
-. 02. 0.S
. '.:-• —.2.':*
.?:..• — . 03
.86* —.01
. 30'
. 42*
.07
.07
.19
-.13
64
Tadi.i; VCorrelations Between Kvjobr Prb?bkencb Record Scales and Strong
Vocational Interest Blank Keys Which Comprise theBusiness Detail Area
- (N = 166 Men)
Strong Vocr. i.ionr.1
.
Cudor Preference Record Scales
Ia:orcat Blank Koys Me-chan-icr.l
jCorr.;>u-| Scien-
j
tation-\
t.lic
Par-HUii-
sivo
Artis-tic
Liter-ary
Mus-ical
SocialSer-vice-
Cleri-cal
' .. ......Cart.sica * ub.;cA«,uounS — . 40* .40* —.13 .12 — . 13 .05* .23* —.00 .20*
AccountantOlficn Manager. '.'.
Purchasing AgentBaakor
—. 09
'. lb—.30'
. 20*—
. :i—
. is—. 10—. 40'
.20*. 2S*ill!
.40*
;j2*
—!il7*
. 10. 03—. IS.03
. 07
.00—.17,0C !io
'.is*
. 44*
.02*
TAi>LE VI
Correlations Between Kuder Preference Record Scales and StrongVocational Interest Blank Keys Which Comprise the
Business Contact aaea
(S — 166 Men)
Kuder Preference Record Scales
Interest Bla.aU iCeys Mo-chun-icul
Compu-tation-
al
Scien-tillc uua-
aivo
Artis-tic
Liter-ary
Mus-ical
SocialSer-vice
Cleri-cal
Sii'.CN NfnnngarHi ... hlstaui Salesman..Lifu Inaurancii
* - i - - -.
—. 00*
. 02—.07
—. IS
— . :i.s*
— . S2*
—.60*
72*. 01*
. OS*
—. 30*—. 13
—. ia
. 17
.01)
.23*
—. 02.07
. 11
. 14
. 14
.23*
. 21*!-S*
.IS
Taule VII
Correlations Between Kuder Preference Record Scales and StrongVocational Interest Blank Keys Which Comprise the
Linguistic Occupational Area(X = 166 Men)
Kuder Preference Record Scales
! Me-I chan-|
ical
Interest Blank Keys iCornpu-I talion-
al
So,:.-line sua*
faiVO
Artis-tic
Liter-ary
Mus-ical
|SocialSer-vica
jCleri-
I cal
Advertising Man...Iriiwyor.Aui hor-Journalist .
—.31*— ISi—. 10 -ill: —.12
—'. 01.10
. 61*
:£*
. 38*
. 13
1 . 08. l :.
,— . 02. 03
President, M anufuctur-injf Concern .. 00 —.01) —.03 .02 — . 00 —.01 .22*

APPENDIX B
VALIDITY CHARACTERISTICS OF MEN'S SVIB SCALES.FROM THE STRONG VOCATIONAL INTEREST BLANK
MANUAL, PAGE 35

66
TAI1LE 9
Validity Characteristics of Men's SVIB Scales(Scores for criterion croups arc raw scores; scores for mcn-in-Kmcrnl group nre ttnndnrri \rnrrs. )
Criterion G roup Mrn-in-General Nunil.fr of
Ifrnn
Scored
Mm. Or CentDinVrrnrc
Sc orrclOccupational and Nonoccupational Scales N Menu S.O. Mean S.l). Overlap
Dentist 235 24.8 13.6 31.5 11.3 38 72 15Osteopath 581 13.8 8.4 27.9 11.0 29 46 14
Veterinarian 310 28.0 13.9 26.9 11.0 29 74 17Physician 532 10.7 8.5 26.5 13.2 31 46 14
Psychiatrist 101 23.5 9.8 21.0 12.5 20 52 17Psychologist 1045 26.7 13.0 . 22.2 12.4 21 70 17
Biologist 342 30.4 12.7 23.6 13.4 26 64 17
Architect 238 40.1 18.7 29.7 12.2 36 96 17Mathematk'.ian 181 46.4 19.7 23.2 12.5 24 97 20
Physicist l«7 47.9 18.8 20.7 14.4 23 93 21Chemist 21)2 20.2 II. 1 26.0 15.4 36 5!) 1(1
Engineer 51
1
212
31.0
13.3
i-l.r,
9.0
3 1 .9
35.9
14.2 45 75 17
14PRODUCTION Manager 11.2 51 44
Aiimv Officer 403 29.2 10.9 20.4 12.7 19 65 17Am Force Officer 198 37.8 17.6 24.3 10.9 22 89 17
Carpenter 179 36.2 15.4 24.5 13.3 27 90 17Forest Service Man 406 29.2 9.5 23.4 14.4 26 64 16
Farmer 240 23.8 15.2 36.1 10.7 50 65 15Math-Science Teaciieii 288 16.9 10.1 27.6 12.0 31 53 15
Printer 269 18.3 11.7 31.6 10.1 36 60 15Policeman 251 26.8 12.0 23.8 10.6 20 71 17
Personnel Director 147 15.4 8.2 29.3 13.1 37 44 14Puhlic Administrator 534 13.7 8.2 33.6 12.0 45 35 14
Rehahilitation Counselor 272 21.6 12.8 25.0 10.1 21 51 17YMCA Secretary 184 32.6 14.9 16.6 13.1 15 91 17
Social Worker 400 29.0 13.1 21.1 13.4 22 68 17Social Science Teacher 217 20.7 11.8 28.7 12.4 34 55 16School Superintendent 189 24.0 10.7 25.1 12.9 28 62 ' 15
Minister 249 35.3 12.2 16.3 15.5 19 74 17
Librarian 425 30.2 15.2 25.0 11.6 25 75 17Artist 218 41.9 25.1 27.7 10.2 27 95 22
Musician Performer 441 11.8 11.1 28.6 10.2 29 54 17Music Teacher 490 20.2 10.9 22.6 11.6 20 57 17
CPA Owner 353 18.1 9.4 29.6 11.3 34 51 15
Senior CPA 611 19.9 8.0 26.5 13.4 32 51 14Accountant 343 14.0 7.7 30.8 13.5 42 42 14
Office Worker 316 14.5 10.0 33.2 12.6 46 53 15Purchasing Agent 217 15.8 12.5 36.0 11.6 52 59 15
Banker 238 22.0 13.3 32.2 10.6 39 67 17Pharmacist 292 14.7 11.2 29.7 10.0 31 61 14Mortician 354 18.3 14.8 32.9 10.2 40 68 16
Sales Manager 228 18.2 12.1 32.5 12.4 43 56 16Real Estate Salesman 241 15.9 16.3 37.1 10.2 52 56 17
Life Insurance Salesman 310 22.0
24.2
15.7 31.6 12.1 41 68 17
Advertising Man 167 18.4 32.2 11.3 40 79 17Lawyer 249 24.2 15.6 34.3 10.4 44 63 17
Author-Journalist 242 36.2 30.0 31.8 9.9 36 98 21
President, Mfg. Concern 165 15.6 9.4 34.5 12.1 48 47 15
Credit Manager 452 27.1 14.9 28.7 13.1 36 69 17Chamrer of Commerce Exec. 399 29.6 20.2 29.0 11.0 32 86 17
•, Physical Therapist 348 21.7 11.2 24.6 12.4 25 52 16Computer Programmer 503 24.0 8.1 24.2 13.0 32 66 15
Business Education Teacher 322 18.7 13.4 27.6 11.7 30 57 17Community Recreation Admin. 350 40.1 15.6 18.4 13.4 18 93 17
Specialization Level 36.9 10.6 33 10
15Occupational Level 59.6 8.6 70
Masculinity-Femininity 47.4 9.6 99 16
14Academic Achievement 44.5 11.0 55
Occ. Introversion-Extroversion 48.8 11.8 81 20

APPENDIX C
PREDICTIVE VALIDITY OP SVIB SCALES OVER 18 YEARS.PROM THE STRONG VOCATIONAL INTEREST BLANK
MANUAL, PAGE 44

68
fREJIQTIVE VALIDITY OF SVI5 SCALES CVER 16 YEARS
( 1 93£ Scales; N = 663 Students)
ScoreL- on Letter Chances in IOCAny ^ciile Ratings cf Employment in
That Occupation*
55 ^o 70 A-r £S
A3 tc 5
^
A- 74
AC to A4 B+ S'd
35 tc 39 E 49
3C tc 3A B- 36
Eelow 30 C 17
* Assur.es all occupations are equally represented inpopulation.

APPENDIX D
MEAN SCORES OP SIX OCCUPATIONAL GROUPS ON THEIR "OWN"SCALE AND ON THEIR FIVE OTHER HIGHEST SCORE SCALESON HIGH SCHOOL SENIOR AND ADULT SVIB's. PROM
THE STRONG VOCATIONAL INTEREST BLANKMANUAL, PAGE 45

Mean Scores ok Six 0< cupational Croups on Their "0 ivn"70
Scale and on Their Five niER Highest-Score Scales onHigh School Senior and Adult SVIBs
Test \ \\\y\\ School Senior) Mean Hrtni (Adult) Mr.-in
Occupational Sonic Score Occupational Scale Score
Accountan s ( X = 2-1
)
Accountant 36 Accountant 38
On \c.v. Man 14 Senior CPA •17
Heal Instate Salesman 41 CPA 42Senior CPA 10 Office Man 39Purchasing Agent 3!) Public Administrator 38Printer 37 Heal K.stai e Salesman 37
Dentists (N = 30)
Dentist 39 Dentist 42
FAHMED /•) Physician 47Math-Science Teacher 40 Osteopath 45PHARMACIST •10 Farmer 37PlliNTI-.il 38 Chemist 37VETERINARIAN 38 Biologist 36
Doctors (X = 27)
PHYSICIAN 13 Physician 54
Osteopath 39 Biolocist 44Math-Science Teacher 38 Psychiatrist 43Pharmacist 37 Osteopath 42Dentist 37 Chemist 40Farmer 36 Psychologist 39
Journalists ( and Advertising ) ( X = 21
)
Author-Journalist 32 Author-Journalist 36
Heal Estate Salesman 39 Advertising Man 43PRINTER 3S Social Worker 42Advertising Man 37 Reiiabil. Counselor 40Sales Manager 33 Real Estate Salesman 39Musician So Music Teacher 39
Lawyers (X = 32)
Latter 36 Lawyer 43
Real Estate Salesman •13 Public Administrator 42Sales Manager 42 Personnel Director 39Office Man 39 Real Estate Salesman 39Life Ins. Salesman 39 Reiiabil. Counselor 39Social Science Teacher 38 Social Worker 39
Mecha nical Engineers ( X = 38
)
Engineer 39 Engineer 38
Math-Science Teaci IEH •1-1 Air Force OfficerAir Force Officer •13 Army Officer 42Farmer •13 Production Manaceb 40Printer 40 Chemist 40Chemist 40 Math-Science Teacher 37
\
•
•
•

APPENDIX E
TEST-RETEST MEANS, STANDARD DEVIATIONS, AND CORRELATIONSPOR SEVERAL GROUPS OVER SEVERAL TIME INTERVALS.
FROM THE STRONG VOCATIONAL INTEREST BLANKMANUAL, PAGES 27-33

72
VfTfUNall* lb ae\.1
: :-
if34..>,•;<
.sib*
1
4 it
4/0
.'. !
" ...
.,-, ^T3j5c;5 k> 11 ?c *r#£J: h•"'•••'"•
j' i-*S#"
F/G. 23
Test-rctest means, standard deviations, and correlations over2 weeks, for 139 University of Minnesota sophomores
(Left-h;tnd column entries and solid line are test data;right-hand column entries and broken line are retest data.)
(Median test-retest correlation .91.)
FIG. 14
Test-retest means, standard deviations, and correlations over30 days, for 102 young adults
( Left-hand column entries and solid line are test data;right-hand column entries and broken line are retest data.
)
(Median test-retest correlation .91.)

73
Art•*m
JU>.out
sgPEP I'-H--1 M t M t I t ' t"
Ajgg-.lfiaf^pn
FIG. 15
Test-retest means, standard deviations, and correlations over
3 years, for 189 Harvard University freshmen
{Left-hand column entries and solid line are test data;
right-hand column entries and broken line are retest data.)
(Median test-retest correlation .68.)
FIG. 16
Test-retest means, standard deviations, and correlations over
8 years, for 171 high school seniors
( Left-hand column entries and solid line are test data;
right-hand column entries and broken line are retest date.)
(Median test-retest correlation .61.)

74
»vm»p s.-c»n
&* !
_ CVn-.-
"Vn. v., .
"--"] "J!
•t l«witMci s. iw.
• •*--
^i1—j-i
»£..*£_?
Co^vfc'TTSrCi At.2. £*. ^P*- '£&
^
*.
::i
a i
j.
,•-
1 v4
. ;..vf-
USA ip.'P.
3*Sif.
v^-r
™;:;^v^
:;;:::z<;::>^
:::::;:::::::::::::;; ;:£*
fc
H I t| H-
_, tt
<:.«-«•
!....
suss
as
)..-
IZS»^TT
n 3
U /"" <.*.*rt.i/ CX _fg J»>/ >f>? "f 21-4aJm* AACH Af j^b ^,
F/G. J 7
Tcst-retest means, standard deviations, and correlations over22 years, for 191 Stanford University seniors
(Left-hand column entries and solid line are test data;right-hand column entries and broken line are retest data.)
(Median test-retest correlation .67.)
Test-retest means, standard deviations, and correlations over30 years, for 48 Minnesota bankers
(Left-hand column entries and solid line are test data;right-hand column entries and broken line are retest data. )
(Median test-retest correlation .56.)

APPENDIX P
COMPARISON OP ERRORS OP CLASSIFICATION, CORRECT CLASSI.FICATIONS, AND TIES POR SIX OCCUPATIONAL GROUPS,OBTAINED PROM TWO SCORING SYSTEMS. FROM THE
KUDER OCCUPATIONAL INTEREST SURVEY,FORM DD, MANUAL, PAGES 28-29

76
Comparison oi- Errors ok Classification, Correct Classifications, and Tiesfor 6 Occupational Groups, Outainkd from 2 Scoring Systems
v.\ = 90 in each of 6 cross-validation groups)
Occupational Group
Architect
Automobile Mechanic
Journalist
Pediatrician
Psychology Professor
5YSTEM
General Reference Group
OIS Scales
General Reference Group
OIS Scales
General Reference Group
OIS Scales
General Reference Group
OIS Scales
General Reference Group
OIS Scales
Go... . Reference Group
OIS Scales
vote; . ,-.r column cmrict rcpresem, rcspcciivciy, ihe number of errorsil »-.- v..-a.. :.(,.-., corrcci classifications, and lies found tshen liic 90liemocn oi each oi ;«o occupations being compareu were classified inio
Akchitect Automobile Mechanic
15
13
24
25
14
13
10
11
7
O 1=
r reo £
W O
164
166
152
153
164
172
162
170
164
171
15
13
4
2
2
5
5
2
19
12
3
2
11
6
3
4
a a
164
166
159
162
177
178
168
173
177
176
2
6
1
1
one of ihe iwo occupations, first on scales developed with the use of a
general reference Kroup, ,,mi ihen on the basis of OIS scales.

77
Forester Journalist Pediatrician Psychology Professor
t
"
c
c u« £I* ~cI- \
u £|
Joj
H
c
o og £g 1w
cJ
tj IE
o
.9 .9
O o « '-»
WO GO £
24 152 H 14 164 2 13 162 5 11 164 5
25 153 2 8 172 10 170 7 171 2
19 159 2 3 177 11 168 1 3 177
12 162 6 2 178 6 173 1 4 176
10 169 1 18 162 14 165 1
5 174 1 15 162 3 17 163
10 169 1 12 166 2 14 163 3
5 174 1 3 175 2 8 168 4
18 162 12 166 2 28 145 7
15 162 3 3 175 2 7 170 3
14 165 1 14 163 3 28 145 7
17 163 8 16S 4 7 170 3
..

APPENDIX G
DISTRIBUTION OF HIGHEST SCORE ON 30 OIS CORE SCALESFROM THE KUDER OCCUPATIONAL INTEREST SURVEY,
FORM DD, MANUAL, PAGES 30-31

DlST tinirr ON Of IIu; IKST SOOKI on 30 OIS Cori '. SCAI ,ES
(N = 3000: 100 in ;nch group)79
N< IAI.K* on Which 1 IirII1KST Scone Was OllTAIN 1.1)
l 2 3 4 5 c 7 8 <) 10 11 12 13 14 IS
/.
-'.
~y.
x, 1.
y.
Groupft
e
co
C
To
E
u
uo1—
oo
to
U
be
re
u
u
c'3cU
k.o
o
u
au
3"
"3
oto
P!
s-.
y
s.
uo
.—
.
u
3
i. Banker (M) ©8
1 1 8 6 6 J 2 1 4
2. Personnel Manager (M) 4
©1
1 3 5 4 2 3 2 4 1 4 1
3. Psychologist, C.micai (M)
©o 2 1 1 1
4. Physician (M) 4
©2 1 1 2 2 4 2
5. Chemist (M)
6. Engineer, Electrical (M)
1 1 2 3 22 3 1 1 3 3 1
37
2 10 ©14
13
©2
2 5 2 2 1 4 i
7. Engineer, Heating/Air Cond (M) 4 3 2 1
©3
3 2 2 1
S. Carpenter (M) 2 2 2 6
©5
1 4 1 7
9. Schoo. Superintendent (M) 3 13 1 4 7 1 6
©1 2 2 3 1
10. Minister (M)
11. Printer (Ml
4 1 1 1 2 1 2 1 1
3 3 i 3 2 3 ©2 ©
1
1 2
12. Architect (M) 1 j1
5 4 i 2
©1
13. Farmer (M) 4 1 2 9 4 1
©1
14. Accountant (M) 7 2 1 5 1 2 2
©15. Policeman (M)
16. Lawyer £M)
2 1 2 10 1 1 2 3
1 2 6 *i 5*>
I 1 4 , 5 1 4
17. Dcpt .S;orc Saleswoman (F) 1 i 1
'. S. Xursc (F) 1 1
19. Librarian \l7
, 3 1 3 1
20. Primary School Teacher ^i")
21. Secretary (F)
1 1 1
2 1 ii1 3 1
22. M:uhem.ui« un (M) 3 5 1) 7 8 1 1 2 1 5
23, Social Cimcvvoi k<v i N'. i i) 4 Id 1 1 1 3 1 3 1
24. Flee Engineering Major (M) u 1 3 5 4 1 1 3
25. Physical Sciences Major VM
2S. Biological Sciences Major ,M)
-> 1 2 T 2 1 1
2 4 \ 1 2 1
27. Business ;c Marketing Major (M) 8 1 1 1 2 6 1 1 1 1 23
28. Prcmcd, Pharm S: Dent Major (M) i 1 3 s 2 1 1 2 1
2 r). Home Ec Education Major (F) 1 1 1 1 1
30. Art &. Art Education Major (F)
*M •Scales derive, irorr. :.. rf lc groups.
F«>Scalcs derived from female groups.
„
•
,
•
\
• 1

80
Scalk* on Wiiton Highest Score Was Obtained
(61)
1
19 20 21
o
© A2 @3 7 (61
r
23 24 25 26 27
O Bf
VX o< » n
1 o
9
2 5
6
9
1
u
14
i
3
11
©
1 2
1
1 1
3 2
1
13
1
1
2
1 1
2
3
1
2
3 1
1
1
1
1 1
6
10
5
14
4
1
3
1
3 6
3 5
12
2
© ®6 13
10
4 9 14 1 (51)10 3 10 ©4
30
"' c•*.
•".
— £J oV *j
«J gu
L-
kS fljtlJ
g Cm "
1
•
1
4
2
4 2
1 1 1
4
1 1 2
Group
1. Banker (M)
2. Personnel Manager (M)
3. Psychologist, Clinical (M)
4. Physician (M)
5. Chemist (M)
6. Engineer, Electrical (M)
7. Engineer, Heating/Air Cond (M)
8. Carpenter (M)
9. School Superintendent (M)
10. Minister (M)
11. Printer (M)
12. Architect (M)
13. Farmer (M)
14. Accountant (M)
15. Policeman (M)
16. Lawyer (M)
17. Dcpt Store Saleswoman (F)
18. Xursc (F)
19. Librarian (F)
20. Primary School Teacher (F)
21. Secretary (F)
22. Mathematician (M)
23. Social Caseworker (M)
24. Elec Engineering Major (M)
25. Physical Sciences Major (M)
26. Biological Sciences Major (M)
27. Business & Marketing Major (M)
28. Prcmcd, Pharm & Dent Major (M)
29. Home Ec Education Major (F)
30. Art & Art Education Major (F)
NoTf.: The diagonal indicate* the number of cases in which .in individual
obtained his hiiflietl scute on ti.e stale for his own group. Tics arc
included in these entries and are also listed separately in the column at
the extreme right.

APPENDIX H
PERCENTAGE OF OVERLAP FOR PAIRS OF GROUPS, EACH GROUPSCORED ON 30 OIS CORE SCALES. FROM THE KUDER
OCCUPATIONAL INTEREST SURVEY, FORM DD,MANUAL, PAGES 32-33

Percentage of Overlap :.>;< Pairs ok Groups, Each Group Scored on 30 OIS Core Scales
i> > = 30* K>: iO in c.ich of 30 core g *oups) 82
1 3 A 5 6 7
k-
C
8 9 10 11 12 13 14 1S
SCAJ.K"
u-
',
ubo
o
c -. o n £J =y. C"
1
_~ s. ^7~ ^ s. La C ^ *•** X.
^~ s. s.<«s _ to * m
'— 3 •—
*
s: — 21—
-
y E w 1? ^ c/) •_ —
*
2 .j<"*
u ~ .— ,*5 CJ ij c u u la c g
•g Q O•2"
_C'5>
cEbB
53 c
V
| c oIV
— — *-* U3 Ed u CO ^, £ U-, *^ —
. Banker (M) _ 10 4 4 8 14 13 11 8 4 7 8 8 15 4
. Personnel Manager vNl) 10 10 6 9 20 12 5 16 11 8 7 9 8 7
. Psychologist, Ciinicai (M) 4 10 12 9 12 5 3 9 9 5 3 5 4 4
. Physician ^M) 4 6 12 13 9 5 7 11 9 6 8 6 6 4
. Cncrr.ist (M) 8 9 9 13 29 9 5 9 6 4 7 8 7 3
. Engineer, Eiectricai (M) 14 20 12 9 29 24 9 17 12 5 18 8 17 5
. Engineer, Heating/Air Conri (M) 13 12 5 5 9 24 9 7 4 7 8 10 12 5
. Carpenter (M) 11 5 3 7 5 9 9 6 8 5 9 9 6 15
. School Superintendent (M) 8 16 9 11 9 17 7 6 11 10 6 9 5 4
. Minister (M) 4 11 9 9 6 12 4 8 11 8 6 5 3 3
Printer (M) 7 8 5 6 4 5 7 5 10 8 12 2 7 3
Architect (M) 8 7 3 8 7 18 8 9 6 6 12 6 7 4
Farmer (M) 8 9 5 6 8 8 10 9 9 5 2 6 8 5
Accountant (M) 15 8 4 6 7 17 12 6 5 3 7 7 8 6
Policeman (M) 7 4 4 3 5 5 15 4 3 3 4 5 6
Lawyer (M) 9 12 10 9 9 16 6 4 12 10 9 9 8 7 6
Dept Store Saleswoman (F) 2 2 3 4 2 2 2 5 2 5 4 4 1 1 3
Xursc ..J'
)
2 1 4 4 1 3 1 4 1 1 2 2 1 2
Librarian (F) 3 3 6 3 4 3 1 1 2 8 2 3 1 1
Primary .v-i-.ooi Teacher (F) ; 3 4 4 1 3 1 2 1 4 1 2 1 2 2
Secretary (F) 5 5 6 4 3 3 1 2 3 3 2 4 1 3 1
Mathematician i'M 8 8 1
4
10 22 19 6 4 8 11 4 8 4 12 2
Sociai Caseworker (M) 5 14 21 8 6 10 5 4 10 11 7 6 5 5 3
F.iec Engineering Major (M) 5 7 8 4 10 17 8 7 5 5 4 5 3 9 4
Physical Sciences Major (M) 5 3 6 6 10 14 3 5 6 4 5 3 6 4 7
hiciogical Sciences Major JNi j 3 3 8 13 7 8 2 5 6 3 3 3 8 5 4
ijjir.ess & Marketing M..jor (M) 1 4 10 5 7 9 17 15*7
10 5 11 8 12 22 10
Premeci, Pharrn &; Dent Maj or (M) 4 4 9 16 7 9 4 4 7 6 4 2 7 6 7
Home Ec Education Major(F) 2 2 7 3 2 4 1 3 2 4 2 4 1
3 1
Art U Art Education Major (« 2 1 3 2 2 1 2 4 3 2 1 2 1
*M "Sca.ri, crr.vcc: from male [;rou;>s.
F 'Scales ccrivc<; from female i!i"°"Ps.

83
4
10
4
13
3
14
5
V
10
9
3
1
10
17
11
22 10 29 4 3
9 10 10 4 1
IB 29 10 5 1
3 4 4 5 8
1 3 1 1 8 —
.Scai.k*
1. Banker (M)
2. Personnel Manager (M)
3. Psychologist, Clinical (M)
4. Physician (M)
5. Chemist (M)
6. Engineer, Electrical (M)
7. Engineer, Heating/Air Cond (M)
8. Carpenter (M)
9. School Superintendent (M)
10. Minister (M)
11. Printer (M)
12. Architect (M)
13. Farmer (M)
14. Accountant (M)
15. Policeman (M)
16. Lawyer (M)
17. Dcpt Store Saleswoman (F)
18. Nurse (F)
19. Librarian (F)
20. Primary School Teacher (F)
21. Secretary (F)
22. Mathematician (M)
23. Social Caseworker (M)
24. Elec Engineering Major (M)
25. Physical Sciences Major (M)
26. Biological Sciences Major (M)
27. Business & Marketing Major (M)
28. Prcmcd, Pharm & Dent Major (M)
29. Home Ec Education Major (F)
30. Art & Art Education Major (F)
Note: Overlap is approximately mice the percentage of errors ol
clarification thai occurs if (he cuttint; point is pi.icrd where the distnbu-
lion of difference scor<-s for die two scales involved intersect. For exam-
ple, n percent overlap between Mathematician and School Supcnn-
lcnder.1 means that approximately 4 percent of the members of each
group were incorrectly classified as members of the other group, on the
basis of the higher of the two scores. It should be noted that this table is
not related to Table 5; it is based on paired comparisons of scores rather
than on distribution of highest score.

APPENDIX I
RANK OF EACH CORE GROUP'S SCORES ON ITS OWN 01 S SCALE,PROM THE KUDER OCCUPATIONAL INTEREST SURVEY,
FORM DD, MANUAL, PAGE 35
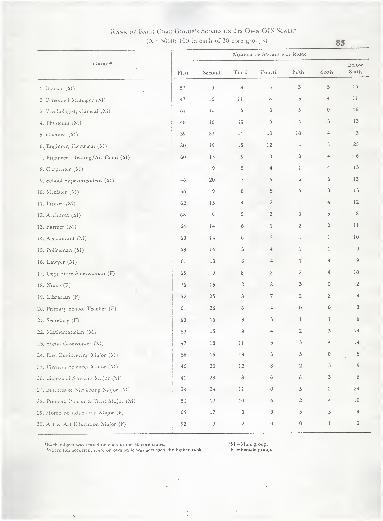
Rank of Each Coke Group's Scores on Its Own OIS Scale'
(X = 3000: 100 in each of 30 core groups) 85
1
.
Banker \NTi
2. Personnel Manager l»M)
3. Psychologist, Clinical ^M)
4. Physician \\\)
5. Chemist (Ml
6. Engineer, Electrical (M)
7. Engineer, Heating/Air Gond (M)
S. Carpenter iM)
9. School Superintendent (M)
'.0. Minuter t,M)
11. Printer (M)
12. Architect (M)
".3. Farmer (M)
14. Accountant (M)
15. Policeman (M)
16. Lawyer (M)
17. Dcpt Store Saleswoman (F)
18. Xursc (F)
19. Librarian (F)
20. Primary School Teacher (F)
21. Secretary (F)
22. Mathematician (M)
23. Social C-.-.ewo."Ker (M)
24. Elcc Engineering Major (M)
25. Physical Sciences Major (M)
26. Biological Sciences Major VM
2~. Business ..v Marketing Major (M)
2S. Prcmcd, I'harm & Dent Major (M)
29. iiomc he Education Major (F)
30. Art ii Art Education Major (F)
N'umrkr of Scores p:.« Rank
Second Third Fourth Fifth Sixth
iiclow
Sixth
57 9 8 8 3 5 10
47 16 11 8 3 4 11
61 10 5 3 5 16
18 16 10 6 4 3 13
39 23 11 10 10 4 3
20 19 15 12 4 5 25
60 15 9 3 3 4 6
9 5 4 1 4 13
46 20 7 5 6 3 13
56 9 8 5 6 3 13
62 15 4 2 1 4 12
68 9 5 2 3 5 8
64I
14 6 1 2 2 11
63 14 6 5 1 1 10
68 14 3 4 1 1 9
61 13 8 4 1 4 9
I
« 9 8 2 2 4 10
76 15 2 2 3 2
52 25 8 7 2 2 4
1
61 26 6 4 3
63 16 8 5 1 1 6
53 15 9 4 2 3 14
47 18 11 3 3 4 14
5S 15 14 3 5 5
46 20 12 3 2 3 9
41 28 8 6 6 3 8
34 24 11 5 2 24
51 17 10 6 2 4 10
651
17 3 3 3 5 4
]
92 3 2 1 2
*F,ach subject w.is scored on each "j ihc 30 core scales.
Where lie* occurred, score on own scale was accorded ihc higher rank.
bM = Muic group.
V »Female group.

APPENDIX J
FREQUENCY OP DIFFERENCES, IN LAMBDA POINTS, BETWEENHIGHEST SCORE AND SCORE ON OWN KEY. FROM THE
KUDER OCCUPATIONAL INTEREST SURVEY,FORM DD, MANUAL, PAGE 36

mo
; 900
ISM
ISM)
1S70
ISO
160
KO
so
50
10
87
l)Ii!'i ;.KI..\Ci'..S IN l..\MUI).\ POINTS
3. Frequency of differences, in lambda points, between highest score and score on own key.
AD subjects were scored on all 30 keys.

APPENDIX K
EXPLANATORY LETTER RETURNED WITH INTEREST PROFILESTO PARTICIPATING SUBJECTS

89
Co
P
y
Dear
I would like to extend a sincere thank you for all your helpand consideration in taking the interest inventories for mymaster's thesis. Out of 100 boys, all of them cooperatedand took the tests.
Enclosed in this envelope, you will find your own results onthe two tests, and an interpretative leaflet for the Kuder.Again, the Strong Vocational Interest Blank is the blue testand the Kuder Occupational Interest Survey is the orangetest. On each of these tests you will receive scores formany different occupations. These scores indicate how yourinterests compare with successful men currently engaged inthe occupations. All they show is how your interests compareThey do not tell you that you will succeed in an occupation.To determine success you will also have to consider how yourabilities, aptitudes, past achievements, and motivationcompare with those who succeed in the occupation. Even sothese test scores show one of the many variables involved inchoosing an occupation and by comparing your interests tomen in the occupation you may more realistically decide whatareas of work you would like most to enter.
On the Strong (blue), you will see a standard score immedi-ately to the right of each occupation. This score shows thedegree your interests are related to the interests of men inthat occupation. Further to the right, is a number onewhich indicates the graphs' representation of the score.Also, along to the right is a blue shaded area which showsthe average (middle 1/3) scores for a group of professionaland business men. These men were drawn from a large numberof varied occupations. The scores farthest to the right ofthe blue shaded area show the highest degree of interest,as compared to men currently engaged in that occupationwhile the scores farthest to the left show the lowest degreeof interest as compared to men currently engaged in thatoccupation. On the back of the blue sheet are furtherinstructions for interpreting your profile of interests.
On the Kuder (orange), you will see a number of two-decimalfigures next to various occupations. These figures arepositive correlation coefficients and the higher they are,

90
-2-
the more similar your interests are with men in thoseoccupations while the lower they are, the least similaryour interests are. Scores of <,45 or better show a highinterest in that area. It is very unusual to get any scoresabove .75. Also, included is an interpretative leafletwhich tells you how to interpret your own profile and givesyou additional information as to what your scores mean. Ifthe V score in the bottom right-hand corner is below .45 orif none of your scores are above .31 then the test resultsare not reliable for you. This may be due to many factorssuch as torn paper, too many questions not answered, faking,or something else.
Try to view the entire set of interests. Consider what allthe high interest occupations have in common. Also, look atthe low interest occupations because a very low interestarea may tell you just as much about yourself as a high one.
Again, thank you for all of your help. Without it, my thesiswould not have been possible „ I hope this information willbe of help to you« If you have further questions, feel freeto see me in iMoore Hall, Room 910, or ask your high schoolcounselor, or ask in the counseling center. Dr. Danskin, theHead of the Counseling Center, is considered one of the top
in the country at interpreting interest tests.
Sincerely,
Robert N. WilsonDiving Coach
RNW :cpJBnc.
men

APPENDIX L
A BIBLIOGRAPHY LISTING OP ALL STUDIES COMPARING THE STRONGVOCATIONAL INTEREST BLANK WITH THE KUDER PREFERENCE
RECORD - VOCATIONAL, AS LISTED IN BUROS' MENTALMEASUREMENTS YEARBOOKS

BIBLIOGRAPHY 92
Buros' Mental Measurements Yearbooks list over 600 references
for the Strong Vocational Interest Blank. Similarly, Buros lists
over 600 references for the Kuder Preference Record - Vocational.
The following list includes all references from Buros to studies
which have compared these two tests.
Anderson, Roy N. "A Comparative Study of Three VocationalInterest Tests," Psychology Clinic , 22: 117-27, June-August, 1933.
Berdie, Ralph F. "Scores on the Strong Vocational InterestBlank and the Kuder Preference Record in Relation to SelfRatings," Journal of Applied Psychology , 34: 42-9, February,1950.
Berman, Isabel R., John G. Darley, and Donald G. Patterson.Vocational Interest Scales. An Analysis of Three Question-naires in Relation to Occupational Classification andEmployment Status, pp. 5-23, 34-5. University of MinnesotaBulletin of the Employment Stabilization Research Institute,Volume 3, Number 5, Minneapolis, Minnesota: University ofMinnesota Press, August, 1934.
Bordin, Edward S. "Relative Correspondence of Professed Inter-ests to Kuder and Strong Interest Test Scores," Abstract,American Psychologist , 2: 293, August, 1957.
Brayfield, Arthur H. "When Vocational Guidance Tests Disagree -
A Reply," School and Society , 56: 17-18, July 4, 1942.
Craven, Ethel Case. The Use of Interest Inventories in Counsel -
ing . Chicago, Illinois: Science Research Association, 1961.
Garrett, Gene Aubrey. "A Comparison of the Predictive Power ofthe Kuder Preference Record and the Strong VocationalInterest Blank in a Counseling Setting." Doctor's Thesis,University of Missouri (Columbia), 1961.
Gordon, Hans C, and Walter W. Herkness, Jr. "Pupils AppraiseVocational Interest Blanks," Occupations , 20: 100-2,November, 1941.

93Joseph, Michael P. 'The Strong Vocational Interest Blank and
the Kuder Preference Record - Occupational (Form D): AComparative Study of Eight Same-Named Scales," Yearbook ofthe National Council of Measurement in Education, 18: 145-
54, 1961.
Kelso, Norma Elaine. "The Relative Correspondence of ProfessedInterests to the Kuder and Strong Interest Test Scores,"Master's Thesis, State College of Washington (Pullman,Washington), 1948.
King, Paul, Gwendolyn Norrell, and G. Pat Powers. "Relation-ships Between Twin Scales on the SVIV and the Kuder,"Journal of Counseling Psychology , 10: 395-401, Winter of1963.
Kohn, Nathan, Jr. "An Investigation and Evaluation of the KuderPreference, Especially in Comparison to the Strong Voca-tional Interest Blank." Doctor's Thesis, WashingtonUniversity (St. Louis, Missouri), 1948.
Longstaff, Howard P. "Fakability of the Strong Interest Blankand the Kuder Preference Record," Journal of AppliedPsychology , 32: 360-9, August, 1948.
Malcolm, David D. "The Relative Usefulness of Several Exten-sively Used Vocational Interest Inventories in Counselingat Various Academic Levels." Doctor's Thesis, NorthwesternUniversity (Evanston, Illinois), 1948.
Malcolm, David Donald. "Which Interest Inventory Should I
Use?" Journal of Educational Research , 44: 91-8, October,1950.
Namani, Abdel-Kader. "Factors Associated With High and LowCorrelations Between Individuals' Scores on Two InterestInventories." Doctor's Thesis. Cornell University(Ithaca, New York), 1958.
Parry, Douglas F. "When Vocational Guidance Tests Disagree -
An Answer to a Reply," School and Society , 56: 101-3,August 1, 1942.
Patterson, Donald G. "Vocational Interest Inventories inSelection," Occupations , 25: 152-3, December, 1946.
Peters, Edwin F. "Vocational Interests As Measured by theStrong and Kuder Inventories," School and Society , 55:453-5, April 18, 1942.

Redlener, J. "A Comparative Study of the Efficiency of theKuder Preference Record and the Strong Vocational InterestBlank in the Prediction of Job Satisfaction." Master'sThesis, University of Southern California (Los Angeles),194S.
Roeber, Edward C «, "A Comparison of Seven Interest InventoriesWith Respect to Word Usage," Journal of EducationalResearch , 42: 8-17, September, 1948.
Stefflre, Buford. ,rThe Reading Difficulty of Interest Inven-tories," Occupations , 26: 95-6, November, 1947.
Triggs, Francis Ovalind. "A Further Comparison of InterestMeasurement by the Kuder Preference Record and the StrongVocational Interest Blank for Men," Journal of EducationalResearch , 37: 538-44, March, 1944.
Wisdom, Jessie R. "A Study of the Interest Patterns of Pre-medical Students as Revealed by the Kuder Preference Recordand the Strong Vocational Interest Inventory." Master'sThesis, North Texas State College (Denton, Texas), 1950.
Wittenborn, J. R., Francis Oralind, and Daniel D. Feder. "AComparison of the Interest Measurement by the KuderPreference Record and the Strong Vocational Interest Blanksfor Men and Women," Educational and Psychological Measure -
ment , 3: 239-57, August, 1943.

A COMPARISON OF SIMILAR SCALES ON THE STRONG VOCATIONALINTEREST BLANK AND THE KUDER OCCUPATIONAL
INTEREST SURVEY, FORM DD
by
ROBERT N. WILSON
B. A. t Macalester College, 1966
AN ABSTRACT OF A MASTER'S THESIS
submitted in partial fulfillment of the
requirements for the degree
MASTER OF SCIENCE
College of Education
KANSAS STATE UNIVERSITYManhattan, Kansas
1967

The purpose of this study was to compare similar
scales on the Strong Vocational Interest Blank and the Kuder
Occupational Interest Survey, Form DD, to determine to what
extent they actually measure the same factors.
The information resulting from the comparison would
be useful to counselors in deciding which interest test to
use in the counseling situation. The results would also
point out inconsistencies and contradictions in the use of
both interest tests with the same client.
The sample consisted of 100 male freshman students who
were randomly selected from the 1,400 male freshmen attending
Kansas State University Spring Semester, 1967.
The data were reported in the form of Pearson product
moment correlation coefficients between the student's inter-
est scores in each test for 76 different occupations. Each
pair of occupations compared was related to each other in
the nature of interests involved. Of the total 76 occupa-
tions compared, 27 were named the same on both tests. The
degree of significance for each correlation coefficient was
reported at both the .05 and .01 levels.
It was found that, in general, the two tests are
measuring different factors. The mean correlation coeffic-
ient for all 76 scales compared was .262. The mean correla-
tion coefficient for the 27 scales which were named the same
was .317. By including the engineering scales and a few

2
others which seemed to be measuring the same factors, even
though not named the same, the mean correlation coefficient
was increased to .354. Only five correlation coefficients
were found to be above ,50, the highest being .672 between
the Carpenter scales on the two tests. For predictive
purposes, a correlation coefficient of .50 means that only
25 per cent of the variance of one variable is being
accounted for by the other.
There are very few times that we would be interested
in predicting a student's score on one interest test from
his score on another interest test. Even so, a direct
contradiction may exist in using these two tests in the
counseling situation. After all, each test gives the student
a score showing how similar his interests are to those of
men in each of many occupations. Yet the low correlations
between same-named scales show these two tests are not
measuring the same factors.
Many questions need to be answered by and for the
counselor before he can skillfully make use of both of these
interest tests. Until these questions are answered more
clearly and more directly, the writer can only recommend
that a counselor who wishes to use both of these tests should
study them very carefully, attempting to determine why their
scales are measuring different factors and what factors each
scale is measuring. A counselor who wishes to choose between

3
the two tests for a counseling situation would be well
advised to stay with the Strong Vocational Interest Blank
until the Kuder Occupational Interest Survey, Form DD, has
ore supporting research, especially predictive validity
data and long-term reliability data.


![HANGING SCALES/CRANE SCALES - Aviga HFO 159 page 166 1020,-from € Hanging scales/Crane scales Lisa Mayer Product specialist Hanging scales/Crane scales Tel. +49 [0] 7433 9933 - 219](https://img.pdfslide.us/doc/110x75/5afd22507f8b9a68498c727e/hanging-scalescrane-scales-hfo-159-page-166-1020-from-hanging-scalescrane.jpg)