Embed Size (px)
Citation preview
Comparison of Sentinel-1 and TerraSAR-X TOPS Processor Implementations based on Simulated Data
J. Mittermayer*, D. D’Aria**, E. Attema***, A. Monti Guarnieri**, R. Piantanida**, P. Prats*, S. Sauer*, P. Snoeij***
*German Aerospace Center (DLR), Oberpfaffenhofen, Germany ** ARESYS s.r.l., a POLIMI spin-off, Milano, Italy
***ESA/ESTEC, Noordwijk, The Netherlands
CEOS Workshop17-19 November, 2009, Pasadena, USA

July 22, 2009 Microwaves and Radar Institute Slide 2
Outline
• TOPSAR Introduction
• Sentinel-1 Prototype TOPS Processor - SPT
• Experimental TerraSAR-X TOPS Processor - ETT
• Comparison of Simulated Point Targets
• Cross-Interferogram of Simulated Point Targets with Noise Floor

July 22, 2009 Microwaves and Radar Institute Slide 3
Introduction
• DLR-HR and Aresys performed a TOPS processor comparison supported by ESA
• Sentinel-1 TOPS operational and verification processor are both based on one prototype implementation
• A cross check with an independently developed processor has to be carried out
• The Sentinel-1 Prototype TOPS Processor (SPT) is compared with the Experimental TerraSAR-X TOPS Processor (ETT)
• The ETT is verified with real TerraSAR-X TOPS raw data
• The comparison is based on simulated TerraSAR-X and Sentinel-1 TOPS raw data

July 22, 2009 Microwaves and Radar Institute Slide 4
TOPSAR Introduction
• TOPSAR is a new acquisition mode proposed by E. Attema (ESA-ESTEC) and F. Rocca (POLIMI). Theoretical development by POLIMI1)
• Achieves same coverage & resolution as ScanSAR, but with nearly uniform SNR & DTAR
• Scalloping effect is removed totally in a mechanically steering (reduced substantial in electronically steering)
• Requires a fast rotation of the azimuth antenna pattern
• Will be operational mode for Sentinel-1 Interferometric Wide Swath (ISW) mode
• TOPSAR has been successfully demonstrated by DLR-HR with TerraSAR-X for the first time within the framework of ESA project “Sentinel-1 TOPS Imaging Mode Demonstration with TerraSAR-X”
1) F. D. Zan and A. M. Guarnieri, “TOPSAR: terrain observation by progressive scan“, IEEE Trans. Geosci. Remote Sensing, vol. 44, no. 9, pp. 2352 -2360, Sept. 2006.

July 22, 2009 Microwaves and Radar Institute Slide 5
Terrain Observation by Progressive Scan (TOPS)

July 22, 2009 Microwaves and Radar Institute Slide 6
Terrain Observation by Progressive Scan (TOPS)

July 22, 2009 Microwaves and Radar Institute Slide 7
Experimental TerraSAR-X TOPS Processor - ETT
• sub-apertures
• range processing with Extended Chirp Scaling
• new baseband azimuth scaling (BAS) for azimuth focusing
• proposed approach also suitable for spotlight and sliding spotlight

July 22, 2009 Microwaves and Radar Institute Slide 8
BAS Processing Examples for Multiple SAR Modes
[1] P. Prats, R. Scheiber, J. Mittermayer, A. Meta, A. Moreira, “Processing of Sliding Spotlight and TOPS SAR Data Using Baseband Azimuth Scaling,” to be published in IEEE TGRS TerraSAR-X Special Issue.

July 22, 2009 Microwaves and Radar Institute Slide 9
Sentinel-1 Prototype TOPS Processor - SPT
Frequency domain unfolding & resampling
w-k focusing
Time domain unfolding & resampling
SLC data (1 burst)
RGCdata (1 burst) The Sentinel-1 Prototype TOPS processing
implements a very simple approach based on two basic processing blocks:
1) A standard w-k focusing block 2) An azimuth 1D ‘unfolding’ processing block

July 22, 2009 Microwaves and Radar Institute
Purpose: given a signal with a time-folded spectrum as in the following time-frequency diagram (SCANSAR example) the time/frequency un-folding block shall un-fold the signal contributes, resolving the time aliasing
(the DUAL problem, frequency folding, is completely equivalent)
τ
fa
PRF
kr
τ
fa
PRF
Tb
P Pa
The azimuth 1D unfolding block
Mosaicking
LP interpolation
Folded data
Un-folded data

July 22, 2009 Microwaves and Radar Institute Slide 11
Comparison of Simulated Point Targets
- TS-X 9 Point Target Scenario (IRF Analysis, Phase Stability Analysis
- S-1 9 Point Target Scenario (Similar Results)
- S-1 Point Target Ambiguity Scenario
- TS-X Point Target Ambiguity Scenario (Similar Results)
July 22, 2009 Microwaves and Radar Institute Slide 12
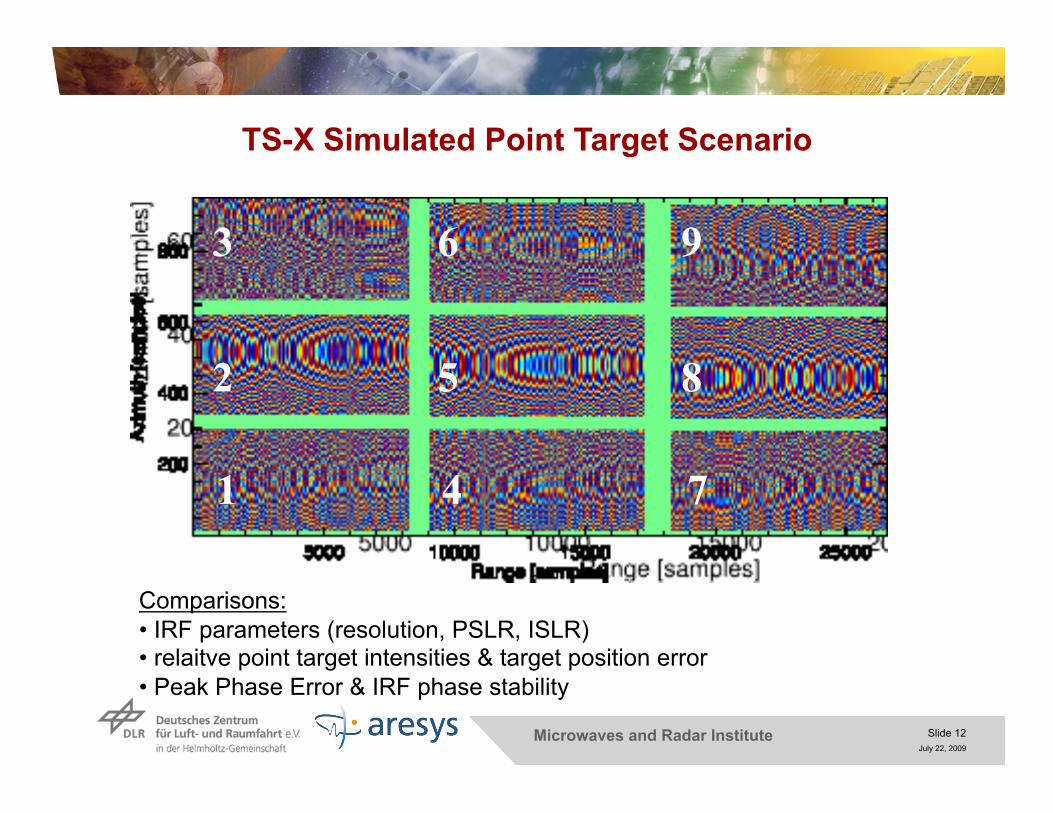
TS-X Simulated Point Target Scenario
3
2
1
6
5
4
9
8
7
Comparisons: • IRF parameters (resolution, PSLR, ISLR) • relaitve point target intensities & target position error • Peak Phase Error & IRF phase stability

July 22, 2009 Microwaves and Radar Institute Slide 13
TS-X Simulated Point Target Analysis Azimuth resolution: • EET up to 1% theoretical value • SPT up to 1.5% theoretical value • within allowed deviation of 3% ⇒ OK
Range resolution: • both processors show almost theoretical value ⇒ OK
PSLR: • azimuth EET theoretical value, SPT 0.2 dB lower in azimuth center targets • both processors show for outer targets small measurement deviation up to 0.5 dB in azimuth (orthogonal analysis) • range PSLR almost theoretical value ⇒ OK
ISLR: • in azimuth ETT/SPT deviate by -0.1 dB /+0.1 dB for center azimuth targets • both show higher deviation for azimuth outer targets up to -1.3 dB (orthogonal analysis) • range values deviate for both processor by 0.2 dB ⇒ OK
July 22, 2009 Microwaves and Radar Institute Slide 14
TS-X Simulated Point Target Analysis Absolute target position error: • in azimuth [resolution cells] ETT / SPT deviate by 0.026 / 0.012 • in range [resolution cells] ETT / SPT deviate by 0.017 / 0.012 ⇒ OK
Absolute point target intensities: • the expected values consider the variation due to the TBP • ETT / SPT deviate by 0.027 dB and 0.033 dB ⇒ OK
Absolute phase error: • difficulty of high slope for azimuth outer targets (fDC of about 4 kHz); measurement for both processor results considered not valid for the outer targets • for both processors the absolute phase error for the center azimuth targets is below 1° ⇒ OK (confirmation by IRF phase stability analysis)

July 22, 2009 Microwaves and Radar Institute Slide 15
TS-X Simulated Point Target Analysis IRF phase stability: • the 2D point target spectra show expected small undulations and a linear phase • the remaining phase error is smaller than 2° in azimuth and 1° in range ⇒ OK
ETT
SPT
azimuth range

July 22, 2009 Microwaves and Radar Institute Slide 16
Sentinel-1 Simulated Point Target Ambiguity
Raw Data Generation: • raw data with amplitude pattern extended in whole azimuth dimension • simulated Sentinel-1 antenna pattern (ideal antenna model)
Processing ETT: • no antenna pattern correction • no sidelobe suppression • processed bandwidth 381 Hz • non calibrated processing
Processing SPT: • no antenna pattern correction • no sidelobe suppression • processed bandwidth 381 Hz

July 22, 2009 Microwaves and Radar Institute Slide 17
Simulated Point Target Ambiguity
Ambiguity comparison: • maximum difference for 1st ambiguity of 3dB at signal level of -35 dB • maximum difference for 2nd ambiguity of 5dB at signal level of -50 dB • explanation of small deviation: different interpolation in measurement
ETT
SPT
Ta r g e t 1 ( n e a r range, burst start)
0dB (peak) -35.116033 (1st ambiguity)
-46.286433 (2nd ambiguity)
T a r g e t 5 ( m i d range, mid burst)
-37 .252439 (1st ambiguity)
0dB (peak) -34 .767677 (1st ambiguity)
Target 9 (far range, burst end)
-46.792093 (2nd ambiguity)
-36 .365238 (1st ambiguity)
0dB
2nd ambiguity
1st ambiguity Peak 1st ambiguity
2nd ambiguity
PT1 (Near range, Burst
start) - - - -36.1514[dB] -48.6807[dB]
PT5 (Mid range, Mid
burst) - -35.313[dB] - -35.9405[dB] -
PT9 (Far range, Burst
end)
-51.1103[dB]
-39.8571[dB] - - -

July 22, 2009 Microwaves and Radar Institute Slide 18
• The simulation with TSX and S-1 generated point target raw data resulted in almost identical processor results
• The point target ambiguity simulations are well in accordance
• The comparison of both processors with simulated point target raw data was successful
• there is no indication of principal problems in the two processors or processing algorithms under investigation.
Conclusion on Comparison of Simulated Raw Data Processing Results
July 22, 2009 Microwaves and Radar Institute Slide 19
Cross-Interferogram of Simulated Point Targets with Noise Floor:
- Test with shifted raw data within SPT
- Test with shifted raw data within ETT
- Cross-Interferogram

July 22, 2009 Microwaves and Radar Institute Slide 20
Test with Shifted Raw Data
=> The simulated scenario consists of 9 point targets over a noise floor (-60 dB after focusing)

July 22, 2009 Microwaves and Radar Institute Slide 21
No weighting
Hamming weighting
Phase standard deviation [deg] 0.9111 0.1412
Mean phase [deg] -0.0177 -0.0349
Mean coherence [7x7 window] 0.9999 0.9999
Test with Shifted Raw Data (ETT) => Shift of Raw Data in Range by 8k samples (about one Pulse Length)

July 22, 2009 Microwaves and Radar Institute Slide 22
Single block vs 2 sub-blocks Single block vs
4 sub-blocks Mean 0,0079 [deg] 0,0112 [deg]
STDev 1,9721 [deg] 1,7336 [deg]
Test with Shifted Raw Data (SPT)

July 22, 2009 Microwaves and Radar Institute Slide 23
The Cross-Interferogram Test
An interferogram between the output of both processors, namely DLR’s experimental processor and Sentinel-1 prototype processor, is performed (hence the name Cross-Interferogram)
Similar as with the shifted raw data test, the parameters of the generated interferogram tell how similar the performance of both processors is. Ideally, a phase standard deviation of 0º should be obtained.
Both processors can impose the output azimuth image sampling.

July 22, 2009 Microwaves and Radar Institute Slide 24
Cross-Interferogram with Simulated Data % of azimuth bandwidth 90%
% of range bandwidth 90%
Weigthing Hamming in range and azimuth (a = 0.54)

July 22, 2009 Microwaves and Radar Institute Slide 25
Cross-Interferogram with Simulated Data Mean coherence 0.98664
Phase standard deviation 5.80º zoom
July 22, 2009 Microwaves and Radar Institute Slide 26
Conclusions Raw Data Shifted and Cross-Interferogram Both processors show an excellent performance in the shifted raw data test,
with a standard deviation of less than 2º. Cross-interferogram test:
Results are satisfactory, with a phase standard deviation of 5.8º, above all considering the difficulties in performing such a direct comparison.
No quadratic or higher order terms can be observed in the phase of the cross-interferogram, indicating both processors are performing well.
Phase noise is larger than in the shifted raw data test. Not all possible issues have been identified, as this would require much more time and effort on both sides.
Several improvements/refinements on both sides were achieved.

July 22, 2009 Microwaves and Radar Institute Slide 27
• The comparison of two processors with different processing algorithms turned out to be a complex task.
• The results are confirming both processing approaches mutually. The investigation of the last small residual differences in the processing results would require a very detailed and intensive effort.
• The comparison of both processors with simulated point target raw data was successful and no weakness was found. No principal problems were found in the two processors or processing algorithms under investigation.
• The results of the processors cross-interferogram are showing good accordance for simulated data (phase st.dev. 5.8°). This is the most significant comparison result.
Conclusion on Processor Comparison