Embed Size (px)
Citation preview
Comparison of Recorded and Simulated Ground Motions
Presented by:Emel Seyhan, PhD StudentUniversity of California, Los Angeles
Collaborators:Lisa M. Star, PhD Candidate, University of California, Los AngelesRobert W. Graves, PhD, USGSJonathan P. Stewart, PhD, PE, University of California, Los Angeles
OutlineMotivationHybrid Simulation ProcedureValidation Analysis & Results
Distance scalingStandard deviation
Calibration of Hybrid Simulation ProcedureDistance attenuationStandard deviation
Conclusions
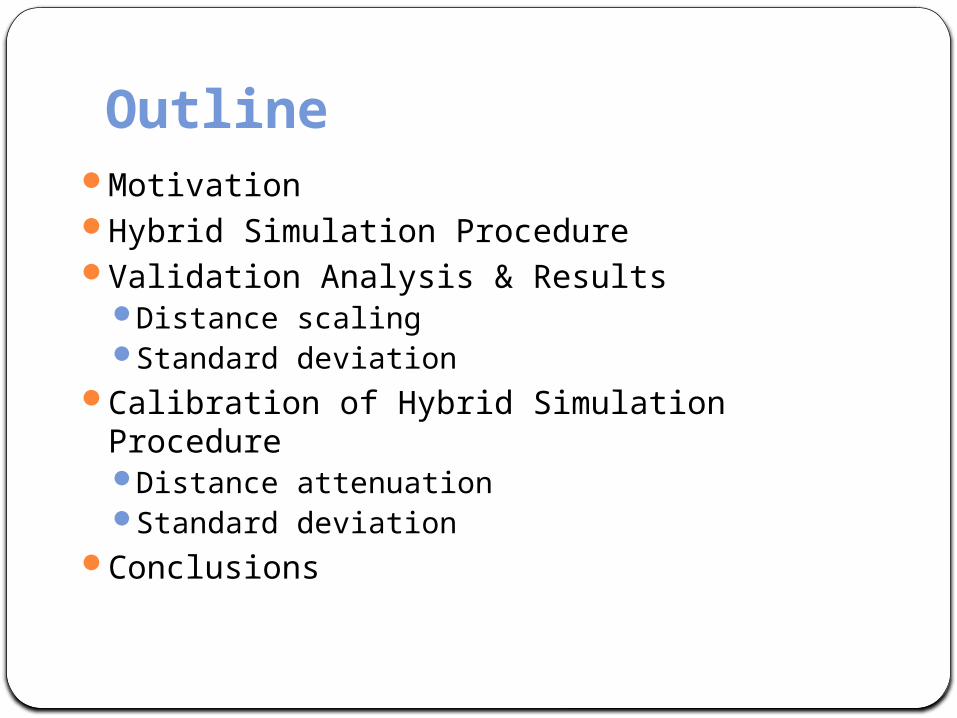
Motivation
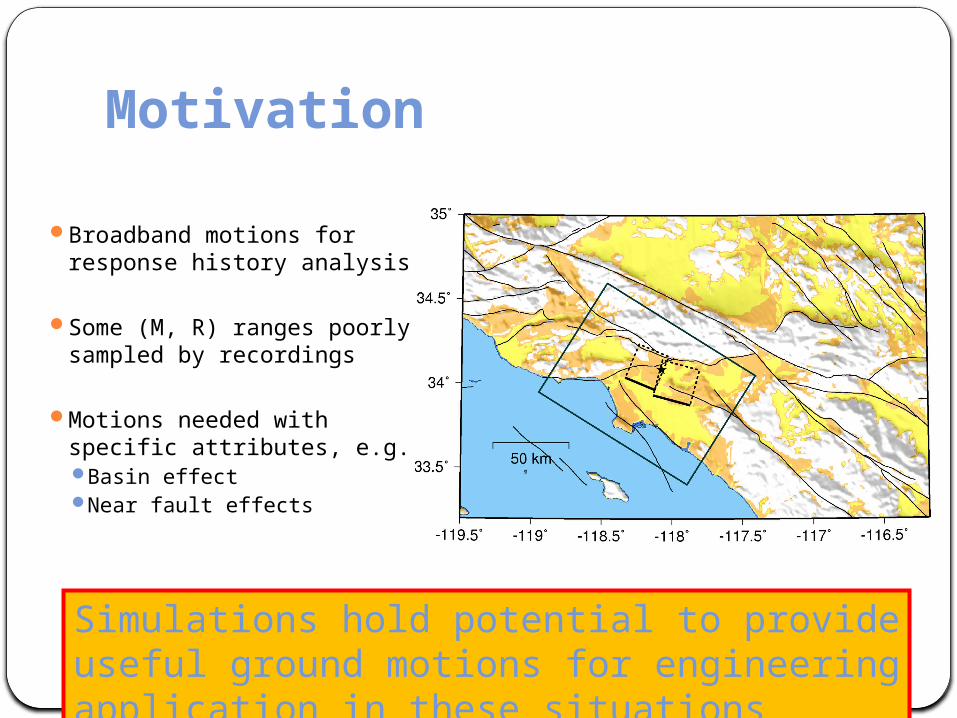
Broadband motions for response history analysis
Some (M, R) ranges poorly sampled by recordings
Motions needed with specific attributes, e.g.Basin effectNear fault effects
Motivation
Broadband motions for response history analysis
Some (M, R) ranges poorly sampled by recordings
Motions needed with specific attributes, e.g.Basin effectNear fault effects
Simulations hold potential to provide useful ground motions for engineering application in these situations
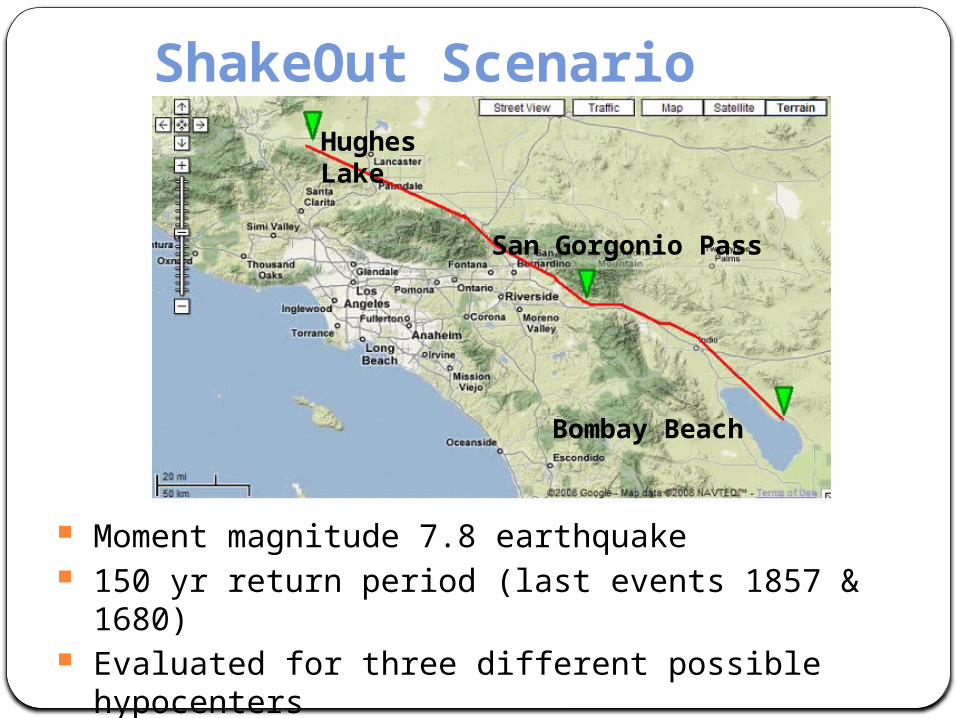
ShakeOut Scenario Description
Moment magnitude 7.8 earthquake 150 yr return period (last events 1857 & 1680) Evaluated for three different possible hypocenters
Hughes Lake
San Gorgonio Pass
Bombay Beach
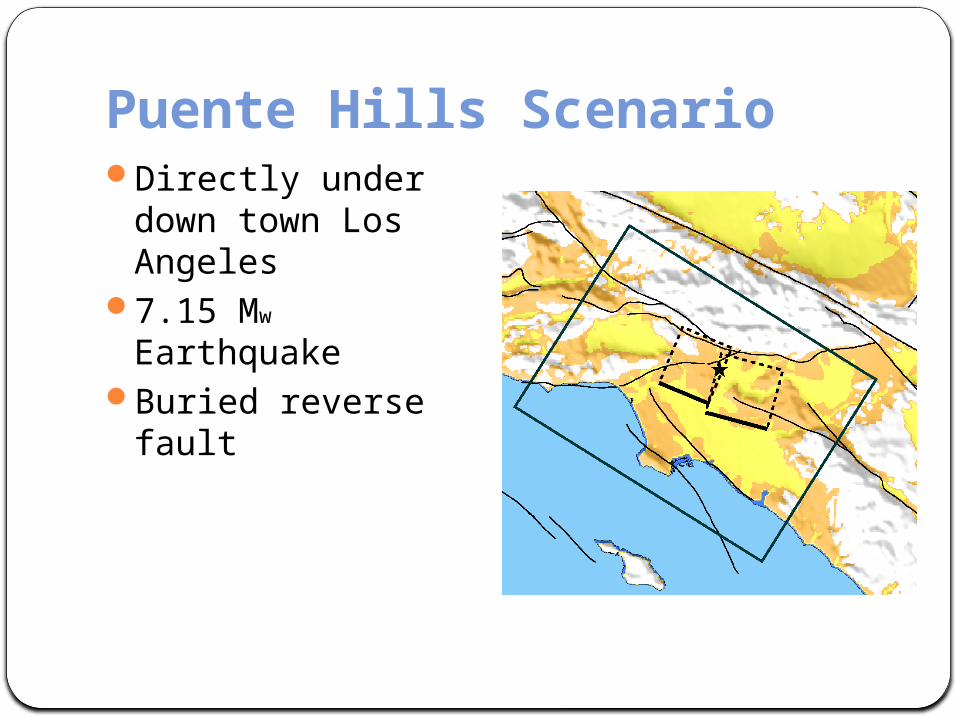
Puente Hills ScenarioDirectly under down
town Los Angeles7.15 Mw EarthquakeBuried reverse fault
Simulation Procedure
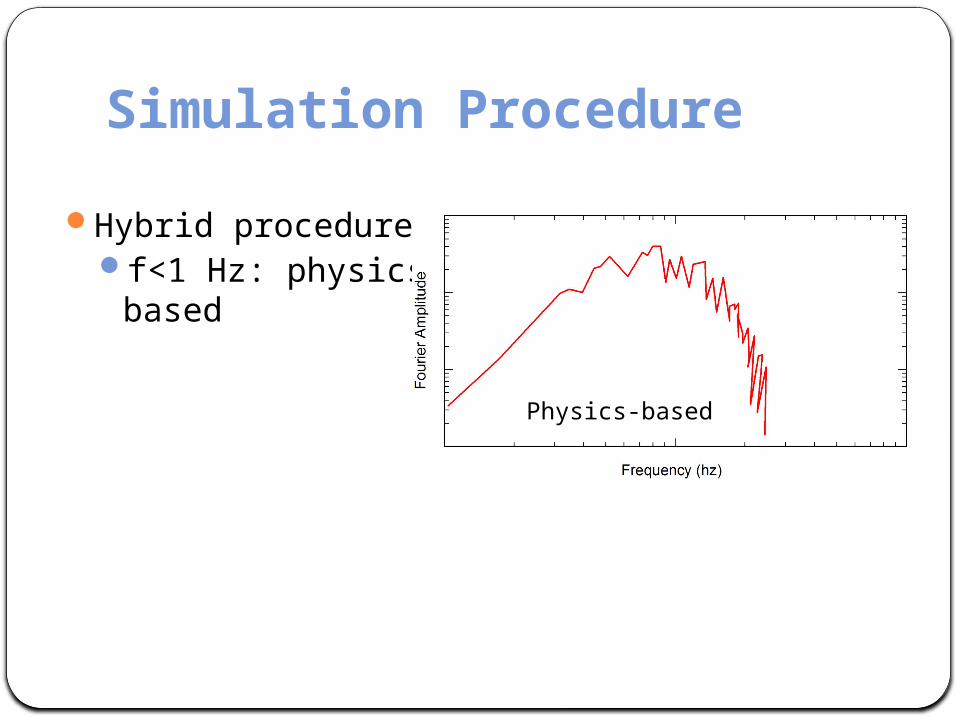
Hybrid proceduref<1 Hz: physics based
Physics-based
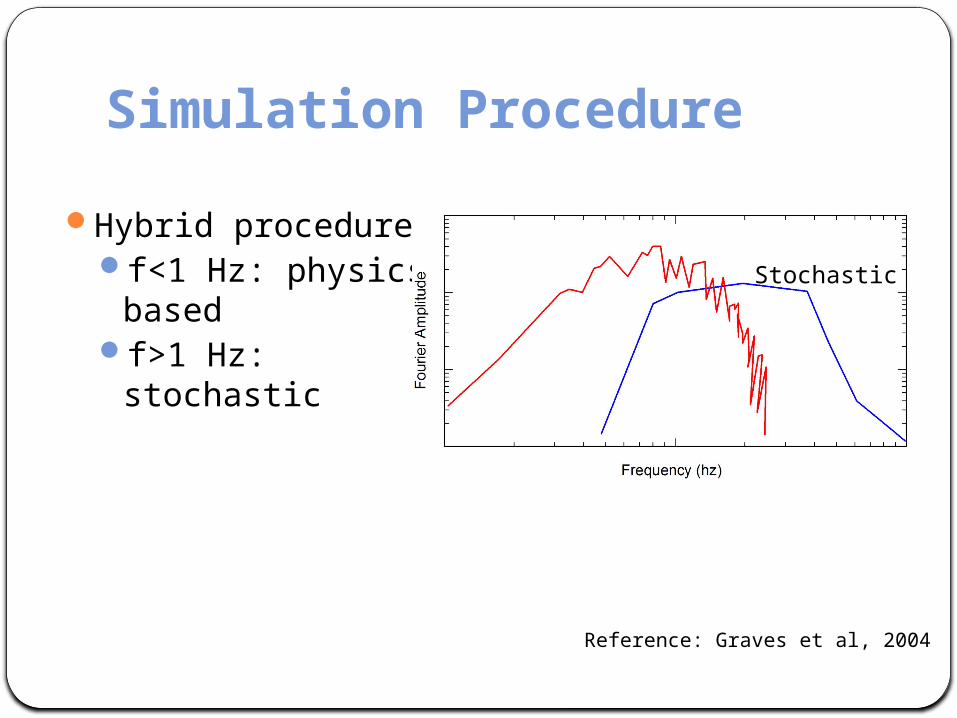
Simulation Procedure
Hybrid proceduref<1 Hz: physics basedf>1 Hz: stochastic
Stochastic
Reference: Graves et al, 2004
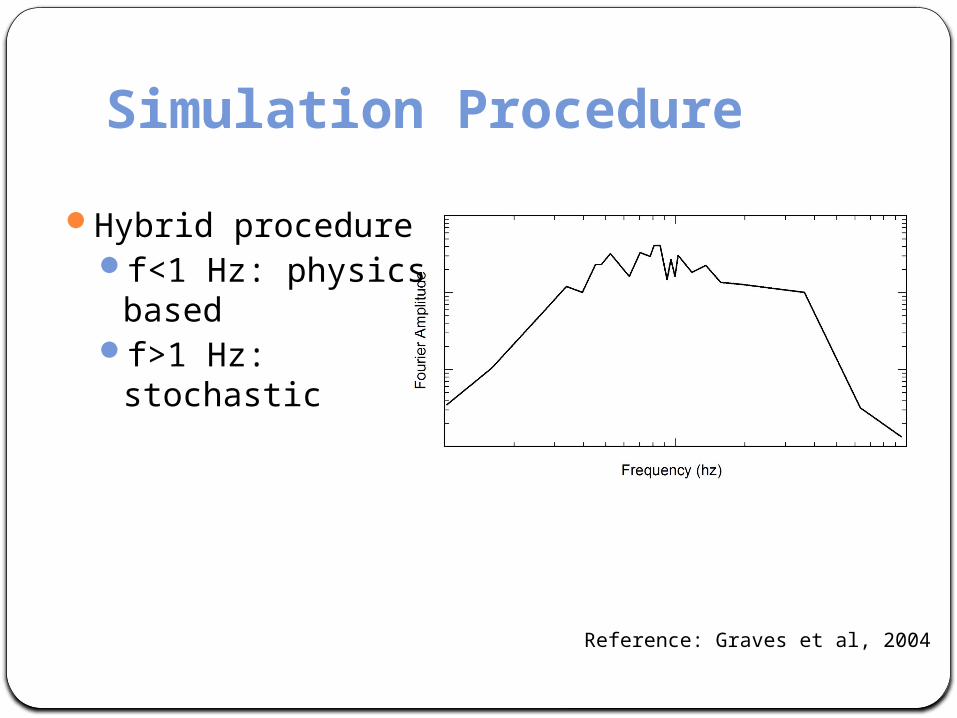
Simulation Procedure
Hybrid proceduref<1 Hz: physics basedf>1 Hz: stochastic
Reference: Graves et al, 2004
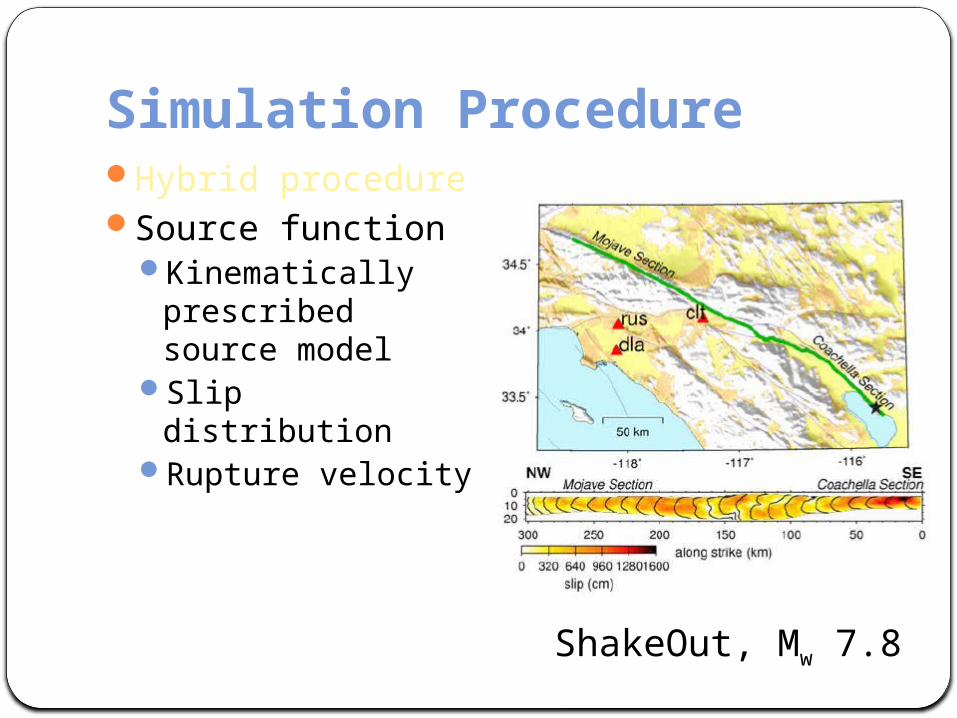
Simulation ProcedureHybrid procedureSource function
Kinematically prescribed source model
Slip distributionRupture velocity
ShakeOut, Mw 7.8
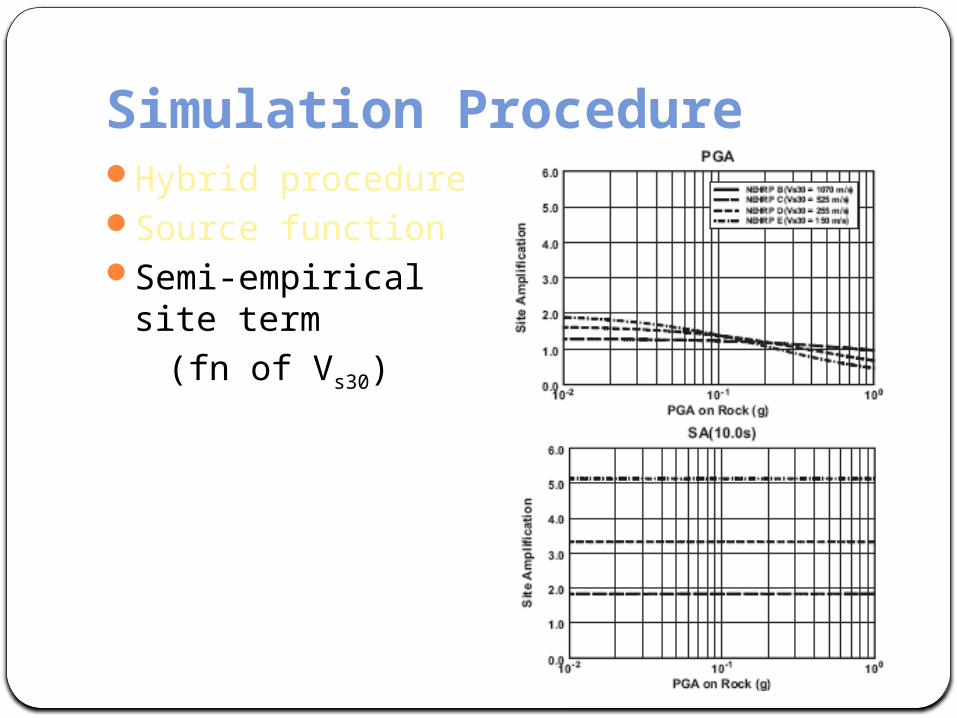
Hybrid procedureSource functionSemi-empirical site term (fn of Vs30)
Simulation Procedure
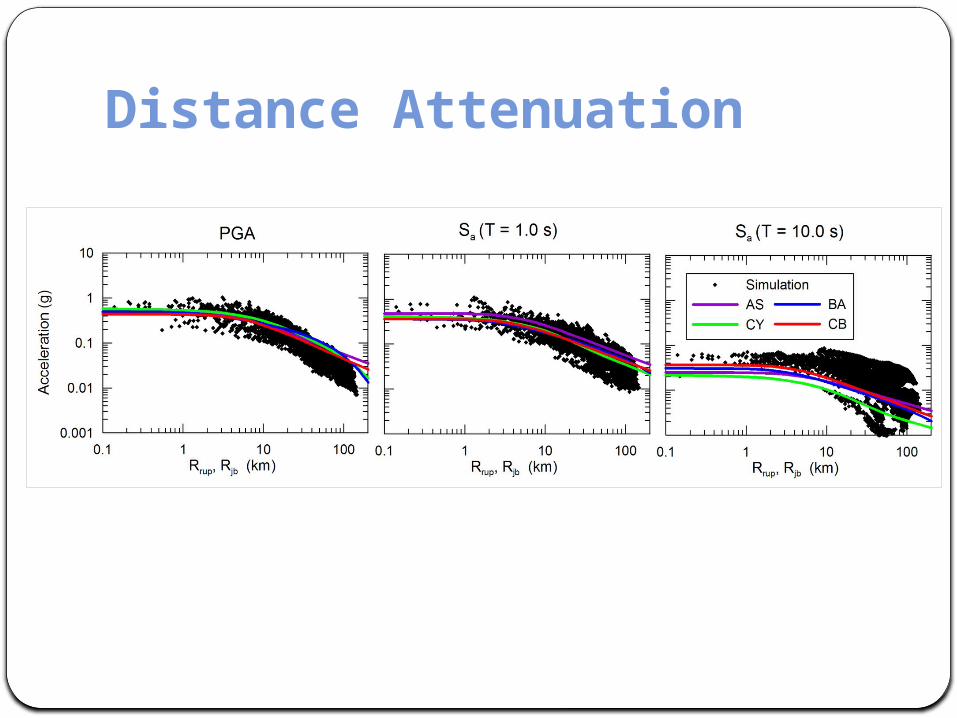
Distance Attenuation
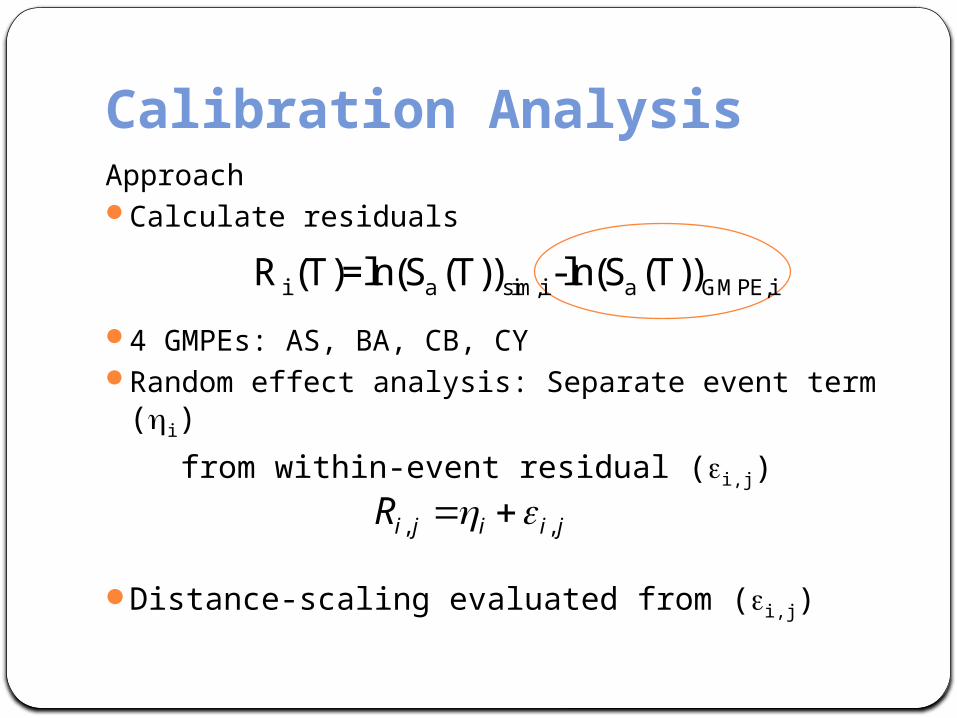
Calibration AnalysisApproachCalculate residuals
4 GMPEs: AS, BA, CB, CYRandom effect analysis: Separate event term (hi)
from within-event residual (ei,j)
Distance-scaling evaluated from (ei,j)
, ,i j i i jR
i a sim,i a GMPE,iR (T)=ln(S (T)) -ln(S (T))
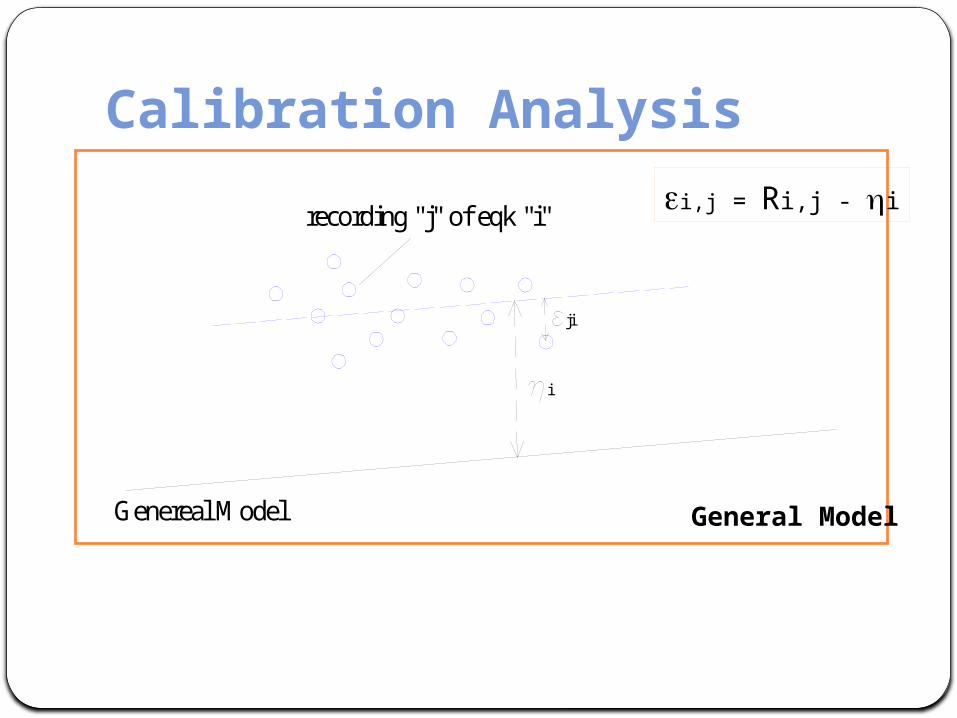
Calibration Analysis
recording "j" of eqk "i"
i
Genereal Model
ji
General Model
ei,j = Ri,j - hi
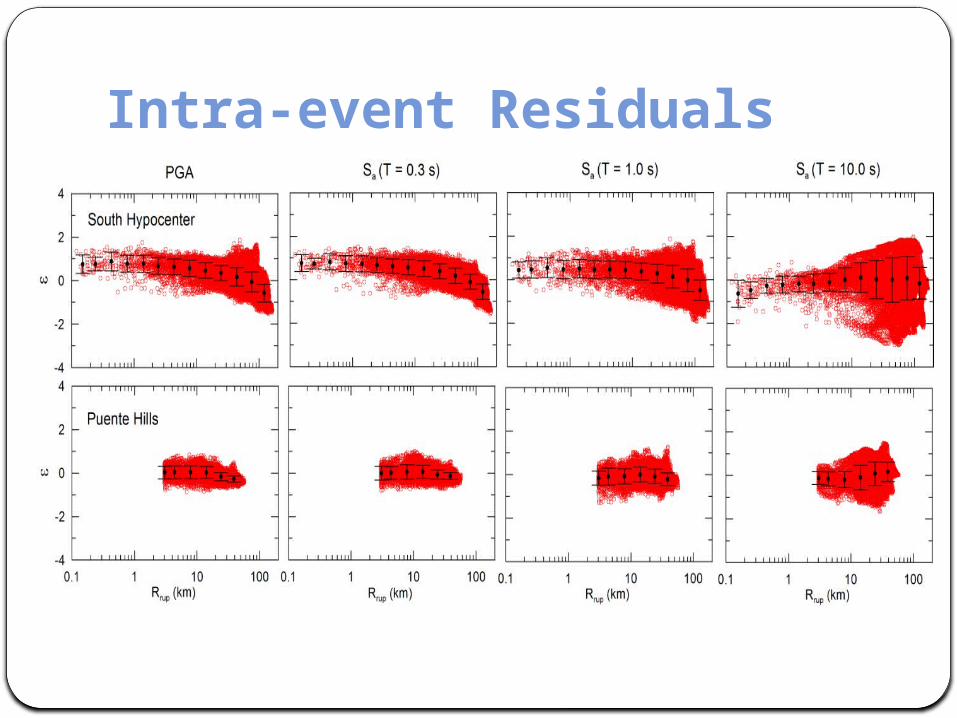
Intra-event Residuals
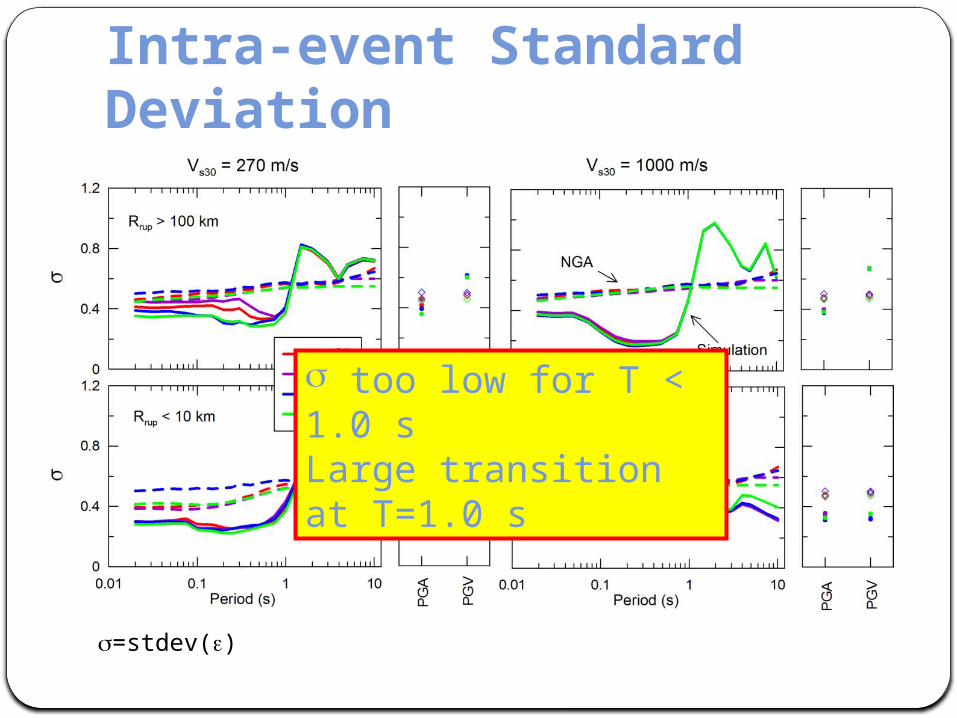
Intra-event Standard Deviation
s too low for T < 1.0 sLarge transition at T=1.0 s
s=stdev(e)
Calibration of Hybrid Simulation ProcedureFocus on high frequency stochastic modelControlling parameters
Source parameters: Stress drop, slip function, rise time, rupture velocity
Path parameters: Distance, crustal velocity & damping (Q)Site parameters: Near surface crustal velocity, shallow site
term (Vs30)Parameter selected for remove distance attenuation biasProcedure to increase intra-event standard deviation
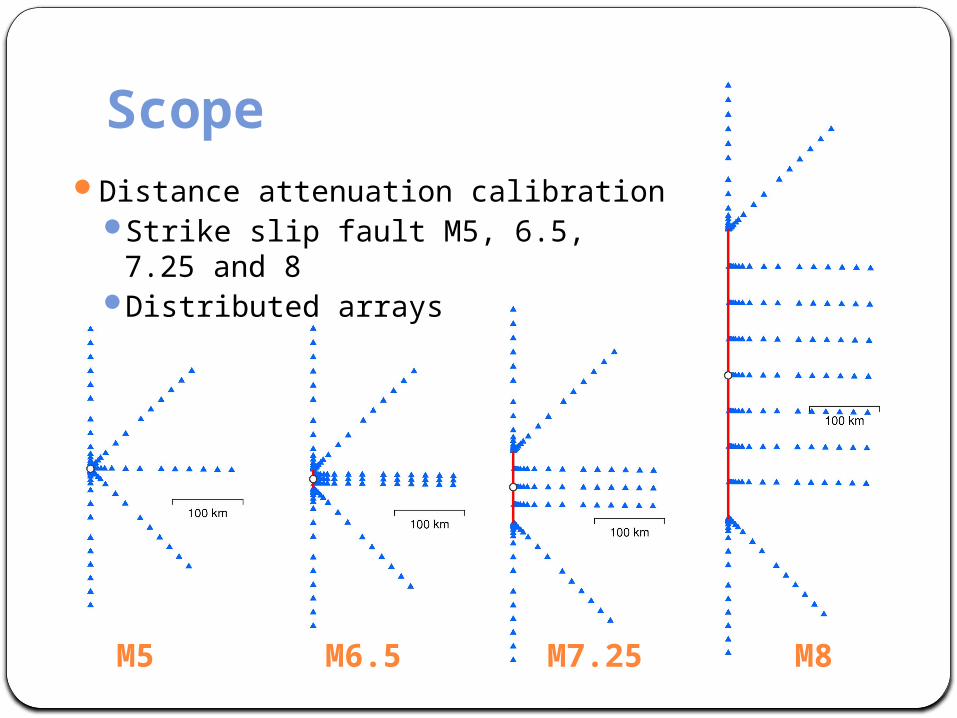
ScopeDistance attenuation calibration
Strike slip fault M5, 6.5, 7.25 and 8Distributed arrays
M5 M6.5 M7.25 M8
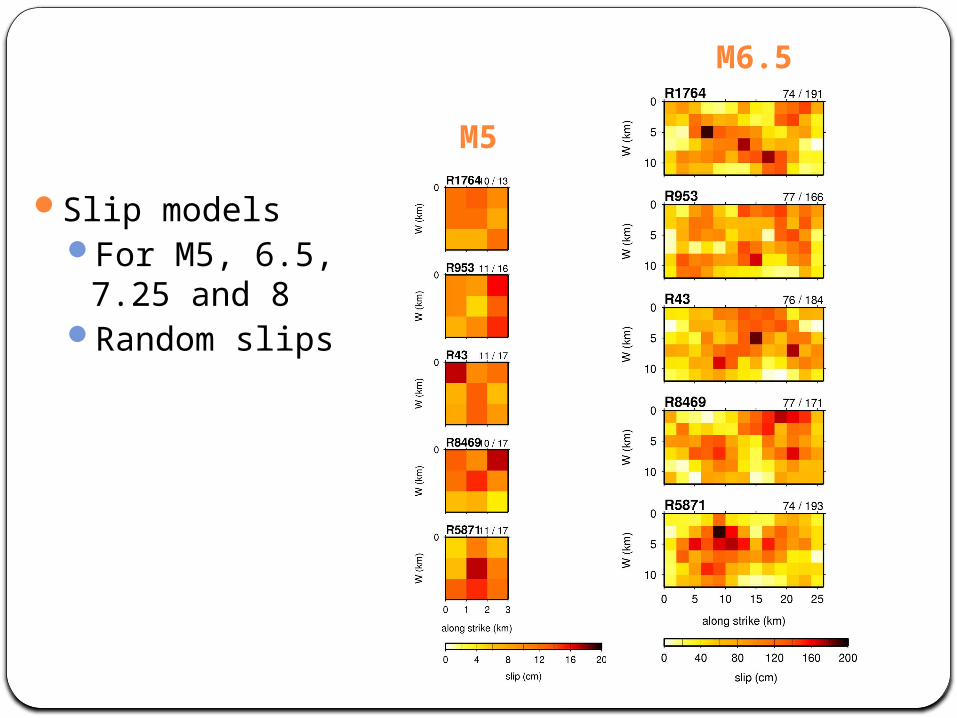
Slip modelsFor M5, 6.5, 7.25 and 8Random slips
M5
M6.5
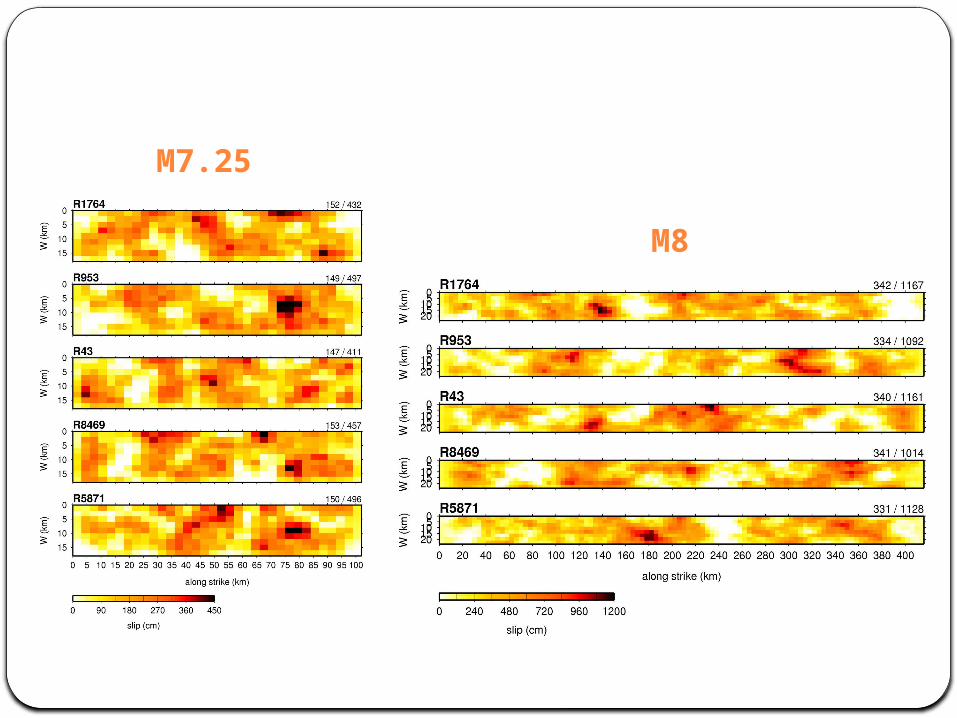
M7.25
M8
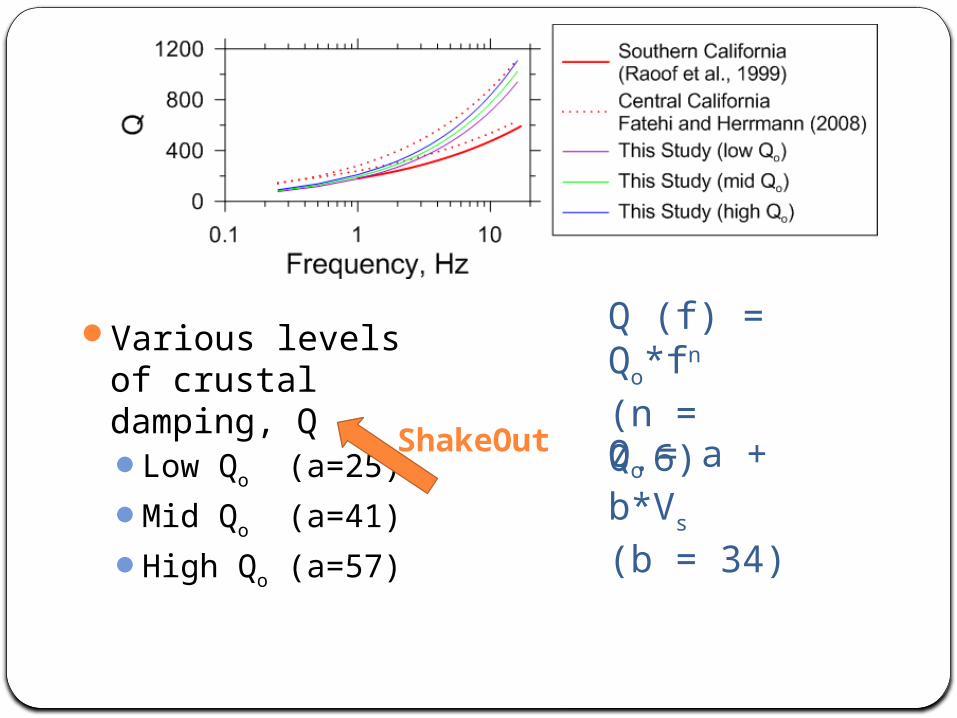
Various levels of crustal damping, QLow Qo (a=25)Mid Qo (a=41)High Qo (a=57)
Q (f) = Qo*fn
(n = 0.6)
Qo = a + b*Vs
(b = 34)
ShakeOut
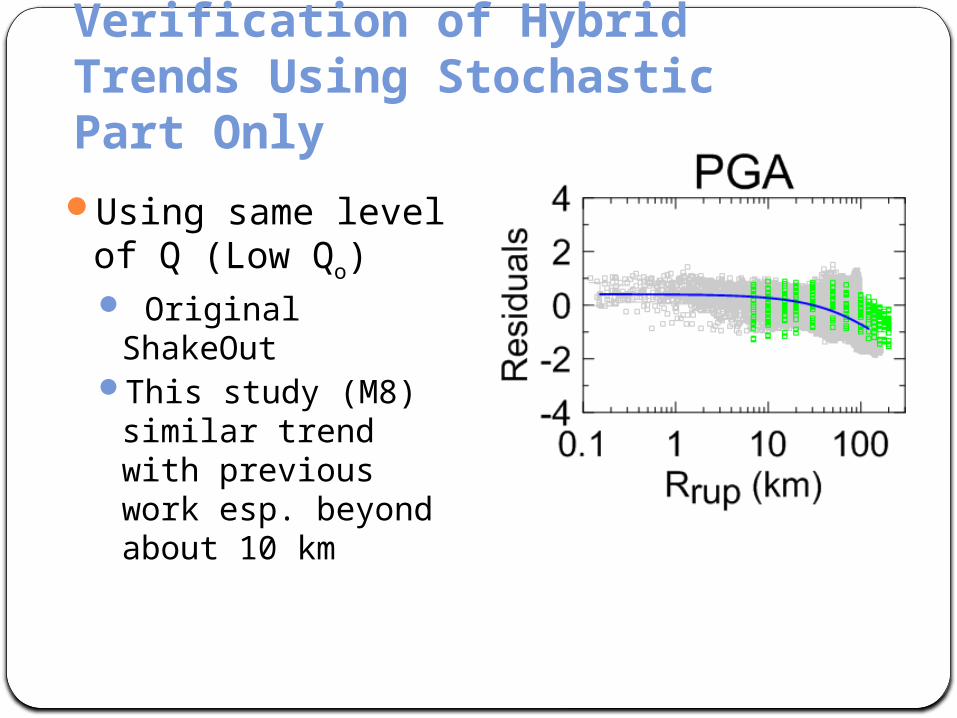
Verification of Hybrid Trends Using Stochastic Part OnlyUsing same level of Q
(Low Qo) Original ShakeOutThis study (M8) similar
trend with previous work esp. beyond about 10 km
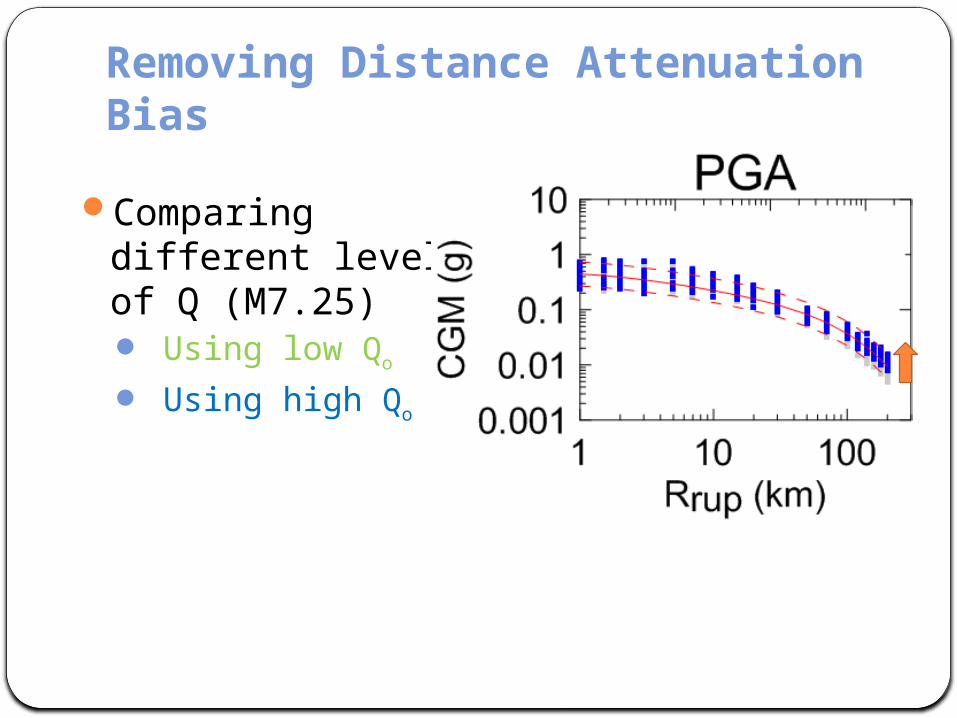
Removing Distance Attenuation Bias
Comparing different level of Q (M7.25) Using low Qo
Using high Qo
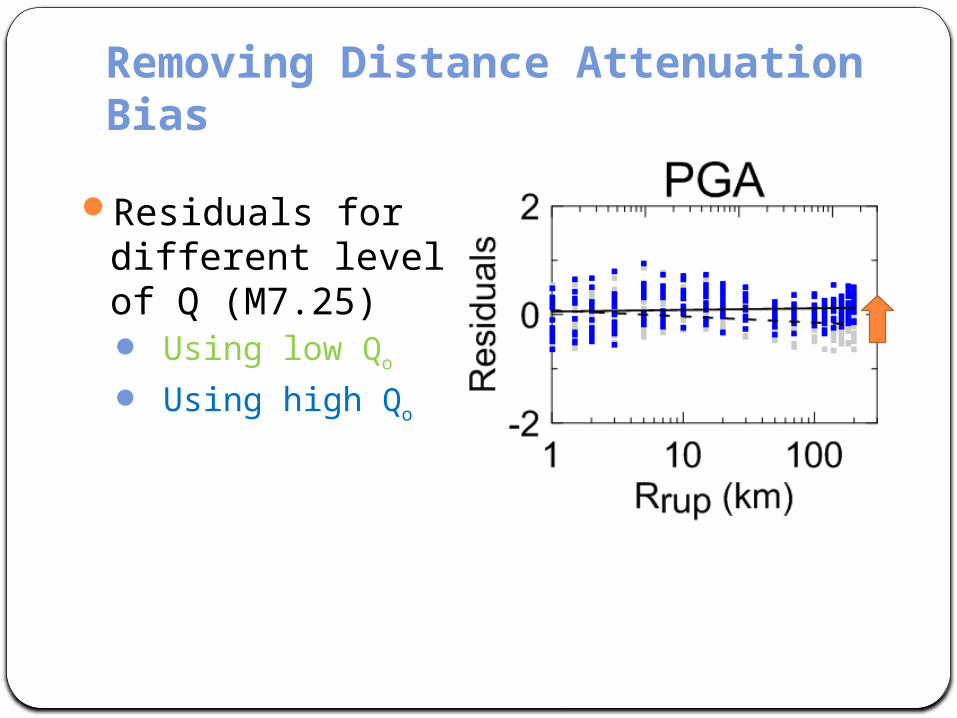
Removing Distance Attenuation Bias
Residuals for different level of Q (M7.25) Using low Qo
Using high Qo
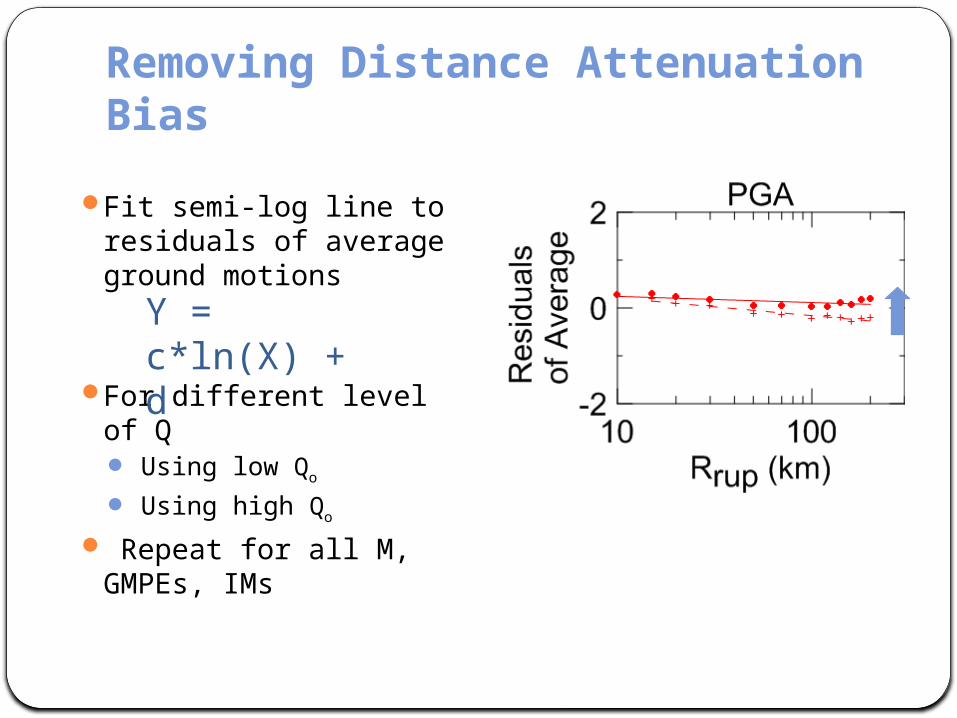
Removing Distance Attenuation Bias
Fit semi-log line to residuals of average ground motions
For different level of Q Using low Qo
Using high Qo
Repeat for all M, GMPEs, IMs
Y = c*ln(X) + d
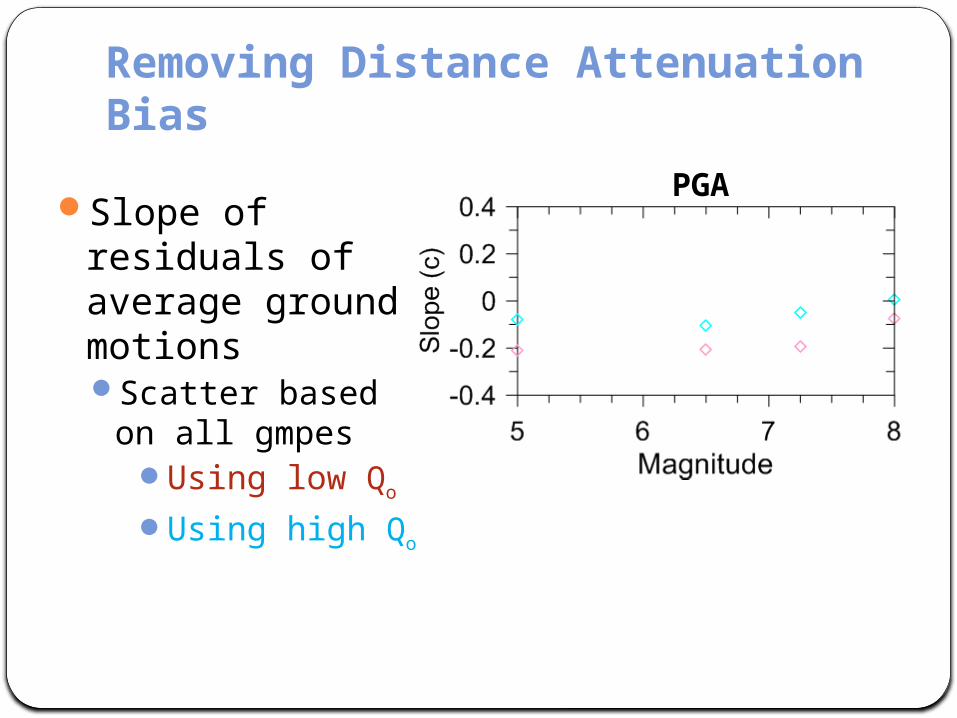
Removing Distance Attenuation Bias
Slope of residuals of average ground motionsScatter based on all
gmpesUsing low Qo
Using high Qo
PGA
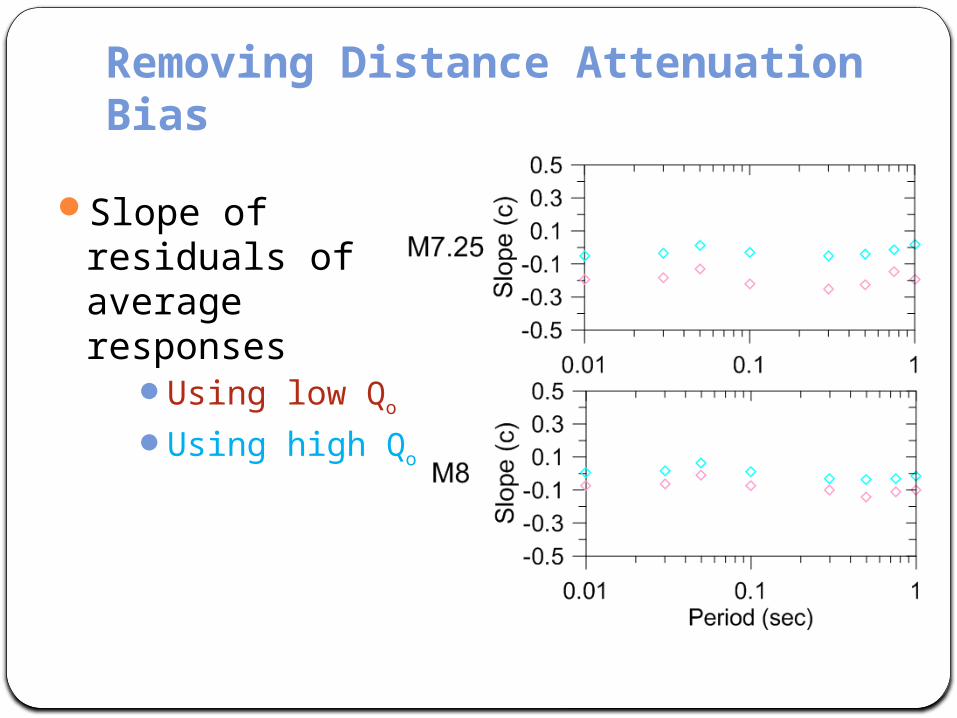
Removing Distance Attenuation Bias
Slope of residuals of average responses
Using low Qo
Using high Qo
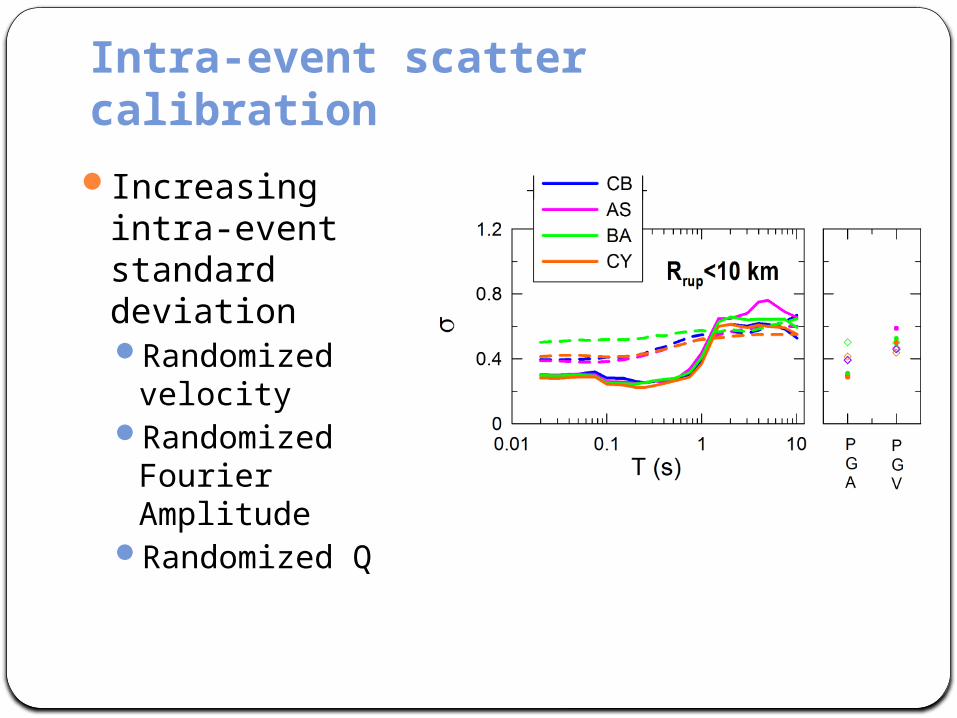
Intra-event scatter calibrationIncreasing intra-event
standard deviationRandomized velocity Randomized Fourier
AmplitudeRandomized Q
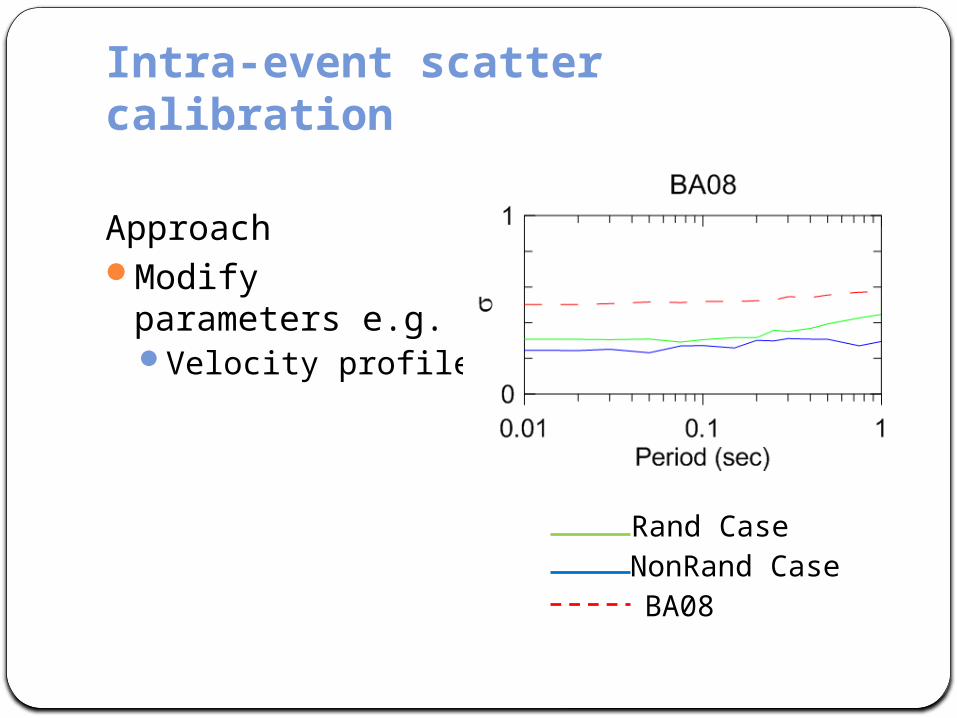
ApproachModify parameters e.g.
Velocity profile
Intra-event scatter calibration
Rand CaseNonRand CaseBA08
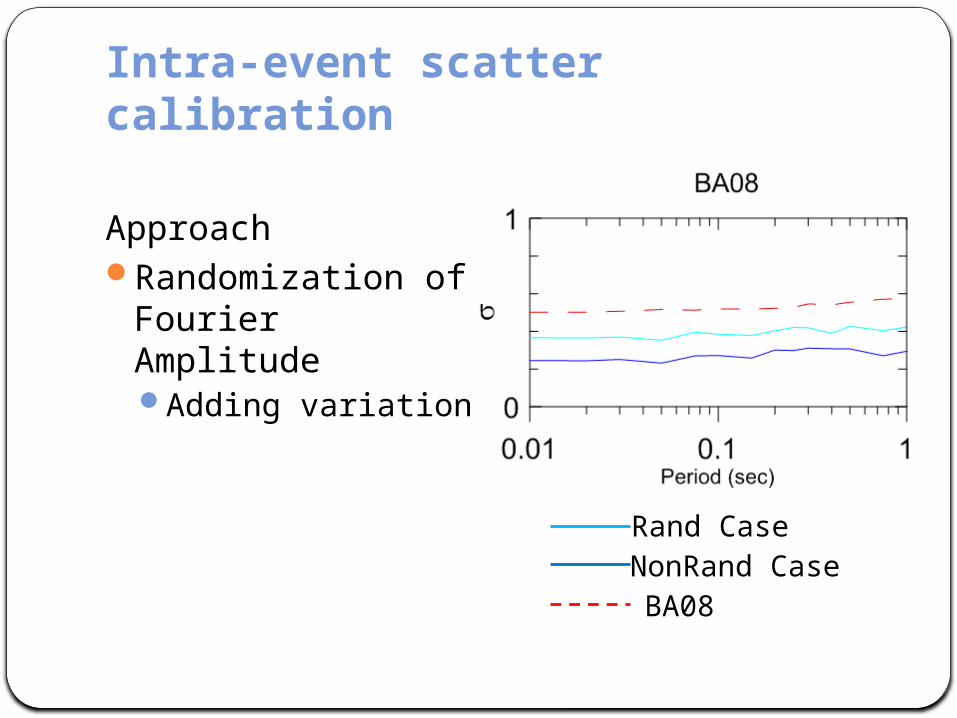
ApproachRandomization of
Fourier AmplitudeAdding variation
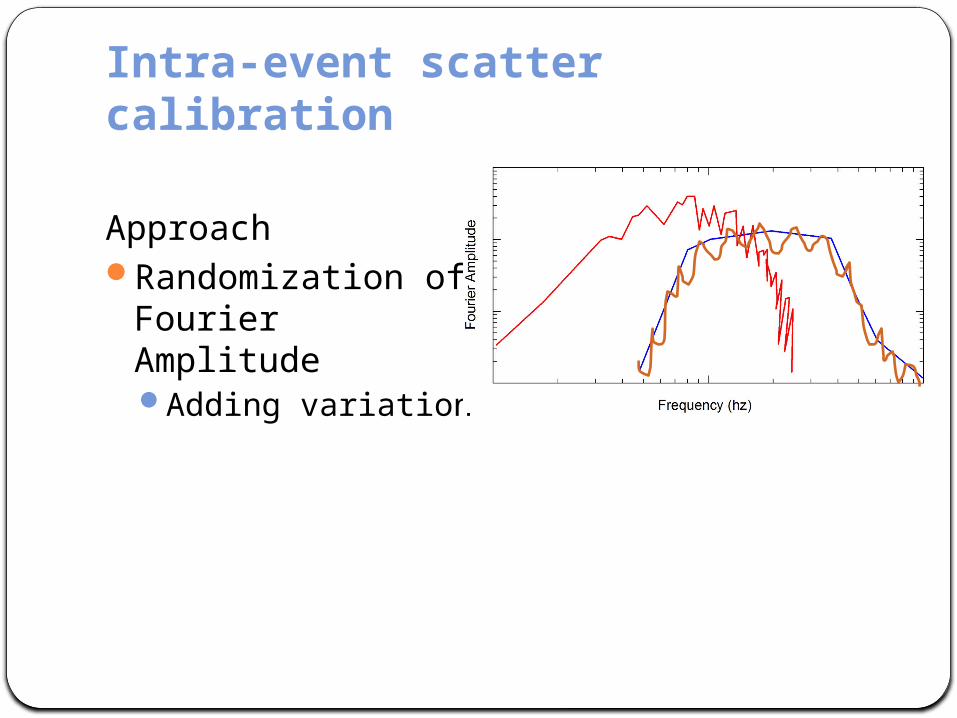
Intra-event scatter calibration
ApproachRandomization of
Fourier AmplitudeAdding variation
Intra-event scatter calibration
Rand CaseNonRand CaseBA08
Concluding RemarksCalibrated simulation procedures needed for
engineering practiceValidation process reveals:
Faster distance attenuation at shorter periodsLow intra-event standard deviation T<1s
Cont’dCalibration process reveals:
Possible to get slower distance attenuation by using higher Q
Randomization of Fourier Spectrum gives better results than randomization of velocity
More? Implementation fully hybrid simulation with revised
Q and Vs
Thank you