Embed Size (px)
Citation preview
33rd
IEEE PVSC, San Diego, CA 2008 1
COMPARISON OF PV SYSTEM PERFORMANCE-MODEL PREDICTIONS WITH MEASURED PV SYSTEM PERFORMANCE
Christopher P. Cameron, William E. Boyson, Daniel M. Riley Sandia National Laboratories, Albuquerque, NM 87185
ABSTRACT
The U.S. Department of Energy has supported development of the Solar Advisor Model (SAM) to provide a common platform for evaluation of the solar energy technologies being developed with the support of the Department. This report describes a detailed comparison of performance-model calculations within SAM to actual measured PV system performance in order to evaluate the ability of the models to accurately predict PV system energy production. This was accomplished by using measured meteorological and irradiance data as an input to the models, and then comparing model predictions of solar and PV system parameters to measured values from co-located PV arrays. The submodels within SAM which were examined include four radiation models, three module performance models, and an inverter model. The PVWATTS and PVMod models were also evaluated.
INTRODUCTION
Photovoltaic systems are often described and marketed in terms of the DC power rating of their modules, expressed in $’s/Watt. The DC power rating is usually at standard test conditions (STC). However, the value of a grid-connected PV system is a function of the energy produced, expressed in kilowatt-hours (kWh). Increasingly, systems are marketed in terms of their expected energy output at a particular site. System output may be guaranteed or the output of the system may be purchased under a power purchase agreement. Since the annual output of systems composed of different technologies or installed at different orientations is not proportional to the power rating of the systems, an annual performance model is needed to estimate system energy output.
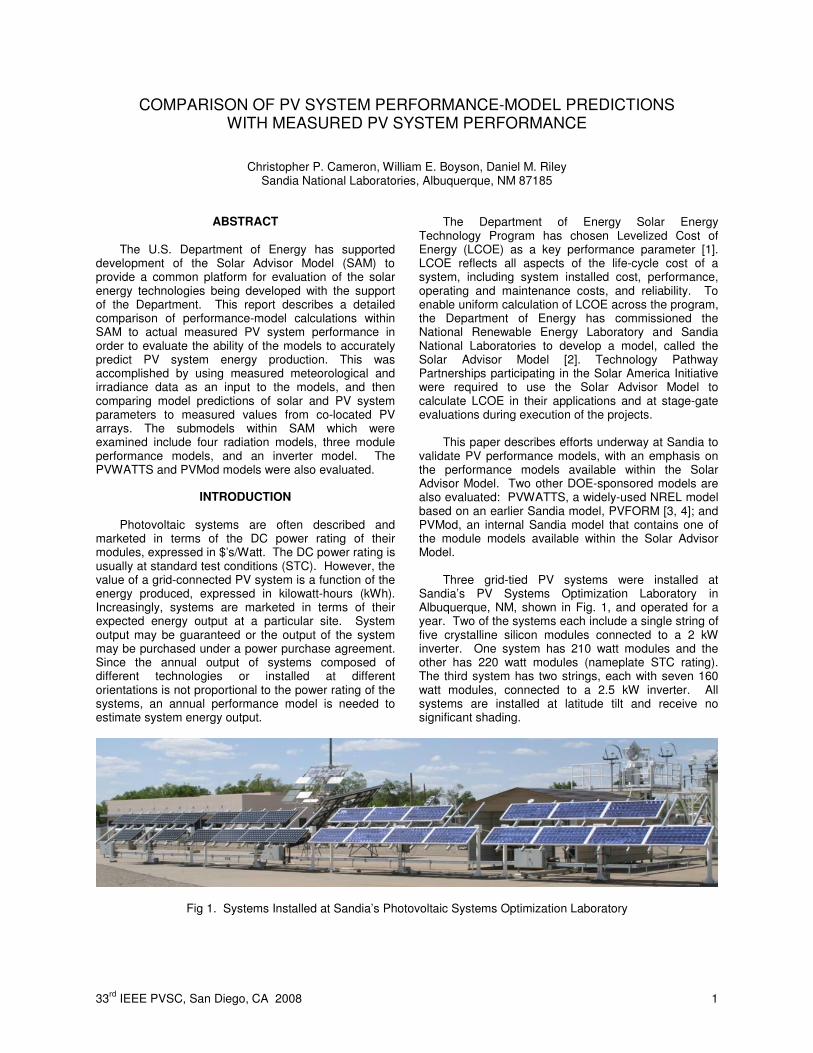
The Department of Energy Solar Energy Technology Program has chosen Levelized Cost of Energy (LCOE) as a key performance parameter [1]. LCOE reflects all aspects of the life-cycle cost of a system, including system installed cost, performance, operating and maintenance costs, and reliability. To enable uniform calculation of LCOE across the program, the Department of Energy has commissioned the National Renewable Energy Laboratory and Sandia National Laboratories to develop a model, called the Solar Advisor Model [2]. Technology Pathway Partnerships participating in the Solar America Initiative were required to use the Solar Advisor Model to calculate LCOE in their applications and at stage-gate evaluations during execution of the projects. This paper describes efforts underway at Sandia to validate PV performance models, with an emphasis on the performance models available within the Solar Advisor Model. Two other DOE-sponsored models are also evaluated: PVWATTS, a widely-used NREL model based on an earlier Sandia model, PVFORM [3, 4]; and PVMod, an internal Sandia model that contains one of the module models available within the Solar Advisor Model. Three grid-tied PV systems were installed at Sandia’s PV Systems Optimization Laboratory in Albuquerque, NM, shown in Fig. 1, and operated for a year. Two of the systems each include a single string of five crystalline silicon modules connected to a 2 kW inverter. One system has 210 watt modules and the other has 220 watt modules (nameplate STC rating). The third system has two strings, each with seven 160 watt modules, connected to a 2.5 kW inverter. All systems are installed at latitude tilt and receive no significant shading.
Fig 1. Systems Installed at Sandia’s Photovoltaic Systems Optimization Laboratory
33rd
IEEE PVSC, San Diego, CA 2008 2
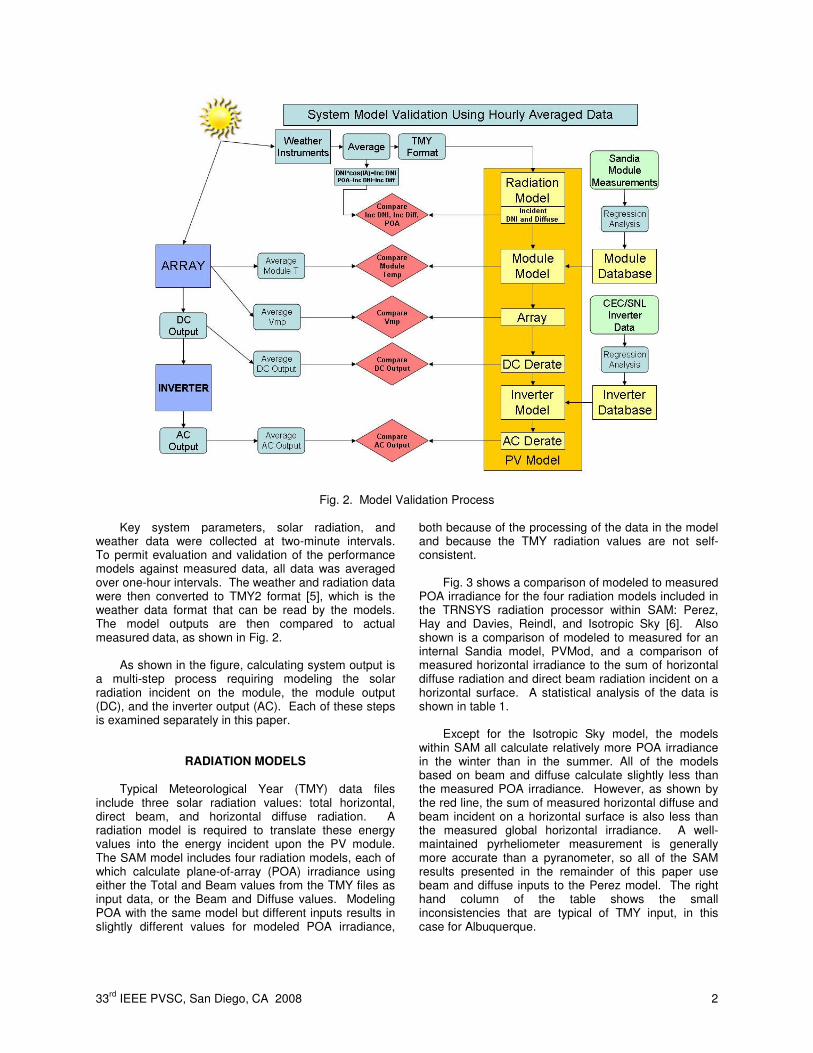
Fig. 2. Model Validation Process Key system parameters, solar radiation, and weather data were collected at two-minute intervals. To permit evaluation and validation of the performance models against measured data, all data was averaged over one-hour intervals. The weather and radiation data were then converted to TMY2 format [5], which is the weather data format that can be read by the models. The model outputs are then compared to actual measured data, as shown in Fig. 2. As shown in the figure, calculating system output is a multi-step process requiring modeling the solar radiation incident on the module, the module output (DC), and the inverter output (AC). Each of these steps is examined separately in this paper.
RADIATION MODELS
Typical Meteorological Year (TMY) data files include three solar radiation values: total horizontal, direct beam, and horizontal diffuse radiation. A radiation model is required to translate these energy values into the energy incident upon the PV module. The SAM model includes four radiation models, each of which calculate plane-of-array (POA) irradiance using either the Total and Beam values from the TMY files as input data, or the Beam and Diffuse values. Modeling POA with the same model but different inputs results in slightly different values for modeled POA irradiance,
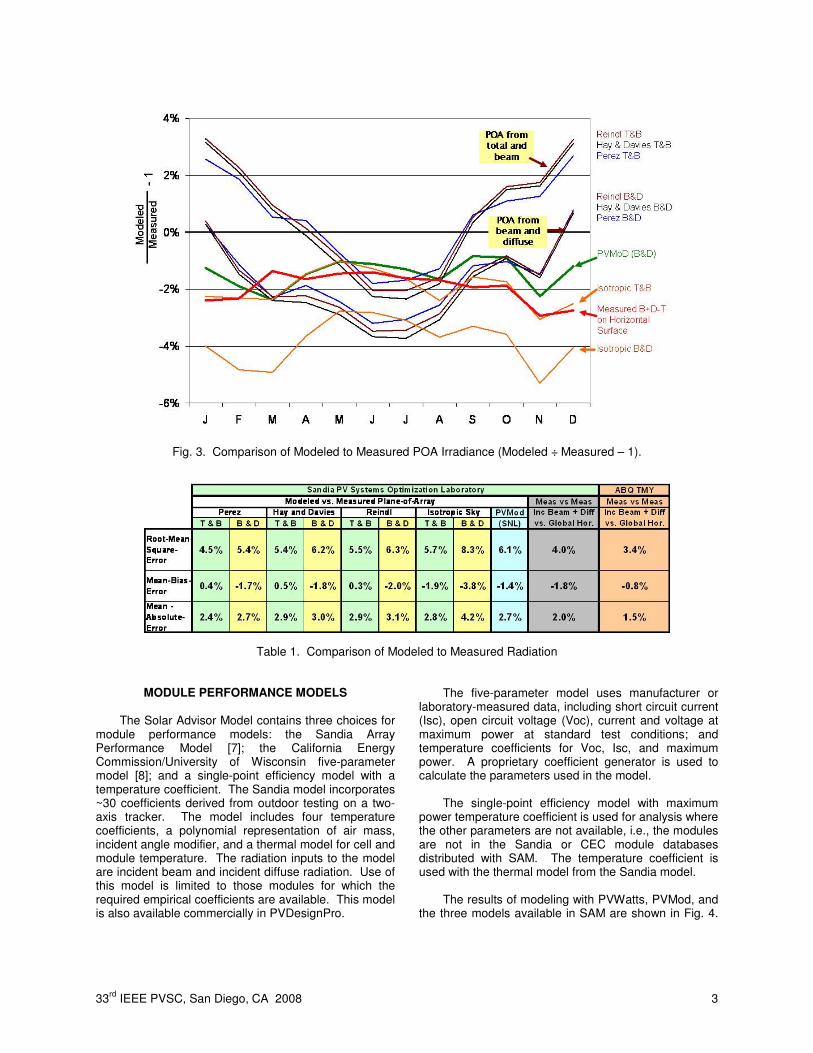
both because of the processing of the data in the model and because the TMY radiation values are not self-consistent. Fig. 3 shows a comparison of modeled to measured POA irradiance for the four radiation models included in the TRNSYS radiation processor within SAM: Perez, Hay and Davies, Reindl, and Isotropic Sky [6]. Also shown is a comparison of modeled to measured for an internal Sandia model, PVMod, and a comparison of measured horizontal irradiance to the sum of horizontal diffuse radiation and direct beam radiation incident on a horizontal surface. A statistical analysis of the data is shown in table 1. Except for the Isotropic Sky model, the models within SAM all calculate relatively more POA irradiance in the winter than in the summer. All of the models based on beam and diffuse calculate slightly less than the measured POA irradiance. However, as shown by the red line, the sum of measured horizontal diffuse and beam incident on a horizontal surface is also less than the measured global horizontal irradiance. A well-maintained pyrheliometer measurement is generally more accurate than a pyranometer, so all of the SAM results presented in the remainder of this paper use beam and diffuse inputs to the Perez model. The right hand column of the table shows the small inconsistencies that are typical of TMY input, in this case for Albuquerque.
33rd
IEEE PVSC, San Diego, CA 2008 3
Fig. 3. Comparison of Modeled to Measured POA Irradiance (Modeled ÷ Measured – 1).
Table 1. Comparison of Modeled to Measured Radiation
MODULE PERFORMANCE MODELS
The Solar Advisor Model contains three choices for module performance models: the Sandia Array Performance Model [7]; the California Energy Commission/University of Wisconsin five-parameter model [8]; and a single-point efficiency model with a temperature coefficient. The Sandia model incorporates ~30 coefficients derived from outdoor testing on a two-axis tracker. The model includes four temperature coefficients, a polynomial representation of air mass, incident angle modifier, and a thermal model for cell and module temperature. The radiation inputs to the model are incident beam and incident diffuse radiation. Use of this model is limited to those modules for which the required empirical coefficients are available. This model is also available commercially in PVDesignPro.
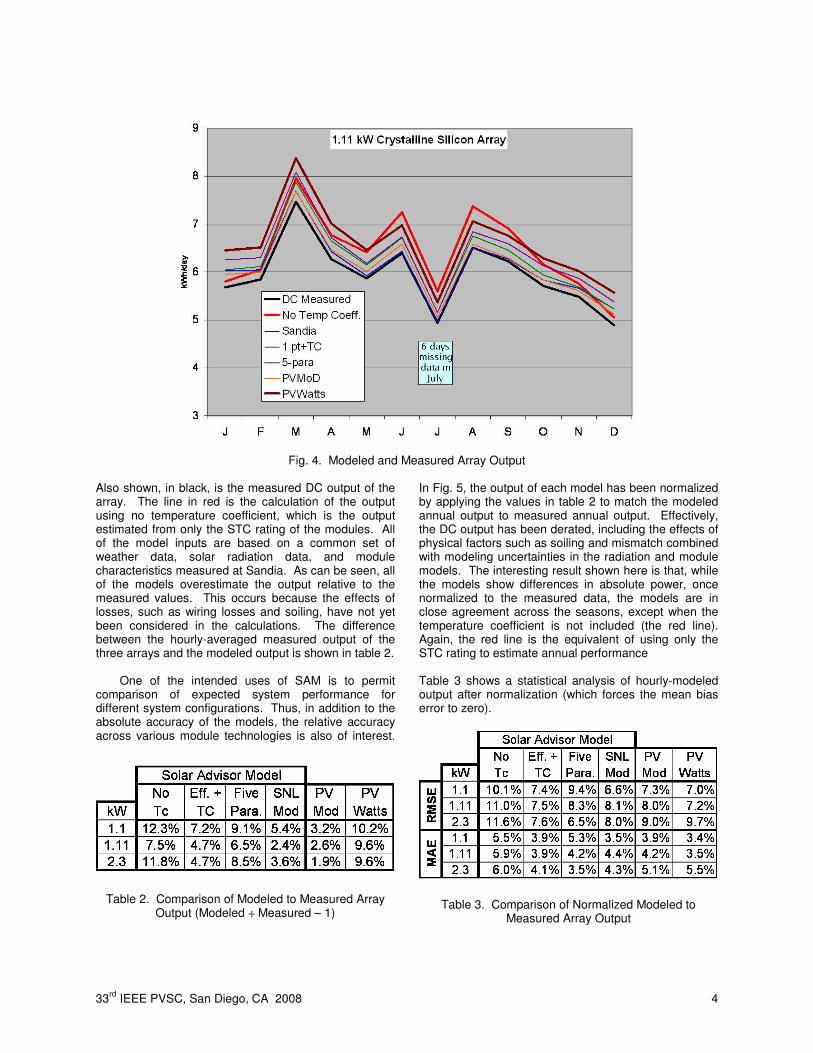
The five-parameter model uses manufacturer or laboratory-measured data, including short circuit current (Isc), open circuit voltage (Voc), current and voltage at maximum power at standard test conditions; and temperature coefficients for Voc, Isc, and maximum power. A proprietary coefficient generator is used to calculate the parameters used in the model. The single-point efficiency model with maximum power temperature coefficient is used for analysis where the other parameters are not available, i.e., the modules are not in the Sandia or CEC module databases distributed with SAM. The temperature coefficient is used with the thermal model from the Sandia model. The results of modeling with PVWatts, PVMod, and the three models available in SAM are shown in Fig. 4.
33rd
IEEE PVSC, San Diego, CA 2008 4
Fig. 4. Modeled and Measured Array Output
Also shown, in black, is the measured DC output of the array. The line in red is the calculation of the output using no temperature coefficient, which is the output estimated from only the STC rating of the modules. All of the model inputs are based on a common set of weather data, solar radiation data, and module characteristics measured at Sandia. As can be seen, all of the models overestimate the output relative to the measured values. This occurs because the effects of losses, such as wiring losses and soiling, have not yet been considered in the calculations. The difference between the hourly-averaged measured output of the three arrays and the modeled output is shown in table 2.
One of the intended uses of SAM is to permit comparison of expected system performance for different system configurations. Thus, in addition to the absolute accuracy of the models, the relative accuracy across various module technologies is also of interest.
Table 2. Comparison of Modeled to Measured Array Output (Modeled ÷ Measured – 1)
In Fig. 5, the output of each model has been normalized by applying the values in table 2 to match the modeled annual output to measured annual output. Effectively, the DC output has been derated, including the effects of physical factors such as soiling and mismatch combined with modeling uncertainties in the radiation and module models. The interesting result shown here is that, while the models show differences in absolute power, once normalized to the measured data, the models are in close agreement across the seasons, except when the temperature coefficient is not included (the red line). Again, the red line is the equivalent of using only the STC rating to estimate annual performance Table 3 shows a statistical analysis of hourly-modeled output after normalization (which forces the mean bias error to zero).
Table 3. Comparison of Normalized Modeled to Measured Array Output
33rd
IEEE PVSC, San Diego, CA 2008 5
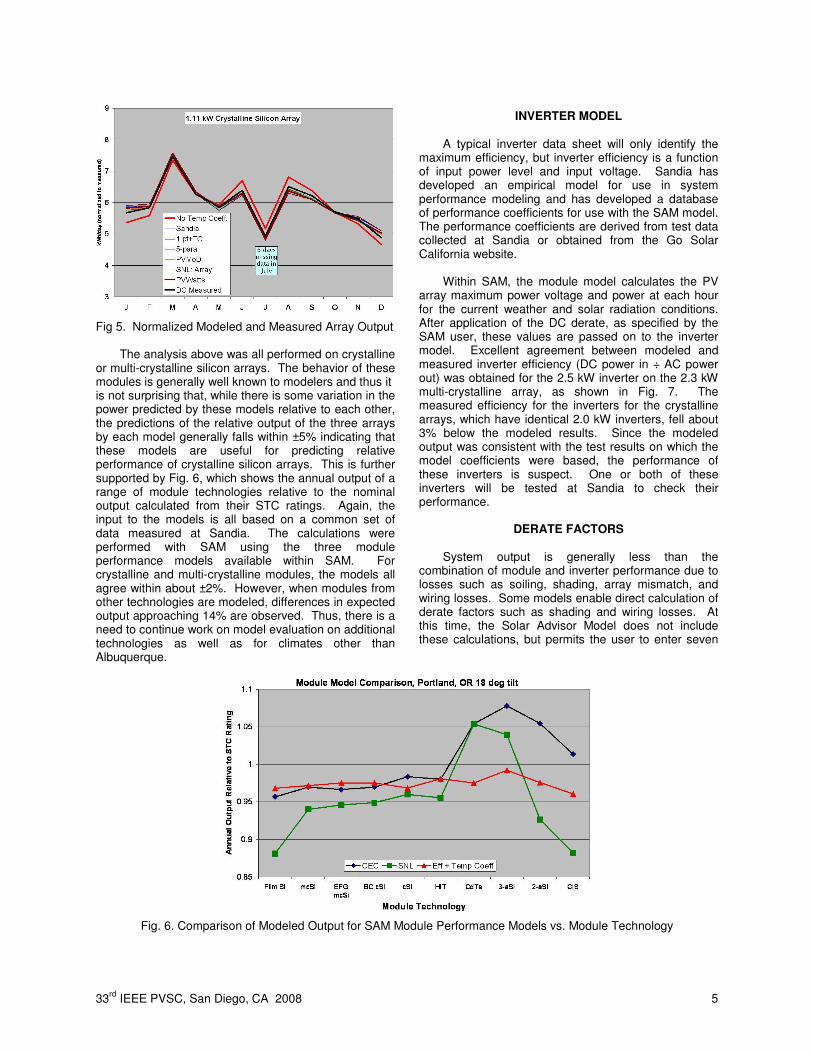
Fig 5. Normalized Modeled and Measured Array Output The analysis above was all performed on crystalline or multi-crystalline silicon arrays. The behavior of these modules is generally well known to modelers and thus it is not surprising that, while there is some variation in the power predicted by these models relative to each other, the predictions of the relative output of the three arrays by each model generally falls within ±5% indicating that these models are useful for predicting relative performance of crystalline silicon arrays. This is further supported by Fig. 6, which shows the annual output of a range of module technologies relative to the nominal output calculated from their STC ratings. Again, the input to the models is all based on a common set of data measured at Sandia. The calculations were performed with SAM using the three module performance models available within SAM. For crystalline and multi-crystalline modules, the models all agree within about ±2%. However, when modules from other technologies are modeled, differences in expected output approaching 14% are observed. Thus, there is a need to continue work on model evaluation on additional technologies as well as for climates other than Albuquerque.
INVERTER MODEL
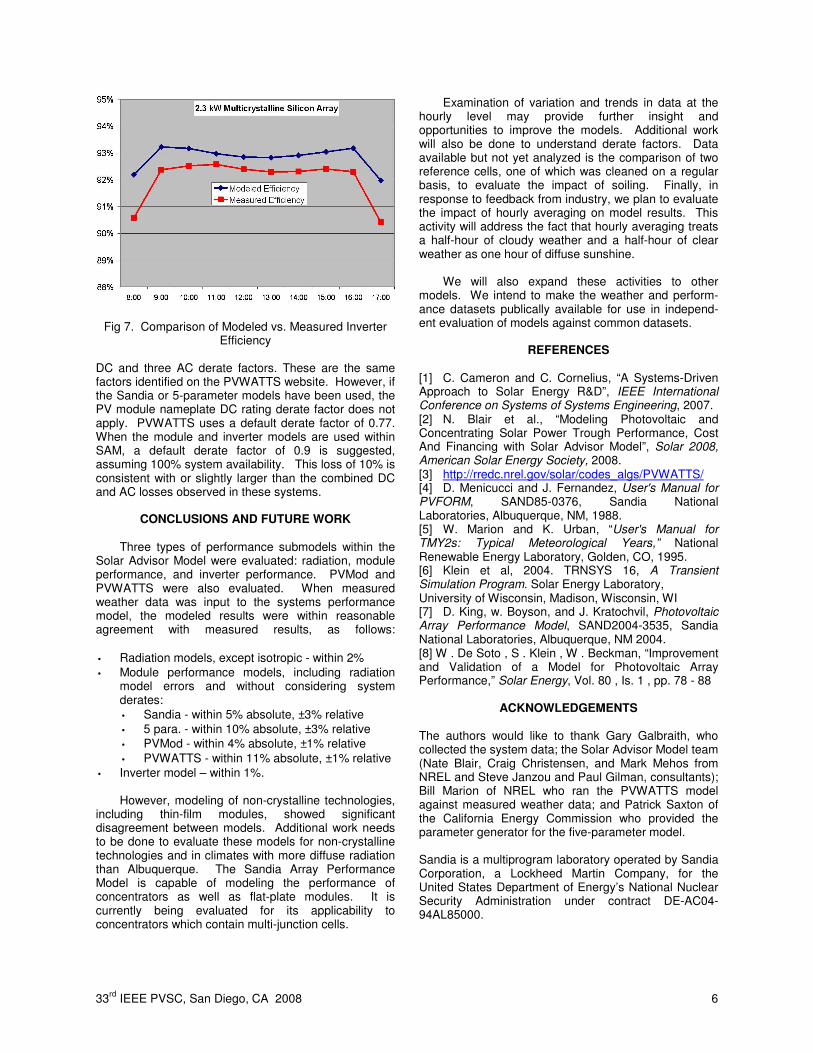
A typical inverter data sheet will only identify the maximum efficiency, but inverter efficiency is a function of input power level and input voltage. Sandia has developed an empirical model for use in system performance modeling and has developed a database of performance coefficients for use with the SAM model. The performance coefficients are derived from test data collected at Sandia or obtained from the Go Solar California website. Within SAM, the module model calculates the PV array maximum power voltage and power at each hour for the current weather and solar radiation conditions. After application of the DC derate, as specified by the SAM user, these values are passed on to the inverter model. Excellent agreement between modeled and measured inverter efficiency (DC power in ÷ AC power out) was obtained for the 2.5 kW inverter on the 2.3 kW multi-crystalline array, as shown in Fig. 7. The measured efficiency for the inverters for the crystalline arrays, which have identical 2.0 kW inverters, fell about 3% below the modeled results. Since the modeled output was consistent with the test results on which the model coefficients were based, the performance of these inverters is suspect. One or both of these inverters will be tested at Sandia to check their performance.
DERATE FACTORS
System output is generally less than the combination of module and inverter performance due to losses such as soiling, shading, array mismatch, and wiring losses. Some models enable direct calculation of derate factors such as shading and wiring losses. At this time, the Solar Advisor Model does not include these calculations, but permits the user to enter seven
Fig. 6. Comparison of Modeled Output for SAM Module Performance Models vs. Module Technology
33rd
IEEE PVSC, San Diego, CA 2008 6
Fig 7. Comparison of Modeled vs. Measured Inverter
Efficiency DC and three AC derate factors. These are the same factors identified on the PVWATTS website. However, if the Sandia or 5-parameter models have been used, the PV module nameplate DC rating derate factor does not apply. PVWATTS uses a default derate factor of 0.77. When the module and inverter models are used within SAM, a default derate factor of 0.9 is suggested, assuming 100% system availability. This loss of 10% is consistent with or slightly larger than the combined DC and AC losses observed in these systems.
CONCLUSIONS AND FUTURE WORK
Three types of performance submodels within the Solar Advisor Model were evaluated: radiation, module performance, and inverter performance. PVMod and PVWATTS were also evaluated. When measured weather data was input to the systems performance model, the modeled results were within reasonable agreement with measured results, as follows: • Radiation models, except isotropic - within 2% • Module performance models, including radiation
model errors and without considering system derates: • Sandia - within 5% absolute, ±3% relative • 5 para. - within 10% absolute, ±3% relative • PVMod - within 4% absolute, ±1% relative • PVWATTS - within 11% absolute, ±1% relative
• Inverter model – within 1%. However, modeling of non-crystalline technologies, including thin-film modules, showed significant disagreement between models. Additional work needs to be done to evaluate these models for non-crystalline technologies and in climates with more diffuse radiation than Albuquerque. The Sandia Array Performance Model is capable of modeling the performance of concentrators as well as flat-plate modules. It is currently being evaluated for its applicability to concentrators which contain multi-junction cells.
Examination of variation and trends in data at the hourly level may provide further insight and opportunities to improve the models. Additional work will also be done to understand derate factors. Data available but not yet analyzed is the comparison of two reference cells, one of which was cleaned on a regular basis, to evaluate the impact of soiling. Finally, in response to feedback from industry, we plan to evaluate the impact of hourly averaging on model results. This activity will address the fact that hourly averaging treats a half-hour of cloudy weather and a half-hour of clear weather as one hour of diffuse sunshine. We will also expand these activities to other models. We intend to make the weather and perform-ance datasets publically available for use in independ-ent evaluation of models against common datasets.
REFERENCES
[1] C. Cameron and C. Cornelius, “A Systems-Driven Approach to Solar Energy R&D”, IEEE International Conference on Systems of Systems Engineering, 2007. [2] N. Blair et al., “Modeling Photovoltaic and Concentrating Solar Power Trough Performance, Cost And Financing with Solar Advisor Model”, Solar 2008, American Solar Energy Society, 2008. [3] http://rredc.nrel.gov/solar/codes_algs/PVWATTS/ [4] D. Menicucci and J. Fernandez, User's Manual for PVFORM, SAND85-0376, Sandia National Laboratories, Albuquerque, NM, 1988. [5] W. Marion and K. Urban, “User's Manual for TMY2s: Typical Meteorological Years,” National Renewable Energy Laboratory, Golden, CO, 1995. [6] Klein et al, 2004. TRNSYS 16, A Transient Simulation Program. Solar Energy Laboratory, University of Wisconsin, Madison, Wisconsin, WI [7] D. King, w. Boyson, and J. Kratochvil, Photovoltaic Array Performance Model, SAND2004-3535, Sandia National Laboratories, Albuquerque, NM 2004. [8] W . De Soto , S . Klein , W . Beckman, “Improvement and Validation of a Model for Photovoltaic Array Performance,” Solar Energy, Vol. 80 , Is. 1 , pp. 78 - 88
ACKNOWLEDGEMENTS
The authors would like to thank Gary Galbraith, who collected the system data; the Solar Advisor Model team (Nate Blair, Craig Christensen, and Mark Mehos from NREL and Steve Janzou and Paul Gilman, consultants); Bill Marion of NREL who ran the PVWATTS model against measured weather data; and Patrick Saxton of the California Energy Commission who provided the parameter generator for the five-parameter model. Sandia is a multiprogram laboratory operated by Sandia Corporation, a Lockheed Martin Company, for the United States Department of Energy’s National Nuclear Security Administration under contract DE-AC04-94AL85000.