Embed Size (px)
Citation preview
International Journal of Pharmaceutics, 48 (1988) 207-215 207 Elsevier
IJP 01633
Comparison of polyethylene glycol, polyvinylpyrrolidone and urea as excipients for solid dispersion systems of miconazole nitrate
Masoud R. Jafari, August G. Danti and I. Ahmed School of Pharmacy, Northeast Louisiana Unioersity, Monroe, LA 71209 (U.S.A.)
(Received 10 December 1988) (Modified version received 9 June 1988)
(Accepted 10 June 1988)
Key words: Solid dispersion; Miconazole nitrate; Polyvinylpyrrolidone; Urea; Polyethylene glycol 6000; Dissolution
Summary
The objective of this investigation was to exanaine the feasibility of preparing fast-release solid dispersions of miconazole nitrate (MN), using 3 different water-soluble excipients: polyethylene glycol (PEG-6000), polyvinylpyrrolidone (PVP-10,000) and urea. Solid dispersions of miconazole were prepared by fusion or coprecipitation from ethanol. The phase diagrams of the MN-PEG dispersions were characteristic of a monotectic system, the MN-urea dispersions of a simple eutectic system with a eutectic composit ion of 80% MN and 20% urea, and the MN-PVP dispersions of a continuous solid solution. Solubilization and wetting of the drug both favored PEG and urea over PVP in promoting the dissolution of MN. Accordingly, a 7-fold increase in the dissolution rate of MN was achieved with both PEG and urea, while the dispersion of M N in PVP resulted in only a two-fold enhancement. The coprecipitated dispersion of MN in 80% w / w PEG and fused dispersions of MN in 80% w / w urea gave comparable results, and the highest initial dissolution rates among samples studied. Based on the results of this investigation solubilization and wetting were found to be more important than particle size reduction as a means of increasing the dissolution rate of MN.
Introduction
Solid dispersion represents a useful pharmaceu- tical technique for increasing the dissolution, ab- sorption, and therapeutic efficacy of drugs in dosage forms (Mayersohn and Gibaldi, 1966; Chiou and Riegelman, 1969). The properties, per- formance, and practical applications of solid dis- persions depends on factors such as: (a) the method of preparation, (b) composition, (c) selec- tion of a suitable carrier, and (d) physicochemical
Correspondence: I. Ahmed, Present address." Pfizer Central Research, Eastern Point Road, Groton, CT 06340, U.S.A.
properties of the drug (Chiou and Riegelman, 1971; Hajratwala, 1974). Therefore, a thorough understanding of these factors are necessary to formulate an effective solid dispersion dosage form for a particular drug.
The primary purpose of this study was to ex- amine the feasibility of preparing fast-release solid dispersions for the antifungal drug, miconazole nitrate (MN), using 3 different water-soluble car- riers: polyethylene glycol (PEG)-6000, polyvinyl- pyrrolidone (PVP)-10,000 and urea. The effect of method of preparation was studied specifically in the case of the MN-PEG 6000 systems.
MN (1-[2,(4,dichlorophenyl)-2-(2,4-dichloro- benzyloxy)ethyl] imidazole mononitrate is a
0378-5173/88/$03.50 © 1988 Elsevier Science Publishers B.V. (Biomedical Division)
208
broad-spectrum antifungal agent (Godefroi et al., 1969). It is a relatively non-toxic agent and has been used experimentally in the treatment of vari- ous systemic mycoses, including candidiasis, coc- cidiodomycosis, cryptococcosis and histoplasmosis (Brugans et al., 1972). It is presently available in both topical and i.v. dosage forms (Stranz, 1980).
In clinical studies it has been found that the oral bioavailability of MN is only 27% when ad- ministered as a microsuspension (Boelaert et al., 1976). Its poor bioavailability, attributed partly to its very low aqueous solubility, precludes the ef- fectiveness of the drug when administered orally. It was felt that a strategy aimed at enhancing the dissolution rate of miconazole nitrate by preparing solid dispersions of the drug in a suitable carrier may improve the oral bioavailability of the drug.
Materials and Methods
Materials The following materials and drugs were of food
or pharmaceutical grade and used as supplied: PEG-6000 (Wyandotte Chemical Co., Wyandotte, MI); urea (Fisher Scientific Co., Fair Lawn, N J); miconazole nitrate (Sigma Chemical Co., St. Louis, MO).; spectroscopic grade ethanol 95%, HPLC grade methanol, ammonium hydroxide, mono- basic sodium phosphate, hydrochloric acid, and sodium hydroxide (Fisher Scientific Co., Fair Lawn, N J); monobasic potassium phosphate (Mal- linckrodt Inc., Paris, KY); dibasic sodium phos- phate (Sigma Chemical Co., St. Louis, MO). De- ionized, double-distilled water was used in all studies.
Preparation of solid dispersion systems Physical mixtures. The physical mixtures were
prepared by thoroughly grinding together accu- rately weighed quantities of MN and the excipi- ents (PEG, PVP or urea) for 5 min using a mortar and pestle. The relative proportions of drug and excipients were varied to yield the following com- positions in terms of percent weight of drug: 20%, 40%, 60% and 80%. The blends were passed through a no. 60 screen (U.S. Standard), and the total weight of each blend was varied from 4 to 6
g. Similarly, pure MN and each of the excipients were separately ground to represent pure drug (100%) and pure excipients (0%).
Fused dispersions. Fused dispersions of MN and urea were obtained by heating 1-2 g of the corresponding ground physical mixtures in a heat- ing dish on a hot-plate until a homogeneous liquid melt was obtained. The melted mixture was cooled and solidified rapidly by placing the dish on a ice-water bath and rapidly stirring with a glass rod. The fused dispersions were crushed, pulverized and placed in a vacuum desiccator until further use.
A classical fusion method wherein a mixture of drug and excipient are directly heated to form a comelt could not be applied to M N - P E G systems. This was primarily due to the large discrepancy between the melting points of PEG (60-65°C) and MN (180-185°C) and that PEG degrades at the higher temperature. A lower eutectic tempera- ture was also not found. In order to maximize the chance of inducing favorable solid-state interac- tion between the drug and the excipient, a solvent-melt technique was employed. It has been shown that 5-10% (w/w) of liquid compounds can be directly incorporated into PEG without significant loss of its solid property (Chiou and Riegelman, 1971). Hence, weighed portions of MN were dissolved in warm ethanol and the solution was incorporated directly into the melt of PEG, obtainable below 70°C without removing the liquid solvent.
Coprecipitated dispersions. Coprecipitated dis- persions of MN and PEG were prepared by dis- solving 1-2 g of the corresponding physical mix- tures in ethanol and evaporating the solvent under vacuum at - 40 ° C. The resulting semisolid mass was dried under vacuum in a desiccator, and milled as described above. Coprecipitated disper- sions of M N - P V P were prepared similarly.
Thermal analysis The physical nature, solid-solid interactions,
and homogeneity of solid dispersion systems were tested by subjecting the samples to thermal analy- sis. The information was compiled to construct phase diagrams to rationalize and predict the opti- mum solid dispersion systems.
Thaw-melt method. This was accomplished using both a capillary melting point apparatus (Thomas Co., Philadelphia, PA), and a digital melting point analyzer (Fisher Scientific Co., Fair Lawn, N J) which enabled accurate heating rates, better visualization and improved temperature hold capabilities. Each apparatus was pre- calibrated using a benzoic acid standard (m.p. 195°C, Fisher Scientific Co., Fair Lawn, N J). There was excellent agreement between observa- tions in both cases. When using the melting point apparatus, a sample was placed in a glass capillary tube and heated at a rate of 5 ° C / m i n . When using the digital melting point analyzer the sample was placed between a microscope slide and a cover slip, and sealed with silicone grease. The sample was heated at a constant rate by means of a heating stage interfaced with a digital temper- ature display. Visualization was possible using a high-powered magnifying glass fixed on a mount over the sample and heating stage. The apparatus thus resembled a hot-stage microscope but lacked the polarizing lenses of the latter. This precluded the determination of intricate crystallographic events, although it was visually possible to dif- ferentiate between crystals of the drug and excipi- ent due to their distinctive crystal habits. All determinations were made in triplicate. For the purpose of constructing phase diagrams, observa- tions were made during heating as previously elaborated (Goldberg et al., 1966). These included noting the temperature at which melting started (thaw point) and the temperature at which com- plete melting was affected (melting point). These two temperatures were used to define the melting point range.
Differential scanning calorimetry. The DSC thermograms were recorded using a Model DSC- 1B differential scanning calorimeter (Perkin Elmer Co., Norwalk, CT). Scans were recorded at a scan rate of 10 ° C / m i n and a range of 8 mcal/deg. The chart speed was 20-40 m m / m i n with a 50 mV input. The instrument was calibrated with benzoic acid and indium. Triplicate DSC scans were obtained for known amount of MN (10-15 mg). Single determinations were made for the physical mixtures and solid dispersions at the vari- ous compositions, and of pure PEG, PVP and
209
urea. The temperature and location of every peak on the thermogram was recorded and the melting point range was assigned as described previously (Feldman and Gibaldi, 1967).
Solubility studies Solubility studies were performed to determine
the extent of interaction between the drug and the excipients in aqueous solution. Excess amounts of MN (50 mg) were placed in 20 ml glass vials with Teflon-lined screw caps prefilled with 10 ml of the dissolution containing varying concentrations (0.01%, 0.1%, 1%, 5% w/v ) of the excipients. Sam- ples were equilibrated at 37 °C for 48 h in a water bath. Filtered 1 ml samples were diluted and analyzed for MN by HPLC.
Dissolution studies The in vitro dissolution rate of MN from un-
treated samples (i.e. no added excipients), solid dispersions of MN and drug-excipient physical mixtures were measured according to the U.S.P. Method II (U.S.P. XXI, 1985). The dissolution samples were passed through a no. 60 (U.S. Stan- dard) sieve and contained an equivalent of 50 mg of MN. Dissolution studies were run in duplicate in 0.2 M phosphate buffer (pH 7.4) prepared as described in the U.S.P monograph (U.S.P XXI, 1985). The dissolution fluid (500 ml) was placed in l-liter round-bottom dissolution vessel and pre- equilibrated at 37 + 0 .5°C in a water-bath. The samples were sprinkled on the surface of the dis- solution medium and stirred at 100 rpm. Five-ml samples were withdrawn at 1, 5, 15, 30, 45, 60, 90 and 120 min intervals with volume replacement. Drug content was analyzed by HPLC and a cumulative correction was made for the removed samples in determining the total amount of drug dissolved.
Wettability index The change in wettability of MN upon incor-
poration of the drug in PEG, urea and PVP at various compositions was evaluated. For this pur- pose, a technique previously employed to screen suspending agents (Hiestand, 1964) was modified, wherein the end of a glass pipet was plugged with glass wool, and the pipet filled with the powdered
210
formulations to a height of 5 cm. One ml of distilled water was then placed on top of the powder bed and the time required for water to soak through a distance of 3 cm was noted. This value was termed the wettability index.
Analytical procedure A published high-performance liquid chro-
matographic method and employed to assay for miconazole (Cavrinii et al., 1982). The chromato- graphic system consisted of an isocratic pump (Waters Model 6000A, Waters Associates, Mil- ford, MA), a fixed wavelength U.V. detector, a fixed loop (50 pl) manual injector (Waters Model U6K), and a strip-chart recorder (Omniscribe, Houston, TX). The system was run at a flow rate of 1 m l / m i n ( - 2 0 0 0 p.s.i), and the detection wavelength was 254 nm. The chromatography was performed at ambient temperature using a re- versed phase octadecasilane column (Fisher Scien- tific Co., Fair Lawn, N J). The mobile phase con- sisted of methanol and 0.05M ammonium dihy- drogen phosphate buffer (85 : 15).
Calibration curves for rniconazole were pre- pared using econazole nitrate as the internal standard and plotting the observed peak height ratio of miconazole to econazole versus micona- zole concentration.
Results and Discussion
Phase diagrams The phase diagrams obtained by the thaw-melt
method and the DSC thermograms were in agree- ment (5-10 ° C difference) for all systems studied. Miconazole nitrate and the excipients when sub- jected to DSC each gave a single peak correspond- ing to their fusion temperature. Furthermore, when heated slowly each substance melted over the same temperature range as defined by the beginning and the summit of the corresponding peak in the DSC thermogram. The binary phase diagrams were qualitatively and quantitatively independent of the method of preparation for the solid dipsersions.
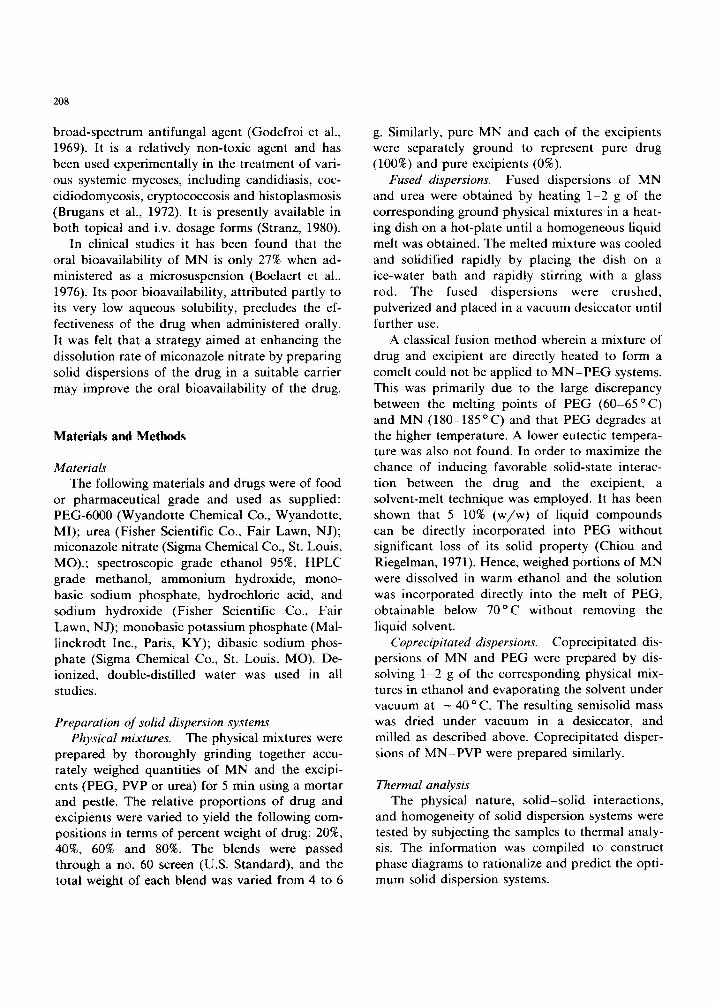
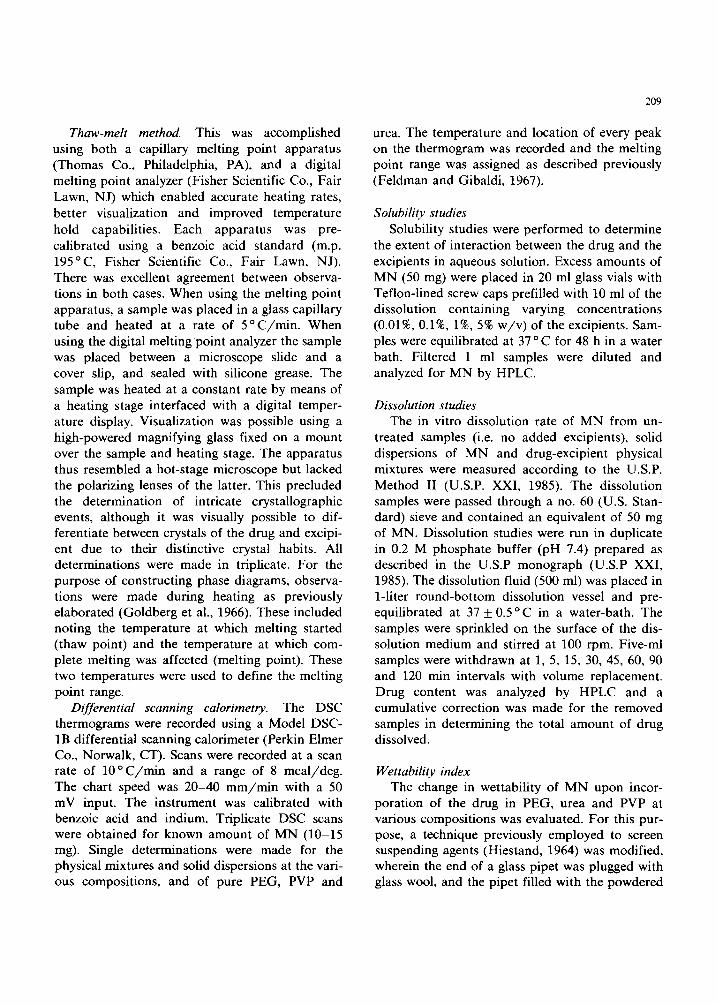
MN-PEG systems. Typical phase diagrams for the M N - P E G dispersions are shown in Figs. 1-3. Melting point analysis showed a constant melting point (solidus point) of PEG at 6 0 - 6 5 ° C at all
Liquid
p 15o-
Liquid + solid mi¢orll~ole nitrate
!10o- l Solid PEG + solid mlconazole nitrate
I I I 810 I 20 40 60 100
PEG % (w/w)
Fig. 1. Phase diagram of physical mixtures of MN and PEG; (e) liquidus point, (©) solidus point. The bars represent the
range of triplicate temperature readings.
200 -
150--
~ 100-
50
Liquid + SOlid rniconazole nitrate ~
, \ S o l i d PEG + SOlid mlconazole nitrate
I I I I I 20 40 60 80 100
PEG % (w/w)
Fig. 2. Phase diagrams of fused dispersions of miconazole nitrate and PEG; (e) liquidus point (©) solidus point. The bars
represent the range of triplicate determinations.
200-
O 150-
| 100-
S o l i d PEG + SOlid mlconazole nitrate
I 4" ," 'o ,~o 20
PEG % (w/w)
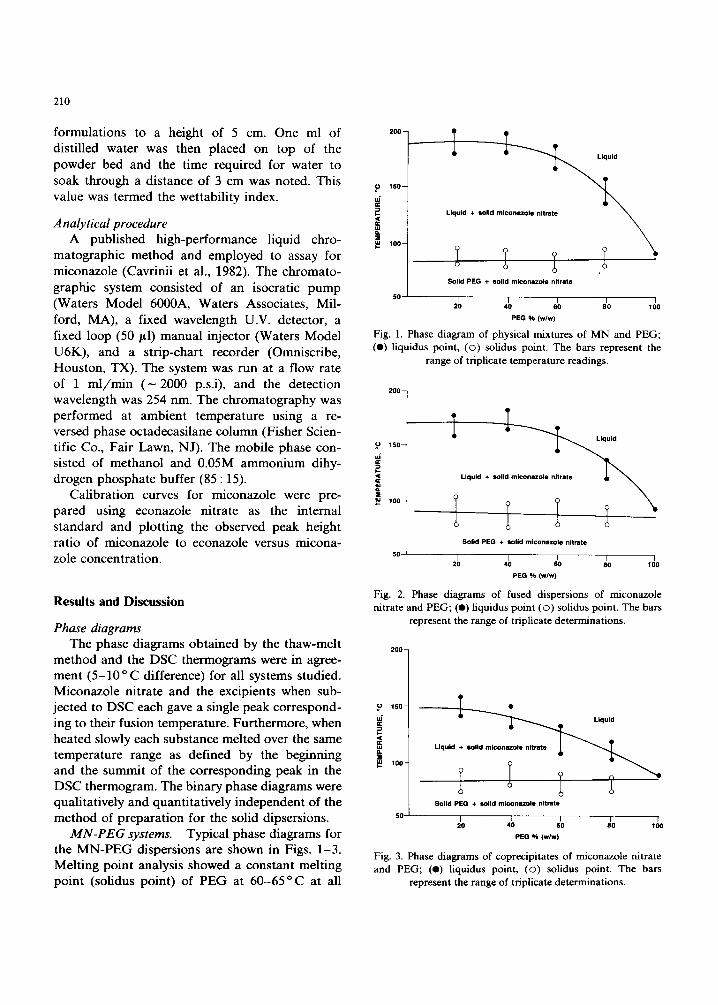
Fig. 3. Phase diagrams of coprecipitates of miconazole nitrate and PEG; (e) liquidus point, (©) solidus point. The bars
represent the range of triplicate determinations.
compositions, corresponding to the endothermic peak in the DSC thermogram. The liquidus point, defined as the temperature above which no more crystals were visible (Kaur et al., 1980) increased as the proportion of drug increased. This increase was highest for the physical mixtures of MN and PEG, lower for the fused dispersions and lowest for the coprecipitated dispersions.
Each of the 3 phase diagrams of the MN-PEG exhibited monotectic behavior, characterized by the absence of complete dissolution of MN in the molten PEG at the melting point of the excipient. The rising liquidus curve on the monotectic di- agrams correspond to the solubility of the drug in the excipient at a specified temperature (Kaur et al., 1980). For example, if MN is added to a sample of PEG at 125 °C line from the pure PEG limit at the right of each figure, the added MN will dissolve until the solid MN-solution equi- librium line (liquidus curve) is reached. At that point, the solution is saturated with MN. If the solution behaves ideally, the equilibrium solubility curve can be expressed in terms of the drug can be expressed in terms of the freezing point depression and heat of fusion (Moore, 1962). There was no evidence of formation of a solid solution or solid complex between PEG and MN. The lowering of the liquidus temperature indicated favorable so- lid-solid interactions in the dispersion systems of MN-PEG, which may result in dissolution en- hancement of MN.
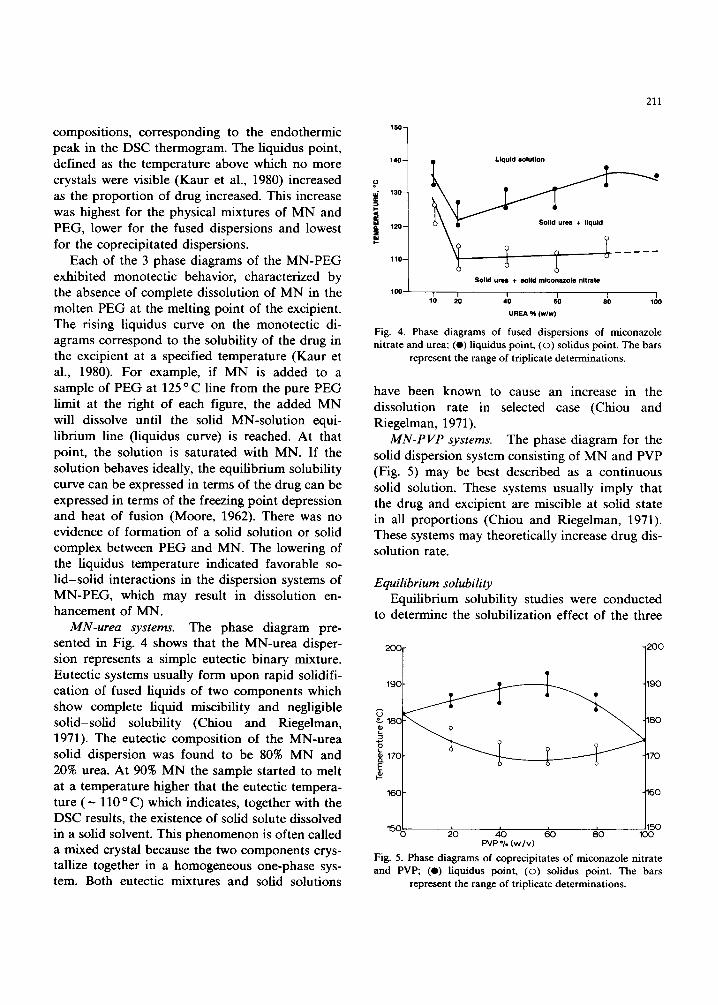
MN-urea systems. The phase diagram pre- sented in Fig. 4 shows that the MN-urea disper- sion represents a simple eutectic binary mixture. Eutectic systems usually form upon rapid solidifi- cation of fused liquids of two components which show complete liquid miscibility and negligible solid-solid solubility (Chiou and Riegelman, 1971). The eutectic composition of the MN-urea solid dispersion was found to be 80% MN and 20% urea. At 90% MN the sample started to melt at a temperature higher that the eutectic tempera- ture ( - 110 o C) which indicates, together with the DSC results, the existence of solid solute dissolved in a solid solvent. This phenomenon is often called a mixed crystal because the two components crys- tallize together in a homogeneous one-phase sys- tem. Both eutectic mixtures and solid solutions
211
150-
140- Liquid solution
i 130-
E i 1 2 0 -
, , o _
Solid urea + solid mlconazole nitrate
100
UREA % (w/w)
Fig. 4. Phase diagrams of fused dispersions of miconazole nitrate and urea; (e) liquidus point, (o) solidus point. The bars
represent the range of triplicate determinations.
have been known to cause an increase in the dissolution rate in selected case (Chiou and Riegelman, 1971).
MN-PVP systems. The phase diagram for the solid dispersion system consisting of MN and PVP (Fig. 5) may be best described as a continuous solid solution. These systems usually imply that the drug and excipient are miscible at solid state in all proportions (Chiou and Riegelman, 1971). These systems may theoretically increase drug dis- solution rate.
Equilibrium solubility Equilibrium solubility studies were conducted
to determine the solubilization effect of the three
200
190
o 180
£. X 170-
160
1
200
190
180
170
160
150 ~o ~ ~o ~o ~oo PVP % ( w / v )
Fig. 5. Phase diagrams of coprecipitates of miconazole nitrate and PVP; (e) liquidus point, (o) solidus point. The bars
represent the range of triplicate determinations.
212
4 0 -
3 5 -
3 0 -
t 2 5 -
z O 20 - o o
15-
I I I I I 0.01 0.1 1.0 5 .0 10 .0
E X C I P I E N T C O N C E N T R A T I O N (% w/v)
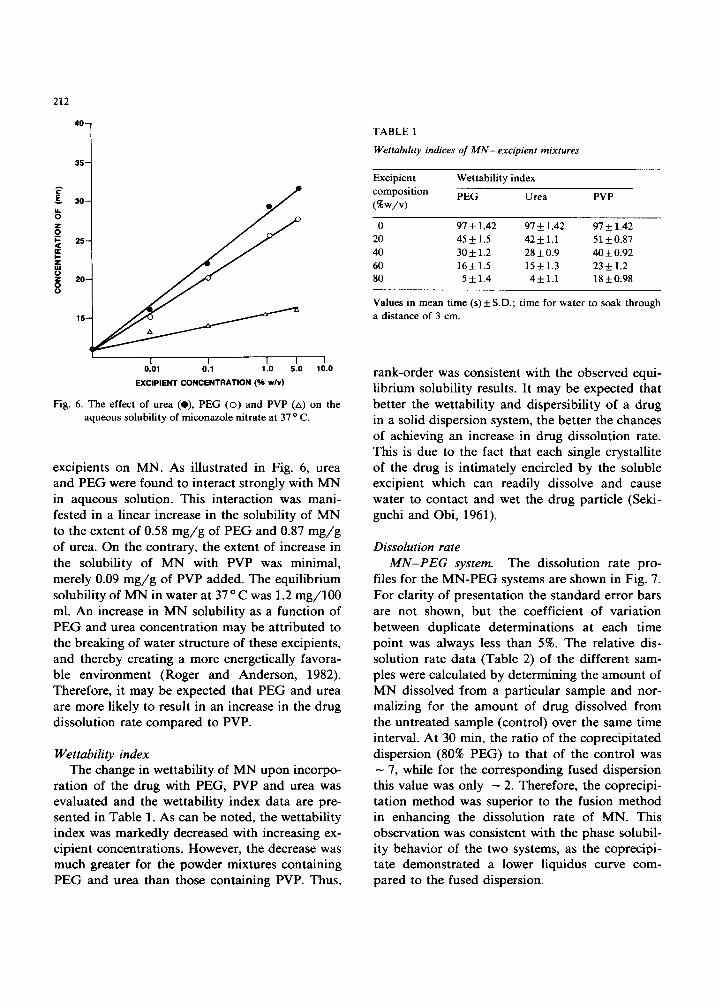
Fig. 6. The effect of urea (e), PEG (o) and PVP (zx) on the aqueous solubility of miconazole nitrate at 37 o C.
exc ip ients on MN. As i l lus t ra ted in Fig. 6, u rea and P E G were found to in teract s t rongly with M N in aqueous solut ion. This in te rac t ion was mani - fested in a l inear increase in the so lubi l i ty of M N to the extent of 0.58 m g / g of P E G and 0.87 m g / g of urea. On the cont ra ry , the extent of increase in the so lubi l i ty of M N with PVP was min imal , mere ly 0.09 m g / g of PVP added . The equi l ib r ium solubi l i ty of M N in wate r at 37 o C was 1.2 m g / 1 0 0 ml. A n increase in M N solubi l i ty as a funct ion of P E G and urea concen t ra t ion m a y be a t t r ibu ted to the b reak ing of wate r s t ructure of these excipients , and thereby c rea t ing a more energet ica l ly favora- b le env i ronment (Roger and Ander son , 1982). Therefore , i t m a y be expected tha t P E G and urea are more l ikely to result in an increase in the d rug d isso lu t ion ra te c o m p a r e d to PVP.
Wettabili ty index The change in we t tab i l i ty of M N u p o n incorpo-
ra t ion of the d rug with PEG, PVP and urea was eva lua ted and the wet tab i l i ty index da t a are pre- sented in Tab le 1. As can be noted , the wet tab i l i ty index was m a r k e d l y decreased with increas ing ex- c ip ient concent ra t ions . However , the decrease was much greater for the p o w d e r mixtures con ta in ing P E G and urea than those conta in ing PVP. Thus,
TABLE 1
Wettability indices of MN-excipient mixtures
Excipient composition (%w/v)
Wettability index
PEG Urea PVP
0 97 + 1.42 97 + 1.42 97 + 1.42 20 45 _+ 1.5 42 + 1.1 51 + 0.87 40 30 + 1.2 28 + 0.9 40 + 0.92 60 16 + 1.5 15 + 1.3 23 + 1.2 80 5 + 1.4 4+ 1.1 18+0.98
Values in mean time (s)_+ S.D.; time for water to soak through a distance of 3 cm.
r ank-o rde r was consis tent wi th the observed equi- l ib r ium solubi l i ty results. I t m a y be expected that be t te r the wet tab i l i ty and d i spers ib i l i ty of a d rug in a sol id d i spers ion system, the be t te r the chances of achieving an increase in d rug d i sso lu t ion rate. This is due to the fact that each single crys ta l l i te of the drug is in t ima te ly enci rc led by the so luble excipient which can read i ly dissolve and cause water to con tac t and wet the d rug par t ic le (Seki- guchi and Obi, 1961).
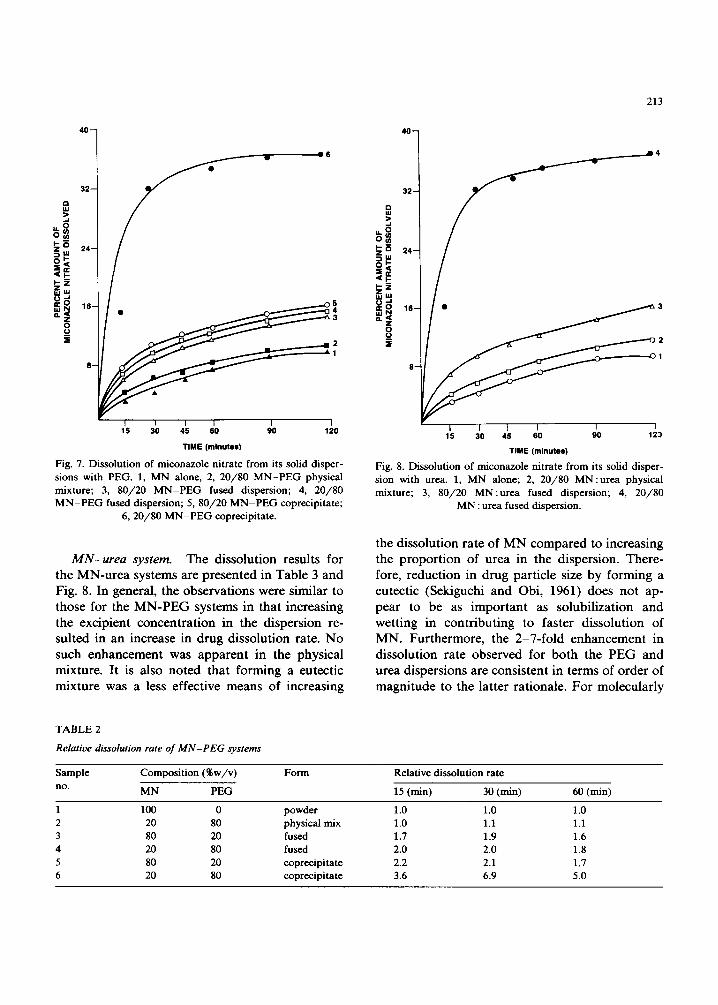
Dissolution rate M N - P E G system. The d i sso lu t ion ra te p ro-
files for the M N - P E G systems are shown in Fig. 7. F o r c lar i ty of p resen ta t ion the s t a n d a r d error bars are not shown, bu t the coeff ic ient of va r ia t ion be tween dup l ica te de t e rmina t ions at each t ime po in t was a lways less than 5%. The relat ive dis- so lu t ion rate d a t a (Tab le 2) of the d i f ferent sam- ples were ca lcu la ted by de t e rmin ing the a m o u n t of M N dissolved :from a pa r t i cu la r s ample and nor- mal iz ing for the a m o u n t of d rug dissolved f rom the un t r ea t ed sample (control) over the same t ime interval . A t 30 min, the ra t io of the cop rec ip i t a t ed d i spers ion (80% P E G ) to that of the con t ro l was - 7, while for the co r r e spond ing fused d i spe rs ion this value was only - 2. Therefore , the coprec ip i - ta t ion m e t h o d was super ior to the fusion m e t h o d in enhanc ing the d isso lu t ion ra te of M N . This observa t ion was cons is ten t with the phase solubi l - i ty behav ior of the two systems, as the coprec ip i - ta te de mons t r a t e d a lower l iquidus curve com- pa red to the fused dispers ion.
213
a w
u . O o ~
o
O o_
3 2 -
,9, -I
u . O o ~
a. Z O _o
3 2 -
I / I I I I 15 30 45 60 90 120
T IME (minutes)
Fig. 7. Dissolution of miconazole nitrate from its solid disper- sions with PEG. 1, MN alone, 2, 20/80 MN-PEG physical mixture; 3, 80/20 MN-PEG fused dispersion; 4, 20/80 MN-PEG fused dispersion; 5, 80/20 MN-PEG coprecipitate;
6, 20/80 MN-PEG coprecipitate.
M N - u r e a sys tem. The dissolut ion results for the MN-u rea systems are presented in Table 3 and Fig. 8. In general, the observat ions were similar to those for the M N - P E G systems in that increasing the excipient concen t ra t ion in the dispersion re- sulted in an increase in drug dissolut ion rate. No
such enhancemen t was apparen t in the physical mixture. It is also noted that forming a eutectic mixture was a less effective means of increasing
• i I [ I I I 15 30 45 60 90 123
TIME (minutes)
Fig. 8. Dissolution of miconazole nitrate from its solid disper- sion with urea. 1, MN alone; 2, 20/80 MN:urea physical mixture; 3, 80/20 MN:urea fused dispersion; 4, 20/80
MN : urea fused dispersion.
the dissolut ion rate of M N compared to increasing the propor t ion of urea in the dispersion. There- fore, reduct ion in drug particle size by forming a eutectic (Sekiguchi and Obi, 1961) does no t ap-
pear to be as impor t an t as solubi l izat ion and wett ing in cont r ibu t ing to faster dissolut ion of MN. Fur thermore , the 2 -7- fo ld enhancemen t in dissolut ion rate observed for bo th the P E G and urea dispersions are consis tent in terms of order of magni tude to the latter rat ionale. For molecular ly
TABLE 2
Relative dissolution rate of MN-PEG systems
Sample Composition (%w/v) Form
no. MN PEG
Relative dissolution rate
15 (rain) 30 (min) 60 (min)
1 100 0 2 20 80 3 80 20 4 20 80 5 80 20 6 20 80
powder 1.0 1.0 1.0 physical mix 1.0 1.1 1.1 fused 1.7 1.9 1.6 fused 2.0 2.0 1.8 coprecipitate 2.2 2.1 1.7 coprecipitate 3.6 6.9 5.0
214
TABLE 3
Relative dissolution rates of MN-urea systems
Sample Composit ion (%w/v)
No. MN Urea
Form Relative dissolution rate
15 (min) 30 (rain) 60 (rain)
1 100 0 Powder 1.0 1.0 1.0 2 20 80 Physical mix 1.3 1.2 1.4 3 80 20 fused a 2.2 2.1 1.7 4 20 80 fused 4.0 7.2 5.1
a Eutectic composit ion
dispersed drug particles dissolution enhancement would be expected to be considerably greater.
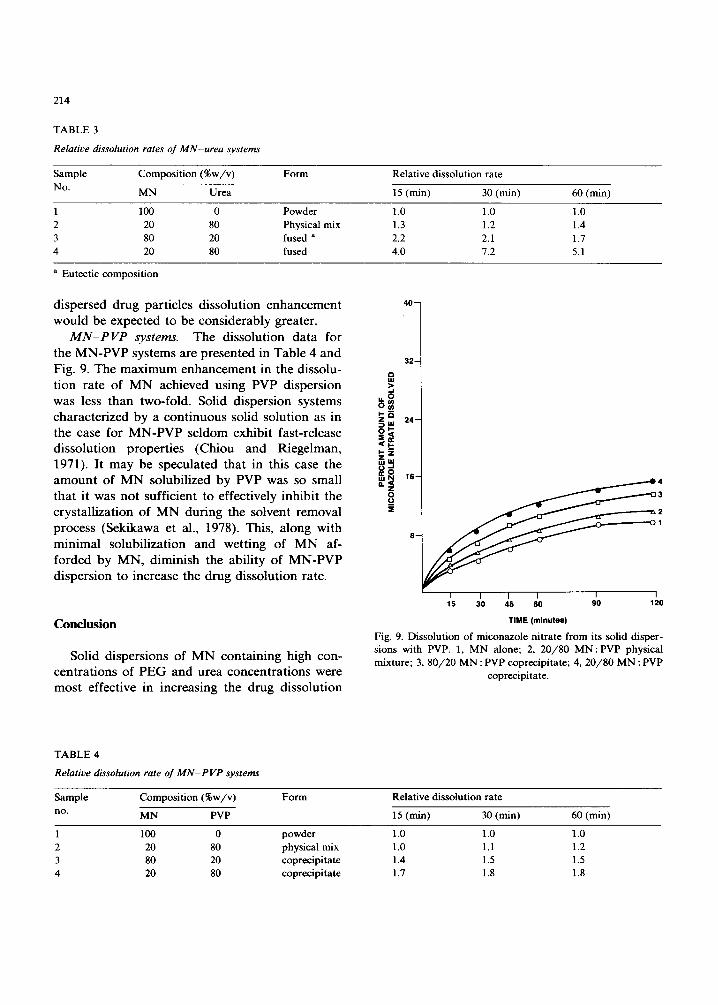
M N - P V P systems. The dissolution data for the MN-PVP systems are presented in Table 4 and Fig. 9. The maximum enhancement in the dissolu- tion rate of MN achieved using PVP dispersion was less than two-fold. Solid dispersion systems characterized by a continuous solid solution as in the case for MN-PVP seldom exhibit fast-release dissolution properties (Chiou and Riegelman, 1971). It may be speculated that in this case the amount of MN solubilized by PVP was so small that it was not sufficient to effectively inhibit the crystallization of MN during the solvent removal process (Sekikawa et al., 1978). This, along with minimal solubilization and wetting of MN af- forded by MN, diminish the ability of MN-PVP dispersion to increase the drug dissolution rate.
Conclusion
Solid dispersions of MN containing high con- centrations of PEG and urea concentrations were most effective in increasing the drug dissolution
4 0 -
3 2 -
>
O ~
8 3
8 -
[ I I I I l 15 30 45 60 90 120
TIME (minutes)
Fig. 9. Dissolution of miconazole nitrate from its solid disper- sions with PVP. 1, MN alone; 2, 20 /80 M N : P V P physical mixture; 3, 80 /20 MN : PVP coprecipitate; 4, 20 /80 M N : PVP
coprecipitate.
TABLE 4
Relative dissolution rate of M N - P V P systems
Sample Composit ion (%w/v) Form
no. MN PVP
Relative dissolution rate
15 (re_in) 30 (min) 60 (rain)
1 100 0
2 20 80 3 80 20 4 20 80
powder 1.0 1.0 1.0 physical mix 1.0 1.1 1.2 coprecipitate 1.4 1.5 1.5 coprecipitate 1.7 1.8 1.8
ra te . In c o m p a r i s o n , M N - P V P d i spe r s ions w e r e
m a r g i n a l l y e f fec t ive . A 7- fo ld a d v a n t a g e in dis-
so lu t i on o f M N m a y be rea l i zed by us ing sol id
d i s p e r s i o n s c o n t a i n i n g P E G or urea. F o r the sol id
d i spe r s i on sys tems eva lua t ed , the c o n t r i b u t i o n of
w e t t i n g a n d so lub i l i z a t i on were m o r e i m p o r t a n t
t h a n pa r t i c l e size r e d u c t i o n in caus ing an inc rease
in the d i s so lu t i on rate .
References
Boelaert, J., Daneels, R., Van Landuyt, H. and Symoens, J., Miconazole plasma levels in healthy subjects and in pa- tients with impaired renal function. Chemotherapy, 6 (1976) 165-169.
Brugman, J., Van Cutsem, J., Heykants, J., Schuermans, V. and Theinpont, D., Systemic antifungal potential, safety, bio- transport and transformation of miconazole nitrate. Eur. J. Clin. Pharmacol., 5 (1972) 93-99.
Cavrini, V., Dipietra, A.M. and Raggi, M.A., High pressure liquid chromatographic (HPLC) analysis of imidazole anti- fungals in commercial dosage forms. Int. J. Pharm., 10 (1982) 119-124.
Chiou, W.L. and Riegelman, S., Preparation and dissolution characteristics of several fast-release solid dispersions of griseofulvin. J. Pharm. Sci., 60 (1969) 1281-1302.
Chiou, W.L. and Riegelman, S., Pharmaceutical applications of solid dispersion systems. J. Pharm. Sci., 60 (1971) 1281-1302.
Feldman, S. and Gibaldi, M., Effect of urea on solubility. J. Pharm. Sci., 56 (1967) 370-375.
215
Godefroi, E.F., Heeres, J., Van Cutsem, J. and Janssen, P.J., The preparation and antimycotic properties of derivitives of 1-phenyethylimidazole. J. Med. Chem., 12 (1969) 784-791.
Goldberg, A.H., Gibaldi, M. and Kanig, J.L., Increasing dis- solution rates and gastrointestinal absorption of drugs via solid dispersions and eutectic mixtures. J. Pharm. Sci., 55 (1966) 581-583.
Hajratwala, B.R., Dissolution of solid dispersion systems. Aust. J. Pharm. Sci., NS3 (1974) 101-109.
Hiestand, E.N., Theory of course suspension formulation. J. Pharm. Sci., 53 (1964) 1-18.
Kaur, R., Grant, D.J.W. and Eaves, T., Comparison of poly- oxythylene stearate as excipient for solid dispersion systems of griseofulvin and tolbutamide I: Phase Equilibria. J. Pharm. Sci., 69 (1980) 1317-1320.
Mayersohn, M. and Gibaldi, M., New method of solid state dispersion for increasing dissolution rates. J. Pharm. Sci., 55 (1966) 1323-1324.
Moore, W.J., Physical Chemistry, Prentice Hall, Englewood Cfiffs, NJ, 1962, p. 117.
Rogers, J.A. and Anderson, A.J., Physical characteristics and dissolution profiles of ketoprofen-urea solid dispersions. Pharm. Acta Heir., 57 (1982) 276-281.
Sekiguchi, K. and Obi, N., Studies on the absorption of eutectic mixture I. Chem. Pharm. Bull., 9 (1961) 866-872.
Sekikawa, H., Nakano, M. and Arita, T., Inhibitory effects of polyvinylpyrrolidone on the crystallization of drugs. Chem. Pharm. Bull., 26 (1978) 118-126.
Stranz, M.H., Miconazole. Drug Intell. Clin. Pharm., 14 (1980) 86-95. United States Pharmacopeia, 21st edn., USP Con- vention, Rockville, MD, 1985, pp. 1220, 1244.