Embed Size (px)
Citation preview

STAC Report IBM InfoSphere BigInsights - SWIM, Rev 1.0
Comparison of IBM InfoSphere® BigInsights
®
Enterprise Edition with Adaptive MapReduce
and Apache Hadoop, Using Berkeley SWIM
Issue 1.0, 22 October 2013
Technology Stacks Under Test
This document was produced by the Securities Technology Analysis Center, LLC (STAC®), a
provider of performance measurement services, tools, and research to the securities industry. To be notified of future reports, or for more information, please visit www.STACresearch.com. Copyright © 2013 Securities Technology Analysis Center, LLC. “STAC” and all STAC names are trademarks or registered trademarks of the Securities Technology Analysis Center, LLC. Other company and product names are trademarks of their respective owners.
Key Results
In jobs derived from production Hadoop traces at Facebook, IBM InfoSphere BigInsights accelerated
Hadoop by an average of approximately 4x.
In this project, the speed advantage of BigInsights was most closely related to the shuffle size.
Much of the BigInsights advantage appears due to better scheduling latency. In a pure corner-case
test of scheduling speed, this BigInsights configuration outperformed the Hadoop configuration by
approximately 11x in warm runs.
These results are indicative only. We used the default settings for the Hadoop core and for
BigInsights, except where noted, and the two systems used the same operating system, JVM, HDFS-
formatted storage, and networks. Nevertheless, it is possible that different settings for Hadoop or
BigInsights could achieve different results.
NOTE: The tests in this STAC Report are not based on STAC Benchmark specifications.
For more information, see the Background section of this report.
Juniper Networks QFX3500
Mellanox MT26448 ConnectX EN 10Gbps Adapters
18 x IBM System x3630 M3 servers
12 x IBM 2TB SAS Hard Drives per server
2 x 6-core Intel Xeon E5645 @ 2.4 Ghz per server
Red Hat Enterprise Linux 6.4
IBM InfoSphere BigInsights Enterprise Edition 2.1.0.1 or Apache Hadoop 1.1.2

STAC Report IBM InfoSphere BigInsights Enterprise Edition - SWIM 2010, Rev 1.0
©2013 Securities Technology Analysis Center, LLC Page 2 of 24
Disclaimer
The Securities Technology Analysis Center, LLC (STAC®) prepared this STAC Report™
at the request of IBM. It is provided for your internal use only and may not be
redistributed, retransmitted, or published in any form without the prior written consent of
STAC. All trademarks in this document belong to their respective owners.
The test results contained in this report are made available for informational purposes
only. STAC does not guarantee similar performance results. All information contained
herein is provided on an “AS-IS” BASIS WITHOUT WARRANTY OF ANY KIND. STAC
has made commercially reasonable efforts to adhere to any vendor published test
procedures and otherwise ensure the accuracy of the contents of this document, but the
document may contain errors. STAC explicitly disclaims any liability whatsoever for any
errors or otherwise.
The evaluations described in this document were conducted under controlled laboratory
conditions. Obtaining repeatable, measurable performance results requires a controlled
environment with specific hardware, software, network, and configuration in an isolated
system. Adjusting any single element may yield different results. Additionally, test
results at the component level may not be indicative of system level performance, or vice
versa. Each organization has unique requirements and therefore may find this
information insufficient for its needs.
Customers interested in a custom analysis for their environment are encouraged to
contact STAC.

STAC Report IBM InfoSphere BigInsights Enterprise Edition - SWIM 2010, Rev 1.0
©2013 Securities Technology Analysis Center, LLC Page 3 of 24
Contents
REFERENCES .............................................................................................................................................. 4
SUMMARY.................................................................................................................................................... 5
1. BACKGROUND ...................................................................................................................................... 6
2. TEST METHODOLOGY ........................................................................................................................... 7
2.1 Overview ..................................................................................................................................... 7
2.2 SWIM Benchmark ....................................................................................................................... 7
2.3 Sleep Benchmark ...................................................................................................................... 14
2.4 Limitations ................................................................................................................................. 15
3. SYSTEM SPECIFICATIONS .................................................................................................................... 16
3.1 Overview ................................................................................................................................... 16
3.2 Configuration Details ................................................................................................................. 16
4 RESULTS ............................................................................................................................................ 17
4.1 SWIM – Test Results ................................................................................................................ 17
4.2 Sleep – Test Results ................................................................................................................. 20
5 VENDOR COMMENTARY ...................................................................................................................... 22
ABOUT STAC ............................................................................................................................................ 24

STAC Report IBM InfoSphere BigInsights Enterprise Edition - SWIM 2010, Rev 1.0
©2013 Securities Technology Analysis Center, LLC Page 4 of 24
References
[1] Statistical Workload Injector for MapReduce (SWIM): https://github.com/SWIMProjectUCB/SWIM/wiki
[2] "STAC Report: Comparison of Platform Symphony and Apache Hadoop Using Berkeley SWIM",
STAC, 6 Nov 2012: www.STACresearch.com/node/13080
[3] "MapReduce: Simplified Data Processing on Large Clusters", Dean & Ghemawat (Google), 2004:
http://research.google.com/archive/mapreduce.html

STAC Report IBM InfoSphere BigInsights Enterprise Edition - SWIM 2010, Rev 1.0
©2013 Securities Technology Analysis Center, LLC Page 5 of 24
Summary
MapReduce, a framework for data-aware distributed computing, is enjoying substantial market uptake.1
As users move more MapReduce projects from development to operations, they are paying increasing
attention to production-related issues. One of these is performance: i.e., how quickly MapReduce jobs
can be completed with a given amount of computing resources.
IBM Infosphere BigInsights Enterprise Edition (BigInsights) is IBM’s flagship big data platform. It is a
Hadoop distribution with enhancements designed to improve integration, reliability, and performance.
One such enhancement is an optional feature called Adaptive MapReduce2 that can be deployed as an
alternative to the standard open-source Hadoop scheduler, which is also included in the BigInsights
distribution. Adaptive MapReduce is designed to be fully compatible with layered applications written to
standard Hadoop APIs for compatibility. IBM claims that Adaptive MapReduce can accelerate many types
of MapReduce applications while maintaining full application capability.
IBM asked STAC® to compare pure Apache Hadoop to BigInsights with Adaptive MapReduce enabled, in
the same hardware environment, using an off-the-shelf workload written to the Hadoop MapReduce API.
IBM felt that this result would be significant to customers deploying BigInsights or other Hadoop-based
solutions. This report documents the test results and describes the test methodology in detail.
There are several publicly available benchmarks written to the Hadoop MapReduce API. For this project,
we chose a methodology using the Statistical Workload Injector for MapReduce (SWIM) developed by the
University of California at Berkeley.[1] This is the methodology that STAC chose for an earlier project [2],
and feedback on this choice was positive from Wall Street firms working with big data.
The SWIM package provides a large set of diverse MapReduce jobs based on production Hadoop traces
obtained from Facebook, along with information to enable characterization of each job. The hardware
environment in the testbed consisted of 17 compute servers and 1 master server communicating over 10-
gigabit Ethernet. We compared Hadoop ver 1.1.2 to IBM InfoSpere BigInsights Enterprise Edition ver
2.1.0.1. Both systems used default configurations except where noted.
On average, BigInsights performed jobs 3.8 times faster than Apache Hadoop running on the same
environment (median speedup: 4.3x). This reduced the total processing time for all jobs by a factor of
2.7x. The advantage enjoyed by BigInsights slowly declined as the shuffle size increased beyond 100
kilobytes. IBM’s assertion that this performance advantage derives from superior scheduling latency in
BigInsight’s Adaptive MapReduce feature was borne out by results from a simple “sleep” benchmark, in
which BigInsights was about 11 times faster than Hadoop.
An important caveat is that results such as these may be sensitive to tuning of the framework software
(both Hadoop and BigInsights). The two frameworks used the same HDFS-formatted data store, and the
same operating system, networks, JVM, and number of map and reduce slots. It is possible that different
settings for Hadoop or BigInsights could achieve different results. If there are vendors who would like to
see this comparison run against Hadoop configured with different settings, or using different Hadoop
distributions or versions, we encourage them to contact STAC. IBM has expressed its willingness to
support efforts to re-run these tests under such conditions.
1 One analyst projects growth at a compound annual rate of 58% through 2018: www.marketanalysis.com/?p=279.
2 Adaptive MapReduce is based on a low latency MapReduce implementation provided by IBM Platform Symphony
that is now included as a core feature in IBM BigInsights Enterprise Edition.

STAC Report IBM InfoSphere BigInsights Enterprise Edition - SWIM 2010, Rev 1.0
©2013 Securities Technology Analysis Center, LLC Page 6 of 24
1. Background
MapReduce is a programming model to handle large data-processing requirements. It was described by
Google in a now famous 2004 paper.[3] While Google only described the technique (rather than releasing
any code from its implementation), Yahoo later created and open-sourced its own implementation of
MapReduce called Hadoop, which is now gaining adoption in a range of industries.
As organizations move Hadoop into mainstream use, they are paying more attention to production-
oriented issues. One of these is performance—that is, how quickly data can be processed with a given
amount of computing resources. This speed governs tradeoffs among user-response times, consumption
of power and space in the data center, and other common operational concerns.
In 2009, IBM’s Information Management division created a value-added Hadoop implementation called
InfoSphere BigInsights that includes Apache Hadoop and various other open source components as well
as IBM-developed tools aimed at simplifying management, application development, and data integration.
While BigInsights customers continue to use the Hadoop MapReduce API and higher-level tools like PIG,
Hbase, and HIVE, they have the option of using proprietary components in addition to or in place of the
open source Hadoop components. For example, BigInsights offers IBM BigSQL as an ANSI-compliant
alternative to HiveQL, and it supports an enhanced POSIX file system called GPFS FPO that can be used
instead of open-source HDFS (note: this project did not use GPFS). The focus of this project was to test a
BigInsights feature called Adaptive MapReduce that users may choose to deploy at the time of
installation. Adaptive MapReduce re-implements the standard Hadoop JobTracker, TaskTracker and
Shuffle services on a low-latency grid middleware implementation provided by IBM Platform Computing.
IBM claims that Adaptive MapReduce provides better production-oriented benefits than Hadoop’s grid
management and scheduling components, and it believes that these will appeal both to its existing
BigInsights customers and to other Hadoop users. One of those benefits is superior performance. For an
independent check on that claim, IBM turned to STAC.
STAC is an independent technology-research firm that specializes in hands-on evaluation of high-
performance technologies.3 For more than seven years, STAC has focused on the engineering
challenges facing financial institutions in both “big workloads” (e.g., computation of derivatives risk,
analysis of large time-series databases) and “fast workloads” (e.g., ultra-low-latency transformation and
distribution of market data, automated trade execution). Toward this end, STAC facilitates the STAC
Benchmark Council™, a large group of financial organizations and the technology vendors that serve
them (www.STACresearch.com/members). The Council specifies standard ways to measure the
performance of various solution stacks using real-world workloads. Vendor members can issue credible,
business-relevant benchmarks, while end-user firms get useful information without expending great effort.
We undertook this project because a growing number of financial services firms are deploying Hadoop.
However, since adoption is still in early stages, the STAC Benchmark Council has not yet achieved
consensus on workloads to use as benchmarks for MapReduce. We therefore chose an off-the-shelf
MapReduce benchmark that we felt was respectable, for reasons that we detail in the next section.
A STAC “Big Data” Special Interest Group (SIG) is currently evaluating benchmarks relevant to Hadoop and other big data technologies. Individuals wishing to participate in this process (subject to Council rules) are invited to indicate their interest at www.STACresearch.com/bigsig.
3 See http://www.STACresearch.com.

STAC Report IBM InfoSphere BigInsights Enterprise Edition - SWIM 2010, Rev 1.0
©2013 Securities Technology Analysis Center, LLC Page 7 of 24
2. Test Methodology
2.1 Overview
For this project, we chose to use the Statistical Workload Injector for MapReduce (SWIM) developed by
the University of California at Berkeley [1]. SWIM provides a large set of diverse MapReduce jobs based
on production Hadoop traces obtained from Facebook, along with information to enable characterization
of each job. In addition, SWIM scales the jobs based on the size of the cluster in order to make it feasible
to run benchmarks when thousands of nodes are not available.
SWIM feeds jobs to the SUT4 in a predetermined fashion that is independent of the SUT’s ability to
perform the work. Thus, the appropriate way to think of a SWIM workload is not as a multi-job batch
process but rather as a series of discrete analytic tasks, where the response time to each job is the key
metric. This is the kind of usage pattern one would expect in an environment where multiple users submit
interactive requests throughout the day or jobs are triggered automatically in response to incoming
events. (Anecdote suggests such use cases are on the rise in a variety of industries.)
The sampled and abstracted 2010 Facebook workload may not correspond directly to the MapReduce
workload of a given firm. However, this workload does have one compelling benefit: it is derived from real,
production Hadoop traces.
A caveat to SWIM is that it does not include any analytic processing, so it is not good at representing
compute-bound jobs. Nevertheless, SWIM authors have advised us that their tests indicate SWIM
workloads perform very similarly to the real workloads from which they were abstracted. If true, this
implies that the Hadoop workloads the SWIM team has examined tend to be dominated by I/O.
Similar to our experience in [2], we found that BigInsights’ performance advantage with the Facebook-
based SWIM jobs declined when the payloads (particularly the shuffle) became large (see Results). This
is consistent with IBM's assertion of faster scheduling in Adaptive MapReduce. And as in [2], to test this
hypothesis directly we ran a “sleep” benchmark.5 As described later, this test runs the “sleep” example job
that comes with Hadoop, which does no work. To be clear, this is not designed to reflect a real-world
workload but rather is a corner case designed to focus on a system’s scheduling speed.
2.2 SWIM Benchmark
2.2.1 Workload
The SWIM benchmark tools pre-populate HDFS using uniform synthetic data based on samples from
production-system traces at Facebook taken in 2010. The tools scale the job sizes based on the number
of nodes in the SUT relative to the number of nodes in the Facebook system (3000). The tools replay the
workload using synthetic MapReduce jobs.
The full Facebook 2010 file contains over 24,000 jobs. Even after scaling these down to match our cluster
size, running all of the jobs would have taken 24 hours (this run time is independent of the SUT, since as
we pointed out above, the submit times are independent of SUT speed). Multiplying that by two SUTS
(pure Hadoop and Hadoop with BigInsights) and three test runs (to avoid flukes) would have been far
4 SUT = “System Under Test”, or in STAC terminology, “Stack Under Test”
5 The use of the sleep job was inspired by other public use of sleep as a measure of Hadoop scheduling speed. See
http://www.slideshare.net/cloudera/hadoop-world-2011-hadoop-and-performance-todd-lipcon-yanpei-chen-cloudera

STAC Report IBM InfoSphere BigInsights Enterprise Edition - SWIM 2010, Rev 1.0
©2013 Securities Technology Analysis Center, LLC Page 8 of 24
beyond our test window. We therefore chose the first n jobs that could be completed in a 20-minute test
run. As it turned out, n was 302.
This set was a diverse combination of input, output, and shuffle sizes, and gaps between submit times.
Because, as we will see later, the test results show that the performance advantage to using BigInsights
depended on size attributes of the jobs, it’s important to understand how those attributes were distributed
in our test sample and how that relates to the overall set of jobs in the Facebook 2010 SWIM job set (to
make sure our sample wasn’t biased).
The following series of histograms conveys this visually. (Keep in mind that the charts refer to the down-
scaled sizes that were used in the tests. The jobs on which they are based were 3000/17 = 176 times
larger.)
Figure 1 shows that input sizes were distributed fairly evenly, with the most common being tens of bytes,
but many in the 100KB to 10GB range.
Figure 1
In Figure 2, output sizes are skewed a little lower, with tens of bytes being most common, outputs greater
than a megabyte being fairly infrequent, and some jobs with no output at all. These combine to give the
distribution of total input and output sizes shown in Figure 3. Jobs with total input and output of 10KB or
less (the significance of which will become apparent a bit later) represent 42% of the sample. Figure 4
shows that shuffle sizes tend to be either large or small, with a third of jobs having no shuffle at all and
about a third being a shuffle of 100KB or more.
STAC Report IBM InfoSphere BigInsights Enterprise Edition - SWIM 2010, Rev 1.0
©2013 Securities Technology Analysis Center, LLC Page 9 of 24
Figure 2
Figure 3
STAC Report IBM InfoSphere BigInsights Enterprise Edition - SWIM 2010, Rev 1.0
©2013 Securities Technology Analysis Center, LLC Page 10 of 24
Figure 4
To provide some confidence that our sample of 302 jobs wasn’t markedly different from the overall
package of 24,000 jobs, Figure 5 shows the distribution of combined input and output sizes for the entire
package (after down-scaling), for comparison with Figure 3.
Figure 5
STAC Report IBM InfoSphere BigInsights Enterprise Edition - SWIM 2010, Rev 1.0
©2013 Securities Technology Analysis Center, LLC Page 11 of 24
While it’s clear that 10-byte input/output jobs were over-represented in our sample, the results show that
what’s important with respect to the question of bias is the proportion of jobs that were 10KB or less. As it
happens, these jobs made up 42% of the entire scaled-down SWIM package, which is exactly the same
proportion as in the sample used for the tests, as noted above.
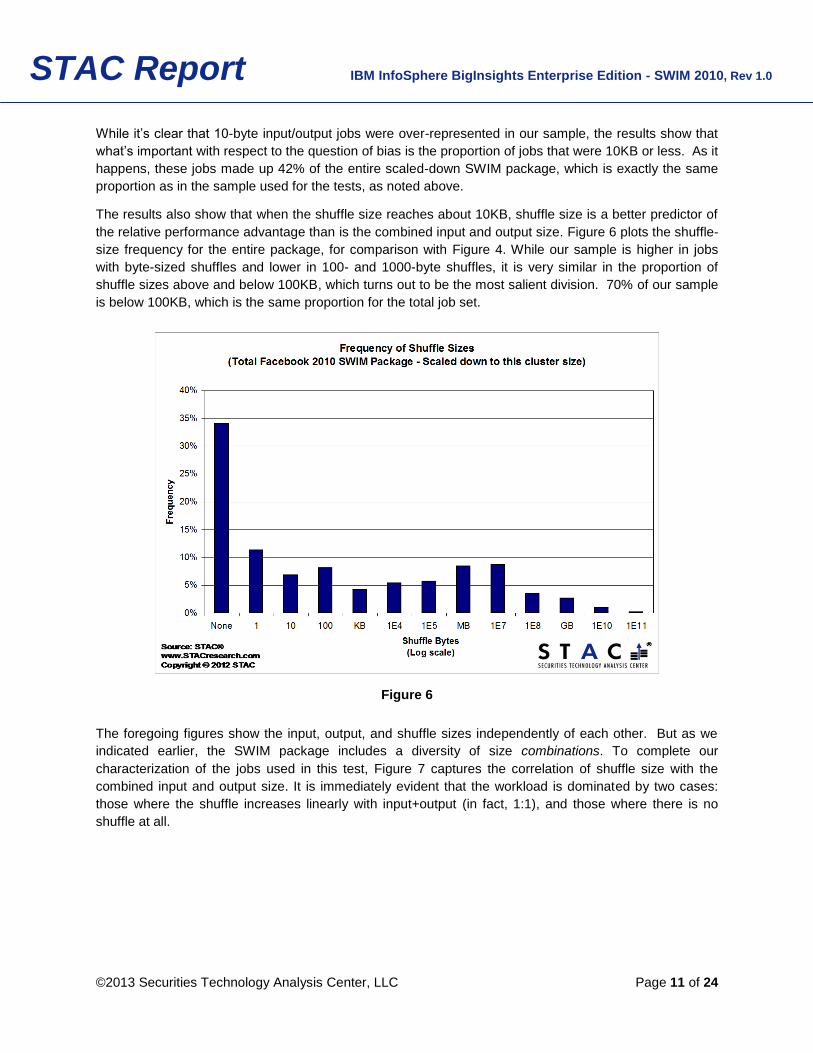
The results also show that when the shuffle size reaches about 10KB, shuffle size is a better predictor of
the relative performance advantage than is the combined input and output size. Figure 6 plots the shuffle-
size frequency for the entire package, for comparison with Figure 4. While our sample is higher in jobs
with byte-sized shuffles and lower in 100- and 1000-byte shuffles, it is very similar in the proportion of
shuffle sizes above and below 100KB, which turns out to be the most salient division. 70% of our sample
is below 100KB, which is the same proportion for the total job set.
Figure 6
The foregoing figures show the input, output, and shuffle sizes independently of each other. But as we
indicated earlier, the SWIM package includes a diversity of size combinations. To complete our
characterization of the jobs used in this test, Figure 7 captures the correlation of shuffle size with the
combined input and output size. It is immediately evident that the workload is dominated by two cases:
those where the shuffle increases linearly with input+output (in fact, 1:1), and those where there is no
shuffle at all.

STAC Report IBM InfoSphere BigInsights Enterprise Edition - SWIM 2010, Rev 1.0
©2013 Securities Technology Analysis Center, LLC Page 12 of 24
Figure 7
2.2.2 Test Prep
STAC automation scripts started and stopped all required SUT components, ran the benchmark, and
collected results.
The SWIM “GenerateReplayScript” program was used to generate job replay scripts. This program
generates individual job run scripts and a main run-jobs-all.sh script in a scriptsTest directory to run all
24,442 jobs created from the Facebook trace. The run-jobs-all.sh runs the individual job scripts according
to the timing from the trace. We modified this script to run only the first 302 jobs, as explained above.
For this test, the recommended parameters from the SWIM benchmark tools were used with one
exception: the cluster size (parameter (highlighted in red, below) was changed from the default of 16 to
17, to match the number of nodes in the SUT. GenerateReplayScript uses this parameter to scale the
workload down from the number of nodes in the original Facebook cluster (3000).
java GenerateReplayScript \
FB-2010_samples_24_times_1hr_0.tsv \
3000 \
17 \
67108864 \
6000\
scriptsTest\
workGenInput\
workGenOutputTest\
67108864\
workGenLogs\
hadoop\
WorkGen.jar\
' /opt/ibm/biginsights/hadoop-conf/workGenKeyValue_conf.xsl'

STAC Report IBM InfoSphere BigInsights Enterprise Edition - SWIM 2010, Rev 1.0
©2013 Securities Technology Analysis Center, LLC Page 13 of 24
The synthetic input, output, and shuffle data were created in HDFS using a Java class (HDFSWrite.java
compiled to HDFSWrite.jar) and configuration files provided by the SWIM benchmark tools. The
generated data consisted of random characters and was generated once for all test runs and used by
both Hadoop and BigInsights. STAC verified that the data blocks were balanced across the cluster.
The MapReduce tasks are encoded in the WorkGen.java class provided with the SWIM benchmark tools.
This class uses the Java MapReduce API to encapsulate the map function, the reduce function and code
to run the entire job. The map function reads from input files and writes random data into intermediate
output files based on parameters from the original Facebook traces. The reduce function also writes
random data into output files based on parameters provided by the SWIM tools. The same WorkGen.jar
file was used with both BigInsights and Hadoop test runs.
STAC verified that the source code for the SWIM tools matched a fresh copy downloaded from github and
that the same job logic (WorkGen.jar) was used in the BigInsights and Hadoop runs. STAC also verified
that the parameters used in SWIM configuration files matched those recommended in the SWIM tools
package.
2.2.3 Procedure
We tested each system three times in succession to account for variability.
The following was the procedure for each test run with Hadoop:
1) Verify cluster servers are cleaned up from previous tests
2) Start HDFS
3) Start Hadoop map reduce services
4) Run SWIM test by invoking “run-jobs-all.sh” using Hadoop
5) Wait for SWIM test to complete
6) Save off test-specific results and logs
7) Stop Hadoop map reduce services
8) Stop HDFS
The following was the procedure for each test run with BigInsights:
1) Verify cluster servers are cleaned up from previous tests
2) Start HDFS
3) Start BigInsights map reduce services
4) Run SWIM test by invoking “run-jobs-all.sh” using BigInsights
5) Wait for SWIM test to complete
6) Save off test specific results and logs
7) Stop BigInsights map reduce services
8) Stop HDFS

STAC Report IBM InfoSphere BigInsights Enterprise Edition - SWIM 2010, Rev 1.0
©2013 Securities Technology Analysis Center, LLC Page 14 of 24
2.2.4 Time synchronization
STAC determined by code inspection that the SWIM code obtained all timestamps for a given job on the
same master node by creating two Java Date objects and subtracting the difference. Thus no inter-server
synchronization was required.
2.3 Sleep Benchmark
2.3.1 Overview
The tester specifies the number of mappers and reducers and the amount of time that each should sleep.
Each task uses no CPU, memory, disk, or network I/O.
2.3.2 Test Setup
STAC automation scripts started and stopped all required SUT components, ran the sleep job, and
collected results. All sleep tests were run on the same test setup as the SWIM tests. For both Hadoop
and BigInsights, the sleep test was executed using the sleep example provided in the hadoop-examples-
1.1.2.jar file from the Apache Hadoop package.
Following the precedent mentioned above, each map and reduce activity was configured to sleep for 1
millisecond. Via command line, the sleep job was configured to initiate 5000 mappers and one reducer.
The sleep command was wrapped with the Linux “time” utility in order to measure the time required to
complete the full sleep job.
STAC verified that the same jar file was used for BigInsights and Hadoop sleep tests.
2.3.3 Test Procedures
To account for variability and one-time startup overhead, there were three sets of tests run in succession.
Each test set comprised an initial “cold” test run done just after restarting all SUT components followed by
three “warm” test runs. In total there were 3 cold test runs and 9 warm test runs for each SUT. See the
Vendor Commentary for details of cold and warm runs on IBM BigInsights.
The following was the procedure for each test run with Hadoop:
1) Verify cluster servers are cleaned up from previous tests
2) Start HDFS
3) Start Hadoop map reduce services
4) Run SLEEP test with Hadoop using the parameters “-Dpmr.shuffle.pas=false -mt 1 -rt 1 -
m 5000 -r 1” and using the Linux “time” utility to track the elapsed time of the test.
5) Wait for SLEEP test to complete
6) Save the elapsed time of the test.
7) Stop Hadoop map reduce services
8) Stop HDFS
The following was the procedure for each test run with BigInsights:

STAC Report IBM InfoSphere BigInsights Enterprise Edition - SWIM 2010, Rev 1.0
©2013 Securities Technology Analysis Center, LLC Page 15 of 24
1) Verify cluster servers are cleaned up from previous tests
2) Start HDFS
3) Start BigInsights map reduce services
4) Run SLEEP test with BigInsights using the parameters “-Dpmr.shuffle.pas=false -mt 1 -rt 1
-m 5000 -r 1” and using the Linux “time” utility to track the elapsed time of the test.
5) Wait for SLEEP test to complete
6) Save the elapsed time of the test.
7) Stop BigInsights map reduce services
8) Stop HDFS
9) Verify that no errors occurred during test runs and that all nodes are operational.
2.3.3 Metrics
In the case of the Sleep benchmark, we decided to report statistics separately for "cold" runs (those which
occur immediately after system restart) and "warm" runs (all runs following a cold run, before the next
system restart). The reason is that unlike standard Hadoop, which requires software to be up and running
before jobs are submitted, Adaptive MapReduce starts up components upon receipt of the first job. Thus,
the jobs submitted just after a system restart experience delays. Most customers would consider the cold
runs to be irrelevant, since Hadoop clusters are usually running for long periods, if not continuously.
However, never ones to throw out data, we include results for the cold runs for completeness.6
2.4 Limitations
As with any benchmark project, this one had limitations:
Relevance of workloads. As discussed in the Test Methdology overview, there are many
advantages to the diverse Facebook-based SWIM workload, but its relevance to the MapReduce
workloads of any given reader is unknown.
No compute. The SWIM jobs do not run any analytics. They merely move data back and forth. This
constrains their relevance to those jobs that are primarily I/O-bound. Fortunately for the benchmark,
the real world is full of those.
Sensitivity to tuning. Hadoop and BigInsights were deployed on the same HDFS configuration,
operating system, JVM, storage, and networks, and the number of map and reduce slots were the
same. The settings for Hadoop and BigInsights were default except as noted. It is possible that
different settings for Hadoop or BigInsights could achieve different results.
6 By contrast, cold and warm runs are not separated in the SWIM results. Because the SWIM jobs are more realistic
than the trivial sleep job, the effect of startup delays is not significant enough to draw out.

STAC Report IBM InfoSphere BigInsights Enterprise Edition - SWIM 2010, Rev 1.0
©2013 Securities Technology Analysis Center, LLC Page 16 of 24
3. System Specifications
3.1 Overview
Figure 8 shows the SUT setup. Seventeen (17) IBM servers were the compute nodes and one (1) server
was the master. STAC verified that all servers had a common hardware and software configuration. Each
compute node had twelve (12) hard drives. Each node was connected by 10 GbE which was used for all
connectivity between servers in the cluster during tests. The BigInsights and Apache Hadoop software
were installed on the servers. Both products operated on the same HDFS-formatted data store.
Figure 8: SUT Setup Hadoop was configured so that each compute node had 16 mappers and 8 reducers, or 272 mappers
and 136 reducers across the entire cluster, for a total of 408 slots. The total of mappers and reducers
mapped 1:1 to the number of virtual CPU cores (twice the number of physical cores, since hyperthreading
was enabled). BigInsights with Adaptive MapReduce enabled allocates map and reduce tasks
dynamically, so explicit task configuration was not required. The system was configured for 24 slots per
node, or 408 in total, the same number of slots as the Hadoop configuration. STAC verified that the same
JVM tunings were applied to map reduce tasks on BigInsights and Hadoop.
3.2 Configuration Details
Details of the SUT configuration are available in the STAC Vault to qualified members of the STAC
Benchmark Council at www.stacresearch.com/node/15369. This includes detailed hardware descriptions
as well as configuration parameters for the OS, JVM, Hadoop, and BigInsights software.

STAC Report IBM InfoSphere BigInsights Enterprise Edition - SWIM 2010, Rev 1.0
©2013 Securities Technology Analysis Center, LLC Page 17 of 24
4 Results
4.1 SWIM – Test Results
4.1.1 Headline results
Table 1 compares statistics for the job durations using Hadoop and BigInsights. The mean job durations
for Hadoop and BigInsights, respectively, were approximately 15 seconds and 5 seconds. BigInsights’
mean job duration was approximately 3 times shorter than that of Hadoop.
Table 1 - JOB DURATION (seconds)
MIN MEAN MAX
Hadoop 12 14.7 151
BigInsights 2 5.4 171
For each job, we also computed the ratio of the Hadoop job duration to the BigInsights job duration. This
equals the ratio of BigInsights speed to Hadoop speed. Table 2 summarizes the statistics for this ratio,
and Figure 9 shows them graphically. The average ratio was 3.8x.
Table 2 - JOB DURATION RATIOS (Hadoop duration/BigInsights duration)
MIN MEAN MEDIAN MAX
0.8x 3.8x 4.3x 6.5x
Figure 9

STAC Report IBM InfoSphere BigInsights Enterprise Edition - SWIM 2010, Rev 1.0
©2013 Securities Technology Analysis Center, LLC Page 18 of 24
In the worst case, BigInsights performed about 20% slower than pure Apache Hadoop. However, as
Figure 10 shows, only three jobs (less than 1%) were actually slower. Most were over 4 times faster with
BigInsights, with over half the jobs coming in 4.3 times faster (specifically, Hadoop taking 13 seconds and
BigInsights taking 3 seconds). In the best case, BigInsights performed 550% better than pure Apache
Hadoop (6.5x). In the next section, we analyze what differentiates these jobs.
Figure 10
4.1.2 Sensitivity of the BigInsights advantage
As in [2], we found that of the three data sizes characterizing a job (input size, output size, and shuffle
size) and combinations of those three, the BigInsights speedup was most closely correlated with shuffle
size.
Figure 11 plots BigInsights’ speedup for each job (Hadoop job duration divided by BigInsights job
duration) against the shuffle size for the job. Although at shuffle sizes below 10KB there is significant
variability relative to the trend, above 10KB, a clear negative correlation develops.
The bottom line is that on this cluster, BigInsights normally enjoyed a roughly 4x advantage over Apache
Hadoop until the shuffle size exceeded 10KB. At shuffle sizes greater than 10KB, the performance starts
to converge, although even at 100MB, BigInsights is roughly 2x faster.

STAC Report IBM InfoSphere BigInsights Enterprise Edition - SWIM 2010, Rev 1.0
©2013 Securities Technology Analysis Center, LLC Page 19 of 24
Figure 11
Figure 12

STAC Report IBM InfoSphere BigInsights Enterprise Edition - SWIM 2010, Rev 1.0
©2013 Securities Technology Analysis Center, LLC Page 20 of 24
Plotting the mean job durations for Hadoop and BigInsights against shuffle size as in Figure 12 reveals
the nature (though not the source) of the variabilty in speedup at smaller shuffle sizes. Hadoop delivers a
very consistent job time of 13 seconds at shuffle sizes up to about 10MB. While almost always shorter,
BigInsights job times vary considerably. This may have something to do with the "adaptive" nature of
Adaptive MapReduce, but further investigation was outside the scope of this project. To be clear, while
Hadoop performance was more consistent, it was consistently worse. BigInsights was almost always
faster than Hadoop, but the extent to which it was faster varied in ways not obviously correlated to job
sizes.
4.2 Sleep – Test Results
The negative relationship between BigInsights’ speed advantage and the shuffle size of the job at larger
shuffle sizes is consistent with IBM’s contention that BigInsights Adaptive MapReduce enjoys a significant
advantage in scheduling latency. When most of the job time is I/O, improvements in scheduling have a
lower relative impact.
To measure the scheduling advantage directly, we ran a simple sleep test, as described in Section 2.3.
Table 3 displays the results for warm runs. As explained in section 2.3.3 Metrics, results for warm runs
are relevant to Hadoop clusters that are running before jobs are submitted. BigInsights outperformed
Hadoop in this benchmark by about 11x. Hadoop could execute approximately 62 tasks per second, while
BigInsights could execute 665 tasks per second.
Table 3 - RESPONSE TIMES FOR SLEEP TEST
(WARM RUNS)
Hadoop IBM BigInsights
Warm Run
Time to execute 5000 map tasks
(sec)
Tasks per
second
Time to execute 5000 map tasks
(sec)
Tasks per
second
1 80.63 62.01 7.50 666.67
2 81.57 61.30 7.40 675.68
3 80.51 62.10 7.50 666.67
4 81.37 61.45 7.42 673.85
5 80.56 62.07 7.53 664.01
6 81.32 61.49 7.51 665.78
7 81.35 61.46 7.68 651.04
8 80.73 61.93 7.59 658.76
9 81.53 61.33 7.52 664.89
Mean 81.06 61.68 7.52 665.26
STAC Report IBM InfoSphere BigInsights Enterprise Edition - SWIM 2010, Rev 1.0
©2013 Securities Technology Analysis Center, LLC Page 21 of 24
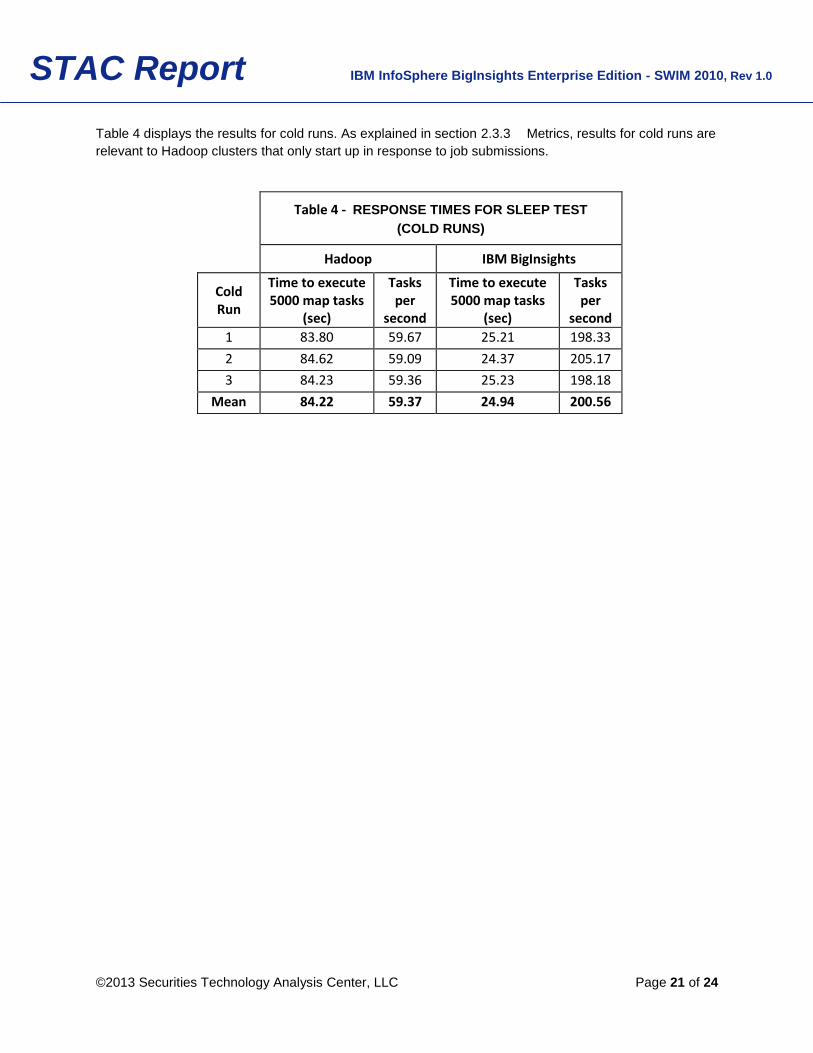
Table 4 displays the results for cold runs. As explained in section 2.3.3 Metrics, results for cold runs are
relevant to Hadoop clusters that only start up in response to job submissions.
Table 4 - RESPONSE TIMES FOR SLEEP TEST
(COLD RUNS)
Hadoop IBM BigInsights
Cold Run
Time to execute 5000 map tasks
(sec)
Tasks per
second
Time to execute 5000 map tasks
(sec)
Tasks per
second
1 83.80 59.67 25.21 198.33
2 84.62 59.09 24.37 205.17
3 84.23 59.36 25.23 198.18
Mean 84.22 59.37 24.94 200.56

STAC Report IBM InfoSphere BigInsights Enterprise Edition - SWIM 2010, Rev 1.0
©2013 Securities Technology Analysis Center, LLC Page 22 of 24
5 Vendor Commentary
IBM provided the following comments on this report (the views expressed are those of IBM):
Cold vs. Warm start runs
In BigInsights 2.1.0.1 (which embeds the Platform Symphony scheduler), on the first invocation of
a Hadoop job the MapReduce client will interact with a Symphony supplied session manager to
dynamically start service instances on each Hadoop host. The service instances each need to
start a JVM to run the Hadoop TaskTracker logic and load the JAR file containing actual map and
reduce task logic. The reason for the delay on the very first run is that there are 17 hosts x 24
services per host on the system under test for a total of 408 services instances that all need to be
started. Symphony will start to handle tasks immediately as services are started, but the cluster
cannot operate at full capacity until all 408 services instances are started which takes some time.
This is especially noticeable in the Sleep test because the job (comprised of 5,000 x 1 msec
tasks) is relatively short running. This means that this "cold" start up time is long relative to the
actual execution time of the job. Following execution of the first job, Symphony will leave the
services started assuming that they will be needed again, so subsequent jobs do not incur the
overhead of starting services. This same issue exists with the SWIM test also, but this test was a
series of ~300 separate jobs and the delays would have only impacted the first job, making the
impact on the observed run-time minimal.
Results
We wish to thank the team at STAC for their thorough and professional evaluation of IBM
InfoSphere BigInsights enabled with Adaptive MapReduce. We were pleased to see our assertion
that BigInsights delivers a performance advantage borne out in this series of tests. We are
hopeful that this result will be of interest to organizations who are either running or considering
running Hadoop MapReduce applications.
One area IBM is interested in exploring further is the sensitivity of performance results to the
Hadoop MapReduce heartbeat interval (the Hadoop parameter
“mapreduce.jobtracker.heartbeats.in.second”). As of Hadoop 1.0.1, the default value for this
parameter was lowered from 3 seconds to 300 msecs in open source Hadoop. (see the
explanation at https://issues.apache.org/jira/browse/MAPREDUCE-1906). This project used the
new default value of 300 milliseconds recommended for small clusters. We believe that as
Hadoop production clusters become large, comprised of hundreds or thousands of nodes,
scalability with open source Hadoop will dictate that the frequency of heartbeats be reduced to
avoid overwhelming the job tracker (per configuration guidance). We would recommend
companies deploying open source Hadoop consider this variable in their architecture and service
level planning. Companies deploying BigInsights should test BigInsights with Adaptive
MapReduce versus open source Hadoop, especially with larger clusters, where one could expect
to see a wider performance gap between the BigInsights result and the open source Hadoop
result. We hope to independently validate this assertion in future with additional tests.
Although not covered in this benchmark, we wanted also to share with readers that IBM
InfoSphere BigInsights can optionally be deployed on a shared IBM Platform Symphony

STAC Report IBM InfoSphere BigInsights Enterprise Edition - SWIM 2010, Rev 1.0
©2013 Securities Technology Analysis Center, LLC Page 23 of 24
Advanced Edition cluster. When deployed in this configuration, InfoSphere BigInsights becomes
one of many possible tenants able to share a common infrastructure managed by IBM Platform
Symphony. We believe that this ability to share resources between Hadoop and non-Hadoop
workloads will be especially interesting to financial services firms, many of whom already run
compute grids for monte-carlo simulations common in risk analytics applications. By deploying
IBM Platform Symphony together with InfoSphere BigInsights, clients can deploy a Big Data
infrastructure to run Hadoop applications that is capable of supporting other existing types of
workloads as well.
STAC Report IBM InfoSphere BigInsights Enterprise Edition - SWIM 2010, Rev 1.0
©2013 Securities Technology Analysis Center, LLC Page 24 of 24
About STAC
STAC® is a technology-research firm that facilitates the STAC Benchmark™ Council
(www.STACresearch.com/council), an organization of leading financial institutions and
technology vendors that specifies standard ways to assess technologies used in the
financial markets. The Council is active in an expanding range of low-latency, big-
compute, and big-data workloads.
STAC helps end-user firms relate the performance of new technologies to that of their
existing systems by supplying them with STAC Benchmark reports as well as standards-
based STAC Test Harnesses™ for rapid execution of STAC Benchmarks in their own
labs. End users do not disclose their results. Some STAC Benchmark results from
vendor-driven projects are made available to the public, while those in the STAC Vault™
are reserved for qualified members of the Council (see www.STACresearch.com/vault).
To be notified when new STAC Reports™ become available, please sign up for free at
www.STACresearch.com.