Embed Size (px)
Citation preview

processes
Article
Comparison of Packed-Bed and Micro-ChannelReactors for Hydrogen Production viaThermochemical Cycles of Water Splitting in thePresence of Ceria-Based Catalysts
Nonchanok Ngoenthong 1, Matthew Hartley 2, Thana Sornchamni 3, Nuchanart Siri-nguan 3,Navadol Laosiripojana 4 and Unalome Wetwatana Hartley 1,4,*
1 Chemical and Process Engineering, The Sirindhorn International Thai-German Graduate School ofEngineering (TGGS), King Mongkut’s University of Technology North Bangkok, Bangkok 10800, Thailand;[email protected]
2 Chemical Engineering Department, Engineering Faculty, King Mongkut’s University of Technology NorthBangkok, Bangkok 10800, Thailand; [email protected]
3 PTT Public Company Limited, 555 Vibhavadi Rangsit Road, Chatuchak, Bangkok 10900, Thailand;[email protected] (T.S.); [email protected] (N.S.-n.)
4 Joint Graduate School of Energy and Environment (JGSEE), King Mongkut’s University of TechnologyThonburi, Bangkok 10140, Thailand; [email protected]
* Correspondence: [email protected]
Received: 26 August 2019; Accepted: 15 October 2019; Published: 18 October 2019�����������������
Abstract: Hydrogen production via two-step thermochemical cycles over fluorite-structure ceria(CeO2) and ceria-zirconia (Ce0.75Zr0.25O2) materials was studied in packed-bed and micro-channelreactors for comparison purposes. The H2-temperature program reduction (H2-TPR) results indicatedthat the addition of Zr4+ enhanced the material’s reducibility from 585 µmol/g to 1700 µmol/g,although the reduction temperature increased from 545 to 680 ◦C. Ce0.75Zr0.25O2 was found to offerhigher hydrogen productivity than CeO2 regardless of the type of reactor. The micro-channel reactorshowed better performance than the packed-bed reactor for this reaction.
Keywords: hydrogen production; thermochemical cycles; micro-channel reactor; ceria; ceria-zirconia;water splitting; oxygen carrier
1. Introduction
Hydrogen can be utilized in many modern-world applications. Its well-known challenges includeproduction cost, transportation and storage. Hydrogen can be produced by various means, e.g.,thermochemical processes, reforming processes, gasification, electrolysis, biological processes, andso on [1–8]. Conventional hydrogen production from either natural gas, coal, or biomass appearsto be the most commercially available and affordable, although this unavoidably releases carbonemissions, radioactive elements, and air-borne pollutions into the atmosphere. Hydrogen productionfrom water is a green technology in which water is split, producing high-purity gaseous hydrogen.Recent water splitting processes including, for instance, photo-catalytic, two-step thermochemicalcycles, electrolysis and biological processes have been employed to generate high-purity hydrogen.The two-step thermochemical cycle possesses advantages over the others in terms of the product’spurity and yield [9]. The two-step thermochemical cycle reaction consists of (1) endothermic reduction,where the metal oxide material is reduced by thermal energy and/or chemical reducing agents, resultingin gaseous oxygen as a by-product and an active and non-stoichiometric reduced metal oxide, (2)exothermic oxidation, where the active metal oxides are oxidized by water, giving high-purity hydrogen
Processes 2019, 7, 767; doi:10.3390/pr7100767 www.mdpi.com/journal/processes

Processes 2019, 7, 767 2 of 12
as a product while the metal oxide is recycled back into its original stage [10–12]. The operatingconditions—i.e., temperature, feed reactant and reaction time—of the two steps are different. Thus,the process can either be carried out in (1) two reactors between which the solid material is moved,or (2) one reactor in which the operating conditions are switched back and forth from the reductionto the oxidation step. The former is suitable for solid materials that have high mechanical strength,have changed phase, and have been fully reduced/oxidized based on their stoichiometry, such asZnO/Zn [13], CdO/Cd [14], SnO2/SnO [15], and GeO2/GeO [16], although the process requires asophisticated quenching and control system. The latter is commonly used with materials with nophase change. The materials could be either stoichiometric redox materials such as Fe3O4/FeO [17],MFe2O4 [18], and CoFe2O4/Al2O3 [19], or non-stoichiometric redox materials such as, for example, ceriaand ceria-based materials [20–22], and perovskites [23]. Ceria (CeO2) and ceria-zirconia (CeO2/ZrO2)were selected as the oxygen carrier in this work, as they offer (1) high oxygen storage capacity [24,25],(2) high thermal stability, and (3) the possibility of being fabricated as the whole reactor itself. Althoughthe latter process does not require a quenching system and complicated fluidized bed operation, itneeds a well-established control system that allows the operational conditions to switch from reductionto oxidation steps precisely. Regardless of the quality of the control system, the switching betweenconditions (temperature, feed) still causes low overall process efficiency (10 to 50%) [26–29]. Therefore,a reactor that offers rapid heat and mass transfer during the change is beneficial for this process.Additionally, the redox materials must be able to withstand the severe condition swing. This workstudied the process under the same reduction and oxidation temperature, aiming to (1) optimizethe process efficiency and product yield, (2) ease the control system, and (3) make it possible to usewider variety of the new catalysts. A micro-channel reactor was also applied to enable rapid mas/heattransfer, with shorter residence time.
2. Methodology
2.1. Catalyst Preparation, Substrate Pretreatment and Catalyst Coating
2.1.1. Catalyst Preparation
Nitrate precursors of Ce and Zr were mixed with 0.1 M cetyl trimethyl ammonium bromide(CTAB) at room temperature while NaOH was added dropwise, keeping pH at 11 while stirring. Molarratio of CTAB to total cations (Ce + Zr) was fixed at 0.8. The mixture was centrifuged at 4000 rpm for10 min, and then washed with de-ionized water to remove any possible impurities. The precipitatewas dried in the oven at 120 ◦C overnight and calcined at 700 ◦C for 3 h in air with 2 ◦C/min heatingrate. For the micro-channel reactor, alumina solution was additionally synthesized by hydrolysis ofaluminum tri-sec-butoxide (Aldrich, St. Louis, MO, USA, 97%) with a molar ratio of H2O to Al = 100 toenhance the adhesion force between the catalyst power and the surface of the substrate. The solutionwas peptized by adding nitric acid (HNO3/Al = 0.07) and refluxed at 85 ◦C for 20 h. After that, nitrateprecursors of Ce and Zr were dissolved into the prepared alumina solution. The mixed solution washeated at 85 ◦C until a thixotropic solution was obtained. The gel was dried at 110 ◦C overnight andcalcined at 800 ◦C for 6 h at a heating rate of 2 ◦C/min.
2.1.2. Stainless Steel Substrate Preparation
The lab-designed micro-structured stainless steel (316L) plates were commercially made (TGI,Chonburi, Thailand), as shown in Figure 1. Each substrate has 14 channels with 300 µm depth, 370 µmwidth and 25 mm length per channel. The plates were cleaned by etching with 20% citric acid in anultrasonic bath for 30 min. They were subsequently annealed at 800 ◦C for 2 h in air to form a layer ofmixed metal oxides for better adhesion strength.

Processes 2019, 7, 767 3 of 12
2.1.3. Catalyst Coating
Polyvinyl alcohol was dissolved in deionized water while stirring at 400 rpm at 65 ◦C for 2 h.The solution was left overnight without stirring. The catalyst powder and acetic acid were addedto the solution. The weight ratio of catalyst powder to water to binder to acid was 10 to 84 to 5 to 1.The resulting suspension was stirred at 65 ◦C for 2 h, cooled to room temperature, and subsequentlystirred for 3 days. The non-coating area of the micro-structured stainless steel plates, such as the inletand the outlet, were covered with the polymer film. The prepared suspension was wash-coated on themicro-channel substrate, then left to dry at room temperature for 6 h. After the removal of the polymerfilm, the substrate was dried in an oven at 120 ◦C and calcined at 500 ◦C for 3 h at a heating rate of1 ◦C/min. The 2 micro-channel substrates were then laser-welded together. The gas inlet and outlet atthe top and bottom were connected to 1/8-inch stainless steel tubing.
Processes 2019, 7, 767 3 of 12
resulting suspension was stirred at 65 °C for 2 h, cooled to room temperature, and subsequently stirred for 3 days. The non-coating area of the micro-structured stainless steel plates, such as the inlet and the outlet, were covered with the polymer film. The prepared suspension was wash-coated on the micro-channel substrate, then left to dry at room temperature for 6 h. After the removal of the polymer film, the substrate was dried in an oven at 120 °C and calcined at 500 °C for 3 h at a heating rate of 1 °C/min. The 2 micro-channel substrates were then laser-welded together. The gas inlet and outlet at the top and bottom were connected to 1/8-inch stainless steel tubing.
Figure 1. Stainless steel 316L micro-channeled plate.
2.2. Characterization
The crystallinity of the synthesized catalysts was characterized using X-ray diffraction (XRD). The morphology of the stainless steel substrates, before and after the annealing process at different temperatures, was characterized using scanning electron microscopy (SEM). The reduction temperature of the samples was investigated using the H2-temperature program reduction technique (H2-TPR). During the H2-TPR, 10% H2/Ar was passed through the catalyst’s bed in the reactor. The temperature was increased from room temperature to 950 °C, at a heating rate of 5 °C/min, and held for 30 min. The gaseous products were analyzed using on-line mass spectrometer (MS, GSD 320 O1, OmniStar gas analysis) for all experiments.
2.3. Experimental Set-Up
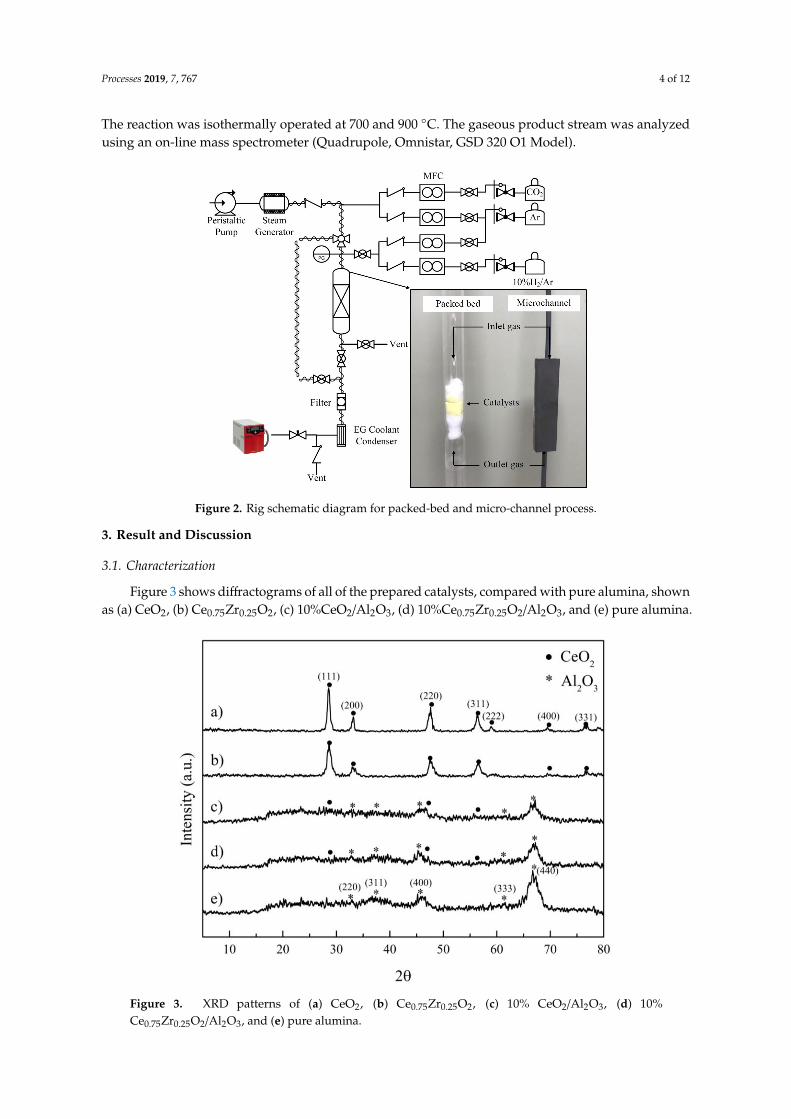
The catalysts were pelletized and sieved to 180–212 µm for the packed-bed reactor, and <38 µm for the micro-channel reactor. The weight of the catalyst was 1 g and 8–15 mg for the packed-bed reactor and the micro-channel reactor, respectively. Each catalyst was placed inside the quartz tube packed-bed reactor (i.d. = 10 mm, length = 50 cm) between two layers of quartz wool. The packed-bed and micro-channel reactors were placed in the middle of an electrical furnace (Inconel, 20 cm heating zone). The schematic diagram of the experiments is shown in Figure 2. The system was purged by 300 mL/min of Ar using a mass flow controller (New Flow-TLFC-00-A-1-W-2, 10–500 mL/min) at room temperature for 1 h. Each catalyst was reduced before use in 10% H2/Ar at 700 and 900 °C, in accordance with the TPR results, for 30 min. Steam was generated using a steam generator, whereby the amount of water was controlled by peristaltic pump (BT100M Model, 0.00067–65 mL/min). Steam was delivered to the reactor system through a 170 °C trace-heated line to prevent condensation. The total flow rate of 200 mL/min, which ensured the reaction control regime, was fixed for all of the experiments. The reaction was isothermally operated at 700 and 900 °C. The gaseous product stream was analyzed using an on-line mass spectrometer (Quadrupole, Omnistar, GSD 320 O1 Model).
Figure 1. Stainless steel 316L micro-channeled plate.
2.2. Characterization
The crystallinity of the synthesized catalysts was characterized using X-ray diffraction (XRD).The morphology of the stainless steel substrates, before and after the annealing process at differenttemperatures, was characterized using scanning electron microscopy (SEM). The reduction temperatureof the samples was investigated using the H2-temperature program reduction technique (H2-TPR).During the H2-TPR, 10% H2/Ar was passed through the catalyst’s bed in the reactor. The temperaturewas increased from room temperature to 950 ◦C, at a heating rate of 5 ◦C/min, and held for 30 min.The gaseous products were analyzed using on-line mass spectrometer (MS, GSD 320 O1, OmniStar gasanalysis) for all experiments.
2.3. Experimental Set-Up
The catalysts were pelletized and sieved to 180–212 µm for the packed-bed reactor, and <38 µmfor the micro-channel reactor. The weight of the catalyst was 1 g and 8–15 mg for the packed-bedreactor and the micro-channel reactor, respectively. Each catalyst was placed inside the quartz tubepacked-bed reactor (i.d. = 10 mm, length = 50 cm) between two layers of quartz wool. The packed-bedand micro-channel reactors were placed in the middle of an electrical furnace (Inconel, 20 cm heatingzone). The schematic diagram of the experiments is shown in Figure 2. The system was purged by300 mL/min of Ar using a mass flow controller (New Flow-TLFC-00-A-1-W-2, 10–500 mL/min) atroom temperature for 1 h. Each catalyst was reduced before use in 10% H2/Ar at 700 and 900 ◦C, inaccordance with the TPR results, for 30 min. Steam was generated using a steam generator, whereby theamount of water was controlled by peristaltic pump (BT100M Model, 0.00067–65 mL/min). Steam wasdelivered to the reactor system through a 170 ◦C trace-heated line to prevent condensation. The totalflow rate of 200 mL/min, which ensured the reaction control regime, was fixed for all of the experiments.
Processes 2019, 7, 767 4 of 12
The reaction was isothermally operated at 700 and 900 ◦C. The gaseous product stream was analyzedusing an on-line mass spectrometer (Quadrupole, Omnistar, GSD 320 O1 Model).Processes 2019, 7, 767 4 of 12
Figure 2. Rig schematic diagram for packed-bed and micro-channel process.
3. Result and Discussion
3.1. Characterization
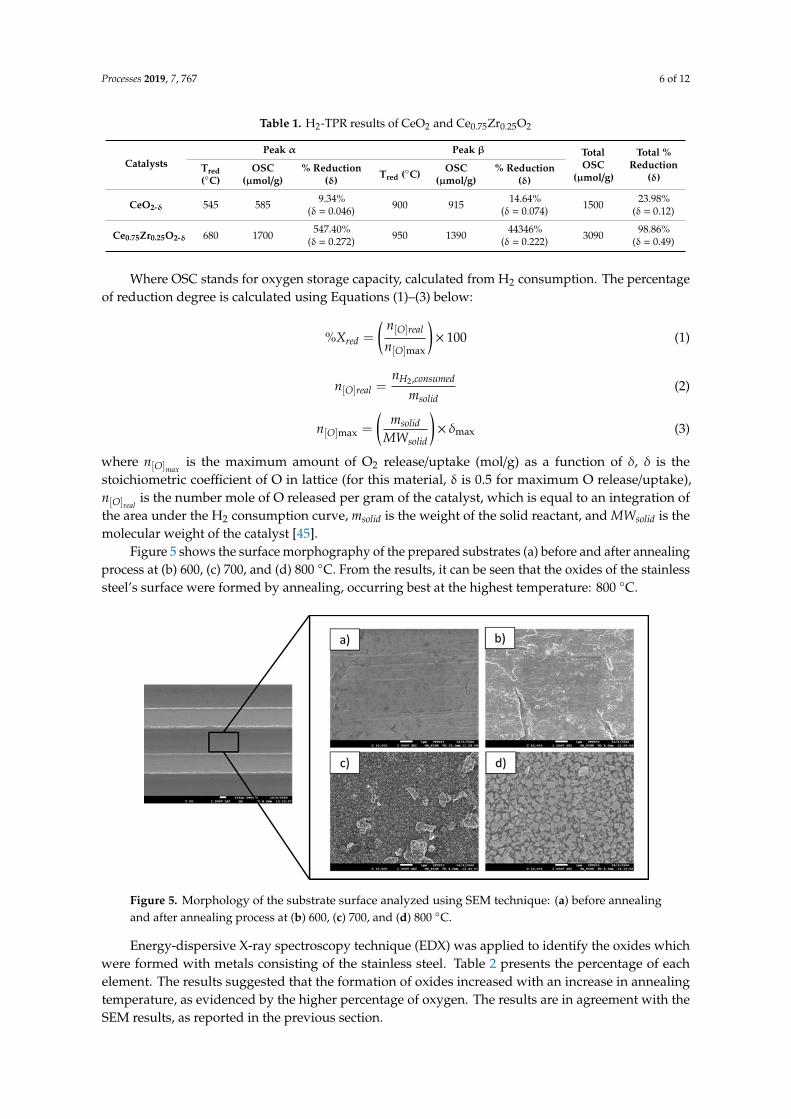
Figure 3 shows diffractograms of all of the prepared catalysts, compared with pure alumina, shown as (a) CeO2, (b) Ce0.75Zr0.25O2, (c) 10%CeO2/Al2O3, (d) 10%Ce0.75Zr0.25O2/Al2O3, and (e) pure alumina.
Figure 3. XRD patterns of (a) CeO2, (b) Ce0.75Zr0.25O2, (c) 10% CeO2/Al2O3, (d) 10% Ce0.75Zr0.25O2/Al2O3, and (e) pure alumina.
Figure 2. Rig schematic diagram for packed-bed and micro-channel process.
3. Result and Discussion
3.1. Characterization
Figure 3 shows diffractograms of all of the prepared catalysts, compared with pure alumina, shownas (a) CeO2, (b) Ce0.75Zr0.25O2, (c) 10%CeO2/Al2O3, (d) 10%Ce0.75Zr0.25O2/Al2O3, and (e) pure alumina.
Processes 2019, 7, 767 4 of 12
Figure 2. Rig schematic diagram for packed-bed and micro-channel process.
3. Result and Discussion
3.1. Characterization
Figure 3 shows diffractograms of all of the prepared catalysts, compared with pure alumina,
shown as (a) CeO2, (b) Ce0.75Zr0.25O2, (c) 10%CeO2/Al2O3, (d) 10%Ce0.75Zr0.25O2/Al2O3, and (e) pure
alumina.
Figure 3. XRD patterns of (a) CeO2, (b) Ce0.75Zr0.25O2, (c) 10% CeO2/Al2O3, (d) 10% Ce0.75Zr0.25O2/Al2O3,
and (e) pure alumina.
Figure 3. XRD patterns of (a) CeO2, (b) Ce0.75Zr0.25O2, (c) 10% CeO2/Al2O3, (d) 10%Ce0.75Zr0.25O2/Al2O3, and (e) pure alumina.

Processes 2019, 7, 767 5 of 12
CeO2 and Ce0.75Zr0.25O2 possessed a fluorite cubic structure with a face-centered cubic crystalsystem (FCC), which offers a high thermal stability and oxygen exchange kinetic rate [30–32]. CeO2
and Ce0.75Zr0.25O2 presented a lattice plane corresponding to the (111), (200), (220), (311), (222), (400)and (331) [33,34]. Their average crystal size, calculated using the Scherer equation, was 15.15 nmand 9.01 nm, respectively. Pure alumina was η-alumina and had a bayerite structure. Each peakcorresponded to the (220), (311), (400), (333), and (440) lattice planes [35,36]. Both 10% CeO2/Al2O3 and10% Ce0.75Zr0.25O2/Al2O3 showed η-alumina bayerite structures as a major crystalline phase, whileCeO2 and Ce0.75Zr0.25O2 showed them as minor crystalline phase. The non-alumina catalysts wereselected for the further study.
CeO2 and Ce0.75Zr0.25O2 showed two main reduction peaks at different temperatures, shown inFigure 4. Ceria and ceria-zirconia started to be reduced at the same temperatures, with the first peak at300 ◦C (peaks α) and the second peak at 650 ◦C (peaks β). However, broader reduction peaks wereobserved in the ceria-zirconia due to the larger amount of oxygen release in ceria-zirconia. This led to ahigher average reduction temperature for ceria-zirconia (680 and 950 ◦C), when compared to ceria (545and 900◦C), respectively. The results agreed with previous works reported by other researchers [37–40].The first peaks of both catalysts were defined as surface reduction, evidenced by the steep reductionpeaks, while the second peaks comprised bulk reductions, which were much broader compared to thefirst peaks due to the much slower solid-state oxygen diffusion within the materials. From the H2-TPRprofiles of both catalysts, it can be seen that ceria-zirconia had a higher reduction rate than ceria, andreleased a higher amount of oxygen within the studied temperature range. The addition of Zr into theceria catalyst system has been suggested to affect the material’s cell volume, resulting in an increase insurface area [41–44]. The degree of the reduction, represented by the non-stoichiometric oxygen release(δ), is calculated and tabulated in Table 1. For CeO2, the surface oxygen was released at 545 ◦C, givingδ at 0.046 (theoretically maximum at 0.5) and percentage of reduction at 9.34%, where the material wasreduced to CeO1.95. The second peak of CeO2 showed that the bulk oxygen was reduced at 900 ◦C,giving 0.074 of δ, which is equal to a reduction of 14.64%. At this stage, the CeO1.88 became CeO1.94.Similarly, ceria-zirconia was surface reduced and bulk reduced at 680 ◦C and 950 ◦C, respectively.The first reduction peak represented a δ of 0.277, with a reduction degree of 54.40%, while the secondpeak gave a δ of 0.222, with a reduction degree of 44.46%. The non-stoichiometric molecular formulaof the ceria-zirconia after being reduced at 950 ◦C was Ce0.75Zr0.25O1.51. Ce0.75Zr0.25O2 conclusivelyshowed better performance, compared to ceria, in terms of reduction rate and reducibility.
Processes 2019, 7, 767 5 of 12
CeO2 and Ce0.75Zr0.25O2 possessed a fluorite cubic structure with a face-centered cubic crystal system (FCC), which offers a high thermal stability and oxygen exchange kinetic rate [30–32]. CeO2 and Ce0.75Zr0.25O2 presented a lattice plane corresponding to the (111), (200), (220), (311), (222), (400) and (331) [33,34]. Their average crystal size, calculated using the Scherer equation, was 15.15 nm and 9.01 nm, respectively. Pure alumina was η-alumina and had a bayerite structure. Each peak corresponded to the (220), (311), (400), (333), and (440) lattice planes [35,36]. Both 10% CeO2/Al2O3 and 10% Ce0.75Zr0.25O2/Al2O3 showed η-alumina bayerite structures as a major crystalline phase, while CeO2 and Ce0.75Zr0.25O2 showed them as minor crystalline phase. The non-alumina catalysts were selected for the further study.
CeO2 and Ce0.75Zr0.25O2 showed two main reduction peaks at different temperatures, shown in Figure 4. Ceria and ceria-zirconia started to be reduced at the same temperatures, with the first peak at 300 °C (peaks α) and the second peak at 650 °C (peaks β). However, broader reduction peaks were observed in the ceria-zirconia due to the larger amount of oxygen release in ceria-zirconia. This led to a higher average reduction temperature for ceria-zirconia (680 and 950 °C), when compared to ceria (545 and 900°C), respectively. The results agreed with previous works reported by other researchers [37–40]. The first peaks of both catalysts were defined as surface reduction, evidenced by the steep reduction peaks, while the second peaks comprised bulk reductions, which were much broader compared to the first peaks due to the much slower solid-state oxygen diffusion within the materials. From the H2-TPR profiles of both catalysts, it can be seen that ceria-zirconia had a higher reduction rate than ceria, and released a higher amount of oxygen within the studied temperature range. The addition of Zr into the ceria catalyst system has been suggested to affect the material’s cell volume, resulting in an increase in surface area [41–44]. The degree of the reduction, represented by the non-stoichiometric oxygen release (δ), is calculated and tabulated in Table 1. For CeO2, the surface oxygen was released at 545 °C, giving δ at 0.046 (theoretically maximum at 0.5) and percentage of reduction at 9.34%, where the material was reduced to CeO1.95. The second peak of CeO2 showed that the bulk oxygen was reduced at 900 °C, giving 0.074 of δ, which is equal to a reduction of 14.64%. At this stage, the CeO1.88 became CeO1.94. Similarly, ceria-zirconia was surface reduced and bulk reduced at 680 °C and 950 °C, respectively. The first reduction peak represented a δ of 0.277, with a reduction degree of 54.40%, while the second peak gave a δ of 0.222, with a reduction degree of 44.46%. The non-stoichiometric molecular formula of the ceria-zirconia after being reduced at 950 °C was Ce0.75Zr0.25O1.51. Ce0.75Zr0.25O2 conclusively showed better performance, compared to ceria, in terms of reduction rate and reducibility.
Figure 4. TPR profiles of CeO2 and Ce0.75Zr0.25O2 for temperatures ranging from 30 to 950 °C, at heating rate of 5 °C/min, using 10% H2/Ar.
Figure 4. TPR profiles of CeO2 and Ce0.75Zr0.25O2 for temperatures ranging from 30 to 950 ◦C, atheating rate of 5 ◦C/min, using 10% H2/Ar.
Processes 2019, 7, 767 6 of 12
Table 1. H2-TPR results of CeO2 and Ce0.75Zr0.25O2
CatalystsPeak α Peak β Total
OSC(µmol/g)
Total %Reduction
(δ)Tred(◦C)
OSC(µmol/g)
% Reduction(δ) Tred (◦C) OSC
(µmol/g)% Reduction
(δ)
CeO2-δ 545 585 9.34%(δ = 0.046) 900 915 14.64%
(δ = 0.074) 1500 23.98%(δ = 0.12)
Ce0.75Zr0.25O2-δ 680 1700 547.40%(δ = 0.272) 950 1390 44346%
(δ = 0.222) 3090 98.86%(δ = 0.49)
Where OSC stands for oxygen storage capacity, calculated from H2 consumption. The percentageof reduction degree is calculated using Equations (1)–(3) below:
%Xred =
( n[O]real
n[O]max
)× 100 (1)
n[O]real =nH2,consumed
msolid(2)
n[O]max =
(msolid
MWsolid
)× δmax (3)
where n[O]maxis the maximum amount of O2 release/uptake (mol/g) as a function of δ, δ is the
stoichiometric coefficient of O in lattice (for this material, δ is 0.5 for maximum O release/uptake),n[O]real
is the number mole of O released per gram of the catalyst, which is equal to an integration ofthe area under the H2 consumption curve, msolid is the weight of the solid reactant, and MWsolid is themolecular weight of the catalyst [45].
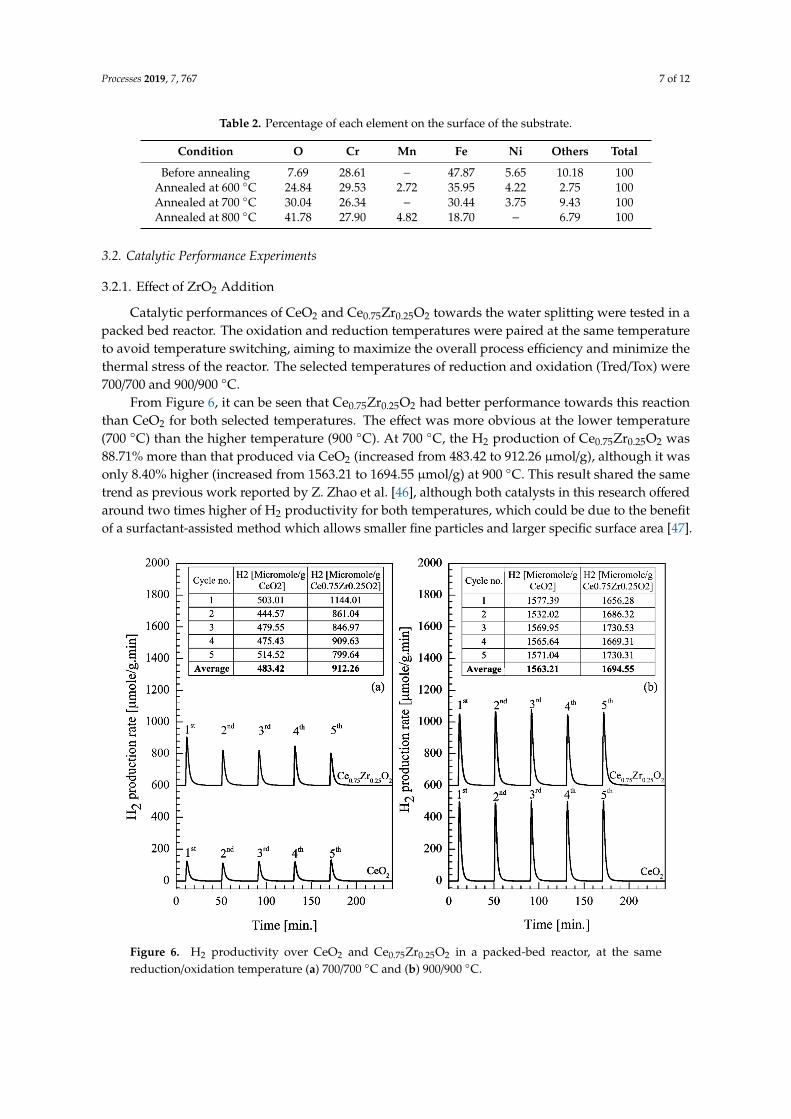
Figure 5 shows the surface morphography of the prepared substrates (a) before and after annealingprocess at (b) 600, (c) 700, and (d) 800 ◦C. From the results, it can be seen that the oxides of the stainlesssteel’s surface were formed by annealing, occurring best at the highest temperature: 800 ◦C.
Processes 2019, 7, 767 6 of 12
Table 1. H2-TPR results of CeO2 and Ce0.75Zr0.25O2
Catalysts
Peak α Peak β Total OSC
(µmol/g)
Total % Reduction
(δ) Tred (°C)
OSC (µmol/g)
% Reduction
(δ)
Tred (°C)
OSC (µmol/g)
% Reduction
(δ)
CeO2-δ 545 585 9.34%
(δ = 0.046) 900 915 14.64%
(δ = 0.074) 1500 23.98%
(δ = 0.12)
Ce0.75Zr0.25O2-δ 680 1700 547.40%
(δ = 0.272) 950 1390 44346%
(δ = 0.222) 3090 98.86%
(δ = 0.49)
Where OSC stands for oxygen storage capacity, calculated from H2 consumption. The percentage of reduction degree is calculated using Equations (1)–(3) below:
= ×
[ ]
[ ]max
% 100O realred
O
nX
n (1)
= 2 ,[ ]
H consumedO real
solid
nn
m (2)
δ
= ×
[ ]max maxsolid
Osolid
mn
MW (3)
where 𝑛 is the maximum amount of O2 release/uptake (mol/g) as a function of δ, δ is the stoichiometric coefficient of O in lattice (for this material, δ is 0.5 for maximum O release/uptake), 𝑛 is the number mole of O released per gram of the catalyst, which is equal to an integration of the area under the H2 consumption curve, msolid is the weight of the solid reactant, and MWsolid is the molecular weight of the catalyst [45].
Figure 5 shows the surface morphography of the prepared substrates (a) before and after annealing process at (b) 600, (c) 700, and (d) 800 °C. From the results, it can be seen that the oxides of the stainless steel’s surface were formed by annealing, occurring best at the highest temperature: 800 °C.
Figure 5. Morphology of the substrate surface analyzed using SEM technique: (a) before annealing and after annealing process at (b) 600, (c) 700, and (d) 800 °C.
Figure 5. Morphology of the substrate surface analyzed using SEM technique: (a) before annealingand after annealing process at (b) 600, (c) 700, and (d) 800 ◦C.
Energy-dispersive X-ray spectroscopy technique (EDX) was applied to identify the oxides whichwere formed with metals consisting of the stainless steel. Table 2 presents the percentage of eachelement. The results suggested that the formation of oxides increased with an increase in annealingtemperature, as evidenced by the higher percentage of oxygen. The results are in agreement with theSEM results, as reported in the previous section.
Processes 2019, 7, 767 7 of 12
Table 2. Percentage of each element on the surface of the substrate.
Condition O Cr Mn Fe Ni Others Total
Before annealing 7.69 28.61 − 47.87 5.65 10.18 100Annealed at 600 ◦C 24.84 29.53 2.72 35.95 4.22 2.75 100Annealed at 700 ◦C 30.04 26.34 − 30.44 3.75 9.43 100Annealed at 800 ◦C 41.78 27.90 4.82 18.70 − 6.79 100
3.2. Catalytic Performance Experiments
3.2.1. Effect of ZrO2 Addition
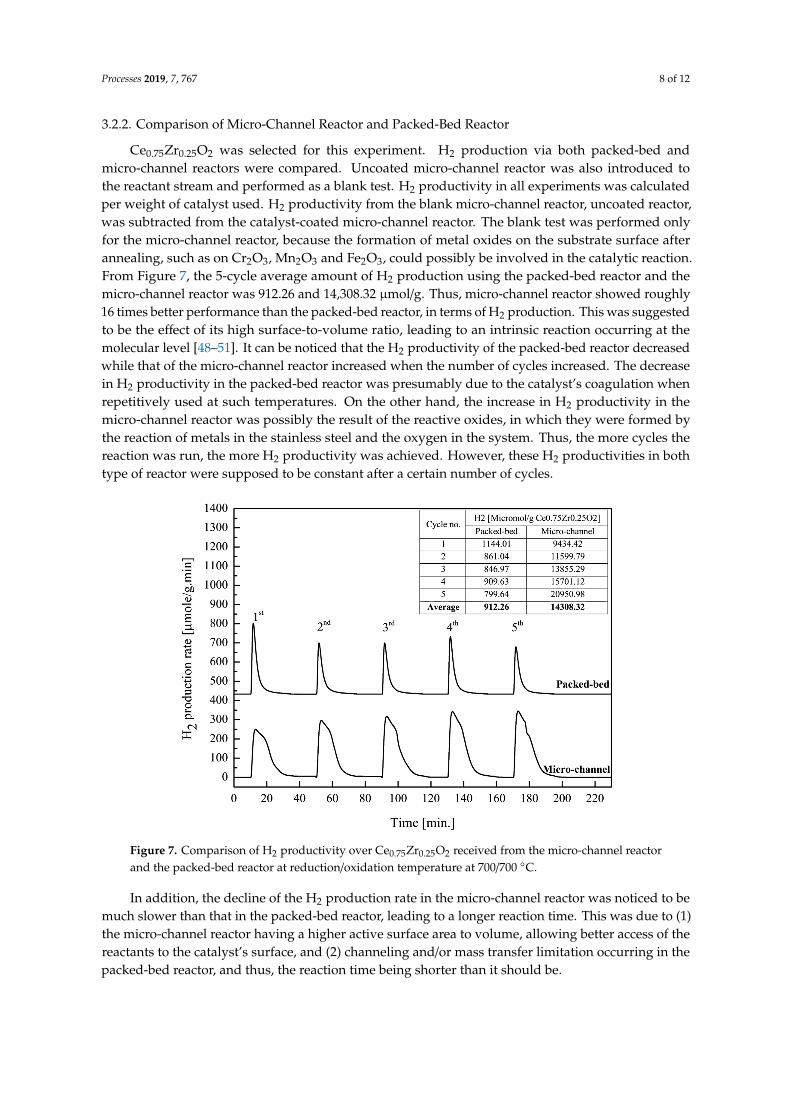
Catalytic performances of CeO2 and Ce0.75Zr0.25O2 towards the water splitting were tested in apacked bed reactor. The oxidation and reduction temperatures were paired at the same temperatureto avoid temperature switching, aiming to maximize the overall process efficiency and minimize thethermal stress of the reactor. The selected temperatures of reduction and oxidation (Tred/Tox) were700/700 and 900/900 ◦C.
From Figure 6, it can be seen that Ce0.75Zr0.25O2 had better performance towards this reactionthan CeO2 for both selected temperatures. The effect was more obvious at the lower temperature(700 ◦C) than the higher temperature (900 ◦C). At 700 ◦C, the H2 production of Ce0.75Zr0.25O2 was88.71% more than that produced via CeO2 (increased from 483.42 to 912.26 µmol/g), although it wasonly 8.40% higher (increased from 1563.21 to 1694.55 µmol/g) at 900 ◦C. This result shared the sametrend as previous work reported by Z. Zhao et al. [46], although both catalysts in this research offeredaround two times higher of H2 productivity for both temperatures, which could be due to the benefitof a surfactant-assisted method which allows smaller fine particles and larger specific surface area [47].
Processes 2019, 7, 767 7 of 12
Energy-dispersive X-ray spectroscopy technique (EDX) was applied to identify the oxides which were formed with metals consisting of the stainless steel. Table 2 presents the percentage of each element. The results suggested that the formation of oxides increased with an increase in annealing temperature, as evidenced by the higher percentage of oxygen. The results are in agreement with the SEM results, as reported in the previous section.
Table 2. Percentage of each element on the surface of the substrate.
Condition O Cr Mn Fe Ni Others Total Before annealing 7.69 28.61 − 47.87 5.65 10.18 100
Annealed at 600 °C 24.84 29.53 2.72 35.95 4.22 2.75 100 Annealed at 700 °C 30.04 26.34 − 30.44 3.75 9.43 100 Annealed at 800 °C 41.78 27.90 4.82 18.70 − 6.79 100
3.2. Catalytic Performance Experiments
3.2.1. Effect of ZrO2 Addition
Catalytic performances of CeO2 and Ce0.75Zr0.25O2 towards the water splitting were tested in a packed bed reactor. The oxidation and reduction temperatures were paired at the same temperature to avoid temperature switching, aiming to maximize the overall process efficiency and minimize the thermal stress of the reactor. The selected temperatures of reduction and oxidation (Tred/Tox) were 700/700 and 900/900 °C.
Figure 6. H2 productivity over CeO2 and Ce0.75Zr0.25O2 in a packed-bed reactor, at the same reduction/oxidation temperature (a) 700/700 °C and (b) 900/900 °C.
From Figure 6, it can be seen that Ce0.75Zr0.25O2 had better performance towards this reaction than CeO2 for both selected temperatures. The effect was more obvious at the lower temperature (700 °C) than the higher temperature (900 °C). At 700 °C, the H2 production of Ce0.75Zr0.25O2 was 88.71% more than that produced via CeO2 (increased from 483.42 to 912.26 µmol/g), although it was only 8.40% higher (increased from 1563.21 to 1694.55 µmol/g) at 900 °C. This result shared the same trend as
Figure 6. H2 productivity over CeO2 and Ce0.75Zr0.25O2 in a packed-bed reactor, at the samereduction/oxidation temperature (a) 700/700 ◦C and (b) 900/900 ◦C.
Processes 2019, 7, 767 8 of 12
3.2.2. Comparison of Micro-Channel Reactor and Packed-Bed Reactor
Ce0.75Zr0.25O2 was selected for this experiment. H2 production via both packed-bed andmicro-channel reactors were compared. Uncoated micro-channel reactor was also introduced tothe reactant stream and performed as a blank test. H2 productivity in all experiments was calculatedper weight of catalyst used. H2 productivity from the blank micro-channel reactor, uncoated reactor,was subtracted from the catalyst-coated micro-channel reactor. The blank test was performed onlyfor the micro-channel reactor, because the formation of metal oxides on the substrate surface afterannealing, such as on Cr2O3, Mn2O3 and Fe2O3, could possibly be involved in the catalytic reaction.From Figure 7, the 5-cycle average amount of H2 production using the packed-bed reactor and themicro-channel reactor was 912.26 and 14,308.32 µmol/g. Thus, micro-channel reactor showed roughly16 times better performance than the packed-bed reactor, in terms of H2 production. This was suggestedto be the effect of its high surface-to-volume ratio, leading to an intrinsic reaction occurring at themolecular level [48–51]. It can be noticed that the H2 productivity of the packed-bed reactor decreasedwhile that of the micro-channel reactor increased when the number of cycles increased. The decreasein H2 productivity in the packed-bed reactor was presumably due to the catalyst’s coagulation whenrepetitively used at such temperatures. On the other hand, the increase in H2 productivity in themicro-channel reactor was possibly the result of the reactive oxides, in which they were formed bythe reaction of metals in the stainless steel and the oxygen in the system. Thus, the more cycles thereaction was run, the more H2 productivity was achieved. However, these H2 productivities in bothtype of reactor were supposed to be constant after a certain number of cycles.
Processes 2019, 7, 767 8 of 12
previous work reported by Z. Zhao et al. [46], although both catalysts in this research offered around two times higher of H2 productivity for both temperatures, which could be due to the benefit of a surfactant-assisted method which allows smaller fine particles and larger specific surface area [47].
3.2.2. Comparison of Micro-Channel Reactor and Packed-Bed Reactor
Ce0.75Zr0.25O2 was selected for this experiment. H2 production via both packed-bed and micro-channel reactors were compared. Uncoated micro-channel reactor was also introduced to the reactant stream and performed as a blank test. H2 productivity in all experiments was calculated per weight of catalyst used. H2 productivity from the blank micro-channel reactor, uncoated reactor, was subtracted from the catalyst-coated micro-channel reactor. The blank test was performed only for the micro-channel reactor, because the formation of metal oxides on the substrate surface after annealing, such as on Cr2O3, Mn2O3 and Fe2O3, could possibly be involved in the catalytic reaction. From Figure 7, the 5-cycle average amount of H2 production using the packed-bed reactor and the micro-channel reactor was 912.26 and 14,308.32 µmol/g. Thus, micro-channel reactor showed roughly 16 times better performance than the packed-bed reactor, in terms of H2 production. This was suggested to be the effect of its high surface-to-volume ratio, leading to an intrinsic reaction occurring at the molecular level [48–51]. It can be noticed that the H2 productivity of the packed-bed reactor decreased while that of the micro-channel reactor increased when the number of cycles increased. The decrease in H2 productivity in the packed-bed reactor was presumably due to the catalyst’s coagulation when repetitively used at such temperatures. On the other hand, the increase in H2 productivity in the micro-channel reactor was possibly the result of the reactive oxides, in which they were formed by the reaction of metals in the stainless steel and the oxygen in the system. Thus, the more cycles the reaction was run, the more H2 productivity was achieved. However, these H2 productivities in both type of reactor were supposed to be constant after a certain number of cycles.
Figure 7. Comparison of H2 productivity over Ce0.75Zr0.25O2 received from the micro-channel reactor and the packed-bed reactor at reduction/oxidation temperature at 700/700 °C.
In addition, the decline of the H2 production rate in the micro-channel reactor was noticed to be much slower than that in the packed-bed reactor, leading to a longer reaction time. This was due to (1) the micro-channel reactor having a higher active surface area to volume, allowing better access of
Figure 7. Comparison of H2 productivity over Ce0.75Zr0.25O2 received from the micro-channel reactorand the packed-bed reactor at reduction/oxidation temperature at 700/700 ◦C.
In addition, the decline of the H2 production rate in the micro-channel reactor was noticed to bemuch slower than that in the packed-bed reactor, leading to a longer reaction time. This was due to (1)the micro-channel reactor having a higher active surface area to volume, allowing better access of thereactants to the catalyst’s surface, and (2) channeling and/or mass transfer limitation occurring in thepacked-bed reactor, and thus, the reaction time being shorter than it should be.
Processes 2019, 7, 767 9 of 12
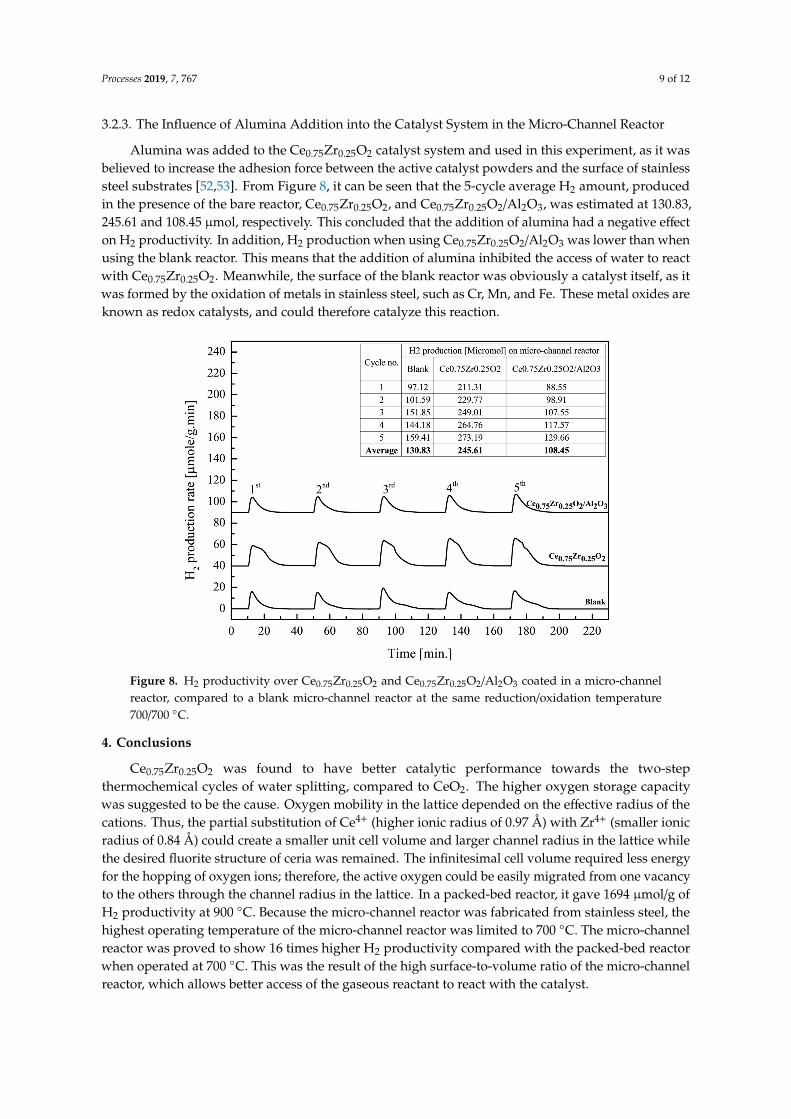
3.2.3. The Influence of Alumina Addition into the Catalyst System in the Micro-Channel Reactor
Alumina was added to the Ce0.75Zr0.25O2 catalyst system and used in this experiment, as it wasbelieved to increase the adhesion force between the active catalyst powders and the surface of stainlesssteel substrates [52,53]. From Figure 8, it can be seen that the 5-cycle average H2 amount, producedin the presence of the bare reactor, Ce0.75Zr0.25O2, and Ce0.75Zr0.25O2/Al2O3, was estimated at 130.83,245.61 and 108.45 µmol, respectively. This concluded that the addition of alumina had a negative effecton H2 productivity. In addition, H2 production when using Ce0.75Zr0.25O2/Al2O3 was lower than whenusing the blank reactor. This means that the addition of alumina inhibited the access of water to reactwith Ce0.75Zr0.25O2. Meanwhile, the surface of the blank reactor was obviously a catalyst itself, as itwas formed by the oxidation of metals in stainless steel, such as Cr, Mn, and Fe. These metal oxides areknown as redox catalysts, and could therefore catalyze this reaction.
Processes 2019, 7, 767 9 of 12
the reactants to the catalyst’s surface, and (2) channeling and/or mass transfer limitation occurring in the packed-bed reactor, and thus, the reaction time being shorter than it should be.
3.2.3. The Influence of Alumina Addition into the Catalyst System in the Micro-Channel Reactor
Alumina was added to the Ce0.75Zr0.25O2 catalyst system and used in this experiment, as it was believed to increase the adhesion force between the active catalyst powders and the surface of stainless steel substrates [52,53]. From Figure 8, it can be seen that the 5-cycle average H2 amount, produced in the presence of the bare reactor, Ce0.75Zr0.25O2, and Ce0.75Zr0.25O2/Al2O3, was estimated at 130.83, 245.61 and 108.45 µmol, respectively. This concluded that the addition of alumina had a negative effect on H2 productivity. In addition, H2 production when using Ce0.75Zr0.25O2/Al2O3 was lower than when using the blank reactor. This means that the addition of alumina inhibited the access of water to react with Ce0.75Zr0.25O2. Meanwhile, the surface of the blank reactor was obviously a catalyst itself, as it was formed by the oxidation of metals in stainless steel, such as Cr, Mn, and Fe. These metal oxides are known as redox catalysts, and could therefore catalyze this reaction.
Figure 8. H2 productivity over Ce0.75Zr0.25O2 and Ce0.75Zr0.25O2/Al2O3 coated in a micro-channel reactor, compared to a blank micro-channel reactor at the same reduction/oxidation temperature 700/700 °C.
4. Conclusions
Ce0.75Zr0.25O2 was found to have better catalytic performance towards the two-step thermochemical cycles of water splitting, compared to CeO2. The higher oxygen storage capacity was suggested to be the cause. Oxygen mobility in the lattice depended on the effective radius of the cations. Thus, the partial substitution of Ce4+ (higher ionic radius of 0.97 Å) with Zr4+ (smaller ionic radius of 0.84 Å) could create a smaller unit cell volume and larger channel radius in the lattice while the desired fluorite structure of ceria was remained. The infinitesimal cell volume required less energy for the hopping of oxygen ions; therefore, the active oxygen could be easily migrated from one vacancy to the others through the channel radius in the lattice. In a packed-bed reactor, it gave 1694 µmol/g of H2 productivity at 900 °C. Because the micro-channel reactor was fabricated from stainless steel, the highest operating temperature of the micro-channel reactor was limited to 700 °C. The micro-channel reactor was proved to show 16 times higher H2 productivity compared with the packed-bed reactor when operated at 700 °C. This was the result of the high surface-to-volume ratio
Figure 8. H2 productivity over Ce0.75Zr0.25O2 and Ce0.75Zr0.25O2/Al2O3 coated in a micro-channelreactor, compared to a blank micro-channel reactor at the same reduction/oxidation temperature700/700 ◦C.
4. Conclusions
Ce0.75Zr0.25O2 was found to have better catalytic performance towards the two-stepthermochemical cycles of water splitting, compared to CeO2. The higher oxygen storage capacitywas suggested to be the cause. Oxygen mobility in the lattice depended on the effective radius of thecations. Thus, the partial substitution of Ce4+ (higher ionic radius of 0.97 Å) with Zr4+ (smaller ionicradius of 0.84 Å) could create a smaller unit cell volume and larger channel radius in the lattice whilethe desired fluorite structure of ceria was remained. The infinitesimal cell volume required less energyfor the hopping of oxygen ions; therefore, the active oxygen could be easily migrated from one vacancyto the others through the channel radius in the lattice. In a packed-bed reactor, it gave 1694 µmol/g ofH2 productivity at 900 ◦C. Because the micro-channel reactor was fabricated from stainless steel, thehighest operating temperature of the micro-channel reactor was limited to 700 ◦C. The micro-channelreactor was proved to show 16 times higher H2 productivity compared with the packed-bed reactorwhen operated at 700 ◦C. This was the result of the high surface-to-volume ratio of the micro-channelreactor, which allows better access of the gaseous reactant to react with the catalyst.
Processes 2019, 7, 767 10 of 12
Author Contributions: Conceptualization, U.W.H. and T.S.; Methodology, N.N.; Validation, U.W.H., N.S.-n.and N.N.; Formal Analysis, M.H.; Investigation, N.L.; Data Curation, N.N.; Writing-Original Draft Preparation,N.N.; Writing-Review & Editing, M.H.; Visualization, U.W.H.; Supervision, N.L.; Project Administration, N.S.-n.;Funding Acquisition, T.S.
Funding: This research was funded by PTT, Thailand Research Fund [RSA6180061] and National ResearchCouncil of Thailand [KMUTNB-GOV-58-47, KMUTNB-GOV-59-43, KMUTNB-GOV-60-55, KMUTNB-61-GOV-03-44/KMUTNB-61-GOV-C1-46].
Acknowledgments: PTT, Thailand Research Fund (RSA6180061) and National Research Councilof Thailand (KMUTNB-GOV-58-47, KMUTNB-GOV-59-43, KMUTNB-GOV-60-55, KMUTNB-61-GOV-03-44/KMUTNB-61-GOV-C1-46) are acknowledged for financial support.
Conflicts of Interest: The authors declare no conflict of interest.
References
1. Balat, M. Potential importance of hydrogen as a future solution to environmental and transportation problems.Int. J. Hydrog. Energy 2008, 33, 4013–4029. [CrossRef]
2. Mathur, H.B.; Das, L.M.; Patro, T.N. Hydrogen fuel utilization in CI engine powered end utility systems. Int.J. Hydrog. Energy 1992, 17, 369–374. [CrossRef]
3. Chang, A.C.C.; Chang, H.F.; Lin, F.J.; Lin, K.H.; Chen, C.H. Biomass gasification for hydrogen production.Int. J. Hydrog. Energy 2011, 36, 14252–14260. [CrossRef]
4. Appleby, A.J. Fuel cell technology and innovation. J. Power Sources 1992, 37, 223–239. [CrossRef]5. Ismagilov, Z.R.; Matus, E.V.; Ismagilov, I.Z. Hydrogen production through hydrocarbon fuel reforming
processes over Ni based catalysts. Catal. Today 2019, 166–182. [CrossRef]6. Lecart, B.; Devalette, M.; Manaud, J.P.; Meunier, G.; Hagenmuller, P. A new thermochemical process for
hydrogen production. Int. J. Hydrog. Energy 1979, 4, 7–11. [CrossRef]7. DeLuchi, M.A. Hydrogen vehicles: An evaluation of fuel storage, performance, safety, environmental
impacts, and cost. Int. J. Hydrog. Energy 1989, 14, 81–130. [CrossRef]8. Nikolaidis, P.; Poullikkas, A. A comparative overview of hydrogen production processes. Renew. Sustain.
Energy Rev. 2017, 67, 597–611. [CrossRef]9. Agrafiotis, C.; Roeb, M.; Konstandopoulos, A.G. Solar water splitting for hydrogen production with
monolithic reactors. Sol. Energy 2005, 79, 409–421. [CrossRef]10. Dersch, J.; Mathijsen, A.; Roeb, M.; Sattler, C. Modelling of a solar thermal reactor for hydrogen generation. In
Proceedings of the 5th International Modelica Conference, Vienna, Austria, 4–5 September 2006; pp. 441–448.Available online: http://elib.dlr.de/46853/ (accessed on 15 June 2019).
11. Venstrom, L.J.; Petkovich, N.; Rudisill, S.; Stein, A.; Davidson, J.H. The effects of morphology on the oxidationof ceria by water and carbon dioxide. J. Sol. Energy Eng. 2012, 134, 011005. [CrossRef]
12. Roeb, M.; Sattler, C.; Klüser, R. Solar hydrogen production by a two-step cycle based on mixed iron oxides.In Proceedings of the ASME 2005 International Solar Energy Conference, Orlando, FL, USA, 6–12 August2005; pp. 671–678. [CrossRef]
13. Steinfeld, A. Solar hydrogen production via a two-step water-splitting thermochemical cycle based onZn/ZnO redox reactions. Int. J. Hydrog. Energy 2002, 27, 611–619. [CrossRef]
14. Sibieude, F.; Ducarroir, M.; Tofighi, A.; Ambriz, J. High temperature experiments with a solar furnace: Thedecomposition of Fe3O4, Mn3O4, CdO. Int. J. Hydrog. Energy 1982, 7, 79–88. [CrossRef]
15. Popa, S.G.; Ungureanu, B.S.; Gheonea, I.A. Experimental Study of SnO2/SnO/Sn Thermochemical Systemsfor Solar Production of Hydrogen. Rom. J. Morphol Embryol. 2015, 56, 1495–1502. [CrossRef] [PubMed]
16. Kang, K.S.; Kim, C.H.; Cho, W.C.; Bae, K.K.; Kim, S.H.; Park, C.S. Novel two-step thermochemical cycle forhydrogen production from water using germanium oxide: KIER 4 thermochemical cycle. Int. J. Hydrog.Energy 2009, 34, 4283–4290. [CrossRef]
17. Charvin, P.; Abanades, S.; Flamant, G.; Lemort, F. Two-step water splitting thermochemical cycle based oniron oxide redox pair for solar hydrogen production. Energy 2007, 32, 1124–1133. [CrossRef]
18. Tamaura, Y.; Ueda, Y.; Matsunami, J. Solar hydrogen production by using ferrites. Sol. Energy 1999, 65, 55–57.[CrossRef]
19. Scheffe, J.R.; Li, J.; Weimer, A.W. A spinel ferrite/hercynite water-splitting redox cycle. Int. J. Hydrog. Energy2010, 35, 3333–3340. [CrossRef]
Processes 2019, 7, 767 11 of 12
20. Chueh, W.C.; Haile, S.M. A thermochemical study of ceria: Exploiting an old material for new modes ofenergy conversion and CO2 mitigation. Philos. Trans. R. Soc. A Math. Phys. Eng. Sci. 2010, 368, 3269–3294.[CrossRef]
21. Meng, Q.L.; Lee, C.I.l.; Ishihara, T.; Kaneko, H.; Tamaura, Y. Reactivity of CeO2-based ceramics for solarhydrogen production via a two-step water-splitting cycle with concentrated solar energy. Int. J. Hydrog.Energy 2011, 36, 13435–13441. [CrossRef]
22. Furler, P.; Scheffe, J.; Gorbar, M.; Moes, L.; Vogt, U.; Steinfeld, A. Solar thermochemical CO2 splitting utilizinga reticulated porous ceria redox system. Energy Fuels 2012, 26, 7051–7059. [CrossRef]
23. Scheffe, J.R.; Weibel, D.; Steinfeld, A. Lanthanum-strontium-manganese perovskites as redox materials forsolar thermochemical splitting of H2O and CO2. Energy Fuels 2013, 27, 4250–4257. [CrossRef]
24. Mamontov, E.; Egami, T.; Brezny, R.; Koranne, M.; Tyagi, S. Lattice defects and oxygen storage capacity ofnanocrystalline ceria and ceria-zirconia. J. Phys. Chem. B 2000, 104, 11110–11116. [CrossRef]
25. Epifani, M.; Andreu, T.; Abdollahzadeh-Ghom, S.; Arbiol, J.; Morante, J.R. Synthesis of ceria-zirconiananocrystals with improved microstructural homogeneity and oxygen storage capacity by hydrolytic sol-gelprocess in coordinating environment. Adv. Funct. Mater. 2012, 22, 2867–2875. [CrossRef]
26. Bader, R.; Venstrom, L.J.; Davidson, J.H.; Lipinski, W. Thermodynamic analysis of isothermal redox cyclingof ceria for solar fuel production. Energy Fuels 2013, 27, 5533–5544. [CrossRef]
27. Fueki, K. Efficiency of thermochemical production of hydrogen. Int. J. Hydrog. Energy 1976, 1, 129–131.[CrossRef]
28. Scheffe, J.R.; Steinfeld, A. Thermodynamic analysis of cerium-based oxides for solar thermochemical fuelproduction. Energy Fuels 2012, 26, 1928–1936. [CrossRef]
29. Falter, C.; Pitz-Paal, R. Energy analysis of solar thermochemical fuel production pathway with a focus onwaste heat recuperation and vacuum generation. Sol. Energy 2018, 176, 230–240. [CrossRef]
30. Pengpanich, S.; Meeyoo, V.; Rirksomboon, T.; Bunyakiat, K. Catalytic oxidation of methane over CeO2-ZrO2
mixed oxide solid solution catalysts prepared via urea hydrolysis. Appl. Catal. A Gen. 2002, 234, 221–233.[CrossRef]
31. Li, J.; Liu, X.; Zhan, W.; Guo, Y.; Guo, Y.; Lu, G. Preparation of high oxygen storage capacity and thermallystable ceria-zirconia solid solution. Catal. Sci. Technol. 2016, 6, 897–907. [CrossRef]
32. Reddy, B.M.; Reddy, G.K.; Reddy, L.H.; Ganesh, I. Synthesis of Nanosized Ceria-Zirconia Solid Solutions bya Rapid Microwave-Assisted Combustion Method. Open Phys. Chem. J. 2009, 3, 24–29. [CrossRef]
33. Sujana, M.G.; Chattopadyay, K.K.; Anand, S. Characterization and optical properties of nano-ceria synthesizedby surfactant-mediated precipitation technique in mixed solvent system. Appl. Surf. Sci. 2008, 254, 7405–7409.[CrossRef]
34. Shih, C.J.; Chen, Y.J.; Hon, M.H. Synthesis and crystal kinetics of cerium oxide nanocrystallites prepared byco-precipitation process. Mater. Chem. Phys. 2010, 121, 99–102. [CrossRef]
35. Osman, A.I.; Abu-Dahrieh, J.K.; Rooney, D.W.; Halawy, S.A.; Mohamed, M.A.; Abdelkader, A. Effect ofprecursor on the performance of alumina for the dehydration of methanol to dimethyl ether. Appl. Catal. BEnviron. 2012, 127, 307–315. [CrossRef]
36. Takashi, S.; Hideo, W.; Masayoshi, F.; Minoru, T. Structural Properties and Surface Characteristics onAluminum Oxide Powders. Rev. Med. Chile 2009, 9, 23–31.
37. Wang, X.; Liu, D.; Li, J.; Zhen, J.; Zhang, H. Clean synthesis of Cu2O@CeO2 core@shell nanocubes withhighly active interface. NPG Asia Mater. 2015, 7, 158–164. [CrossRef]
38. Zhang, X.M.; Deng, Y.Q.; Tian, P.; Shang, H.H.; Xu, J.; Han, Y.F. Dynamic active sites over binary oxidecatalysts: In situ/operando spectroscopic study of low-temperature CO oxidation over MnOx-CeO2 catalysts.Appl. Catal. B Environ. 2016, 191, 179–191. [CrossRef]
39. Liu, L.; Shi, J.; Zhang, X.; Liu, J. Flower-Like Mn-Doped CeOMicrostructures: Synthesis, Characterizations,and Catalytic Properties. J. Chem. 2015, 2015, 254750. [CrossRef]
40. MacIel, C.G.; Silva, T.D.F.; Hirooka, M.I.; Belgacem, M.N.; Assaf, J.M. Effect of nature of ceria support inCuO/CeO2 catalyst for PROX-CO reaction. Fuel 2012, 97, 245–252. [CrossRef]
41. Biswas, P.; Kunzru, D. Steam reforming of ethanol for production of hydrogen over Ni/CeO2-ZrO2 catalyst:Effect of support and metal loading. Int. J. Hydrog. Energy 2007, 32, 969–980. [CrossRef]
42. Kim, D.J. Lattice Parameters, Ionic Conductivities, and Solubility Limits in Fluorite-Structure MO2 Oxide [M= Hf4+, Zr4+, Ce4+, Th4+, U4+] Solid Solutions. J. Am. Ceram. Soc. 1989, 72, 1415–1421. [CrossRef]
Processes 2019, 7, 767 12 of 12
43. Kang, K.; Kim, C.; Park, C.; Kim, J. Hydrogen Reduction and Subsequent Water Splitting. J. Ind. Eng. Chem.2007, 13, 657–663.
44. Córdoba, L.F.; Martínez-Hernández, A. Preferential oxidation of CO in excess of hydrogen over Au/CeO2-ZrO2
catalysts. Int. J. Hydrog. Energy 2015, 40, 16192–16201. [CrossRef]45. Le Gal, A.; Abanades, S.; Flamant, G. CO2 and H2O splitting for thermochemical production of solar fuels
using nonstoichiometric ceria and ceria/zirconia solid solutions. Energy Fuels 2011, 25, 4836–4845. [CrossRef]46. Zhao, Z.; Uddi, M.; Tsvetkov, N.; Yildiz, B.; Ghoniem, A.F. Enhanced intermediateerature CO2 splitting using
nonstoichiometric ceria and ceria-zirconia. Phys. Chem. Chem. Phys. 2017, 19, 25774–25785. [CrossRef][PubMed]
47. Sukonket, T.; Khan, A.; Saha, B. Influence of the Catalyst Preparation Method, Surfactant Amount, and Steamon CO2 Reforming of CH4 over 5Ni/Ce0.6Zr 0.4O2 Catalysts. Energy Fuels 2011, 25, 864–877. [CrossRef]
48. Kolb, G. Review: Microstructured reactors for distributed and renewable production of fuels and electricalenergy. Chem. Eng. Process. Process Intensif. 2013, 65, 1–44. [CrossRef]
49. Pennemann, H.; Watts, P.; Haswell, S.J.; Hessel, V.; Löwe, H. Benchmarking of microreactor applications.Org. Process Res. Dev. 2004, 8, 422–439. [CrossRef]
50. Mathieu-Potvin, F.; Gosselin, L.; Da Silva, A.K. Optimal geometry of catalytic microreactors: Maximalreaction rate density with fixed amount of catalyst and pressure drop. Chem. Eng. Sci. 2012, 73, 249–260.[CrossRef]
51. Lau, W.N.; Yeung, K.L.; Martin-Aranda, R. Knoevenagel condensation reaction between benzaldehyde andethyl acetoacetate in microreactor and membrane microreactor. Microporous Mesoporous Mater. 2008, 115,156–163. [CrossRef]
52. Peela, N.R.; Mubayi, A.; Kunzru, D. Washcoating of γ-alumina on stainless steel microchannels. Catal. Today2009, 147, 17–23. [CrossRef]
53. Wu, X.; Weng, D.; Zhao, S.; Chen, W. Influence of an aluminized intermediate layer on the adhesion of aγ-Al2O3 washcoat on FeCrAl. Surf. Coat. Technol. 2005, 190, 434–439. [CrossRef]
© 2019 by the authors. Licensee MDPI, Basel, Switzerland. This article is an open accessarticle distributed under the terms and conditions of the Creative Commons Attribution(CC BY) license (http://creativecommons.org/licenses/by/4.0/).