Embed Size (px)
Citation preview

New Jersey Institute of Technology New Jersey Institute of Technology
Digital Commons @ NJIT Digital Commons @ NJIT
Dissertations Electronic Theses and Dissertations
Fall 1-31-2001
Comparison of optical density, total cell protein, and number of Comparison of optical density, total cell protein, and number of
viable cells (via fluorescent straining) as measures of microbial viable cells (via fluorescent straining) as measures of microbial
growth kinetics in suspended and biofilm cultures during growth kinetics in suspended and biofilm cultures during
biodegradation of naphthalene biodegradation of naphthalene
Jeong Seop Shim New Jersey Institute of Technology
Follow this and additional works at: https://digitalcommons.njit.edu/dissertations
Part of the Environmental Sciences Commons
Recommended Citation Recommended Citation Shim, Jeong Seop, "Comparison of optical density, total cell protein, and number of viable cells (via fluorescent straining) as measures of microbial growth kinetics in suspended and biofilm cultures during biodegradation of naphthalene" (2001). Dissertations. 446. https://digitalcommons.njit.edu/dissertations/446
This Dissertation is brought to you for free and open access by the Electronic Theses and Dissertations at Digital Commons @ NJIT. It has been accepted for inclusion in Dissertations by an authorized administrator of Digital Commons @ NJIT. For more information, please contact [email protected].

Copyright Warning & Restrictions
The copyright law of the United States (Title 17, United States Code) governs the making of photocopies or other
reproductions of copyrighted material.
Under certain conditions specified in the law, libraries and archives are authorized to furnish a photocopy or other
reproduction. One of these specified conditions is that the photocopy or reproduction is not to be “used for any
purpose other than private study, scholarship, or research.” If a, user makes a request for, or later uses, a photocopy or reproduction for purposes in excess of “fair use” that user
may be liable for copyright infringement,
This institution reserves the right to refuse to accept a copying order if, in its judgment, fulfillment of the order
would involve violation of copyright law.
Please Note: The author retains the copyright while the New Jersey Institute of Technology reserves the right to
distribute this thesis or dissertation
Printing note: If you do not wish to print this page, then select “Pages from: first page # to: last page #” on the print dialog screen

The Van Houten library has removed some of the personal information and all signatures from the approval page and biographical sketches of theses and dissertations in order to protect the identity of NJIT graduates and faculty.

ABSTRACT
COMPARISON OF OPTICAL DENSITY, TOTAL CELL PROTEIN, ANDNUMBER OF VIABLE CELLS (VIA FLUORESCENT STAINING) AS
MEASURES OF MICROBIAL GROWTH KINETICS IN SUSPENDED ANDBIOFILM CULTURES DURING BIODEGRADATION OF NAPHTHALENE
byJeong Seop Shim
Most studies on bacterial growth kinetics have been dependent on theoretical modeling
with general biomass measurements using either dry weight or optical density (OD),
without distinguishing live from dead bacteria or debris. As a result, there remains
considerable uncertainty in reliably predicting rates of biodegradation for design of
treatment processes for environmental pollutants.
This research focused on measurement of bacterial growth rates and activities in
suspended cultures and biofilms using Pseudomonas putida (ATCC 17484) for
biodegradation of naphthalene. As expected, the rates of biodegradation differed between
suspended and immobilized cultures. A comparison was made of the impact of three
biomass measures: optical density, total cell protein, and living cell number on the
calculated rate of naphthalene disappearance. Living cell number was determined by a
fluorescent staining technique and use of epifluorescence microscopy. More than 90% of
total cells remained viable over the course of each experiment (35 to 54 hours).
All three techniques experienced difficulties reconciling calculated values of
biomass growth and naphthalene disappearance. This was considered to be a consequence
of the production of intermediate products detected in the chromatograms, and possibly
adsorption and subsequent release of naphthalene, which resulted in a lag time between
the disappearance of naphthalene and the appearance of biomass. Inclusion of a lag time in

the integrated Monod expression improved the agreement between experimental and
calculated values of biomass and naphthalene concentrations. However, further
improvements will require more detailed kinetics of the actual biochemical pathway.

COMPARISON OF OPTICAL DENSITY, TOTAL CELL PROTEIN, ANDNUMBER OF VIABLE CELLS (VIA FLUORESCENT STAINING) AS
MEASURES OF MICROBIAL GROWTH KINETICS IN SUSPENDED ANDBIOFILM CULTURES DURING BIODEGRADATION OF NAPHTHALENE
byJeong Seop Shim
A DissertationSubmitted to the Faculty of
New Jersey Institute of Technologyin Partial Fulfillment of the Requirements for the Degree of
Doctor of Philosophy in Environmental Science
Department of Chemical Engineering, Chemistry, and Environmental Science
January 2001

Copyright © 2001 by Jeong Seop Shim
ALL RIGHTS RESERVED

APPROVAL PAGE
COMPARISON OF OPTICAL DENSITY, TOTAL CELL PROTEIN, ANDNUMBER OF VIABLE CELLS (VIA FLUORESCENT STAINING) AS
MEASURES OF MICROBIAL GROWTH KINETICS IN SUSPENDED ANDBIOFILM CULTURES DURING BIODEGRADATION OF NAPHTHALENE
Jeong Seop Shim
Dr. Gordon A. Lewandowski, Advisor DateDistinguished Professor of Chemical Engineering, NJIT
Dr. David Kafkewitz, Committee Member DateProfessor of Biological Sciences, Rutgers University, Newark, NJ
Dr. Piero M. Armenante, Committee Member DateDistinguished Professor of Chemical Engineering, NJITDr.
Edward M. Bonder, Committee Member DateAssociate Professor of Biological Sciences, Rutgers University, Newark, NJ
Dr. Dittmar Hahn, Committee Member DateAssistant Professor of Environmental Science, NJIT
Dr. Richard Trattner, Committee Member DateProfessor of Chemistry and Environmental Science, NJIT

BIOGRAPHICAL SKETCH
Author: Jeong Seop Shim
Degree: Doctor of Philosophy in Environmental Science
Date: January 2001
Undergraduate and Graduate Education:
• Doctor of Philosophy in Environmental ScienceNew Jersey Institute of Technology, New Jersey, 2001
• Master of Science in Environmental ScienceNew Jersey Institute of Technology, New Jersey, 1994
• Master of Science in Environmental PollutionGraduate School of Engineering, Yonsei University, Seoul, Korea, 1989
• Bachelor of Science in Environmental ScienceCollege of Health Science, Yonsei University, Wonju, Korea, 1984
Major: Environmental Science
Publications:
Shim, Jeong Seop, J. Jung, F. Lakhwala and S. Sofer, "Oxidation of Ethanol Vapors in aSpiral Bioreactor." J. Chem. Techn. Biotech. 64, 49-54 (1995).
Shim, Jeong Seop, "Bio-Oxidation of a Model VOC in Air." Master's Thesis, NJIT (Jan.1994).
RA, Kyu Hwan, Jeong Seop Shim and Jang Hoon Lee, "The Effect of Water Pollutantson the Enzyme Activities in Activated Sludge." Korean Journal of Limnology, Vol. 22,No. 4 (1989).
Shim, Jeong Seop, "A Study on the Pre-Estimate of Municipal Solid Waste Generationsand Compositions." Master's Thesis, Yonsei University, Korea (Feb.1989).
iv

Lee, Sung-Moo, Jin Won Park and Jeong Seop Shim, "A Study on the Pre-Estimate ofMunicipal Solid Waste Generation and the Change of Composition in Future." TheKorean Solid Wastes Engineering Society, Vol. 5, No. 1 (1988).
Lee, Sung-Moo, Jeong S. Shim and et. al., "Fundamental Study on the Development andManagement of Municipal Solid Waste Treatment Systems for the Establishment ofOverall Administrative Policy, in the Year 2,000 in Korea." Report of Korea ResearchFoundation (1987).
Presentations:
Shim, Jeong Seop, "Determination of Viable Cells by Fluorescence Staining Techniquesfor Microbial Growth Kinetics in Suspended and Biofilm Cultures during Biodegradationof Naphthalene." Poster Session, Ninth Annual Uni-Tech Conference, New JerseyInstitute of Technology, Newark, April 28, 2000.
Shim, Jeong Seop, J. Jung, F. Lakhwala and S. Sofer, "Bio-oxidation of a Model VOC inAir." AIChE Summer National Meeting (August, 1994).
RA, Kyu Hwan, G. C. Lee and Jeong Seop Shim, "A Study on the ResidualConcentrations of Synthetic Detergents and Surfactants." The Korean Society ofEnvironmental Toxicology, Seoul, Korea (1989).

This dissertation is dedicated tomy parents and wife
v i

ACKNOWLEDGMENT
I would like to express my sincere gratitude to my advisor, Dr. Gordon Lewandowski for
his faith, encouragement and guidance throughout this research.
I would like to thank Dr. David Kafkewitz, Dr. Piero M. Armenante, Dr. Edward
Bonder, Dr. Dittmar Hahn and Dr. Richard Trattner for serving as members of my
dissertation committee.
Special thanks to Mr. Cai Houjian for his help at the most important times during
my experiments.
I would like to thank to Dr. Dilip Mandal for his help and guidance at the
beginning of this research. I am also grateful to Ms. Suchismita Bhattacharya and Mr.
Ernesto Uehara, who have kindly provided me with help and advice about this research.
I would like to thank Dr. Otute Akiti who has given me encouragement during
hard times.
Finally, I do express my sincere appreciation to my parents and wife for their
endless patience, support, and constant encouragement.
vii

TABLE OF CONTENTS
Chapter Page
1 INTRODUCTION 1
1.1 Viable Bacteria in Suspended and Biofilm Cultures 1
1.2 Use of Fluorescent Staining Techniques 2
1.3 Determination of Viability in Surface Biofilms 3
2 LITERATURE REVIEW 5
2.1 Enumeration of Viable Cells by Fluorescence Microscopy 5
2.2 Biofilm Research 7
2.3 Biodegradation of Polycylic Aromatic Hydrocarbons 10
3 OBJECTIVES 12
4 MATERIALS AND EXPERIMENTAL METHODS 13
4.1 Materials 13
4.1.1 Preparation of Growth Medium 13
4.1.2 Fluorescent Probes for Staining Bacteria 14
4.1.3 BCA Protein Assay Kit 15
4.1.4 Biofilm Glass Supports 15
4.2 Pure Culture of Pseudomonas putida (ATCC 17484) 16
4.3 Experimental Set Up 17
4.3.1 Preparation of Suspended Cultures 17
4.3.2 Preparation of Fixed Biofilms 18
4.3.3 Column Reactors for Biofilm Cultures in Continuous Flow System 19
4.4 Analytical Procedures 24

TABLE OF CONTENTS(Continued)
Chapter Page
4.4.1 Optical Density of Bacterial Suspension 24
4.4.2 Dry Biomass of Bacterial Suspension 24
4.4.3 Measurement of Total Cell Protein 25
4.4.4 Analysis of Naphthalene 27
4.4.5 Observation of Live and Dead Cells by Fluorescence Microscopy 28
4.5 Fluorescent Staining Techniques for Microscopic Counting of Cells 29
4.5.1 Screening Tests of LIVE/DEAD® BacLight TM
Bacterial Viability Kit 29
4.5.1.1 Staining Method by Vacuum Filtrationwith PCTE Black Membrane 33
4.5.1.2 Staining Method Using Multi-Well Slide Glass 35
4.5.1.3 Staining Method Using Regular Slide Glass 35
4.5.1.4 Optimization of Staining Method with Liveand Dead Cells 36
4.5.2 Staining Methods for Biofilms on Glass Supports 37
4.5.2.1 Direct Staining 38
4.5.2.2 Indirect Staining 38
4.6 Enumeration of Bacterial Samples by Microscopic Observation 39
4.6.1 Suspended Cultures in Shake Flasks 39
4.6.2 Biofilm Cultures in a Continuous Flow Systemwith Column Reactors 39
4.7 Experimental Procedure 40
4.7.1 Suspended Cultures in Shake Flasks 40
ix

TABLE OF CONTENTS(Continued)
Chapter Page
4.7.2 Biofilm Cultures on Glass Supports in Continuous Flow System 41
4.7.2.1 Culture of Seed Biofilms 41
4.7.2.2 Culture of Biofilms in Continuous Flow System 42
5 RESULTS AND DISCUSSION 44
5.1 Suspended Cultures of Pseudomonas putida in Shake Flasks 44
5.1.1 Kinetic Rate Constants for Biodegradation of Naphthalene 44
5.2 Yield Coefficient (Y) 49
5.3 Prediction of Naphthalene Loss and Biomass Growthin Suspended Cultures 51
5.4 Determination of Doubling Time during Exponential Growth Phase 58
5.5 Intermediates Products 60
5.6 Viability of Pseudomonas putida Suspension in Shake Flask Test 60
5.7 Biofilm Cultures in Continuous Flow Reactors 61
5.7.1 Cell Distribution in Seed Biofilm Container 61
5.7.2 Suspended Cells in Seed Biofilm Container 63
5.7.3 Biofilm Cultures on Glass Supports in ContinuousFlow System 64
5.7.4 Determination of Specific Growth Rates in ContinuousFlow System 67
5.7.5 Formation of Biofilms on Glass Supports in ContinuousFlow System 70
6 CONCLUSIONS 75
6.1 Fluorescent Staining Technique 75

TABLE OF CONTENTS(Continued)
Chapter Page
6.2 Comparison of Biomass Measures 75
6.3 Suspended Cells vs. Immobilized Cells 76
6.4 Monod Parameters for Biodegradation of Naphthalene UsingPseudomonas putida (ATCC 17484) in Suspended Culture 76
APPENDIX A CALIBRATION CURVES 77
APPENDIX B ADSORPTION OF NAPHTHALENEON FILTRATION FOR PRETREATMENTOF HPLC SAMPLES
APPENDIX C
APPENDIX D
APPENDIX E
APPENDIX F
80
EXPERIMENTAL SET-UP OF CONTINUOUSFLOW REACTORS FOR BIOFILM CULTURES 82
TABLES AND FIGURES OF EXPERIMENTALRESULTS OBTAINED FROM SUSPENDEDCULTURES OF Pseudomonas putida 84
DETERMINATION OF SPECIFIC GROWTHRATES USING ORIGINAL BIOMASS MEASUREMENTS 100
CONVERSION FACTORS FOR TOTAL CELL NUMBER,LIVING CELL NUMBER, AND TOTAL CELL PROTEINTO OPTICAL DENSITY 104
APPENDIX G PRODUCTION OF INTERMDIATES DURINGBIODEGRADATION OF NAPHTHALENEBY Pseudomonas putida 116
APPENDIX H EXPERIMENTAL DATA FOR BIOFILM CULTURESON GLASS SUPPORTS IN CONTINUOUSFLOW SYSTEM 125
REFERENCES 134
xi
LIST OF TABLES
Table Page
4.1 Composition of inorganic medium for culture of Pseudomonas putida 14
4.2 Arrangement of shake flasks for suspended cultures 18
4.3 Evaluation of staining methods for enumerating live anddead cells in bacterial suspension 30
5.1 Regression of specific growth rates to obtain kinetic rateconstants for Monod equation 46
5.2 Conversion of OD, TCN, LCN and TCP to dry biomass (mg/L)for Pseudomonas putida with naphthalene in shake flasks 49
5.3 Determination of yield coefficient using initial slopes 50
5.4 Yield coefficient determined by averaging the final biomassconcentration 51
5.5 Prediction method for naphthalene and biomass concentrationin suspended cultures 52
5.6 Doubling times 59
5.7 Cell distribution (total cells/cm 2) on glass supports (x10 4) 62
5.8 Suspended cells in seed biofilm container 63
5.9 Viability of suspended cells of Pseudomonas putida in the seedbiofilm container 64
5.10 Biomass growth and naphthalene degradation in column-Xof the continuous flow system 69
6.1 Summary of Monod parameters 76
B-1 Adsorption of naphthalene on a membrane with a Swinney filterHolder for pre-treatment of HPLC samples. 81
D-1 Experimental data obtained from shake flask experiment (1-a) 85
D-2 Experimental data obtained from shake flask experiment (1-b) 85
xii

LIST OF TABLES(Continued)
Table Page
D-3 Experimental data obtained from shake flask experiment (1-c) 86
D-4 Experimental data obtained from shake flask experiment (1-d) 86
D-5 Experimental data obtained from shake flask experiment (2-a) 93
D-6 Experimental data obtained from shake flask experiment (2-b) 93
D-7 Experimental data obtained from shake flask experiment (2-c) 94
D-8 Experimental data obtained from shake flask experiment (2-d) 94
F-1 Dry biomass by using conversion factors from OD, TCN, LCNand TCP obtained by suspended culture with Pseudomonas putida(Experiment-1) 112
F-2 Dry biomass by using conversion factors from OD, TCN and LCNobtained by suspended culture with Pseudomonas putida(Experiment-2) 114
H-1 Naphthalene concentration 126
H-2 Cells immobilized on glass supports in column reactors ofcontinuous flow system 127
H-3 Growth and viability of suspended cells in column-X of continuousflow system for biofilm culture 127
H-4 Viable cells in column-X of continuous flow system 128
H-5 Viability of suspended bacteria in column-Y of continuousflow system for biofilm culture 129
H-6 Viable cells in column-Y continuous flow system 129
H-7 Concentration profiles of naphthalene at different sampling portsof column-X in continuous flow system for biofilm cultureswith Pseudomonas putida 133

LIST OF FIGURES
Figure Page
4.1 Seed biofilm containers: (A) Non-uniform biofilms and(B) Uniform biofilms 19
4.2 Experimental set-up of a continuous flow system withtwo column reactors and glass supports for biofilm cultures 20
4.3 Design of a column reactor with 5 glass supports for biofilmcultures in continuous flow system during biodegradation ofnaphthalene by Pseudomonas putida. 21
4.4 Epifluorescence photomicrographs of Pseudomonas putida stained(in wet condition) with the mixture of SYTO 9 and propidiumiodide under FITC optic filter 31
4.5 Epifluorescence photomicrographs of Pseudomonas putida stained(in dry condition) with the mixture of SYTO 9 and propidiumiodide under FITC optic filter 32
5.1 The best fit of specific growth rates in the original measurements ofOD for determination of µm and Ks (Experiments-1&2 combined) 47
5.2 The best fit of specific growth rates in the original measurements ofLCN for determination of μm and Ks (Experiments-1&2 combined) 47
5.3 The best fit of specific growth rates in the original measurements ofTCP for determination of µm and Ks (Experiment-1 combined) 48
5.4 The best fit of specific growth rates in all original biomass measurementsfor determination of and Ks (Experiments-1&2 combined) 48
5.5 Model predicted profiles for naphthalene and OD (Exp-1-c) 53
5.6 Model predicted profiles for naphthalene and LCN (Exp-1-c) 53
5.7 Model predicted profiles for naphthalene and TCP (Exp-1-c) 54
5.8 Model predicted profiles for naphthalene and OD (Exp-2-c) 54
5.9 Model predicted profiles for naphthalene and LCN (Exp-2-c) 55
5.10 Model predicted profiles for naphthalene and OD,1 hour lag time (Exp-1-c) 56
xiv

LIST OF FIGURES(Continued)
Figure Page
5.11 Model predicted profiles for naphthalene and LCN,1 hour lag time (Exp-1-c) 56
5.12 Model predicted profiles for naphthalene and TCP,1 hour lag time (Exp-1-c) 57
5.13 Model predicted profiles for naphthalene and OD,1 hour lag time (Exp-2-c) 57
5.14 Model predicted profiles for naphthalene and LCN,1 hour lag time (Exp-2-c) 58
5.15 Doubling time of suspended cultures of Pseudomonas putidain shake flasks with naphthalene 59
5.16 Viability of Pseudomonas putida (Experiment-1) 60
5.17 Viability of Pseudomonas putida (Experiment-2) 61
5.18 Cell distribution of initial seed biofilm on glass supportswith 5.1 mg/L of naphthalene. 62
5.19 Growth comparison of immobilized cells/cm 2 and suspended cells/mLin a seed biofilm container with 5.1 mg/L of naphthalene initially 63
5.20 Biodegradation of naphthalene and growth of biofilm attached onglass supports in a continuous flow system 66
5.21 Viability of cells and ratio of biofilms in column-X 67
5.22 General patterns of biofilm development by culturingPseudomonas putida on glass supports in a continuous flowreactor (low cell density) 72
5.23 General patterns of biofilm development by culturingPseudomonas putida on glass supports in a continuous flowreactor (higher cell density) 73
5.24 Various patterns in biofilm growth on glass supportsin a continuous flow system 74
xv

LIST OF FIGURES(Continued)
Figure Page
A-1 Calibration curve for determining biomass concentration fromoptical density by culturing Pseudomonas putida with naphthalene 78
A-2 Standard calibration curve of total protein with bovine serum albumin 78
A-3 Calibration curve for naphthalene concentration measurements 79
B-1 Adsorption of naphthalene on a membrane with a Swinney filterholder for pre-treatment of HPLC samples 81
C Experimental set-up of continuous flow reactors for biofilm cultures:(A) experimental set-up and (B) column details 83
D-1 Biodegradation of naphthalene by Pseudomonas putidain shake flasks(Experiment-1) 87
D-2 Optical density during naphthalene degradation in shake flasksusing Pseudomonas putida (Experiment-1) 88
D-3 Total cell protein during naphthalene degradation in shake flasksusing Pseudomonas putida (Experiment-1) 89
D-4 Enumeration of total and live cells during naphthalenedegradation in shake flasks using Pseudomonas putida (Experiment-1) 90
D-5 Growth patterns of Pseudomonas putida in OD, TCP and LCNdue to biodegradation of naphthalene (initial=3.07mg/L); Experiment 1-a 91
D-6 Growth patterns of Pseudomonas putida in OD, TCP and LCNdue to biodegradation of naphthalene (initial=7.21mg/L); Experiment 1-b 91
D-7 Growth patterns of Pseudomonas putida in OD, TCP and LCNdue to biodegradation of naphthalene (initial=11.49mg/L); Experiment 1-c 92
D-8 Growth patterns of Pseudomonas putida in OD, TCP and LCNdue to biodegradation of naphthalene (initial=16.19mg/L); Experiment 1-d 92
D-9 Biodegradation of naphthalene by Pseudomonas putidain shake flasks (Experiment-2) 95
D-10 Optical density during naphthalene in shake flasks usingPseudomonas putida (Experiment -2) 96
xvi

LIST OF FIGURES(Continued)
Figure Page
D-11 Enumeration of total and live cells during naphthalene degradationin shake flasks using Pseudomonas putida (Experiment-2) 97
D-12 Growth patterns of Pseudomonas putida in OD and LCN due tobiodegradation of naphthalene (initial=6.23mg/L); Experiment 2-a 98
D-13 Growth patterns of Pseudomonas putida in OD and LCN due tobiodegradation of naphthalene (initial=9.54mg/L); Experiment 2-b 98
D-14 Growth patterns of Pseudomonas putida in OD and LCN due tobiodegradation of naphthalene (initial=12.60mg/L); Experiment 2-c 99
D-15 Growth patterns of Pseudomonas putida in OD and LCN due tobiodegradation of naphthalene (initial=15.16mg/L); Experiment 2-d 99
E-1 Determination of specific growth rates of Pseudomonas putidasuspension using optical density (without conversion factor):Experiment-1 101
E-2 Determination of specific growth rates of Pseudomonas putidasuspension using living cell number (without conversion factor):Experiment-1 101
E-3 Determination of specific growth rates of Pseudomonas putidasuspension using total cell protein (without conversion factor):Experiment-1 102
E-4 Determination of specific growth rates of Pseudomonas putidasuspension using optical density (without conversion factor):Experiment-2 102
E-5 Determination of specific growth rates of Pseudomonas putidasuspension using living cell number (without conversion factor):Experiment-2 103
F-1 Conversion factor (fTcN) for total cell number to optical densityfor suspended cultures of Pseudomonas putida with naphthalenein shake flasks (Experiment-1) 105
F-2 Conversion factor (fLCN) for living cell number to optical densityfor suspended cultures of Pseudomonas putida with naphthalenein shake flasks (Experiment-1) 106
xvii

LIST OF FIGURES(Continued)
Figure Page
F-3 Conversion factor (fTCp) for total cell protein to optical densityfor suspended cultures of Pseudomonas putida with naphthalenein shake flasks (Experiment-1) 107
F-4 Conversion factor (fTCN) for total cell number to optical densityfor suspended cultures of Pseudomonas putida with naphthalenein shake flasks (Experiment-2) 108
F-5 Conversion factor (fLCN) for living cell number to optical densityfor suspended cultures of Pseudomonas putida with naphthalenein shake flasks (Experiment-2) 109
F-6 Combined conversion factor (fTCN) of experiment-1&2 fortotal cell number to optical density for suspended cultures ofPseudomonas putida with naphthalene in shake flasks 110
F-7 Combined conversion factor (fLCN) of experiment-1&2 forliving cell number to optical density for suspended cultures ofPseudomonas putida with naphthalene in shake flasks 111
G-1 Concentration profiles during biodegradation of naphthalene (A);sample HPLC chromatogram (B) and sterile control (C)at time 4 hours: Experiment-1-a 117
G-2 Concentration profiles during biodegradation of naphthalene (A);sample HPLC chromatogram (B) and sterile control (C)at time 4 hours: Experiment-1-b 118
G-3 Concentration profiles during biodegradation of naphthalene (A);sample HPLC chromatogram (B) and sterile control (C)at time 4 hours: Experiment-1-c 119
G-4 Concentration profiles during biodegradation of naphthalene (A);sample HPLC chromatogram (B) and sterile control (C)at time 4 hours: Experiment-1-d 120
G-5 Concentration profiles during biodegradation of naphthalene (A);sample HPLC chromatogram (B) and sterile control (C)at time 4 hours: Experiment-2-a 121
xviii

LIST OF FIGURES(Continued)
Figure Page
G-6 Concentration profiles during biodegradation of naphthalene (A);sample HPLC chromatogram (B) and sterile control (C)at time 4 hours: Experiment-2-b 122
G-7 Concentration profiles during biodegradation of naphthalene (A);sample HPLC chromatogram (B) and sterile control (C)at time 4 hours: Experiment-2-c 123
G-8 Concentration profiles during biodegradation of naphthalene (A);sample HPLC chromatogram (B) and sterile control (C)at time 4 hours: Experiment-2-d 124
H-1 Comparison of naphthalene concentration in column-X and Y,difference between inlet and outlet for biofilm cultures in acontinuous flow system 126
H-2 Amount of live cells on biofilm and suspension in column—Yaccording to elapsed time in continuous flow system forbiodegradation of naphthalene 130
H-3 Comparison of total live cells in column-X and —Y of continuousflow system for biodegradation of naphthalene by Pseudomonas putida 131
H-4 Concentration profiles for control run on column-X 132
H-5 Control runs with (column-X) and without (column-Y)glass supports without biofilm in a continuous flow system 132
H-6 Profiles of naphthalene consumption along with sampling portsin column-X of continuous flow system for biofilm cultureswith Pseudomonas putida 133
xix

CHAPTER 1
INTRODUCTION
1.1 Viable Bacteria in Suspended and Biofilm Cultures
Most researchers have focused on estimating cell concentration in suspended culture
using general parameters such as OD, dry weight of biomass, and cell protein
concentration [Best (1997), Karel and Robertson (1989), Gőtz and Reuss (1997),
Kennedy et al. (1992)]. However, cell quantitation by these methods measures not only
viable cells, but also dead cells and debris. Pour plate techniques with nutrient agar have
also been used to count the number of viable cells. However, researches have shown that
the plate count (PC) method only reveals those bacteria that are capable of forming
colonies on agar plates [Roszak and Colwell (1987), Stewart et al. (1994), Yu and
McFeters (1994), Jacques and Morris (1995)], and this is often only a small fraction of
the total bacteria present in the system.
Microbial cells attached to a surface produce extracellular polymers (called
slime), which provide a supporting structure for the biofilm [Sandford et al. (1995)].
Biofilms are composed of living cells, dead cells, and cell debris in a polysaccharide
matrix. Also, a thick biofilm may contain both aerobic and anaerobic environments due
to oxygen diffusion limitations within the biofilm. [Characklis and Marshall (1990),
Bishop (1996)]. Bio-oxidation in a biofilm is directly related to an active thickness
corresponding to the depth of substrate penetration into the biofilm [Trulear and
Characklis (1982), Liu and Capdeville (1996), Swope and Flickinger (1996)]. Active
cells in aerobic systems usually grow in a thin film near the source of substrate and
oxygen.
1

2
1.2 Use of Fluorescent Staining Techniques
Fluorescent probes have been used to assess bacterial viability and function as well as
antibiotic susceptibility [Comas and Vives-Rego (1998), Jacobsen et al. (1997),
Liobet-Brosa et al. (1998), Lebaron et al, (1998)]. Molecular Probes Inc. has developed
LIVE/DEAD® BacLight™ Bacterial Viability Kit (LDBBVK) to distinguish live bacteria
(with intact plasma membranes) from dead bacteria with compromised membranes
[Haugland (1996)]. The LDBBVK provides a novel two-color fluorescence assay of
bacterial viability by staining with bacterial nucleic acid, using a mixture of SYTO 9 for
green fluorescence and propidium iodide (PI) for red fluorescence. LDBBVK has also
been used to observe viable and non-viable cells using epifluorescence microscopy
[Terzieva et al. (1996), Taghi-Kilani et al. (1996), Braux et al. (1997), Duffy and
Sheridan (1998), Strathmann and Flemming (2000)), confocal laser scanning microscopy
[Neu and Lawrence (1997)], or flow cytometry [Virta et al. (1998)].
The SYTO 9, when used alone, labels all bacteria in a population which have
either intact membranes or damaged membranes. In the presence of both dyes, PI (which
is a membrane-impermeable DNA stain) penetrates only those cells with damaged
membranes, competing with the SYTO 9 for nucleic acid binding sites. The
excitation/emission maxima of these dyes are about 480 nm to 500 nm for the SYTO 9
and 490 nm to 635 nm for the PI. Therefore, in the presence of both dyes, bright green
fluorescence indicates live bacteria with intact membranes, while bright red fluorescence
indicates dead bacteria with damaged membranes.

3
1.3 Determination of Viability in Surface Biofilms
By far, most information about biofilms has been extrapolated from those studies with
bacterial suspensions. Several researchers [Massol-deyά et al. (1995), Sanford et al.,
(1996), Bauer-Kreisel et al. (1996)] typically extracted cells from attached biofilms into
suspension (using phosphate-buffered saline and ultrasonication) and subsequently
stained and counted them. As a result, there is a need for in-situ measurement of biofilm
characteristics, and the properties of the surface microenvironments by direct
microscopic observation.
To directly assess viability of bacteria in biofilms without disturbing the integrity
of the interfacial community, a non-destructive in-situ direct viable count (DVC) method
was developed by Yu et al. (1993). Klebsiella pneumoniae Kp 1 was applied for the
biofilm cultures on stainless steel coupons in a stirred batch reactor under aerobic
conditions. The biofilm cultures were limited to monolayers in order to be countable by
epifluorescence microscopy. They fixed immobilized cells with formaldehyde followed
by immersion in 0.02% acridine orange solution for 2 minutes. Although the in-situ DVC
method has some constraints imposed by optical microscopy, it can still provide rapid
and accurate determination of viable cells. They reported that the in situ DVC method
showed higher viable cell counts than plate counts and conventional-DVC methods
without the bias caused by aggregated bacteria.
A great deal of research on the structure of biofilms has been conducted at the
Center for Biofilm Engineering at Montana State University (Characklis, de Beer,
Stoodley, Lewandowski, etc.). Their research has generally involved the use of

4
microprobes to determine e.g. oxygen and pH profiles in biofilms. However, individual
cell viability has not been addressed.

CHAPTER 2
LITERATURE REVIEW
2.1 Enumeration of Viable Cells by Fluorescence Microscopy
5-cyano-2,3-ditolyl tetrazolium chloride (CTC) has been used as an indicator of electron
transport activity for direct microscopic visualization of actively respiring cells in
drinking water or other aquatic environmental samples under aerobic conditions
[Rodriguez et al. (1992), Schaule et al. (1993), Winding et al. (1994), Yu et al. (1995),
An and Friedman (1997)]. As a redox fluorescent probe, it is readily reduced via the
electron transport chain of an active bacterial population from a colorless, nonfluorescent,
and oxidized form to fluorescent and insoluble CTC-formazan (CTF) crystals
accumulating intracelluarly. To allow concurrent determination of total cells (i.e. viable
and nonviable) and respiring cells (i.e. cells forming CTF) by an epifluorescence
microscope, the CTC-treated samples (Pseudomonas putida 54g) were counterstained
with the DNA-binding fluorochrome 4',6-diamidino-2-phenylindole (DAPI). Using the
ratio of CTC and DAPI counts in conjunction with biofilm cryogenic sectioning
techniques, Villaverade et al. (1997) and Villaverade and Fernández-Polanco (1999) were
able to evaluate fractions of total respiring cells in a biofilm, which they compared to
respiration rates at various distances from the surface using oxygen microsensors. The
biofilm was cultured in an aerobic system with a flat-plate vapor phase biological reactor.
Another indicator of bacterial respiration, a redox dye 2-(p-iodophenyl)-3-(p-
nitrophenyl)-5-phenyltetrazolium chloride (INT), has been applied for direct observation
of active cells by the reduction of NT to dark-red intracellular INT-formazan (INF)
crystals. Zimmermann et al. (1978) and Tarbor and Neihof (1982) tested bacterial
5

6
samples taken from natural aquatic environments. Okabe et al. (1996) investigated spatial
distributions of nitrifiers and heterotrophs in mixed-population biofilms under aerobic
conditions using a partially submerged rotating biological contactor (RBC). Smith and
McFeters (1997) tested both tetrazolium salts of INT and CTC under aerobic and
anaerobic conditions with Escherichia coli K-12. They reported that both INT and CTC
were significantly reduced under most anaerobic conditions, particularly glucose
fermentation. However, CTF makes it relatively easier (compared to INT) to directly
visualize respiring cells in biofilms on an opaque background (e.g. wood, metal, and
plastic, etc.) by epifluorescence microscopy [Rodriguez et al. (1992), Smith, and
McFeters (1997)].
For counting viable cells in thin biofilms (monolayers) on stainless steel coupons
with Klebsiella pneumoniae, Yu and McFeters (1994) compared four different
enumerating methods. These methods were: (1) CTC reduction technique, (2) use of
rhodamine 123 (Rh-123), (3) in-situ direct viable count (DVC), and (4) a modified drop
plate count. Rh-123 is a proton motive force-driven dye, which is only taken up by viable
cells. The DVC method is related to the counting of elongated cells stained with acridine
orange (AO) as viable cells, using nalidixic acid and nutrients to halt cell division
[Kogure et al. (1979), Peele and Colwell (1981), Liebert and Barkay (1988), Singh et al.
(1990)]. Yu and McFeters (1994) reported that the percent cell viability varied from 95%
obtained by the CTC reduction method, to 43% obtained by the PC method.
For the direct enumeration of injured Escherichia coli cells, Braux et al. (1997)
also tested four different methods such as the DVC for testing biosynthesis capacity, the
reduction assay of the CTC or sodium 3'-[1-[(phenylamino)-carbonyl]-3,4-tetrazolium]-

7
bis(4-methoxy-6-nitro) benzenesulfonic acid hydrate (XTT) for respiratory activity, and
the LDBBVK assay with SYTO 9 and PI for membrane integrity. They concluded that
the use of dual staining with LDBBVK appears to be the most sensitive test among those
assays to assess E. coli viability.
Using two strains of Escherichia coli, Boulos et al. (1999) reported that the
LDBBVK assay resulted in the highest viable (green) and total (green and red) counts
among several staining techniques (CTC, CTC with DAPI counterstaining, and a
modified CTC method with SYTO 9 counterstaining). They found that storage after
treatment with glutaraldehyde decreased total and viable counts of some coliform strains
when using LDBBVK assay. Therefore, they suggested that immediate processing of
samples is preferable. In this research with LDBBVK assay, formalin was not used to
preserve bacterial samples because all live cells treated with formaldehyde (2% in the
final concentration) showed red fluorescence, indicating that the use of preservative
chemicals damaged the integrity of bacterial membranes.
2.2 Biofilm Research
As general parameters for biofilm characterization, many researchers [Stewart et al.
(1993), Lauvvik and Bakke (1994), Tanyolaç and Beyenal(1996, 1997), Pavasant et al.
(1996), Peyton (1996), Freitas dos Santos and. Livingston (1995a, 1995b)] have used
biofilm thickness and total dry weight. However, these parameters are not sufficient to
describe biofilm characterization and biomass activity. Lazarova et al. (1994) proposed
an integrated approach for biofilm analysis: 1) direct binocular microscopic observation
and scanning electron microscopy for external biofilm structure and thickness; 2)

8
chemical oxygen demand, total organic carbon, and dry weight for total biofilm amount;
3) exopolysaccharides, total protein, total cell count, and viable heterotrophic count for
specific biofilm components; 4) electron transport system activity, active cell count, and
specific activity for estimating fixed biomass activity; and 5) nucleic acid probes for
study of population dynamics (in particular of the autotroph/heterotroph competition in
biofilms).
For the surface biofilm studies, a few researchers have performed experiments
using direct microscopic observations of microorganisms under in-situ aerobic conditions
using small continuous-flow slide culture chambers [Caldwell and Lawrence (1988),
Lawrence et al. (1989), Korber et al. (1990), Lawrence et al. (1991), Caldwell et al.
(1992), Lawrence et al. (1994)]. They have developed in-situ techniques for observing
cells attached on glass surfaces, and have performed computer image analyses of the
microscopic views. They studied bacterial growth kinetics by looking at the cell doubling
time, and by counting cells on the upper and lower surfaces. However, they did not
distinguish between live and dead cells.
Microelectrodes for oxygen (02), ammonium (NH4 +), nitrite (NO2 -), nitrate
(NO3), or pH have been used to study distribution of bacterial activity in biofilms by
measuring the microprofiles of the constituents with biofilm depth. Thus, active or
inactive zones, in terms of bacterial activity, can be distinguished with biofilm depth. De
Beer et al. (1993) used the microelectrodes to study nitrifying bacterial aggregates grown
in an aerobic fluidized-bed reactor. Lewandowski et al. (1993) measured oxygen
concentration profiles across a biofilm grown in an aerobic continuous flow reactor.

9
Schramm et al. (1997) measured microprofiles of 02 consumption and NO3-/NO2 -
production in a trickling filter biofilm with nitrifying bacteria.
Neu and Lawrence (1997) have studied the development of biofilm structures in
raw river water, using removable polycarbonate slides for biofilm sampling on a rotating
annular bioreactor, and confocal laser scanning microscopy (CLSM) with the
LIVE/DEAD fluorescent probe (Molecular Probes, Inc.). The dual channel images
obtained by the CLSM were able to show the distribution of live (green) and dead (red)
cells in sagittal sections (or xz axis) of biofilms. The vertical distribution of cells (live
and dead) showed the same general trend of increasing with distance away from the
attachment surface toward the nutrient source. They reported that in mature biofilms, red
fluorescence was obscured by the autofluorescence of organic matter incorporated into
the biofilm, but both living and dead cells could be resolved within individual
microcolonies at high magnification. They indicated that a high proportion of the biofilm
showed relatively non-viable state (red fluorescence). This was consistent with the
findings of this dissertation which observed a problem with direct staining of biofilms, as
mentioned in Section 4.5.2.
Using CLSM, de Beer et al. (1994) and Stoodely et al. (1994) developed a
noninvasive technique for microscale measurement of flow velocity profiles near and
within biofilms cultured in an aerobic reactor. They used fluorescein microinjection
technique to determine the presence of flow in cell clusters and voids. They found that
liquid can flow through the voids and is stagnant in the cell clusters. De Beer et al.
concluded that in the voids mass transport might take place by both convection and
diffusion, whereas in the cell clusters only diffusion can occur.

10
Characklis and Marshall (1990) described several ways in which bacteria attach to
a range of surfaces. Some bacteria respond gradually to the presence of a surface,
attaching more firmly with time. Differences in attachment depend on the type of
bacteria, type of surface (and its conditioning), and nutrient conditions.
By using rectangular glass tubing to simulate flow in industrial pipes, Stoodley et
al. (1999) studied biofilm structures under laminar and turbulent flows. Biofilms grown
under laminar flow were patchy and consisted of cell clusters separated by interstitial
voids. Biofilms grown under turbulent flow formed filaments, which had a more complex
structure and were formed by the colonization of filamentous sheathed bacteria with
microcolonies of non-filamentous bacteria.
By cryosectioning biofilms covered with hydrophilic polymers as an embedding
agent that maintains a degree of plasticity when frozen, Murga et al. (1995) reported that
biofilms with two species of bacteria (Pseudomonas aeruginosa and Klebsiella
pneumoniane) grown in an aerobic system were structurally distinct from
monopopulations, due to differences in such characteristics as capsule structure and
motility.
2.3 Biodegradation of Polycylic Aromatic Hydrocarbons
Guerin and Boyd (1992, 1997) reported that Pseudomonas putida (ATCC 17484) had
superior characteristics in both the rate and extent of naphthalene mineralization.
Many researchers [Stucki and Alexander (1987), Rockne and Strand (1998),
Erickson et al. (1993)] have focused on biodegradation of polycyclic aromatic
hydrocarbons (PAHs), which are principal components of coal tar. Naphthalene is the

11
most abundant and simplest PAH compound in coal tar. Rockne and Strand reported that
bicylics and PAHs could be degraded in anaerobic enrichments such as nitrate- and
sulfate-reducing conditions. Erickson et al. investigated loss of PAHs at a manufactured
gas plant (MGP) site. Ghoshal and Luthy (1996, 1998) and Ghoshal et al. (1996)
presented kinetic data for naphthalene degradation, including the following Monod
parameters for using a mixed culture isolated from PAH contaminated soil and grown on
naphthalene over a long period of time in aerobic slurry systems: Y (yield coefficient) =
0.25±0.08 (mg dry biomass per mg naphthalene degraded); 1.6 (maximum specific
growth rate) = 0.067 II I and Ks (half saturation constant) = 3.4 mg/L.
Wilson and Madsen (1996) detected a characteristic metabolite (1,2-dihydorxy-
1,2-dihydronaphthalene) during aerobic degradation of naphthalene at a coal tar-
contaminated field site.
Biodegradation of PAHs may be limited by their low solubility, coupled with
strong binding and sorption onto soils. Liu et al. (1995) evaluated the effects of two
nonionic surfactants on bacterial mineralization of naphthalene: an alkylethoxylate (Brij
30) and an alkylphenolethoxylate (Triton X-100). Both enhanced bioavailability without
inhibiting the rate of biodegradation by a mixed aerobic culture isolated from PAH-
contaminated soils.
Marx and Aitken (2000) suggested that bacterial chemotaxis to a pollutant can
overcome the mass transfer limitations that may govern biodegradation rates in
contaminated environments. They showed that a motile wild strain of Pseudomonas
putida exhibited superior naphthalene degradation when compared to a nonmotile mutant
or a mutant deficient in naphthalene chemotaxis.

CHAPTER 3
OBJECTIVES
The objectives of this research were to study the activities and microbial growth rates of
viable bacteria in suspended culture and immobilized biofilm by comparing optical
density (OD), cell number, and total cell protein (TCP) as measurement tools. In order to
distinguish living cells from dead cells, a fluorescent staining technique was developed,
with Pseudomonas putida (ATCC 17484) and naphthalene as model system.
The specific objectives were to:
• develop a fluorescent staining technique to distinguish live from dead cells
• compare biomass measures - dry biomass weight, OD, total cell number (TCN),
living cell number (LCN), and total cell protein — for the model system
• examine both suspended culture and fixed biofilm
• relate measures of biomass to naphthalene degradation rate
12

CHAPTER 4
MATERIALS AND EXPERIMENTAL METHODS
4.1 Materials
4.1.1 Preparation of Growth Medium
Naphthalene was used as sole carbon source. About 2 to 3 g of naphthalene crystals were
added to autoclaved deionized (DI) water in 4-L glass containers. The solution with
crystal naphthalene was dissolved by a magnetic stirrer for about one week to make it
saturated. The saturated solution (approximately 30 ppm) was finally sterilized by
passing through an autoclaved membrane filter with 0.22 pm pore size. The filter-
sterilized naphthalene solution was stored in 2-L glass containers at room temperature
and sealed completely. For experiments with suspended cultures, this stock solution was
diluted with autoclaved DI water and inorganic medium to reach the desired
concentration.
The inorganic growth medium is shown in Table 4.1. Medium A and B were
prepared separately to avoid formation of white precipitates during autoclaving.
Potassium phosphate (K2HPO4) was used to maintain culture solution at pH 7. Each
medium was autoclaved at 121 °C and 16 psi for 20 minutes and stored in a refrigerator.
Nutrient broth was prepared by dissolving 4 g of "BBL Nutrient Broth" with 1-L
of DI water, which was then autoclaved. This solution was used for reviving frozen
cultures initially.
13

14
Table 4.1 Composition of inorganic medium for culture of Pseudomonas putida.
Chemicals Final concentration(g/L) (mmol/L)
MediumA Potassium Phosphate, Monobasic (KH2PO4) 0.2 1.5
Potassium Phosphate, Dibasic (K2HPO4) 0.26 1.5Medium
B Ammonium Chloride (NH4Cl) 0.3 4.6
Sodium Chloride (NaCl) 1.0 17.1Magnesium Chloride, Heptahydrate (MgCl 2
6H20) 0.4 2.0
Calcium Chloride, Dihydrate (CaCl2 2H20) 0.2 1.0Potassium Chloride (KCl) 0.5 6.7Sodium Sulfate (Na2SO4) 0.2 1.4
Trace (mg/L) (mmol/L)elements Ferrous Chloride, Tetrahydrate (FeCl2 4H20) 1,500 7.5
Zinc Chloride (ZnCl2) 70 0.5Manganous Chloride, Tetrahydrate (MnCl24H20) 100 0.5
Boric Acid (H3B03) 6 0.1Cobalt Chloride, Heptahydrate (CoCl2 6H20) 190 0.8Cuprous Chloride, Dihydrate (CuCl2 2H20) 2 0.02Nickel Chloride, Heptahydrate (NiCl 2 6H20) 24 0.1Sodium Molybdate, Dihydrate (Na2MoO4
2H20) 36 0.15
Hydrochloric Acid (HCI, 37%) 5.795 mL 70
4.1.2 Fluorescent Probes for Staining Bacteria
LIVE/DEAD® BacLight™ Bacterial Viability Kit (LDBBVK, L-7012) was used to
provide the fluorescent probes for fluorescence microscopy (Molecular Probes, Inc.,
Eugene, OR). This kit contains 3.34 mM SYTO 9 solution and 20 mM propidium iodide
(PI) solution (each dissolved in anhydrous dimethyl sulfoxide: DMSO), and 10 mL of
BacLight mounting oil. The mounting oil provides a high viscosity environment, which
minimizes Brownian motion of stained cells, and serves as an anti-fading agent to reduce
the bleaching of the dyes. The excitation/emission maxima of these dyes are about 480
nm/500 nm for the SYTO 9 and 490 nm /635 nm for the PI.

15
Based on results of pre-screening tests, the mixture of SYTO 9 and PI with a 1:1
ratio by volume was used as mentioned in the manufacturer's instructions. Although the
manufacturer suggests the use of 0.3% DMSO in the final suspension (i.e. 3 pt of dye
mixture per 1 mL of suspension), pre-screening tests indicated that 0.2% DMSO gave
equivalent results with a saving of the expensive dye.
4.1.3 BCA Protein Assay Kit
The BCA protein assay, purchased from Pierce (Rockford, IL), is a detergent-compatible
formulation based on bicinchoninic acid (BCA), for the colorimetric detection and
quantitation of total protein. The BCA protein assay is performed under the following
reaction schemes:
OH-1) Protein (peptide bonds) + Cu+2 Tetradentate-Cu+1 complex
2)Cu+1 + 2 Bicinchoninic acid BCA-Cu+1 complex (purple color).
The purple-colored reaction product exhibits a strong absorbance at 562 nm. The BCA
protein assay kit includes Reagent A (containing sodium carbonate, sodium bicarbonate,
bicinchoninic acid and sodium tartrate in 0.2N sodium hydroxide), Reagent B (4% cupric
acid solution), and Albumin standard ampules (containing bovine serum albumin at a
concentration of 2.0 mg/mL). The BCA working reagent was prepared by mixing 50
parts of Reagent A with 1 part of Reagent B.
4.1.4 Biofilm Glass Supports
Rectangular glass pieces were used as biofilm supports in column reactors with
continuous medium flow. The biofilm supports (BF-supports) were designed to be 25.5
16
cm in length, 3.4 cm in width and 0.22 cm in thickness, providing about 186 cm 2 in the
total surface area and about 19 cm 3 in volume (Shin Glass Inc., Palisades Park, NJ).
Before starting experiments, each glass piece was scratched using a glass cutter, thereby
dividing it into three regions. After staining the biofilm, the scratched glass pieces were
snapped off just before microscopic observation in order to obtain replicate counts and
average values for each original piece. The glass pieces were cleaned by sonication, then
rinsed with detergent, hot water and distilled water, before autoclaving.
4.2 Pure Culture of Pseudomonas putida (ATCC 17484)
Pseudomonas putida biotype A, which was obtained from American Type Culture
Collection (ATCC 17484) by Jay Best (previous student at NJIT), was used to degrade
naphthalene as sole carbon source. The strain of Pseudomonas putida grows under
aerobic conditions at 20 to 30 °C (Best, 1997). The original culture used for this research
had been stored at -20 °C for about one year. The frozen culture was melted at room
temperature for reviving cells.
When the fluorescent staining dye was tested with Pseudomonas putida at the
beginning of this research, only the nutrient broth culture was used for rapid and
convenient bacterial growth instead of naphthalene and inorganic medium. However, it
was found that the strain of Pseudomonas putida lost the ability to degrade naphthalene
after being cultured with nutrient broth for a prolonged period. As a result, the following
method was adopted.
About 1 mL of the melted seed culture was transferred to a 250 mL flask
containing about 30 mL of nutrient broth. It was then cultured in an incubator shaker

17
(Series 25, New Brunswick Scientific Co.), which was set at 25 °C and 200 rpm, for
about 2 days. The culture indicated signs of growth by becoming cloudy. After that, the
culture was transferred to a 1-L baffled flask for acclimation with naphthalene (about 5
mg/L in concentration) and inorganic medium. Flasks containing inoculated suspension
were also placed in the incubator shaker to maintain the appropriate temperature and air-
supply. After about 24 hours, the culture also showed signs of growth. When the carbon
source was depleted, a small amount of crystal naphthalene was added periodically to the
suspension, sometimes also adding inorganic medium. Seed cultures were prepared by
this method about 2 to 3 days prior to each experiment.
4.3 Experimental Set Up
4.3.1 Preparation of Suspended Cultures
Experiments for suspended cultures with Pseudomonas putida were simultaneously
performed with 13 shake flasks (1-L glass Erlenmeyer flasks), which had 4 different sets
(indicated as a, b, c and d) of naphthalene concentration as shown in Table 4.2. Each
concentration set consisted of 3 flasks, with flasks A and B as duplicates and flask C for
sterile control (no bacteria). One additional flask (D) contained bacteria but no
naphthalene. Each flask contained 300 mL of suspension: 20 mL of seed culture, 13.3 mL
of inorganic media (3 mL of medium A, 7 mL of medium B and 0.3 mL of trace
elements), and 269.7 mL of naphthalene solution. The naphthalene concentrations were
measured by HPLC, as described in subsequent sections. The suspended cultures were
put in an incubator shaker at 25 °C and 200 rpm. Each flask was plugged with a cap.

18
There was sufficient air in the headspace of a shake flask because fresh air was
introduced into the flask by opening the cap at every sampling time.
Table 4.2 Arrangement of shake flasks for suspended cultures.
4.3.2 Preparation of Fixed Biofilms
At least 13 BF-supports were used to perform one set of biofilm experiment. 10 supports
were installed on two column reactors, and 3 supports as initial samples were prepared to
obtain more reliable data for bacterial enumeration. An autoclavable glass container (8.5
inches in diameter, 17.5 inches in height, and 15-L in volume) was prepared to culture
seed biofilms on glass supports.
At the beginning of the biofilm tests, all glass supports were irregularly placed in
the container as shown in Figure 1A. However, there were difficulties obtaining a
uniform biofilm distribution on all glass supports. To overcome this problem, a round
holder made with Teflon material (Figure 1B) was designed to make all BF-supports
stand vertically and evenly spaced in the container. Aeration (about 40 mL/minute) was
provided by a laboratory-based air line through 4 in-line air filters (Bacterial Air Vent,
Gelman Sciences) and a glass tube with a fritted end. The top of the container was
covered with aluminum foil while culturing the biofilms. Bacterial suspension in the
container was continuously mixed using a magnetic stirrer (Cimarec 3, Thermolyne).

Figure 4.1 Seed biofilm containers: (A) Non-uniform biofilms and (B) Uniform biofilms.
4.3.3 Column Reactors for Biofilm Cultures in Continuous Flow System
A schematic diagram of the experimental set-up for biofilm cultures on glass supports is
presented in Figure 4.2 and C (A) in Appendix C. The two columns in the diagram were
custom-made (Ace Glass, Vineland, NJ). Each column was a heavy-walled glass process
pipe with 5 cm inside diameter and 12 inches (30.5 cm) in length. There were 5 sampling
ports along the height of each column. Figure 4.3 and C (B) in Appendix C show the
details of the column reactor. There were 5 glass supports for biofilm culture in each
column. Two thick polymeric end plates were tightly connected to each end of the
column using a rubber o-ring. The bottom end plate (inlet) was specially re-designed by a
machine shop (N. & J. Machine Prod. Inc., Newark, NJ) with slots for installing 5 glass
BF-supports vertically onto the inlet plate, maintaining almost the same interval (4-5

[Dot lines: Recirculating lines to make system equilibriumcondition with naphthalene before installing biofilm glasssupporters.] In-line air filters
Figure 4.2 Experimental set-up of a continuous flow system with two column reactors and glass supports for biofilm cultures.(R-A and R-B contained excess of crystal naphthalene and inorganic media. R-B was used to damp sudden change ofnaphthalene concentration in R-A when fresh inorganic medium without naphthalene was continuously supplied from R-C.)

21
Figure 4.3 Design of a column reactor with 5 glass supports for biofilm cultures incontinuous flow system during biodegradation of naphthalene by Pseudomonas putida.(Glass support: 25.5 cm in length, 3.4 cm in width, and 2.2 mm in thickness; surface areaof each glass support = 186 cm 2 ; interval between each glass = 4-5 mm)

22
mm) between each BF-support. Also included was a stainless steel bracket on the top of
the glass supports. BF-supports on each column were numbered for sampling order.
The two columns (X and Y) in the continuous flow system were set up in a
parallel position as shown in Figure 4.2. Three pumps (Pump-1, 2, 3), three reservoirs (R-
A, B, C), and three magnetic stirrers (M-1, 2, 3) were installed in this system, connected
with polypropylene tubing (ID: 3/32", OD: 1/8", Cole-Parmer Instrument Co.), Tygon®
tubing (ID: 1/16", OD: 3/16", Cole-Parmer Instrument Co.) or PharMed® tubing (L/S™
14, Cole-Parmer Instrument Co.). Pump-1 was operated with two cartridges on a multi-
channel pump head to maintain the same flow rate for both column reactors.
Because of adsorption of naphthalene on Tygon® and PharMed® tubing,
polypropylene tubing was used whenever possible. However, polypropylene is a rigid
material that cannot be used in the pump heads. Tygon® and PharMed® are superior in
those applications. Tygon® tubing was used only on the pump heads for pumps-1 and -2.
The PharMed® tubing was used on the line from R-C to R-B because R-C contained only
inorganic media and trace elements. Some straight fittings for 1/16" tubing ID
(polypropylene, Cole-Parmer Instrument Co.) and small pieces of PharMed® tubing were
used to connect the system lines. Four three-way stopcocks with luer lock
(polypropylene, Cole-Parmer Instrument Co.) were installed before and after both column
reactors for taking naphthalene samples.
It was observed that there was difficulty in maintaining a constant concentration
of naphthalene in R-A with aeration. It was decided to maintain R-A at a saturated
condition using an excess of crystal naphthalene. R-A and R-B (2-L PYREX® bottles)
contained an excess of crystal naphthalene and were supplied continuously with

23
inorganic media solution from R-C (5-gallon PYREX® bottle). R-B was used to damp
sudden change of naphthalene concentration in R-A when fresh inorganic media without
naphthalene was continuously supplied from R-C. The media solution in R-C was
continuously aerated at about 125 mL/minute by a laboratory-based air line through 3 in-
line air filters (Bacterial Air Vent, Gelman Sciences). A stainless steel filter was installed
at the inlet of each pumping line in R-A and R-B, as well as at the sampling port for R-A,
in order to prevent crystalline naphthalene from affecting the HPLC system.
Experimental results using suspended cultures with shake flasks indicated that the
exponential phase of bacterial growth usually lasted for approximately 10 hours.
Considering that the water capacity of the column reactor with 5 BF-supports was 441
mL, a flow rate at 1 mL/minute was desirable to maintain a proper residence time (7.3
hours) for the culture medium. Water capacity without BF-supports was 536 mL (8.9
hours residence time).
The flow rate of pump-1 was fixed at 1 mL/minute, while flow rates of the other
pumps were periodically adjusted to maintain a constant liquid volume (about 2-L) in R-
A and R-B. It was necessary to maintain the same flow rate (1 mL/minute) at the inlets of
both columns. The inlet concentration of naphthalene was increased when the flow rate of
pump-1 was increased. As the flow rate increased, less adsorption of naphthalene was
observed in the system. Above a certain flow rate, the inlet concentration of naphthalene
became steady. When this system was recirculated for equilibrium condition with
naphthalene, it was necessary to keep the same flow rate of the medium having a constant
concentration on the inlets of the column reactors during one run of biofilm culture.

24
With the fixed flow rate (1 mL/minute) in both column reactors, whenever a BF-
support in column-Y was taken out as a sample for microscopic enumeration, the
residence time of the liquid medium gradually increased (from 7.3 to 8.9 hours) due to
the replacement of the glass supports with liquid volume.
Autoclavable 3-way stopcocks with luer locks (polypropylene, Cole-Parmer
Instrument Co.) were used for HPLC and microscopic samples of suspended cells at the
inlet and outlet of each column. 3-way plastic stopcocks with luer locks (Cole-Parmer
Instrument Co.) were also used to take samples of suspension in column-X. The plastic
stopcocks were sterilized by 3% hydrogen peroxide and washed with autoclaved water.
4.4 Analytical Procedures
4.4.1 Optical Density of Bacterial Suspension
The biomass concentration in shake flask tests for suspended cultures was determined by
measuring optical density (OD) of the sample suspension. About 5 mL of bacterial
suspension from a shake flask was taken into a test tube. OD of each sample was
measured at wavelength of 540 nm using a spectrophotometer (Spectronic 20D, Milton
Roy Company), and related to biomass using a calibration curve (Figure A-1, Appendix
A).
4.4.2 Dry Biomass of Bacterial Suspension
A gravimetric method by centrifugation was applied to separate the biomass from
suspended culture (Best, 1997), using a General Purpose Centrifuge (Clay Adams™
DYNAC™ II, BD Sciences).

25
Four 1-L shake flasks with 300 mL of bacterial suspension were cultured with
different concentrations of biomass, using different concentrations of naphthalene. When
the bacterial culture reached a proper range of OD, 150 mL of suspension was taken from
each flask at four different sampling times. The OD of each sample was measured at 540
nm and then transferred to three 50-mL centrifuge tubes for triplicate tests. They were
centrifuged at about 2,400 rpm for 45 minutes and supernatant was decanted. The
bacterial pellet on the bottom of each tube was rinsed with 50 mL of DI water and then
centrifuged again. After that, the supernatant was decanted a second time. Each biomass
pellet was diluted with 25 mL of DI water and then mixed by vortex. The diluted
suspensions were transferred into pre-tared aluminum weighing dishes. They were placed
in a drying oven at about 110 °C overnight. After drying, the weight of biomass was
measured, and the dry biomass concentration was determined by averaging data from
three replicates.
Once a calibration curve was developed (Figure A-1), experiments relied on OD
to determine biomass concentration, since this was easier to obtain.
4.4.3 Measurement of Total Cell Protein
To measure total cell protein (TCP) of suspended cultures, about 1.5 mL of each sample
used for OD measurement were placed in a microcentrifuge tube, centrifuged at 17,000
xg for 3 minutes (Centra-M centrifuge, International Equipment Company). The
supernatant was then discarded, and 0.3 mL of 0.1 N-NaOH were added to the pellet on
the bottom of the centrifuge tube and thoroughly mixed by vortex. Also, 0.1 N-NaOH
without biomass was prepared for the blank control. This was subtracted from

26
concentrations of actual bacterial samples. All bacterial samples in NaOH solution were
stored in the freezer for the future analysis.
The frozen samples in microcentrifuge tubes were boiled for 30 minutes by using
floating bubble racks to hold the tubes. Final volume of the boiled samples was adjusted
to 0.5 mL by adding about 0.2 mL of DI water. They were mixed by vigorous vortexing
and then centrifuged at 17,000 x g for 3 minutes.
As a sample for the BCA protein assay, 0.15 mL of each supernatant was placed
in a test tube. Also, 0.15 mL of each standard with known concentrations of bovine serum
albumin (BSA), which was previously diluted with DI water, was pipetted into
appropriately labeled test tubes. 3 mL of the BCA working reagent (WR) was added to
each test tube and then mixed well (sample to WR ratio = 1:21).
All samples including standard solutions were incubated at 75 °C for 30 minutes
in a drying oven. The incubating temperature was increased from 60 °C to 75 °C to detect
lower concentrations of samples. On the enhanced protocol of the BCA protein assay, the
working range at 60 °C for 30 minutes was 5 to 250 µg/mL in total protein.
After incubation, all sample tubes were kept on ice to prevent further color
development. The absorbance of each sample was measured at 562 nm by a
spectrophotometer (Varian, DMS 300). A typical calibration curve for all standard
solutions is shown in Figure A-2 in Appendix A. Using the standard curve, the TCP
concentration for each sample was determined.

27
4.4.4 Analysis of Naphthalene
Concentrations of naphthalene were analyzed using a Waters HPLC with: (1) Tunable
Absorbance Detector (Model 484); (2) System Controller (Model 600E); (3) Multisolvent
Delivery System (Model# 600); and (4) Autosampler (Ultra WISP Sample Processor,
Model# 715); (5) a chromatographic column (MercK 50822; Lichrospher ® 100 RP-8, 5
Pm).
Isocratic elution of naphthalene was obtained by a mobile phase consisting of
70% methanol and 30% water with 1% acetic acid. The flow rate of the mobile phase was
maintained at 1.2 mL/minute. By adjusting the ratio and flow rate of the mobile phase,
the production of three intermediates due to biodegradation of naphthalene could be
detected. The mobile phase with 80% methanol and 20% water could also separate the
naphthalene peak at 1 mL/minute, but it was not useful for separating the intermediates.
The retention time of naphthalene was approximately 2.7 minutes in an older HPLC
column (3.5 minutes with a new column), but it was observed to fluctuate with varying
room temperature or column condition.
Both methanol and water were vacuum filtered through a 0.45 pm-membrane
filter and preserved by adding 1% acetic acid. The solutions were then degassed by a
continuous helium purge (Ultra High Purity, Matheson gas Products). The UV-detector
was set at a wavelength of 254 nm. The data were processed and integrated by Nelson
Chromatography Software (PE Nelson Model 2600, rev. 5.10) using a Nelson 900 Series
interface.
About 1 mL sample for biofilm experiments was transferred to a 1.2 mL-vial for
HPLC autosampler. In case of suspended cultures with shake flasks, about 1.2 mL of a

28
sample was filled up to the top of each vial. Two different calibration curves were applied
for both cases, plotting 5 known standard naphthalene solutions for each curve, and
checked periodically. As an example, a plot is shown in Figure A-3 in Appendix A. The
standard solutions were prepared with pure methanol. Each sample was preserved with
approximately 20 !IL of 1:1 hydrochloric acid (HCl) to stop any further biological
activity. The volume injected by the autosampler was set at 8 1.1L, which was reduced
from 20 !IL to avoid pressure built up due to use of an on-line pre-filter kit on the HPLC
column (instead of using a separate filtering step to remove bacteria from the sample
suspension).
Initially, for pre-treatment of HPLC samples, about 1.2 mL of bacterial sample
was filtered through a 0.2 μm-membrane using a Swinney filter holder, which was
attached to a syringe. However, loss of naphthalene due to adsorption on the membrane
filter averaged about 36.5 % as shown in Table B-1 and Figure B-1 in Appendix B.
Therefore, an on-line prefilter kit with 0.5 p.m pore size (Alltech Associates, Inc.) was
used instead to protect the HPLC column and avoid a separate filtration step. The on-line
filter was continuously exposed to the mobile phase (70% methanol and 30% water with
1% acetic acid), which resulted in a much lower loss of naphthalene.
4.4.5 Observation of Live and Dead Cells by Fluorescence Microscopy
A Nikon epifluorescence microscope (Eclipse TE200) equipped with a 100W-mercury
lamp (Chiu Technical Corporation) was used with a Nikon B-2A filter set for fluorescein
isothiocyanate (FITC); 470±20 nm for exciter filter, 505 nm for dichroic mirror and 520
nm for barrier filter. The excitation/emission maxima of the dyes are about 480 nm/500
29
nm for the SYTO 9, and 490 nm/635 nm for the PI. Therefore, the fluorescence from
both live and dead bacteria can be viewed simultaneously with the FITC filter set. Two
objective lenses were used: 60x for suspended cultures and 100x for biofilm cultures.
Photomicrographs of bacterial images were collected with an image controller
(Optronics, DEI-750D CE Digital Output, Model S60675) and Image Pro 4.0 (software).
However, actual enumeration of bacterial samples was performed by visual counting with
10x eyepiece lens, using 3 cell counters (Hand Tally Counter, Fisher Scientific) for live
cells, dead cells, and number of focusing fields. Because the size of photographic image
is only about 20% of countable area (a square) in a focusing field, visual counting with
the eyepiece lens was a better choice, in which a square with known area (0.1 x 0.1 mm 2
on 100x objective, and 0.162 x 0.162 mm 2 on 60x objective) is marked with 100 small
grids.
4.5 Fluorescent Staining Techniques for Microscopic Counting of Cells
4.5.1 Screening Tests of LIVE/DEAD ® BacLight™ Bacterial Viability Kit
To examine the capability of LIVE/DEAD ® BacLight™ Bacterial Viability Kit
(LDBBVK) for distinguishing live and dead cells on a fluorescence microscope, the dual-
staining mixture of SYTO 9 and propidium iodide (PI) was pre-screened by adjusting the
ratio of both components volumes and concentration of dimethylsulfoxide (DMSO) in a
bacterial sample. Also, the incubation time in staining Pseudomonas putida was
observed.
When bacterial suspensions were tested with LDBBVK, three different methods
as shown in Table 4.3 were evaluated for enumerating cell density as well as

30
distinguishing both live and dead cells. The general method with a regular slide glass and
a coverslip showed the best result, making the staining technique more rapid, simpler and
more reliable than the others.
Table 4.3 Evaluation of staining methods for enumerating live and dead cells in bacterialsuspension. (Dual staining of SYTO 9 and propidium iodide)
Filtration withblack membrane
(13 mmin diameter)
Multi-wellslide glass(8 mm indiameter)
Regular slide glass+ cover slip
(22 x 22 mm2)Sample condition
after staining Dry or wet Dry Wet
Available samplevolume
Large(depending oncell density)
Small (2 — 6 µL) Small (4 !IL)
Reliability indistinguishing
live and dead cellsUncertain Uncertain Very good
Precision inmeasuring surface
areaof stained sample
Good Good Sufficient
Bacterial motionfor visualization Little No
Brownian motion(No problem onvisual counting)
Accumulation ofred probe
on living cell wallPossible Possible
No(within about
5 hours)Uniform distribution
of cellsGood Bad Sufficient
As an example of the staining method with a regular slide glass and a coverslip,
Figure 4.4 shows fluorescence photomirographs observed under the wet condition of
bacterial samples stained with the mixture of SYTO 9 and PI (0.2% DMSO); a) 100%
live cells, b) 50/50 of live and dead cells, c) 100% dead cells. This staining method was
highly reliable in distinguishing live and dead cells. On the other hand, the two methods

Figure 4.4 Epifluorescence photomicrographs of Pseudomonas putida stained (in wet condition) with the mixture of SYTO 9 andpropidium iodide under FITC optic filter. Wet condition of stained bacterial samples under microscopic observation resulted in more
reliable images for enumerating live and dead cells (60x objective lens, 2.8x relay lens).

Figure 4.5 Epifluorescence photomicrographs of Pseudomonas putida stained (in dry condition) with the mixture of SYTO 9 andpropidium iodide under FITC optic filter. Mounting oil was placed right after drying out stained samples on a multi-well slide glass atroom temperature. When stained samples were dried out, microscopic images were not reliable for distinguishing live and dead cells
(60x objective lens, 2.8x relay lens).

33
using dry stained samples were unreliable because of the accumulation of PI on live cell
wall showing partially green or orange (or red) fluorescence as illustrated in Figure 4.5.
The most important clue for optimizing the staining technique with LDBBVK
was to maintain wet (non-dried) condition - in a stained sample. It was necessary to avoid
keeping a stained sample sealed with a slide glass and a coverslip for more than about 1
hour. Also, it was preferable to keep the stained sample in a microcentrifuge tube. Right
before microscopic observation, the stained sample in the tube needs to be mixed by
vortex to make uniform cell distribution, and subsequently placed on a slide glass and
covered with a coverslip sealed with nail polish. The vortexing step may have an effect
on the removal of the PI accumulated on the surface of viable cells.
As mentioned by Lawerence et al. (1997), it was found that the red probe (PI) was
partially coated on a sample specimen with live cells showing orange or red fluorescence
on the FITC filter set. Based on experimental results and the reference, the reason was
inferred as follows: When the stained sample was kept for a long time (more than about
one hour) under a coverslip sealed with nail polish, the aqueous portion of the red probe,
which is presumably hydrophilic, was partially dried out. Consequently, it could be easily
coated on the surface of living cells due to the characteristic of the PI.
4.5.1.1 Staining Method by Vacuum Filtration with PCTE Black Membrane
A polycarbonate track-etched (PCTE) black membrane (13 mm in diameter and 0.22 urn
in pore size, Osmonics Inc.) for epifluorescence microscopy was used in conjunction with
a drain disk supporter (PreSep Mesh Spacer, 13 mm, Osmonics Inc.) for promoting
uniform distribution of bacteria on the filter surface. A Swinney filter holder (Millipore),

34
with the black membrane and the drain disk-supporter, was assembled with a disposable
3 mL syringe, which had no plunger.
After 1 mL of bacterial suspension was stained with 3 μL of the dye mixture
(0.3% DMSO) and then incubated at room temperature in the dark for about 15 minutes,
1 mL of phosphate buffered saline (PBS) was added into a syringe assembled with the
filter set. A proper volume (about 2 to 50 μL) of stained bacterial suspension was then
added to the PBS in the syringe, accompanied with vortexing for enhanced uniform
distribution of the stained bacteria on the black membrane. The reason that a small
amount of stained sample was diluted with the PBS solution was to wash out the coated
red probe (PI). The stained cells were filtered through the black membrane under low
vacuum. 2 μL of filter-sterilized water was placed on a slide glass, and then, only the
membrane without the drain disk-supporter was removed from the filter set and placed on
top of the water droplet. About 3 to 4 μL of BacLight mounting oil (provided with
LDBBVK) was added to the top of the filter. An oversized 22-mm square coverslip
(No.1, Fisher Scientific) was placed on the top of the mounting oil, and gentle pressure
was applied to spread the fluid over the filter. The coverslip was sealed with nail polish.
Finally, the sample was observed under a fluorescence microscope equipped with proper
filter sets.
Bacterial staining using vacuum filtration caused irregular results under a
fluorescence microscope: sometimes showing clear bacterial images with wet condition
of stained samples, and sometimes showing false images from dried specimen due to
excess vacuum suction of stained liquid.

35
4.5.1.2 Staining Method Using Multi-Well Slide Glass
Instead of using membrane filters, multi-well slide glasses (25 x 75 mm), with known
surface area of stained liquid sample, were applied as an alternative method. Multi-well
slide glasses with 8 mm diameter and 8 wells (HTC®, Black; Cel-Line/Erie-Scientific
Co.) were coated with a solution of 0.1% gelatin and 0.01% KCr(SO4)2, dipping each
glass into the solution for a second and drying out at room temperature. The coated
glasses were stored in the refrigerator.
100 pit of original suspended culture was stained with 0.2 μL of the 1:1 dye
mixture (0.2% DMSO). 2 to 6 μL of the stained sample were placed on a well of a multi-
well slide glass and then spread uniformly on the well using a Pipetman tip. The stained
sample was incubated and dried out simultaneously at room temperature for about 5 to 10
minutes. After the drying step, BacLight mounting oil was placed on the dried sample
and then covered with a coverslip (25 x 50 mm, No.1). This sample was observed under a
fluorescence microscope.
4.5.1.3 Staining Method Using Regular Slide Glass
100 μL of original suspended culture were mixed with 0.2 μL of the 1:l dye mixture
(0.2% DMSO) without rinsing steps, and incubated at room temperature in the dark for
about 15 minutes. Right before microscopic observation, the stained sample in a
microcentrifuge tube was mixed again by vortex. Exactly 4 pit of the sample was
subsequently put on a regular slide glass (3 x 1 inches, 1 mm in thickness, Fisher
Scientific) and covered with a 22 x 22 mm-coverslip (Fisher Scientific, No.1) sealed with
nail polish. The 4 pt-sample was uniformly spread out in the size of the coverslip.

36
If the stained sample is not immediately used for microscopic observation, it is
necessary to avoid keeping the stained sample in a slide glass sealed with a coverslip for
more than about one hour. This causes drying out of the sample and accumulation of the
red probe (PI) on live cell wall. Regardless of the incubation time instructed by the
manufacturer, the stained bacterial suspension kept in a microcentrifuge tube was still
useful within about 4-5 hours, showing intensive green or red fluorescence on either live
or dead cells under the microscope equipped with FITC filter set.
4.5.1.4 Optimization of Staining Method with Live and Dead Cells
The dual-staining mixture was tested with two types of samples: (1) bacterial suspension
with live cells only (cultured in nutrient broth); and (2) dead bacterial suspension (killed
by 70% isopropyl alcohol, according to the instructions with the LDBBVK). These two
samples were prepared from the same original suspension (Pseudomonas putida) grown
in a shake flask at room temperature for one or two days.
The two components of the dye mixture were tested with different volumetric
ratios of SYTO 9 and PI (4:1, 3:1, 2:1, 3:2, 1:1, 2:3, 1:2, 1:3, 1:4 and l:10). The optimal
result was obtained with a 1:1 mixture of SYTO 9 and PI, as instructed in LDBBVK.
Also, the concentration of DMSO was tested by staining living cells with different
amount of the 1:1 dye mixture (1%, 0.1%, 0.2 % and 0.3%). The result with 1% DMSO
showed red fluorescence which gave a false indication of dead cells. The results with
0.1%, 0.2% and 0.3% showed clear green fluorescence images in staining live bacteria.
As a result, the 0.2% DMSO was applied for all subsequent testing of bacterial
suspensions.

37
4.5.2 Staining Methods for Biofilms on Glass Supports
Both direct and indirect staining methods were pre-tested for enumeration of biofilms on
glass supports, distinguishing live and dead bacteria. Based on the results of the test, it
was recognized that each case had its drawbacks in performing bacterial enumeration
with the fluorescent staining technique.
The direct staining method (see below) was not effective in distinguishing live
from dead cells, since red fluorescence was observed irregularly on active (live) biofilm
due to accumulation of the red probe on live cell membrane. In order to overcome this
problem, a longer incubation time (1 to 3 hours) was used with 0.3% DMSO. However,
the longer incubation time under a coverslip caused the stained active biofilms to dry out
and show the red fluorescence irregularly. Hence, the direct staining method usually
underestimated the number of viable cells. However, this method was useful to
enumerate total (live and dead) cells on biofilm monolayers (Microscopic observation
indicated that the biofilm were generally laid down as a monolayer for growth periods of
2 to 3 days).
For the indirect staining method (see below), it was expected that there would be
loss or damage of cells when they were detached from a BF-support by a scraper. The
indirect staining method was not useful for biofilm monolayers because of the technical
problem in detaching cells from a glass support into water. There was difficulty
establishing a consistent technique for lifting immobilized cells.
Due to the difficulties of both staining methods, a combined method was used
with direct staining for total cell count on the BF-supports, and general staining of
proximate suspended cells for the ratio of live to dead cells.

38
4.5.2.1 Direct Staining
For direct staining of biofilms, 3 μL of the stock dual-staining dye mixture was diluted to
1 mL of autoclaved-DI water (0.3% DMSO) using a 1.5 mL-microcentrifuge tube. Before
starting biofilm cultures, about 10 tubes were prepared and stored in the freezer. It was
mixed by vortex prior to use.
After taking a glass support with tripartite biofilms (as mentioned in Section
4.1.4), it was first rinsed by immersing it into autoclaved DI water for about 15 seconds.
Then, about 50 IAL of the staining solution (0.3% DMSO with autoclaved DI water) was
gently added to the center of each part of the BF-support, repeated 3 to 4 times, and
incubated at room temperature in the dark for about 15 to 30 minutes. A cover glass (22 x
22 or 25 x 25 mm) was placed on the stained biofilm. To reduce Brownian motion of
stained cells under the fluorescence microscope, the excess staining solution under the
coverslip was removed by touching (or gently pressing) cotton swabs around (or over)
the edge of the coverslip. The coverslip was sealed with nail polish. Finally, non-stained
areas of the BF-support were cleaned with 70% isopropyl alcohol using a small piece of
paper towel and a tong.
4.5.2.2 Indirect Staining
A BF-support taken from a column reactor was gently rinsed with DI water to remove
any unattached cells. Biofilm attached to the surface was then harvested using a cell
scraper (Fisher Scientific), and mixed with about 100 mL of autoclaved DI water in a 250
mL beaker. Once samples were prepared, the procedure followed that for cell
enumeration with bacterial suspension as described in Section 4.5.1.3.

39
4.6 Enumeration of Bacterial Samples by Microscopic Observation
4.6.1 Suspended Cultures in Shake Flasks
Using 4 of stained sample prepared as instructed in Section 4.5.1.3, the number of
bacteria under a 22 x 22 mm-coverslip (484 mm 2) was estimated by counting cell number
visually from 30 to 60 objective fields (counting about 100 to 700 cells) under the
microscope. The enumeration step was performed by counting live and dead cells only in
a square outlined on the objective field. The area of the square was equal to 0.162 x 0.162
mm2 (0.026244 mm 2) on 60x objective. The objective field was moved in a zigzag
pattern, beginning in the upper left hand corner of the cover slip and proceeding across
back and down. 30 to 60 objective fields covered about 0.16% to 0.32% of the cover slip
area.
The average cell number of live or dead cells on the square of the objective field
was then converted to cell density (cells/mL) in bacterial suspension using the following
equation.
4.6.2 Biofilm Cultures in a Continuous Flow System with Column Reactors
In culturing biofilms by the continuous flow reactor, an alternative method was applied
for enumerating cells immobilized on glass support, as well as distinguishing live and
dead cells. The direct staining method with diluted mixture of SYTO 9 and PI was not
effective in distinguishing live from dead cells (although it could be used to count total
cell number).

40
To count total cells on BF-supports, direct staining was applied as described in
Section 4.5.3.1 using an objective lens with 100x magnification. It was desirable to use a
high magnification lens because sometimes it was difficult to distinguish cells from
debris or salts on stained samples. The number of total cells was counted from at least 30
randomly chosen objective fields. However, the ratio of live to dead cells was presumed
to be the same as that of the suspended cells that were in proximity to the glass supports
in the continuous flow system.
When cell density in the square with 100 small grids on an objective field was
increased, the number of small grids used for counting cells was gradually reduced from
100 to 20, counting about 250 to 1800 in total cell number. For cell density of biofilms,
the number of total cells per unit surface area of BF-support was calculated using
following equation. The area of the square was equal to 0.1 x 0.1 mm2 (0.0001 cm2) on
100x objective.
4.7 Experimental Procedure
4.7.1 Suspended Cultures in Shake Flasks
Suspended cultures with 4 different sets of naphthalene concentration were initially
prepared as described in Section 4.3.1. At every sampling time, 5 mL of suspension from
each flask were transferred to a test tube for measuring OD. 100 lit of the OD sample
were immediately stained with 0.2 pt of the dye mixture, followed by the enumerating
procedure of suspended cells as described in Section 4.5.1.3. At the same time, about 1.2
mL of the OD sample were transferred to a vial and analyzed quantitatively by HPLC as

41
mentioned in Section 4.4.4. Measurement of total cell proteins was conducted by the
BCA protein assay using about 1.5 mL of the OD sample, as described in Section 4.4.3.
All materials and apparatus were already sterilized by autoclaving or filtering with 0.22
pore size prior to use.
4.7.2 Biofilm Cultures on Glass Supports in Continuous Flow System
4.7.2.1 Culture of Seed Biofilms
13 glass supports for biofilm, prepared as described in Section 4.l.4, were uniformly
placed into the seed biofilm container with the round glass-holder as shown in Figure 1B.
The glass holder was useful to have uniform distribution of biofilms on all seed BF-
supports. Also, a magnetic bar and a glass tube with a fritted end for aeration were placed
into the container. This container was covered with aluminum foil and then sterilized by
autoclaving.
About 6.4-L of autoclaved DI water was poured into the autoclaved container,
followed by adding 90 mL of medium A, 210 mL of the medium B, and 9 mL of the trace
element solution. Finally, about 300 mL of bacterial suspension, pre-acclimated with
naphthalene, were added to the container, mixed by the magnetic stirrer, and aerated at
about 40 mL/minute. This bacterial suspension was cultured for about 3-4 days to
develop initial seed biofilms for the column reactors. To increase the reliability for
enumeration of the initial biofilms, 3 of the seed BF-supports were stained with the
diluted dye mixture (0.3% DMSO). Before staining with the dye, they were carefully
immersed into autoclaved DI water for about 15 seconds to remove any unattached cells.

42
Using a tong and a pair of forceps sterilized by a flame burner, all glass supports with
seed biofilms were transferred to 2 column reactors in the continuous flow system.
4.7.2.2 Culture of Biofilms in Continuous Flow System
Before transferring the seed biofilms from the original container, the medium in the
reactor system was recirculated at 1 mL/minute for 2-3 days in order to reach
equilibrium in naphthalene concentration, as shown in Figure 4.2. After confirming
equilibrium in the system by measuring naphthalene concentration periodically, the
recirculating lines were disconnected and connected to a drain bottle for continuous flow
of the medium.
Because of refraction of the liquid medium, and close spacing of the BF-supports,
it was difficult to install them properly into slots on the inlet end plate of each column.
Thus, it was necessary to take out all medium in each column right before transferring the
BF-supports into the column. The medium in each column reactor was separately
transferred into 2 autoclaved 500 mL beakers. After that, each seed BF-support was
rinsed by immersing it carefully into autoclaved DI water for about 15 seconds and then
immediately transferred into both column reactors. After installing 5 BF-supports, the
medium kept in the 500 mL beaker was immediately re-filled into each column using a
glass funnel with long neck. A stainless steel bracket was fitted onto the top of the 5 glass
supports, and then each outlet end plate was tightly re-connected to the top of each
column.

43
To observe the adsorption of naphthalene on the BF-supports at the beginning of a
run, it was necessary to measure naphthalene concentration as soon as possible at the
inlet and outlet of both column reactors.
During this experiment, column-Y was specially used to take a BF-support at
every sampling time, measuring concentration of naphthalene at both inlet and outlet,
while column-X was used to observe viability of suspended cells in the column as well as
naphthalene concentration of suspension. After taking out all biofilm supports from
column-Y, all 5 biofilm supports in column-X were taken out at the same time as the last
samples for biofilm cultures in the continuous flow system.
Due to the adsorption of naphthalene on a 3 mL-syringe, HPLC sample was taken
by dropping liquid medium into a vial through a 3-way stopcock on both inlet and outlet
of each column. Secondly, bacterial suspension (100 1.1L) from the sampling ports-A, C, E
on column-X, and the outlet of column-Y, were immediately stained with 0.2 μL of the
1:1 dye mixture. As the third step, after the BF-support taken from column-Y was rinsed
with water as mentioned above, it was immediately stained with diluted dye mixture
(0.3% DMSO). After finishing sampling, the stainless bracket was carefully re-placed on
the top of the remaining BF-supports using a tong and a pair of forceps, and then the top
end plate was re-connected to the column. BF-supports pre-numbered on column-Y were
taken out for analysis after a prescribed time.
All apparatus and materials used in this experiment were sterilized prior to use by
autoclaving, or using 70% isopropyl alcohol or 3% hydrogen peroxide for plastic or
rubber materials such as sampling ports and o-rings on the column end plates.

CHAPTER 5
RESULTS AND DISCUSSION
5.1 Suspended Cultures of Pseudomonas putida in Shake Flasks
Two sets of shake flask experiments were conducted at a constant temperature of 25 °C
(±1 °C) and 200rpm, each using Pseudomonas putida (ATCC 17484). In each set, there
were four different values of the initial naphthalene concentration, ranging from about 3
to 16 mg/L (the solubility of naphthalene in water at room temperature is about 30 mg/L).
For each initial naphthalene concentration, four parameters were measured over time
(experimental set #1 lasted 54 hours, and set #2 lasted a total of 35 hours): naphthalene
concentration, optical density (OD), total cell protein (TCP), total cell number (TCN),
and living cell number (LCN). The last four of these measurements are all related to
biomass. All data (Tables and Figures) are presented in Appendix D, and will be
discussed below in detail. TCP data for set#2 were discarded because for unknown
reasons measured values of most samples were below those of the distilled water blank.
Decreases in naphthalene concentration for the sterile controls are primarily due to
volatilization.
5.1.1 Kinetic Rate Constants for Biodegradation of Naphthalene
The rate of biomass growth is given by the following equation [Sundstrom and Klei,
(1979)]:
where, B = concentration of biomass at time tt = time
44

45
dB/dt = biomass growth rate [concentration/time]= specific growth rate [time-1 ]
Since there was no evidence of naphthalene toxicity up to a concentration of 16 mg/L, the
Monod equation was used to describe the specific growth rate in this range:
where, = maximum specific growth rate [time -1 ]S = concentration of limiting substrate [mg/L]
Ks = half-velocity constant [mg/L]
Substituting equation 5-2 into equation 5-1, bacterial growth rate is:
However, only a fraction of the substrate is converted to cell mass. Defining the yield
coefficient (Y) as mg/L of biomass produced per mg/L of substrate degraded:
And the decrease in naphthalene concentration is given as:
Substituting equation 5-2 for the specific growth rate (p):
where, r, = rate of naphthalene degradation

46
The key issue that this dissertation focused on is the determination of biomass
concentration (B).
During the exponential growth phase of Pseudomonas putida in shake flasks, the
specific growth rate was determined by preparing plots of Ln(biomass) versus time and
taking the initial slope. Original data are given in Appendix E, and the results are
summarized in Table 5.1, and Figures 5.1 to 5.4.
Kinetic rate constants (μm and Ks) for the Monod equation were obtained using
SigmaPlot® 2.0 (Jandal Scientific Software), which employs a Marquardt-Levenberg
algorithm to perform a non-linear regression of the specific growth rate vs. initial
naphthalene concentration data. The curves shown in Figures 5.1 to 5.4 are the regressed
curves.
Table 5.1 Regression of specific growth rates to obtain kinetic rate constants for Monod equation.(experimental data sets 1 and 2 combined)
Initialconcentration
(mg/L)
OD LCN TCPExperiments
(If')Regression
(h -1 )Experiments Regression
(h -1 ) (WI)Experiments
(11 1 )Regression
(h -1 )
3.07 0.034 0.046 0.071 0.045 0.093 0.0906.23 0.097 0.084 0.043 0.0787.21 0.068 0.094 0.111 0.087 0.150 0.1459.54 0.130 0.116 0.089 0.10411.49 0.115 0.132 0.140 0.115 0.155 0.17312.60 0.179 0.141 0.095 0.12115.16 0.169 0.158 0.120 0.13416.19 0.137 0.165 0.162 0.138 0.203 0.192

Initial concentration of naphthalene (mg/L)
Figure 5.1 The best fit of specific growth rates in the originalmeasurements of OD for determination of μm and K s (Experiments-
47
Figure 5.2 The best fit of specific growth rates in the originalmeasurements of LCN for determination of p in and K$ (Experiments-
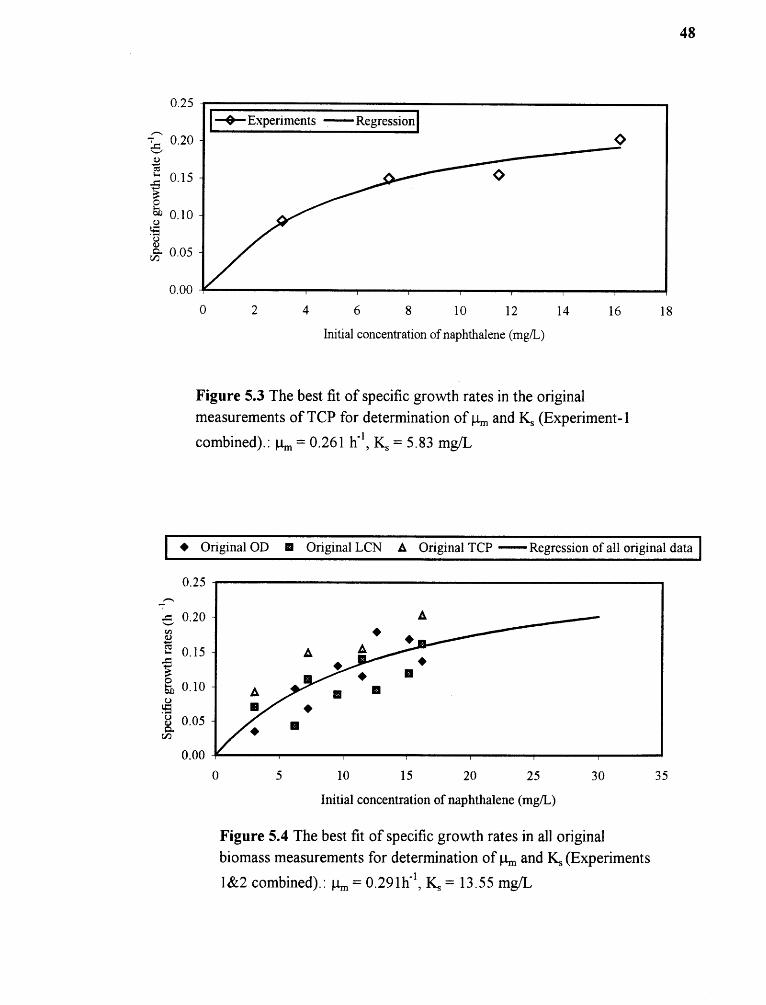
Figure 5.3 The best fit of specific growth rates in the originalmeasurements of TCP for determination of p m and Ks (Experiment-1
48
Figure 5.4 The best fit of specific growth rates in all originalbiomass measurements for determination of 1m and Ks (Experiments

49
5.2 Yield Coefficient (Y)
Pseudomonas putida (ATCC 17484) is a very effective naphthalene degrader. As a result,
there were at most two measurements of naphthalene concentration in each run prior to
its complete disappearance after 4 to 8 hours. Consequently, the following procedure was
adopted.
First, all biomass data were converted to mg/L dry biomass using appropriate
conversion factors. A conversion factor (Fop = 373 mg/L of dry biomass per unit OD)
was obtained by preparing a plot of dry biomass versus OD as shown in Figure A-1 in
Appendix A. Conversion factors (f) for total cell number (TCN), living cell number
(LCN) and total cell protein (TCP) to optical density were determined by plotting OD
versus TCN, LCN and TCP as shown in Figures F-l through F-7 in Appendix F. All
measurements were converted to dry biomass using the factors in Table 5.2.
Table 5.2 Conversion of OD, TCN, LCN and TCP to dry biomass (mg/L) forPseudomonas militia with naphthalene in shake flacks

50
Then, the yield coefficient for each experiment was determined by approximating
equation 5-4 as — ΔB/ΔS , as shown in Table 5.3. This resulted in an average Y of 0.20
mg/L dry biomass produced per mg/L naphthalene degraded.
Table 5.3 Determination of yield coefficient using initial slopes
Another method for determining Y was used which involved averaging the four to
five biomass measurements at or after 13 hours of run time. This was assumed to be the
final biomass concentration. Since the final naphthalene concentration was zero in all
cases: Y = (final biomass - initial biomass)/(initial naphthalene), as shown in Table 5.4.
This resulted in an average yield coefficient of 0.96.

Table 5.4. Yield coefficient determined by averaging the final biomass concentration.(mg/L biomass produced per mg/L naphthalene degraded)
51
5.3 Prediction of Naphthalene Loss and Biomass Growth in Suspended Cultures
Once the Monod kinetic parameters (p.m and Ks) have been obtained, a comparison can be
made between experimental data and mathematical predictions of the naphthalene and
biomass profiles. The decrease in naphthalene concentration (S) and the growth of
biomass (B) are predicted by the following algorithm:
For constant substrate, equation 5-3 can be integrated, resulting in:
Equation 5-4 can be approximated as:

52
Equations 5-7 and 5-9 were then used in a stepwise algorithm as presented in Table 5.5.
Table 5.5 Prediction method for naphthalene and biomass concentration in suspendedcultures.
Two different yield coefficients were applied (Y=0.20 and Y=0.96), as discussed in
Section 5.2. Typical results are shown in Figures 5.5 to 5.9. These results were checked
using a fourth order Runge-Kutta method, which solved the simultaneous differential
equations 5-3 and 5-6 (MATLAB ® Version 5.3.1). Predicted values of naphthalene and
biomass concentrations were indistinguishable within the experimental error using either
method.

Figure 5.5 Model predicted profiles for naphthalene and OD (Exp-1-c).
53
Figure 5.6 Model predicted profiles for naphthalene and LCN (Exp-1-c).
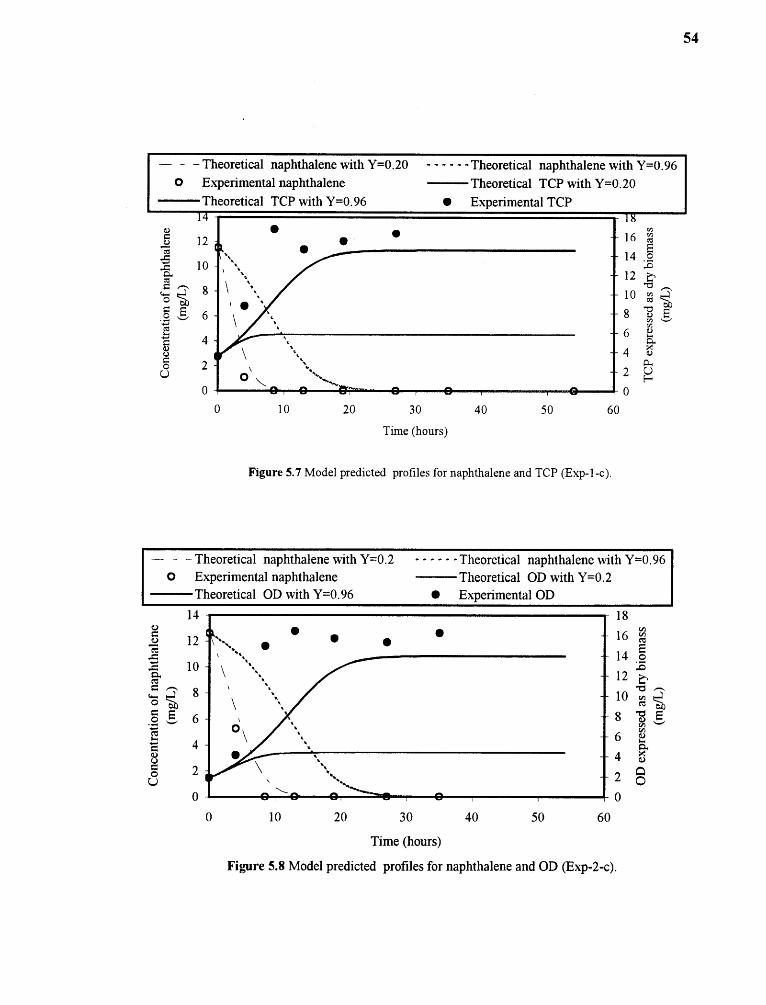
54
Figure 5.7 Model predicted profiles for naphthalene and TCP (Exp-l-c).
Figure 5.8 Model predicted profiles for naphthalene and OD (Exp-2-c).

55
Figure 5.9 Model predicted profiles for naphthalene and LCN (Exp-2-c).
Results were also predicted using the specific values of 1.1„„ K s, and Y for each type of
biomass measurement (OD, LCN, TCP) rather than average values. Again, they were
indistinguishable from those given above.
The problem which these figures illustrate is a disjuncture between the
disappearance of naphthalene and biomass growth. After naphthalene disappears,
biomass continues to grow, most likely as a result of the formation and disappearance of
intermediate products (see Section 5.5 below). Adsorption and subsequent release of
naphthalene from surfaces in the flasks may also play an important role. Such a lag
cannot be handled by the conventional Monod model. One possible remedy is to add a
lag time (T) to the biomass equation (5-7):
If a lag time of about 1 hour is assumed, the corresponding predictions are shown in

56
Figures 5.10 to 5.14. Agreement is much improved when Y reflects the total change in
biomass divided by the total change in naphthalene concentration (i.e. Y=0.96).
Note that the specific methodology used to characterize biomass (OD, LCN, or
TCP) is less important than the need to define a lag time, which in turn depends on the
specific biochemical pathways and their detailed kinetics.
Figure 5.10 Model predicted profiles for naphthalene and OD,with 1 hour lag time (Exp-1-c).
Figure 5.11 Model predicted profiles for naphthalene and LCN,with 1 hour lag time (Exp-1-c).

57
Figure 5.12 Model predicted profiles for naphthalene and TCP,with 1 hour lag time (Exp-1 -c).
Figure 5.13 Model predicted profiles for naphthalene and OD,with 1 hour lag time (Exp-2-c).
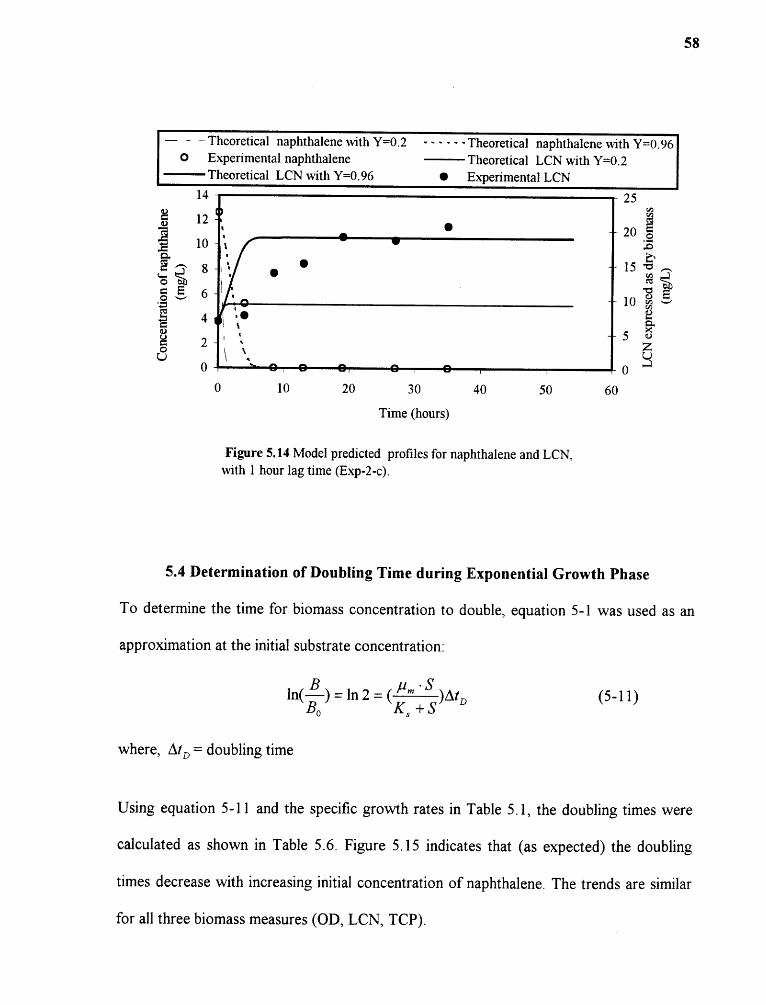
58
Figure 5.14 Model predicted profiles for naphthalene and LCN,with 1 hour lag time (Exp-2-c).
5.4 Determination of Doubling Time during Exponential Growth Phase
To determine the time for biomass concentration to double, equation 5-1 was used as an
approximation at the initial substrate concentration:
Using equation 5-11 and the specific growth rates in Table 5.1, the doubling times were
calculated as shown in Table 5.6. Figure 5.15 indicates that (as expected) the doubling
times decrease with increasing initial concentration of naphthalene. The trends are similar
for all three biomass measures (OD, LCN, TCP).

Table 5.6 Doubling times.
59
Figure 5.15 Doubling time of suspended cultures ofPseudomonas putida in shake flasks with naphthalene.

60
5.5 Intermediate Products
As shown in Figures G-1 through G-8 in Appendix G, three intermediate peaks were
observed during HPLC analysis. In general, the peak corresponding to the shortest
retention time remained in the samples even after 50 hours, while the other two peaks
disappeared presumably due to further biodegradation.
5.6 Viability of Pseudomonas putida Suspension in Shake Flask Test
Numbers of living and dead cells determined by fluorescence microscopy are given in
Appendix D. The percentage of live cells ranged from about 93% to 99% as shown in
Figures 5.16 and 5.17. Viability in culture controls without naphthalene decreased after
one day to about 90 %.
Figure 5.16 Viability of Pseudomonas putida (Experiment-1).
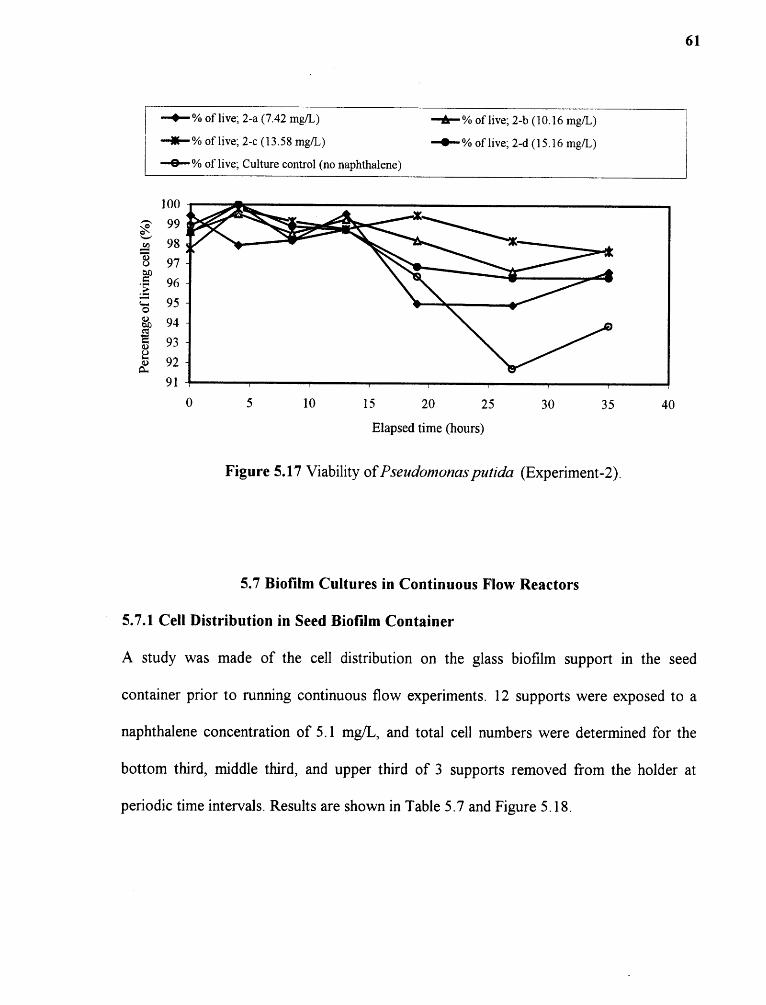
61
Figure 5.17 Viability of Pseudomonas putida (Experiment-2).
5.7 Biofilm Cultures in Continuous Flow Reactors
5.7.1 Cell Distribution in Seed Biofilm Container
A study was made of the cell distribution on the glass biofilm support in the seed
container prior to running continuous flow experiments. 12 supports were exposed to a
naphthalene concentration of 5.1 mg/L, and total cell numbers were determined for the
bottom third, middle third, and upper third of 3 supports removed from the holder at
periodic time intervals. Results are shown in Table 5.7 and Figure 5.18.

Figure 5.18 Cell distribution of initial seed biofilm on glasssupports with 5.1 mg/L of naphthalene (each value is an average of3 glass supports)
Table 5.7 Cell distribution (total cells/cm2) on glass supports (x104).
62

63
5.7.2 Suspended Cells in Seed Biofilm Container
Suspended cells were evident by visual observation in the seed biofilm container. For the
cell distribution experiments described above in Section 5.7.1, the suspended cell
concentrations are shown in Table 5.8 and Figure 5.19.
Table 5.8 Suspended cells in seed biofilm container.
Time (hours) Suspended cells/mL (x10 7)
17.3 1.17
42.7 1.13
88.7 1.90
134 2.45
Figure 5.19 Growth comparison of immobilized cells/cm 2 andsuspended cells/mL in a seed biofilm container with 5.1 mg/Lof naphthalene initially.

64
From microscopic observation, it was found that the cell size became gradually
smaller in both suspended and biofilm cultures due to the lack of carbon source after
about 24 hours. Bacterial images during cell division were rarely viewed under the
microscope. As shown in Table 5.9, the viability of suspended cells persisted even after
more than 4 days in the absence of a carbon source (naphthalene).
Table 5.9 Viability of suspended cells of Pseudomonas putida in the seed biofilmcontainer.
Time
(hours)
cells/mL Viability
(%)Live cells Dead cells Total cells
17.3 1.13E+07 4.03E+05 1.17E+07 97
42.7 1.13E+07 0.00E+00 1.13E+07 100
88.7 1.90E+07 0.00E+00 1.90E+07 100
134 2.45E+07 0.00E+00 2.45E+07 100
(5.1 mg/L of naphthalene initially in 9 L media; aerated at about 40 mL/min)
5.7.3 Biofilm Cultures on Glass Supports in Continuous Flow System
After initial seed biofilms were transferred into two column reactors in the continuous
flow system as mentioned in Section 4.7.2, they were cultured on glass supports for 51.3
hours. Figure 5.20, Tables H-1 and H-2 in Appendix H show experimental data for
growth of biofilms on glass supports, and difference of naphthalene concentration
between the inlet and outlet for each column reactor (X and Y).
Initial biomass data were obtained from the seed biofilm container by averaging 3
supports as described in Section 5.7.1. Intermediate biomass measurements were

65
obtained by removing glass supports sequentially from column Y. Final biomass data
were confirmed by averaging all supports (5) remaining in column-X.
After a glass support was taken out of column Y for a biofilm sample, about 19
mL of media took its place, which increased the residence time from 7.4 hours at the
beginning of the run to 8.9 hours at the end. As shown in Figure 5.20, the growth pattern
of total live cells in column-Y was similar to that in column-X. However, the naphthalene
concentration difference between inlet and outlet in column-Y was greater by about 1 to 2
mg/L than in column-X, probably a result of the increased retention time in column-Y.
To distinguish live and dead cells, both direct and indirect staining methods were
applied, as described in Section 4.5.2. Results for suspended and fixed cells are shown in
Figure 5.21 and Appendix H. Approximately 90 to 100% of suspended cells were viable,
and these data were applied to predict % live cells on the biofilm.
Both fixed and suspended cells are present in the continuous biofilm reactor. As a
result, the observed decrease in naphthalene concentration is a consequence of the
presence of both types of cells.

Figure 5.20 Biodegradation of naphthalene and growth of biofilmattached on glass supports in a continuous flow system.(media flow rate = 1 mL/min., residence time with 5 glass supports =7.3 hours)
66

67
Figure 5.21 Viability of cells in column-X.
5.7.4 Determination of Specific Growth Rates in Continuous Flow System
In the continuous flow biofilm reactors, the steady-state material balance equation is as
follows:
assuming a well-mixed reactor:

68
Substituting for – dS/dt and rearranging equation 5-12;
where, 6 = feed residence time (—Q = 7.35 hours)V
= specific growth rate in the continuous flow reactor (11 1 )B = total dry biomass (live cells in both biofilm and suspended growth on
column-X; mg/L)
Total live cells (LCNT, live cells/mL) in column-X are obtained by:
live cells in biofilm (cells/cm2)total surface area of 5 glass supports in column-X (930.5 cm 2)live cells in suspension of column-X (cells/mL)
The total live cells are then converted to dry biomass as presented in Table 5.2, using the
overall factor (FLCN) for experiments 1 and 2 combined. The average yield coefficient (Y
= 0.96) obtained from Table 5.4 was used in equation 5-14, and the specific growth rates
for the continuous flow reactor were determined as shown in Table 5.10.
An approximate calculation can be made of the biofilm specific growth rate as
follows:
specific growth rate for the suspended cells onlybiomass for suspended cells onlywhat the outlet concentration of naphthalene would have beenwithout the biofilm0.29111 1
13.55 mg/L

Table 5.10 Biomass growth and naphthalene degradation in column-X of the continuous flow system.
Concentration of naphthalene Total
Time (mg/L) Live cells/cm2 Live cells/mL in dry
(hours) Inlet Outlet Difference in biofilm suspended growth biomass (B)
(So) (S) (So-S) (BO (Bs) (mg/L)
0.3 19.63 15.45 4.17 2.16E+05 1.34E+05 2.01
11.3 19.23 16.90 2.34 4.39E+05 9.41E+05 2.41
18.0 19.22 13.87 5.36 3.42E+05 4.84E+06 3.55
26.7 20.04 15.02 5.02 5.43E+05 6.05E+06 4.06
33.0 19.45 13.96 5.50 5.13E+05 5.92E+06 4.00
39.5 20.77 13.39 7.38 8.70E+05 3.76E+06 3.56
51.3 20.52 15.37 5.15 1.32E+06 3.50E+06 3.77

70
where, μf= specific growth rate for the biofilm onlyBf = biomass in the biofilm only
For Y=0.96, and using average steady-state values for S o and S (after 18 hours), μf=0.25 11 1
The overall specific growth rate is:
Thus, for Y = 0.96, the biofilm specific growth rate appears to be somewhat greater than
that of the suspended culture (for the same organism).
negative. Therefore, as with prediction of the naphthalene and biomass profiles
(incorporating a lag time), the overall yield coefficient (Y = 0.96) produces more
consistent results.
5.7.5 Formation of Biofilms on Glass Supports in Continuous Flow System
Over a two-day period, biofilms developed from separate cells attached to the glass
support, to large groups of cells approximating a continuous biofilm of monolayer
thickness. Fluorescence photomicrographs in Figures 5.22 and 5.23 show general patterns
of biofilm development according to elapsed time.

71
After 51 hours, it became difficult to count cells because of their high density.
Thus, the last samples were usually roughly counted by observing 30 fields using only
20% (0.002 mm2) of the square on the objective field (100x).
Figure 5.24 shows various patterns of cell growth on the glass supports. In
photomicrographs (A) and (B), cells were dividing in curved and ring patterns at the
beginning of biofilm growth. In (C) and (D), cells began growing like chains, while (E)
and (F) show more common modes of cell accumulation on the glass supports.

72
Figure 5.22 General patterns of biofilm development by culturing Pseudomonas putidaon glass supports in a continuous flow reactor (low cell density). (All photomicrographswere obtained from different samples; observed by 100x objective.)

73
Figure 5.23 General patterns of biofilm development by culturing Pseudomonas putidaon glass supports in a continuous flow reactor (higher cell density). (Allphotomicrographs were obtained from different samples; observed by 100x objective;Many live cells show orange fluorescence due to the difficulty of direct staining method.)

SHEW
MIN

74
Figure .L ,=1 v anous patterns in Not= growth on grass supports in a continuous nowsystem. (observed by 100x objective; Some live cells show orange fluorescence due tothe difficulty of direct staining method.)
CHAPTER 6
CONCLUSIONS
6.1 Fluorescent Staining Technique
A satisfactory methodology was developed to distinguish live cells (with intact
membranes) from dead cells using Pseudomonas putida (ATCC 17484). The
methodology was a modification of the techniques originally developed by Molecular
Probes, Inc. Use of a slide glass and cover slip under wet conditions using 4 Ill of sample
volume considerably improved the ability of the method to enumerate cells and
distinguish between green fluorescence (living cells) and red fluorescence (dead or
damaged cells). By avoiding dry conditions, precipitated salts from the nutrient medium
could be avoided, as well as pre-washing steps. Thus, it was possible to protect fresh
bacterial samples from damage by the pre-treatment steps, and the staining method was
simpler and more rapid
6.2 Comparison of Biomass Measures
Results for biomass measures (OD, LCN, and TCP), and their impact on calculated
values of the Monod expression, were similar. Biomass, by whatever the measure,
continued to increase significantly after the complete disappearance of naphthalene. This
resulted in uncertainty regarding determination of the yield coefficient, and its subsequent
impact on calculated values of substrate and biomass concentrations. This problem was
reconciled by inclusion of a lag time into the Monod expression. The lag time between
biomass growth and naphthalene disappearance could be a result of two factors: (1)
adsorption and subsequent release of naphthalene from reactor surfaces, and (2)
75
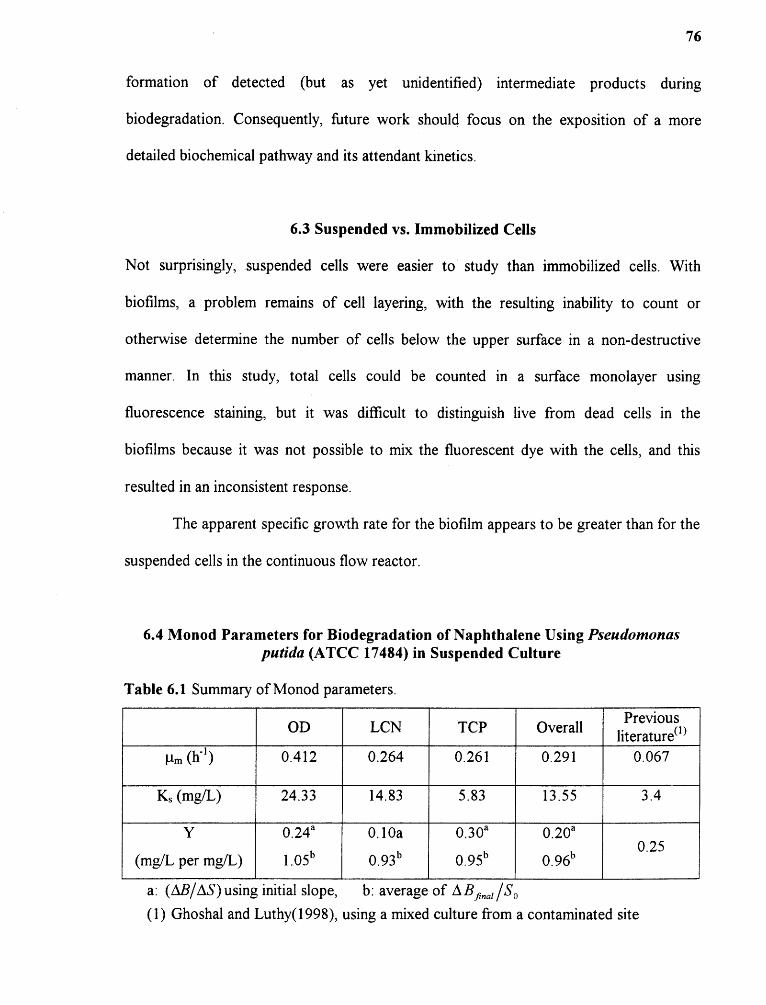
76
formation of detected (but as yet unidentified) intermediate products during
biodegradation. Consequently, future work should focus on the exposition of a more
detailed biochemical pathway and its attendant kinetics.
6.3 Suspended vs. Immobilized Cells
Not surprisingly, suspended cells were easier to study than immobilized cells. With
biofilms, a problem remains of cell layering, with the resulting inability to count or
otherwise determine the number of cells below the upper surface in a non-destructive
manner. In this study, total cells could be counted in a surface monolayer using
fluorescence staining, but it was difficult to distinguish live from dead cells in the
biofilms because it was not possible to mix the fluorescent dye with the cells, and this
resulted in an inconsistent response.
The apparent specific growth rate for the biofilm appears to be greater than for the
suspended cells in the continuous flow reactor.
6.4 Monod Parameters for Biodegradation of Naphthalene Using Pseudomonasputida (ATCC 17484) in Suspended Culture
Table 6.1 Summary of Monod parameters.
OD LCN TCP OverallPrevious
literature ( 1)
II. (11 1 ) 0.412 0.264 0.261 0.291 0.067
Ks (mg/L) 24.33 14.83 5.83 13.55 3.4
Y
(mg/L per mg/L)
0.24a
1.05b
0.10a
0.93 b
0.30a
0.95 b
0.20a
0.96b0.25
a: (ΔB/ΔS)using initial slope, b: average of ΔBfinal/S0
(1) Ghoshal and Luthy(1998), using a mixed culture from a contaminated site

APPENDIX A
CALIBRATION CURVES
77

Figure A-1 Calibration curve for determining biomass concentration fromoptical density by culturing Pseudomonas putida with naphthalene.
78
Figure A-2 Standard calibration curve of total protein with bovineserum albumin. (Enhanced protocol of BCA protein assay;incubation at about 75 ° C for 30 min)

Figure A-3 Calibration curve for naphthalene concentrationmeasurements.
79

APPENDIX B
ADSORPTION OF NAPHTHALENE ON FILTRATION FOR PRE-TREATMENT OF HPLC SAMPLES
80

81
Table B-1 Adsorption of naphthalene on a membrane with a Swinney filter holder forpre-treatment of HPLC samples. (13 mm in diameter and 0.22 μm in pore size; samplevolume: about 1.2 mL)
Concentration of naphthalene (mg/L) Loss of naphthalene(%)Original solution Filtered solution
2.6 1.6 37.14
8.2 4.7 43.20
10.0 6.1 39.11
11.7 7.7 34.16
14.0 9.4 32.80
13.7 9.8 28.78
16.8 10.2 39.32
18.7 14.7 21.62
21.7 10.9 49.79
Figure B-1 Adsorption of naphthalene on a membrane with a Swinney filter holder forpre-treatment of HPLC samples.

APPENDIX C
EXPERIMENTAL SET-UP OF CONTINUOUS FLOW REACTORSFOR BIOFILM CULTURES
82

83
Figure C Experimental set-up of continuous flow reactors for biofilm cultures: (A)experimental set-up and (B) column details.

APPENDIX D
TABLES AND FIGURES OF EXPERIMENTAL RESULTS OBTAINEDFROM SUSPENDED CULTURES OF Pseudomonas putida
84

Table D-1 Experimental data obtained from shake flask experiment (1-a).
Time(hours)
Naphthaleneconcentration
(mom-)
Totalcell protein
(mg/L)
Number of cells/mL Opticaldensity
Dry biomass(= OD x 373.01)
(mg/L)
Live Dead Total
0 3.07 0.48 1.06E+07 1.59E+05 1.08E+07 0.013 4.664 0 0.69 1.10E+07 6.75E+05 1.16E+07 0.016 5.78
8.5 0 1.16 2.23E+07 4.21E+05 2.27E+07 0.017 6.3413 0 1.55 2.32E+07 5.56E+05 2.37E+07 0.020 7.4619 0 2.15 1.63E+07 3.97E+05 1.67E+07 0.020 7.4627 0 2.02 2.10E+07 5.21E+05 2.16E+07 0.021 7.6535 0 1.80 2.17E+07 9.99E+05 2.27E+07 0.023 8.3954 0 1.63 1.77E+07 8.09E+05 1.85E+07 0.022 8.21
Table D-2 Experimental data obtained from shake flask experiment (1-b).
Time(hours)
Naphthaleneconcentration
(mg/L)
Totalcell protein
(mom-)
Number of cells/mL Opticaldensity
Dry biomass(= OD x 373.01)
(mg/L)
Live Dead Total
0 7.21 1.03 9.33E+06 2.38E+05 9.57E+06 0.014 5.044 0 3.26 1.39E+07 7.94E+04 1.39E+07 0.021 7.65
8.5 0 3.77 3.54E+07 5.56E+05 3.59E+07 0.028 10.2613 0 3.68 3.41E+07 8.60E+05 3.50E+07 0.033 12.3119 0 4.71 2.73E+07 2.03E+06 2.93E+07 0.032 11.9427 0 4.41 2.71E+07 7.25E+05 2.78E+07 0.034 12.6835 0 4.37 4.61E+07 2.12E+06 4.82E+07 0.035 13.0654 0 5.39 3.61E+07 1.46E+06 3.75E+07 0.036 13.24

Table D-3 Experimental data obtained from shake flask experiment (1-c).
Time(hours)
Naphthaleneconcentration
{mg/L)
Totalcell protein
(mg/L)
Number of cells/mL Opticaldensity
Dry biomass(= OD x 373.01)
(mg/L)
Live Dead Total
0 11.49 1.889 8.83E+06 2.24E+05 9.05E+06 0.011 4.104 1.05 3.940 1.03E+07 3.57E+05 1.06E+07 0.019 7.09
8.5 0 7.103 3.47E+07 6.75E+05 3.53E+07 0.040 14.9213 0 6.248 4.45E+07 3.08E+06 4.76E+07 0.046 17.1619 0 6.590 4.37E+07 2.80E+06 4.65E+07 0.043 16.0427 0 6.932 5.21E+07 1.11E+06 5.32E+07 0.044 16.4135 0 4.27E+07 1.15E+06 4.39E+07 0.048 17.9054 0 3.93E+07 8.23E+05 4.01E+07 0.050 18.65
Table D-4 Experimental data obtained from shake flask experiment (1-d).
Time(hours)
Naphthaleneconcentration
(mgfL)
Totalcell protein
(mg/L)
Number of cells/mL Opticaldensity
Dry biomass(= OD x 373.01)
(mg/L)
Live Dead Total
0 16.19 5.82 7.98E+06 7.94E+04 8.06E+06 0.011 4.104 7.53 6.25 6.03E+06 3.97E+05 6.43E+06 0.015 5.41
8.5 0 15.61 2.67E+07 1.35E+06 2.81E+07 0.048 17.7213 0 12.96 4.94E+07 3.77E+06 5.32E+07 0.054 20.1419 0 12.57 3.28E+07 5.97E+05 3.34E+07 0.052 19.2127 0 11.85 3.61E+07 1.15E+06 3.73E+07 0.053 19.7735 0 12.10 4.77E+07 1.92E+06 4.96E+07 0.056 20.7054 0 13.21 5.22E+07 1.20E+06 5.34E+07 0.055 20.33

Figure D-1 Biodegradation of naphthalene by Pseudomonas putida inshake flasks (Experiment-1).
87
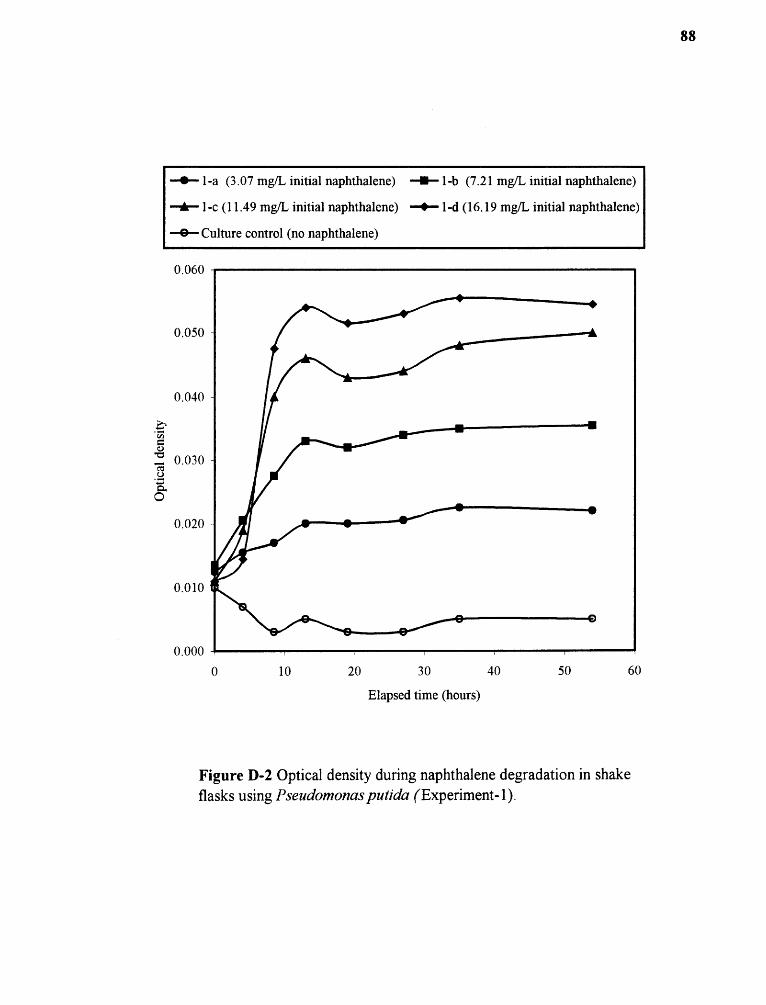
Figure D-2 Optical density during naphthalene degradation in shakeflasks using Pseudomonas putida (Experiment-1).

Figure D-3 Total cell protein during naphthalene degradation inshake flasks using Pseudomonas putida (Experiment-1).
89
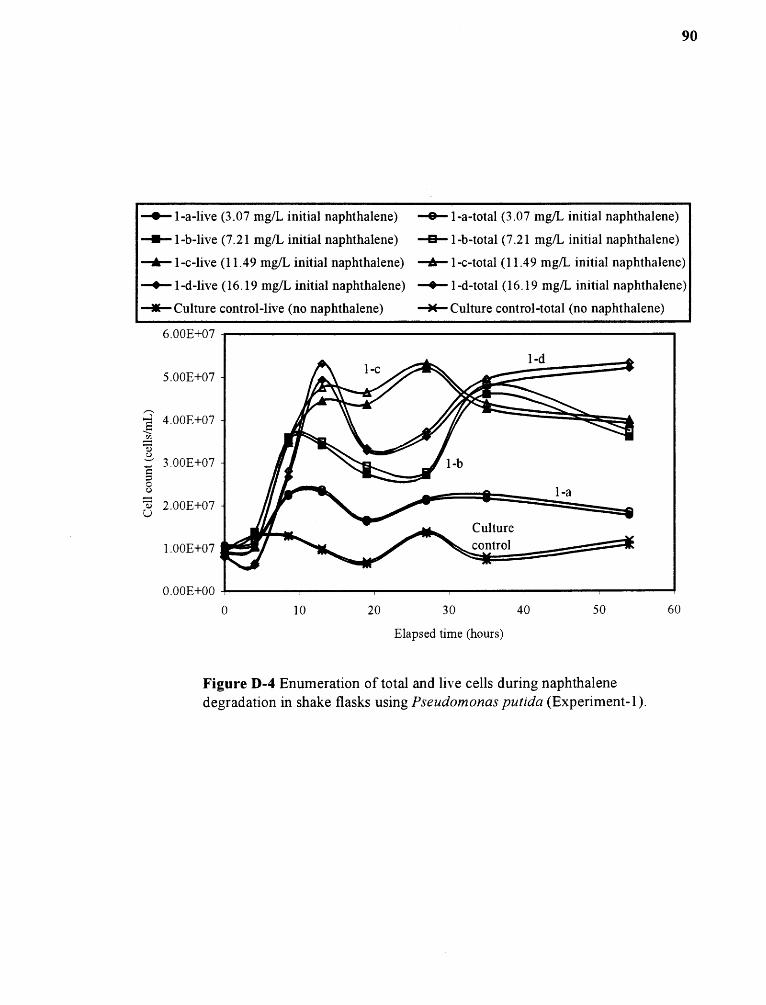
90
Figure D -4 Enumeration of total and live cells during naphthalenedegradation in shake flasks using Pseudomonas putida (Experiment-1).

Figure D-5 Growth patterns of Pseudomonas putida in OD, TCP and LCN due tobiodegradation of naphthalene (initial=3.07 mg/L); Experiment 1-a.
91
Figure D-6 Growth patterns of Pseudomonas putida in OD, TCP and LCN due tobiodegradation of naphthalene (initial=7.21 mg/L); Experiment 1-b.

Figure D-7 Growth patterns of Pseudomonas putida in OD, TCP and LCN due tobiodegradation of naphthalene (initial=11.49 mg/L); Experiment 1-c.
92
Figure D-8 Growth patterns of Pseudomonas putida in OD, TCP and LCN due tobiodegradation of naphthalene (initial=16.19 mg/L); Experiment 1-d.

Naphthaleneconcentration
(mg/L)
Totalcell protein
(mg/L)
Dry biomass(= OD x 373.01)
(mgfL)
Time(hours)
Number of cells/mLLive Dead Total
Opticaldensity
Table D-3 Experimental data obtained from shake flask experiment (1-c).
0 11.49 1.889 8.83E+06 2.24E+05 9.05E+06 0.011 4.104 1.05 3.940 1.03E+07 3.57E+05 1.06E+07 0.019 7.09
8.5 0 7.103 3.47E+07 6.75E+05 3.53E+07 0.040 14.9213 0 6.248 4.45E+07 3.08E+06 4.76E+07 0.046 17.1619 0 6.590 4.37E+07 2.80E+06 4.65E+07 0.043 16.0427 0 6.932 5.21E+07 1.11E+06 5.32E+07 0.044 16.4135 0 4.27E+07 1.15E+06 4.39E+07 0.048 17.9054 0 3.93E+07 8.23E+05 4.01E+07 0.050 18.65
Table D-4 Experimental data obtained from shake flask experiment (1-d).
Time(hours)
Naphthaleneconcentration
(mg/L)
Totalcell protein
(me)
Number of cells/mL Opticaldensity
Dry biomass(= OD x 373.01)
(mg/L)Live Dead Total
0 16.19 5.82 7.98E+06 7.94E+04 8.06E+06 0.011 4.104 7.53 6.25 6.03E+06 3.97E+05 6.43E+06 0.015 5.41
8.5 0 15.61 2.67E+07 1.35E+06 2.81E+07 0.048 17.7213 0 12.96 4.94E+07 3.77E+06 5.32E+07 0.054 20.1419 0 12.57 3.28E+07 5.97E+05 3.34E+07 0.052 19.2127 0 11.85 3.61E+07 1.15E+06 3.73E+07 0.053 19.7735 0 12.10 4.77E+07 1.92E+06 4.96E+07 0.056 20.7054 0 13.21 5.22E+07 1.20E+06 5.34E+07 0.055 20.33

Table D-5 Experimental data obtained from shake flask experiment (2-a).
Time(hours)
Naphthaleneconcentration
(mg/L)
Number of cells/mL Opticaldensity
Dry biomass(= OD x 373.01)
(mg/L)
Live Dead Total
0 6.23 1.36E+07 7.68E+04 1.36E+07 0.007 2.424 0 1.82E+07 3.84E+05 1.86E+07 0.016 5.97
8.5 0 2.13E+07 3.94E+05 2.17E+07 0.021 7.6513 0 2.40E+07 1.08E+05 2.41E+07 0.025 9.3319 0 1.96E+07 1.03E+06 2.06E+07 0.023 8.5827 0 2.38E+07 1.27E+06 2.51E+07 0.023 8.5835 0 3.32E+07 1.15E+06 3.43E+07 0.024 8.77
Table D-6 Experimental data obtained from shake flask experiment (2-b).
Time(hours)
Naphthaleneconcentration
(mg/L)
Number of cells/mL OpticaldensityLive Dead Total
0 9.54 1.37E+07 1.92E+05 1.39E+07 0.0074 2.43 1.58E+07 7.68E+04 1.59E+07 0.012
8.5 0 3.04E+07 4.50E+05 3.08E+07 0.03013 0 3.97E+07 2.96E+05 4.00E+07 0.03519 0 3.62E+07 6.62E+05 3.69E+07 0.03227 0 4.01E+07 1.38E+06 4.15E+07 0.03335 0 5.09E+07 1.16E+06 5.21E+07 0.033
Dry biomass(= OD x 373.01)
(mg/L)2.614.4811.0012.8711.9412.1212.12

• 2 -a (6.23 mg/L initial naphthalene) —9-2-a (sterile control)
■ 2-b (9.54 mg/L initial naphthalene) —-2-b (sterile control)
• 2-c (12.60 mg/L initial naphthalene) —a-- 2-c (sterile control)
• 2-d (15.16 mg/L initial naphthalene) —0-- 2-d (sterile control)
95
Figure D-9 Biodegradation of naphthalene by Pseudomonas putida inshake flasks (Experiment-2).

-4-2-a (6.23 mg/L initial naphthalene) 2-b (9.54 mg/L initial naphthalene)
—A— 2-c (12.60 mg/L initial naphthalene) --*-- 2-d (15.16 mg/L initial naphthalene)
—e-- Culture control (no naphthalene)
96
Figure D-10 Optical density during naphthalene in shake flasks usingPseudomonas putida (Experiment-2).

97
Figure D-11 Enumeration of total and live cells during naphthalenedegradation in shake flasks using Pseudomonas puitda (Experiment-2).

Figure D-12 Growth patterns of Pseudomonas putida in OD and LCN due tobiodegradation of naphthalene (initial=6.23 mg/L); Experiment 2-a
98
Figure D-13 Growth patterns of Pseudomonas putida in OD and LCN due tobiodegradation of naphthalene (initial=9.54 mg/L); Experiment 2-b.

Figure D-14 Growth patterns of P seudomonas putida in OD and LCN due tobiodegradation of naphthalene (initial=12.60 mg/L); Experiment 2-c.
99
Figure D-15 Growth patterns of Pseudomonas putida in OD and LCN due tobiodegradation of naphthalene (initial=15.16 mg/L); Experiment 2-d.

APPENDIX E
DETERMINATION OF SPECIFIC GROWTH RATESUSING ORIGINAL BIOMASS MEASUREMENTS
100

Figure E-1 Determination of specific growth rates ofPseudomonas putida suspension using optical density (withoutconversion factor): Experiment-1.
Figure E-2 Determination of specific growth rates of Pseudomonasputida suspension using living cell number (without conversion factor):Experiment- 1 .
101

Figure E-3 Determination of specific growth rates ofPseudomonas putida suspension using total cell protein (withoutconversion factor): Experiment-1.
102
Figure E -4 Determination of specific growth rates ofPseudomonas putida suspension using optical density (withoutconversion factor): Experiment-2.

Figure E-5 Determination of specific growth rates ofPseudomonas putida suspension using living cell number (withoutconversion factor): Experiment-2.
103

APPENDIX F
CONVERSION FACTORS FOR TOTAL CELL NUMBER, LIVING CELLNUMBER, AND TOTAL CELL PROTEIN TO OPTICAL DENSITY
104

Figure F-1 Conversion factor (fTCN) for total cell number to
optical density for suspended cultures of Pseudomonas putidawith naphthalene in shake flasks (Experiment-1).
105

Figure F-2 Conversion factor (fLCN) for living cell number to
optical density for suspended cultures of Pseudomonas putidawith naphthalene in shake flasks (Experiment-1).
106

107
Figure F-3 Conversion factor (fTcp) for total cell proteinto optical density for suspended cultures of Pseudomonasputida with naphthalene in shake flasks (Experiment-1).

Figure F-4 Conversion factor (fTcN) for total cell number tooptical density for suspended cultures of Pseudomonasputida with naphthalene in shake flasks (Experiment-2).
108

Figure r -5 conversion tactor (tLcN) tor living cell numberto optical density for suspended cultures of Pseudomonasputida with naphthalene in shake flasks (Experiment-2).
109

Figure F-6 Combined conversion factor (fTCN) of experiment-1&2 fortotal cell number to optical density for suspended cultures ofPseudomonas putida with naphthalene in shake flasks.
110

Figure F-7 Combined conversion factor (fLcN) of experiment-
1&2 for living cell number to optical density for suspendedcultures of P seudomonas putida with naphthalene in shake flasks.
111

Table F-1 Dry biomass by using conversion factors from OD, TCN, LCN and TCPobtained by suspended culture with Pseudomonas putida (Experiment-1).
(1-a)Time
(hours)Naphthalene Dry biomass (mg/L)concentration
(mg/L) TCP LCN TCN OD
0 3.07 5.18 5.84 5.81 4.664 0 5.58 5.96 6.10 5.78
8.5 0 6.46 9.84 9.73 6.3413 0 7.17 10.16 10.08 7.4619 0 8.30 7.79 7.75 7.4627 0 8.06 9.42 9.36 7.6535 0 7.65 9.64 9.72 8.3954 0 7.33 8.29 8.37 8.21
(1-b)Time
(hours)Naphthaleneconcentration
Dry biomass (mg/L)
(mg/L) TCP LCN TCN OD
0 7.21 4.96 5.40 5.42 5.044 0 9.52 6.95 6.85 7.65
8.5 0 10.57 14.34 14.08 10.2613 0 10.39 13.91 13.78 12.3119 0 12.50 11.57 11.91 11.9427 0 11.88 11.50 11.42 12.6835 0 11.79 18.02 18.12 13.0654 0 13.90 14.58 14.60 13.24
112

(Continued from Table F-1)
(1-c)Time
(hours)Naphthaleneconcentration
Dry biomass (mg/L)
(mg/L) TCP LCN TCN OD
0 11.49 3.52 5.23 5.25 4.104 1.05 8.73 5.73 5.77 7.09
8.5 0 16.75 14.09 13.88 14.9213 0 14.58 17.47 17.91 17.1619 0 15.45 17.18 17.55 16.0427 0 16.31 20.07 19.75 16.4135 0 16.86 16.69 17.9054 0 15.68 15.45 18.65
(1-d)Time
(hours)Naphthalene Dry biomass (mg/L)concentration
(mg/L) TCP LCN TCN OD
0 16.19 4.55 4.94 4.92 4.104 7.53 5.53 4.27 4.39 5.41
8.5 0 27.18 11.37 11.50 17.7213 0 21.05 19.16 19.75 20.1419 0 20.16 13.46 13.26 19.2127 0 ' 18.48 14.59 14.52 19.7735 0 19.07 18.58 18.59 20.7054 0 21.64 20.11 19.82 20.33
113

Table F-2 Dry biomass by using conversion factors from OD, TCN and LCNobtained by suspended culture with Pseudomonas putida (Experiment-2).
(2-a)Time
(hours)Naphthalene Dry biomass (mg/L)concentration
(mg/L) LCN TCN OD
0 6.23 6.82 4.48 2.424 0 8.25 5.95 5.97
8.5 0 9.23 6.90 7.6513 0 10.07 7.63 9.3319 0 8.68 6.56 8.5827 0 10.01 7.92 8.5835 0 12.90 10.69 8.77
(2-b)Time
(hours)Naphthaleneconcentration
Dry biomass (mg/L)
(mg/L) LCN TCN OD
0 9.54 6.86 4.54 2.614 2.43 7.51 5.14 4.48
8.5 0 12.04 9.64 11.0013 0 14.94 12.41 12.8719 0 13.85 11.46 11.9427 0 15.07 12.86 12.1235 0 18.41 16.02 12.12
114

(Continued from Table F-2)
(2-c)Time
(hours)Naphthalene Dry biomass (mg/L)concentration
(mg/L) LCN TCN OD
0 12.60 6.74 4.46 1.874 5.25 7.58 5.20 4.10
8.5 0 13.75 11.25 14.9213 0 15.12 12.64 16.4119 0 18.97 16.30 15.6727 0 18.46 16.01 15.2935 0 20.53 18.15 16.23
(2-d)Time
(hours)Naphthaleneconcentration
Dry biomass (mg/L)
(mg/L) LCN TCN OD
0 15.16 6.39 4.08 2.614 8.25 7.27 4.89 4.10
8.5 0 13.20 10.75 17.1613 0 18.79 16.25 18.6519 0 20.73 18.50 17.3427 0 20.91 18.77 18.4635 0 22.75 20.63 19.21
115

APPENDIX G
PRODUCTION OF INTERMEDIATES DURING BIODEGRADATION OFNAPHTHALENE BY Pseduomonas putida
116

117
Figure G-1 Concentration profiles during biodegradation of naphthalene (A);sample HPLC chromatogram (B) and sterile control (C) at time 4 hours:Experiment- 1 -a.

Figure G-2 Concentration profiles during biodegradation of naphthalene (A);sample HPLC chromatogram (B) and sterile control (C) at time 4 hours:Experiment-1-b.
118

119
Figure G-3 Concentration profiles during biodegradation of naphthalene (A);sample HPLC chromatogram (B) and sterile control (C) at time 4 hours:Experiment-1-c.

Figure G-4 Concentration profiles during biodegradation of naphthalene (A);sample HPLC chromatogram (B) and sterile control (C) at time 4 hours:
Experiment-1-d.
120

Figure G-5 Concentration profiles during biodegradation of naphthalene (A);sample HPLC chromatogram (B) and sterile control (C) at time 4 hours:Experiment-2-a.
121

Figure G-6 Concentration profiles during biodegradation of naphthalene (A);sample HPLC chromatogram (B) and sterile control (C) at time 4 hours:Experiment-2-b.
122

Figure G-7 Concentration profiles during biodegradation of naphthalene (A);sample HPLC chromatogram (B) and sterile control (C) at time 4 hours:Experiment-2-c.
123

Figure G-8 Concentration profiles during biodegradation of naphthalene (A);sample HPLC chromatogram (B) and sterile control (C) at time 4 hours:Experiment-2-d.
124

APPENDIX H
EXPERIMENTAL DATA FOR BIOFILIM CULTURES ON GLASS SUPPORTSIN CONTINUOUS FLOW SYSTEM
125

Table H-1 Naphthalene concentration.
Elapsedtime
(hour)
Roomtemperature
(°C)Reservoir-A
Column-X (mg/L) Column-Y (mg/L)
(mg/L) Inlet outlet difference Inlet outlet difference
0.0 22.0 24.2 20.2 19.3 0.9 20.2 18.6 1.60.3 22.0 26.3 19.6 15.5 4.2 16.8 13.7 3.22.0 21.7 26.0 20.2 17.7 2.4 20.7 18.6 2.17.5 20.7 27.3 19.7 17.7 2.0 20.1 17.6 2.511.3 20.7 25.4 19.2 16.9 2.3 18.9 16.9 2.018.0 23.8 27.0 19.2 13.9 5.4 20.0 12.7 7.326.7 21.7 26.6 20.0 15.0 5.0 19.7 13.8 5.933.0 21.0 25.8 19.5 14.0 5.5 19.4 12.7 6.739.5 23.0 29.1 20.8 13.4 7.4 21.2 13.1 8.151.3 21.8 27.2 20.5 15.4 5.1 20.6 14.8 5.8
126
Figure H -1 Comparison of naphthalene concentration in column-Xand Y, difference between inlet and outlet for biofilm cultures in acontinuous flow system.

Table H-2 Cells immobilized on glass supports in column reactors of continuous flow system.
Column Timefor sample (hours)
Cell density of biofilm(cells per cm2)
Standard deviation of biofilm Total(cells per cm2
)
immobilized cells Total immobilized cellson a glass support on 5 glass supports
(cells on 186.1 cm2) (cells on 930.5 cm2)
Normalization of
total cellsLive cells Dead cells Total cells Live cells Dead cells Total cells
Seed-BF 0 1.57E+05 5.87E+04 2.16E+05 4.34E+04 7.49E+03 3.60E+04 4.02E+07 2.01E+08 1.00column-Y 11.25 3.30E+05 1.09E+05 4.39E+05 7.54E+04 9.23E+04 3.98E+04 8.17E+07 4.09E+08 2.03column-Y 18 3.43E+05 3.67E+04 3.80E+05 1.15E+05 1.24E+04 1.10E+05 7.07E+07 3.53E+08 1.76column-Y 26.7 2.78E+05 2.88E+05 5.67E+05 1.19E+05 2.69E+05 3.73E+05 1.05E+08 5.27E+08 2.62column-Y 33 4.32E+05 8.07E+04 5.13E+05 1.67E+05 1.98E+04 1.71E+05 9.54E+07 4.77E+08 2.37column-Y 39.5 5.59E+05 3.73E+05 9.32E+05 2.10E+05 2.09E+05 4.17E+05 1.74E+08 8.68E+08 4.32column-X 51.3 6.78E+05 6.91E+05 1.37E+06 1.27E+05 2.61E+05 3.42E+05 6.37E+07 1.27E+09 6.34
Live cell % is assumed to be the same as for suspended cells in the same column.
Table H-3 Growth and viability of suspended cells in column-X of continuous flow system for biofilm culture.
Elapsedtime
(hours)
Cell density(cells/mL)
Standard deviation of cell density(cells/mL)
% of live cellsin column-X
Total live cellsin suspension of column-X
(cells/441 mL)Live Dead Total Live Dead Total
0.25 1.34E+05 0.00E+00 1.34E+05 2.33E+05 0.00E+00 2.33E+05 100% 5.93E+0711.25 9.41E+05 0.00E+00 9.41E+05 9.31E+05 0.00E+00 9.31E+05 100% 4.15E+0818.00 4.84E+06 5.38E+05 5.38E+06 4.03E+05 4.66E+05 2.33E+05 90% 2.13E+0926.70 6.05E+06 2.69E+05 6.32E+06 8.07E+05 2.33E+05 6.16E+05 96% 2.67E+0933.00 5.92E+06 0.00E+00 5.92E+06 1.63E+06 0.00E+00 1.63E+06 100% 2.61E+0939.50 3.76E+06 2.69E+05 4.03E+06 4.66E+05 4.66E+05 8.07E+05 93% 1.66E+0951.3 3.50E+06 1.34E+05 3.63E+06 1.53E+06 2.33E+05 1.76E+06 96% 1.54E+09

Table H-4 Viable cells in column-X of continuous flow system.
Total live cells on biofilmLive cells in Live cells on biofilm applied on 5 glass supports applied Total live cells Total live cells of
Elapsed suspension of from % of live cells from % of live cells in suspension of biofilm and suspended Live-immobilized cellstime column-X in suspension of column-X in suspension of column-X column-X cells in column-X in column-X
(hours) (%) (cells per cm2) (live cells on 930.5 cm2) (cells/441 mL) (live cells in column-X) (%)
0.25 100% 2.16E+05 2.01E+08 5.93E+07 2.60E+08 77%11.25 100% 4.39E+05 4.09E+08 4.15E+08 8.24E+08 50%
18 90% 3.42E+05 3.18E+08 2.13E+09 2.45E+09 13%26.7 96% 5.43E+05 5.05E+08 2.67E+09 3.17E+09 16%33 100% 5.13E+05 4.77E+08 2.61E+09 3.09E+09 15%
39.5 93% 8.70E+05 8.10E+08 1.66E+09 2.47E+09 33%51.3 96% 1.32E+06 1.23E+09 1.54E+09 2.77E+09 44%

Table 14-5 Viability of suspended bacteria in column-Y of continuous flow system for biofilm culture.
Elapsedtime
(hours)
Cell density (cells/mL) # of glasssupports
in column-Y
Media volumein column-Y
Retention timeat 1 mL/min.
(hour)
% of live cellsin column-Y
Total live cellsin column-YLive Dead subtotal
0 0.00E+00 0.00E+00 0.00E+00 5 441 7.4 #DIV/0! 0.00E+0011.25 4.03E+05 0.00E+00 4.03E+05 5 441 7.4 100% 1.78E+08
18 6.05E+06 4.03E+05 6.45E+06 4 460 7.7 94% 2.78E+0926.7 4.44E+06 4.03E+05 4.84E+06 3 479 8.0 92% 2.13E+0933 5.45E+06 2.02E+05 5.65E+06 2 498 8.3 96% 2.71E+09
39.5 6.25E+06 2.02E+05 6.45E+06 1 517 8.6 97% 3.23E+0951.3 3.43E+06 2.02E+05 3.63E+06 0 536 8.9 94% 1.84E+09
(Sampled from only outlet)
Table H-6 Viable cells in column-Y of continuous flow system.
Live cells in Live cells on biofilm applied Total live cells on biofilmElapsed suspension of from % of live cells on glass supports applied
time column-Y in suspension of column-X by % of live cells in suspension
(hours) (%) (cells per cm2) (cells / all glasses remained)
Total live cells Total live cells ofin suspension of biofilm and suspension Live-immobilized cells
column-Y in column-Y in column-Y
(%)
0.0 98% 2.12E+05 1.93E+08 0.00E+00 1.93E+08 100%11.3 100% 4.39E+05 4.09E+08 1.78E+08 5.86E+08 70%18.0 94% 3.56E+05 2.48E+08 2.78E+09 3.03E+09 8%26.7 92% 5.19E+05 2.66E+08 2.13E+09 2.39E+09 11%33.0 96% 4.94E+05 1.77E+08 2.71E+09 2.89E+09 6%39.5 98% 9.14E+05 1.67E+08 3.23E+09 3.40E+09 5%51.3 95% 1.31E+06 0.00E+00 1.84E+09 1.84E+09 0%
(time "0" = % of seed BF container) (Sampled from only outlet of column-Y)

Figure H-2 Amount of live cells on biofilm and suspension in column-Y according to elapsed time incontinuous flow system for biodegradation of naphthalene. (Media flow rate=1 mL/min.)

Figure H-3 Comparison of total live cells in column-X and -Y of continuous flow system forbiodegradation of naphthalene by Pseudomonas putida

Figure H-4 Concentration profiles for control run on column-X.(at 2, 7, 12, 17, 22 cm, inlet and outlet from the base of column)
132
Figure H-5 Countrol runs with (column-X) and without (column-Y)glass supports without biofilm in a continuous flow system.(Time "0" : starting time after installing glass supports on column-X;control run for about 27 hours)

Table H-7 Concentration profiles of naphthalene at differentsampling ports of column-X in continuous flow system forbiofilm cultures with Pseudomonas putida
Time Concentration of naphthalene on column-X (mg/L)(hours) Inlet X-A X-B X-C Outlet
-11.2 19.10 18.82 19.02 18.39 18.73-7.4 19.64 19.18 16.83 17.97 19.20
0 20.18 19.02 18.89 18.59 19.330.25 19.63 17.30 16.73 15.49 15.457.5 19.71 18.03 18.22 18.00 17.68
11.25 19.23 15.79 15.47 15.30 16.9018 19.22 14.83 13.16 12.93 13.87
26.7 20.04 14.34 14.25 14.03 15.0233 19.45 14.72 14.62 13.21 13.96
39.5 20.77 13.79 13.94 13.06 13.3951.3 20.52 17.50 14.95 14.95 15.37
133
Figure H-6 Profiles of naphthalene consumption along with sampling ports incolumn-X of continuous flow system for biofilm cultures with Pseudomonasputida. (based on inlet concentration at each sampling time)

REFERENCES
An, Y. H. and R. J. Friedman. 1997. "Laboratory Methods for Studies of BacterialAdhesion." Journal of Microbiological Methods. 30:141 - 152.
Bauer-Kreisel, P., M. Eisenbeis, and H. Scholz-Muramatsu. 1996. "Quantification ofDehalospirillum multivorans in Mixed-Culture Biofilms with an Enzyme-LinkedImmunosorbent Assay." Applied and Environmental Microbiology. 62(8):3050-3052.
Best, J. B. 1997. Biodegradation of Naphthalene Using Pseudomonas putida (ATCC17484) in Batch and Chemostat Reactors. Master Thesis, New Jersey Institute ofTechnology.
Bishop, P. L. 1996. "Biofilm Structure and Kinetics." Biofilm Systems III, Proceedings ofthe IAWQ 3rd International Conference on Biofilm Systems, Copenhagen,Denmark, Water Science and Technology. 287 -294.
Boulos, L., M. Prévost, B. Barbeau, J. Collier, R. Desjardins. 1999. "Live/Dead ®
BacLight™ : Application of a New Rapid Staining Method for Direct Enumerationof Viable and Total Bacteria in Drinking Water." Journal of MicrobiologicalMethods. 37:77-86.
Braux, A., J. Minet, Z. Tamanai-Shacoori, G. Riou, M. Cormier. 1997. "DirectEnumeration of Injured Escherichia coli Cells Harvested onto Membrane Filters."Journal of Microbiological Methods. 31:1 - 8.
Caldwell, D. E. and J. R. Lawrence. 1988. "Chapter 6: Study of Attached Cells inContinuous-flow Slide Culture." J. W. T. Wimpenny (editor), CRC Handbook ofLaboratory Model Systems for Microbial Ecosystems (Volume I), CRC Press,Inc., Boca Raton, Florida. 117-138.
Caldwell, D. E., D. R. Korber and J. R Lawrence. 1992. "Imaging of Bacterial Cells byFluorescence Exclusion using Scanning Confocal Laser Microscopy." Journal ofMicrobiological Methods. 15:249-261.
Characklis, W. G. and K. C. Marshall. 1990. Biofilms. John Wiley & Sons, Inc., NewYork.
Comas, J. and J. Vives-Rego. 1998. "Enumeration, Viability and Heterogeneity inStaphylococcus aureus Cultures by Flow Cytometry." Journal of MicrobiologicalMethods. 32:45 - 53.
134

135
de Beer, D., J. C. van den Heuvel, and S. P. P. Ottengraf. 1993. "MicroelectrodeMeasurements of the Activity Distribution in Nitrifying Bacterial Aggregates."Applied and Environmental Microbiology. 59(2):573-579.
de Beer, D., P. Stoodley, and Z. Lewandowski. 1994. "Liquid Flow in HeterogeneousBiofilms." Biotechnology and Bioengineering. 44(5):636-641.
Duffy, G. and J. J. Sheridan. 1998. " Viability Staining in a Direct Count Rapid Methodfor the Determination of Total Viable Counts on Processed Meats." Journal ofMicrobiological Methods. 31:167-174.
Erickson, D. C., R. C. Loethr and E. F. Neuhauser. 1993. "PAH Loss duringBioremediation of Manufactured Gas Plant Site Soils." Water Research.27(5):911-919.
Freitas dos Santos, L. M and A. G. Livingston. 1995a. "Membrane-Attached Biofilms forVOC Wastewater Treatment I: Novel In Situ Biofilm Thickness MeasurementTechnique." Biotechnology and Bioengineering. 47:82-89.
Freitas dos Santos, L. M and A. G. Livingston. 1995b. "Membrane-Attached Biofilms forVOC Wastewater Treatment II: Effect of Biofilm Thickness on Performance."Biotechnology and Bioengineering. 47:90-95.
Ghoshal, S. and R. G. Luthy. 1996. "Bioavailability of Hydrophobic Organic Compoundsfrom Nonaqueous-Phase Liquids: the Biodegradation of Naphthalene from CoalTar." Environmental Toxicology and Chemistry, 15(11): 1894-1900.
Ghoshal, S. and R. G. Luthy. 1998. "Biodegradation Kinetics of Naphthalene inNonaqueous Phase Liquid-Water Mixed Batch Systems: Comparison of ModelPredictions and Experimental results." Biotechnology and Bioengineering, 57(3):356-366.
Ghoshal, S., A. Ramaswami and R. G. Luthy. 1996. "Biodegradation of Naphthalene fromCoal Tar and Heptamethylnonane in Mixed Batch Systems." EnvironmentalScience and Technology. 30: 1282-1291.
Götz, P. and M. Reuss. 1997 "Dynamics of Microbial Growth: Modeling Time Delays byIntroducing a Polymerization Reaction." Journal of Biotechnology. 58:101-114.
Guerin, W.F. and S. A. Boyd. 1992. "Differential Bioavailability of Soil-SorbedNaphthalene to Two Bacterial Species." Applied and EnvironmentalMicrobiology. 5 8(4): 1142-1152.
Guerin, W.F. and S. A. Boyd. 1997. "Bioavailability of Naphthalene Associated withNatural and Synthetic Sorbents." Water Research. 31(6): 1504-1512.

136
Hugland, R. P. 1996. "Handbook of Fluorescent Probes and Research Chemicals."Molecular Probes, Inc., Eugene, OR.
Jacobsen, C. N., J. Rasmussen, M. Jakobsen. 1997. "Viability Staining and FlowCytometric Detection of Listeria monocytogenes." Journal of MicrobiologicalMethods. 28:35-43.
Jacques, M. and C. E. Morris. 1995. "A Review of Issues Related to the Quantification ofBacteria from the Phyllosphere." Microbiology Ecology. 18:1-14.
Karel, S. F and C. R. Robertson. 1989. "Cell Mass Synthesis and Degradation byImmobilized Escherichia coli ." Biotechnology and Bioengineering. 34:337-356.
Kennedy, M. J., M. S. Thakur, D. I. C. Wang, and G. N. Stephanopoulos. 1992."Estimating Cell Concentration in the Presence of Suspended Solids: a LighterScatter Technique." Biotechnology and Bioengineering. 40:875-888.
Kogure, K., U. Simidu, and N. Taga. 1979. "A Tentative Direct Microscopic Method forCounting Living Marine Bacteria." Canadian Journal of Microbiology. 25:415-420.
Korber, D. R., J. R. Lawrence, L. Zhang and D. E. Caldwell. 1990. "Effect of Gravity onBacterial Deposition and Orientation in Laminar Flow Environments." Biofouling.2:335-350.
Lauvvik, T. and R. Bakke. 1994. "Biofilm Thickness Measurements by Variance Analysisof Optical Images." Journal of Microbiological Methods, 20:219-224.
Lawrence, J. R., D. R. Korber and D. E. Caldwell. 1989. "Computer-Enhanced DarkfieldMicroscopy for the Quantitative Analysis of Bacterial Growth and Behavior onSurfaces." Journal of Microbiological Methods. 10:123-138.
Lawrence, J. R., D. R. Korber, B. D. Hoyle, J. W. Costerton, and D. E. Caldwell. 1991."Optical Sectioning of Microbial Biofilms." Journal of Bacteriology.173(20):6558-6567.
Lawrence, J. R., D. R. Korber, G. M. Wolfaardt, and D. E. Caldwell. 1997. "Chapter 5:Analytical Imaging and Microscopy Techniques." C. J. Hurst, G. R. Knudsen, M.J. McInerney, L. D. Stetzenbach, M. V. Walter (editors), Manual ofEnvironmental Microbiology, American Society for Microbiology, Washington,DC, 29-51.
Lawrence, J. R., G. M. Wolfaardt, and D. R. Korber. 1994. "Determination of DiffusionCoefficients in Biofilm by Confocal Laser Microscopy." Applied andEnvironmental Microbiology. 60(4):1166-1173.

137
Lazarova, V., V. Pierzo, D. Fontvielle, and J. Manem. 1994. "Integrated Approach forBiofilm Characterization and Biomass Activity Control." Water Science andTechnology. 29(7):345-354.
Lebaron, P., P. Catala, and N. Parthuisot. 1998. "Effectiveness of SYTOX Green Stainfor Bacterial Viability Assessment." Applied and Environmental Microbiology.64(7):2697-2700.
Lewandowski, Z., S. A. Altobelli, and E. Fukushima. 1993. "NMR and MicroelectordeStudies of Hydrodynamics and Kinetics in Biofilms." Biotechnology Progress.9:40-45.
Liebert, C. and T. Barkay. 1988. "A Direct Viable Counting Method for MeasuringTolerance of Aquatic Microbial Communities to Hg2+ ." Canadian Journal ofMicrobiology. 34:1090-1095.
Liu, Y. and B. Capdeville. 1996. "Specific Activity of Nitrifying Biofilm in WaterNitrification process." Water Research. 30(7):1645-1650.
Liu, Z., A. M. Jacobson, and R. G. Luthy. 1995. "Biodegradation of Naphthalene inAqueous Nonionic Surfactant Systems." Applied and EnvironmentalMicrobiology. 61(1):145-151.
Llobet-Brossa, E., R. Rosselló-Mora, and R. Amann. 1998. Microbial CommunityComposition of Wadden Sea Sediments as Revealed by Fluorescence In-SituHybridization." Applied and Environmental Microbiology. 64(7):2691-2696.
Marx, R. B. and M. D. Aitken. 2000. "Bacterial Chemotaxis Enhances NaphthaleneDegradation in a Heterogenous Aqueous System." Environmental Science andTechnology. 34: 3379-3383.
Massol-deyá, A. A., J. Whallon, R. F. Hickey, and J. M. Tiedje. 1995. "ChannelStructures in Aerobic Biofilms of Fixed-Film Reactors Treating ContaminatedGroundwater." Applied and Environmental Microbiology. 61(2):769-777.
Murga, R., P. S. Stewart, and D. Daly. 1995. "Quantitative Analysis of Biofilm ThicknessVariability." Biotechnology and Bioengineering. 45:503-510.
Neu, T. R. and J. R. Lawrence. 1997. " Development and Structure of Microbial Biofilmsin River Water Studied by Confocal Laser Scanning Microscopy." MicrobiologyEcology. 24:11-25.
Okabe, S., K. Hiratia, Y. Ozawa, and Y. Watanabe. 1996. "Spatial Microbial Distributionsof Nitrifiers and Heterotrophs in Mixed-Population Biofilms." Biotechnology andBioengineering. 50(1):24-35.
138
Pavasant, P., L. M. Freitas dos Santos, E. N. Pistikopoulos, and A. G. Livingston. 1996."Prediction of Optimal Biofilm Thickness for Membrane-Attached BiofilmsGrowing in an Extractive Membrane Bioreactor." Biotechnology andBioengineering. 52:373-386.
Peele, E. R. and R. R. Colwell. 1981. "Application of a Direct Microscopic Method forEnumeration of Substrate-Responsive Marine Bacteria." Canadian Journal ofMicrobiology. 27:1071-1075.
Peyton, B. M. 1996. "Effects of Shear Stress and Substrate Loading Rate onPseudomonas aeruginosa Biofilm Thickness and Density." Water Research.30(1):29-36.
Rockne, K. and S. E. Strand. 1998. "Biodegradation of Bicylic and Polycylic AromaticHydrocarbons in Anaerobic Enrichments." Environmental Science andTechnology. 32: 3962-3967.
Rodriguez, G. G., D. Phipps, K. Ishiguro, and H. F. Ridgway. 1992. "Use of aFluorescent Redox Probe for Direct Visualization of Actively Respiring Bacteria."Applied and Environmental Microbiology. 58(6):1801-1808.
Roszak, D. B and R. R. Colwell. 1987. "Survival Strategies of Bacteria in the NaturalEnvironment." Microbiological Reviews. 51(3): 365-379.
Sanford, BA, AW de Feijter, MB Wade and VL Thomas. 1996. "A Dual FluorescenceTechnique for Visualization of Staphylococcus epidermidis Biofilm UsingScanning Confocal Laser Microscopy." Journal of Industrial Microbiology.16:48-56.
Sanford, BA, VL Thomas, SJ Mattingly, MA Ramsay and MM Miller. 1995. "Lectin-Biotin Assay for Slime Present in In Situ Biofilm Produced by Staphylococcusepidermis Using Transmission Electron Microscopy." Journal of IndustrialMicrobiology. 15:156-161.
Schaule, G., H. -C. Flemming, and H. F. Ridgway. 1993. "Use of 5-cyano-2,3-ditolyltetrazolium chloride for Quantifying Planktonic and Sessile Respiring Bacteria inDrinking Water." Applied and Environmental Microbiology. 59(11):3850-3857.
Schramm, S., L. H. Larsen, N. P. Revsbech and R. I. Amann. 1997. "Structure andFunction of a Nitrifying Biofilm as Determined by Microelectrodes andFluorescent Oligonucleotide Probes." Biofilm Systems III, Proceedings of theIAWQ 3rd International Conference on Biofilm Systems, Copenhagen, Denmark,Water Science and Technology. 263-270.

139
Singh, A., F. Yu, and G. A. McFeters. 1990. "Rapid Detection of Chlorine-InducedBacterial Injury by the Direct Viable Count Method Using Image Analysis."Applied and Environmental Microbiology. 56(2):389-394.
Smith, J. J., G. S. McFeters. 1997. "Mechanisms of INT (2-(4-iodophenyl)-3-(4-nitrophenyl)-5-phenyltetrazolium chloride), and CTC (5-cyano-2,3-ditolyltetrazolium chloride) Reduction in Escherichia coli K-12." Journal ofMicrobiological Methods, 29:161-175.
Stewart, P. S., B. M. Peyton, W. J. Drury, and R. Murga. 1993. "QuantitativeObservations of Heterogeneities in Pseudomonas aeruginosa Biofilms." Appliedand Environmental Microbiology. 59(1):327-329.
Stewart, P. S., T. Griebe, R. Srinivasan, C. —I. Chen, F. P. Yu, D. de Beer, and G. A.McFeters. 1994. "Comparison of Respiratory Activity and Culturability duringMonochloramine Disinfection of Binary population Biofilms." Applied andEnvironmental Microbiology. 60(5): 1690-1692.
Stoodley, P., D. de Beer, and Z. Lewandowski. 1994. "Liquid Flow in Biofilm Systems."Applied and Environmental Microbiology. 60(8):2711-2716.
Stoodley, P., J. Boyle, A. B. Cunningham, I. Dodds, H. M. Lappin-Scott, and Z.Lewandowski. 1999. "Biofilm Structure and Influence on Biofouling underLaminar Flow and Turbulent Flows." In Biofilms in the Aquatic Environments, pp.13-24, Edited by C. W. Keevil, A. Godfree, D. Holt, C. Dow. The Royal Societyof Chemistry Press, Cambridege.
Strathmann, M., T. Griebe, and H. C. Flemming. 2000. "Artificial Biofilm Model-a UsefulTool for Biofilm Research." Applied Microbiology and Biotechnology. 54:231-237.
Stucki, G. and M. Alexander. 1987. "Role of Dissolution Rate and Solubility inBiodegradation of Aromatic Compounds." Applied and EnvironmentalMicrobiology. 53(2):292-297.
Sundstrom, D. W. and H. E. Klei. 1979. Wastewater Treatment. Prentice-Hall, Inc.,Englewood Cliffs, NJ.
Swope, K. L. and M. C. Flickinger. 1996. "The Use of Confocal Scanning LaserMicroscopy and Other Tools to Characterize Escherichia coli in a High-Cell-Density Synthetic Biofilm." Biotechnology and Bioengineering. 52:340-356.
Taghi-Kilani, R., L. L. Gyurek, P. J. Millard, G. R. Finch and M. Belosevic. 1996."Nucleic Acid Stains as Indicators of Giardia muris Viability Following CystInactivation." International Journal for Parasitology. 26(6):637-646.

140
Tanyolaç, A. and H. Beyenal. 1996. "Predicting Average Biofilm Density of a Fully ActiveSpherical Bioparticle." Journal of Biotechnology. 52:39-49.
Tanyolaç, A. and H. Beyenal. 1997. "Prediction of Average Biofilm Density andPerformance of a Spherical Bioparticle under Substrate Inhibition." Biotechnologyand Bioengineering, 56(3): 319-329.
Tarbor, P. S. and R. A. Neihof. 1982. "Improved Method for Determination of RespiringIndividual Microorganisms in Natural Waters." Applied and EnvironmentalMicrobiology. 43(6): 1249-1255.
Terzieva, S., J. Donnelly, V. Ulevicius, S. A. Grinshpun, K. Willeke, G. N. Stelma, and K.P. Brenner. 1996. "Comparison of Methods for Detection and Enumeration ofAirborne Microorganisms Collected by Liquid Impingement." Applied andEnvironmental Microbiology. 62(7):2264-2272.
Trulear, M., W. G. Characklis. "Dynamics of Biofilm Processes." Journal of WaterPollution Control Federation. 54(9): 1288-1301.
Villaverade, S. and F. Fernández-Polanco. 1999. "Spatial Distribution of RespiratoryActivity in Pseudomonas putida 54G Biofilms Degrading Volatile OrganicCompounds (VOC)." Applied Microbiology and Biotechnology. 51:382-387.
Villaverade, S., R. G. Mirpuri, Z. Lewandowski and W. L. Jones. 1997. "Physiologicaland Chemical Grandients in a Pseudomonas putida 54G Biofilm DegradingToluene in a Flat Plate Vapor Phase Bioreactor." Biotechnology andBioengineering. 56(4):361-371.
Virta, M, S. Lineri, P. Kankaanpää, M. Karp, K. Peltonen, J. Nuutila, and E. Lilius. 1998."Determination of Complement-Mediated Killing of Bacteria by Viability Stainingand Bioluminescence." Applied and Environmental Microbiology. 64(7):515-519.
Wilson, M. S. and E. L. Madsen. 1996. "Field Extraction of a Transient IntermediaryMetabolite Indicative of Real Time In Situ Naphthalene Biodegradation."Environmental Science and Technology. 30: 2099-2103.
Winding, A., S. J. Binnerup, and J. Sorensen. 1994. "Viability of Indigenous Soil BacteriaAssayed by Respiratory Activity and Growth." Applied and EnvironmentalMicrobiology. 60(8):2869-2875.
Yu, F. P., B. H. Pyle and G. A. McFeters. 1993. "A Direct Viable Count Method for theEnumeration of Attached Bacteria and Assessment of Biofilm Disinfection."Journal of Microbiological Methods. 17:167-180.

141
Yu, F. P., G. A. McFeters. 1994. "Rapid In Situ Assessment of Physiological Activities inBacterial Biofilms Using Fluorescent Probes." Journal of MicrobiologicalMethods. 20:1-10.
Yu, W., W. K. Dodds, M. K. Banks, J. Skalsky and E. A. Strauss. 1995. "OptimalStaining and Sample Storage Time for Direct Microscopic Enumeration of Totaland Active Bacteria in Soil with Two Fluorescent Dyes." Applied andEnvironmental Microbiology. 61(9):3367-3372.
Zimmermann, R., R. Iturriaga, and J. Becker-Birck. 1978. "Simultaneous Determinationof the Total Number of Aquatic Bacteria an the Number thereof Involved inRespiration." Applied and Environmental Microbiology. 36(16):926-935.