Embed Size (px)
Citation preview
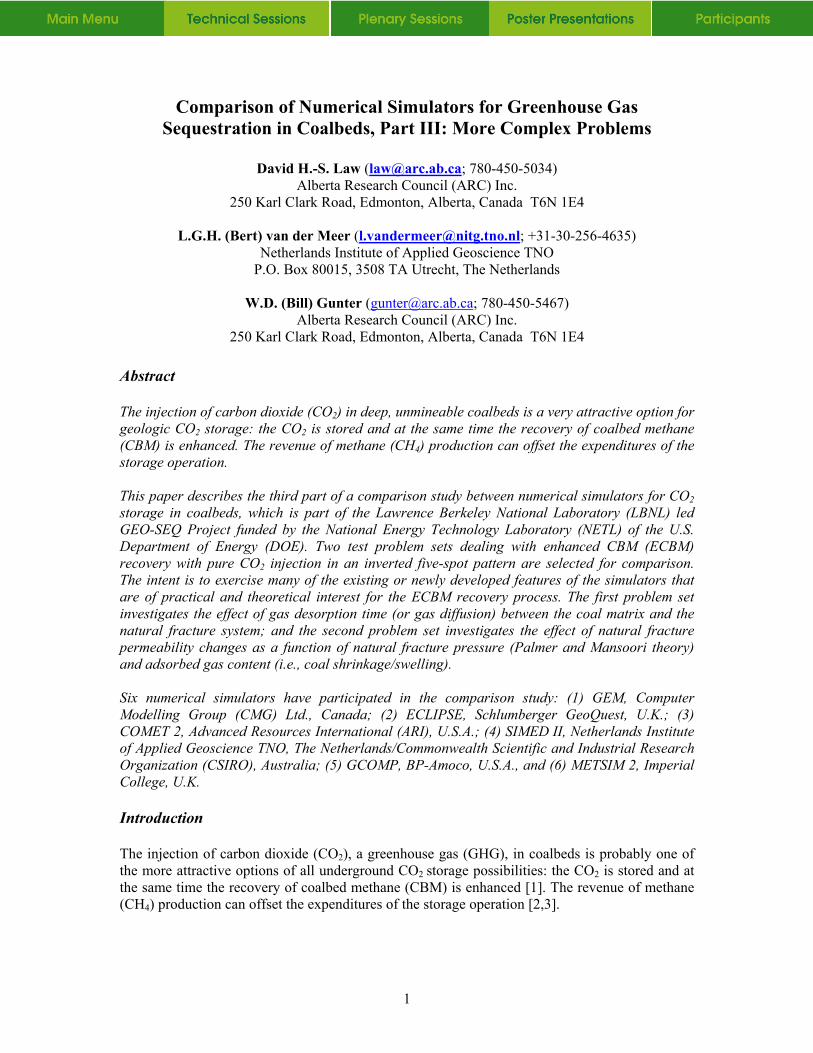
Comparison of Numerical Simulators for Greenhouse Gas Sequestration in Coalbeds, Part III: More Complex Problems
David H.-S. Law ([email protected]; 780-450-5034)
Alberta Research Council (ARC) Inc. 250 Karl Clark Road, Edmonton, Alberta, Canada T6N 1E4
L.G.H. (Bert) van der Meer ([email protected]; +31-30-256-4635)
Netherlands Institute of Applied Geoscience TNO P.O. Box 80015, 3508 TA Utrecht, The Netherlands
W.D. (Bill) Gunter ([email protected]; 780-450-5467)
Alberta Research Council (ARC) Inc. 250 Karl Clark Road, Edmonton, Alberta, Canada T6N 1E4
Abstract The injection of carbon dioxide (CO2) in deep, unmineable coalbeds is a very attractive option for geologic CO2 storage: the CO2 is stored and at the same time the recovery of coalbed methane (CBM) is enhanced. The revenue of methane (CH4) production can offset the expenditures of the storage operation. This paper describes the third part of a comparison study between numerical simulators for CO2 storage in coalbeds, which is part of the Lawrence Berkeley National Laboratory (LBNL) led GEO-SEQ Project funded by the National Energy Technology Laboratory (NETL) of the U.S. Department of Energy (DOE). Two test problem sets dealing with enhanced CBM (ECBM) recovery with pure CO2 injection in an inverted five-spot pattern are selected for comparison. The intent is to exercise many of the existing or newly developed features of the simulators that are of practical and theoretical interest for the ECBM recovery process. The first problem set investigates the effect of gas desorption time (or gas diffusion) between the coal matrix and the natural fracture system; and the second problem set investigates the effect of natural fracture permeability changes as a function of natural fracture pressure (Palmer and Mansoori theory) and adsorbed gas content (i.e., coal shrinkage/swelling). Six numerical simulators have participated in the comparison study: (1) GEM, Computer Modelling Group (CMG) Ltd., Canada; (2) ECLIPSE, Schlumberger GeoQuest, U.K.; (3) COMET 2, Advanced Resources International (ARI), U.S.A.; (4) SIMED II, Netherlands Institute of Applied Geoscience TNO, The Netherlands/Commonwealth Scientific and Industrial Research Organization (CSIRO), Australia; (5) GCOMP, BP-Amoco, U.S.A., and (6) METSIM 2, Imperial College, U.K. Introduction The injection of carbon dioxide (CO2), a greenhouse gas (GHG), in coalbeds is probably one of the more attractive options of all underground CO2 storage possibilities: the CO2 is stored and at the same time the recovery of coalbed methane (CBM) is enhanced [1]. The revenue of methane (CH4) production can offset the expenditures of the storage operation [2,3].
1
Coalbeds form complex gas reservoirs characterized by their dual porosity; they contain both primary and secondary porosity systems. The primary porosity (i.e., coal matrix) system contains the vast majority of the gas-in-place volume while the secondary porosity (i.e., natural fracture) system provides the conduit for mass transfer to production wells. Coal matrix gas storage is dominated by adsorption. The coal matrix is relatively impermeable due to the small pore size. Mass transfer for each gas molecular species is dominated by diffusion that is driven by the concentration gradient. Flow through the natural fracture system is dominated by Darcy flow that relates flow rate to permeability and pressure gradient. The conventional primary CBM recovery process begins with a production well that is often stimulated by hydraulic fracturing to connect the wellbore to the coal natural fracture system via an induced fracture. When the pressure in the well is reduced by opening the well on the surface or by pumping water from the well, the pressure in the induced fracture is reduced which in turn reduces the pressure in the coal natural fracture system. Gas and water begin moving through the natural and induced fractures in the direction of decreasing pressure. When the pressure in the natural fracture system drops, gas molecules desorb from the coal matrix-natural fracture interface and are released into the natural fracture system. As a result, the adsorbed gas concentration in the coal matrix near the natural fractures is reduced. This reduction creates a concentration gradient that results in mass transfer by diffusion from the coal matrix to the natural fracture system. Adsorbed gas continues to be released as the pressure is reduced. When CO2 (which is more strongly adsorbable than CH4) is injected into the coal natural fracture system during the CO2 storage process, it is preferentially adsorbed into the coal matrix. Upon adsorption, the CO2 drives CH4 from the coal matrix into the natural fracture system. The pressure in the natural fracture system is increased due to CO2 injection and the CH4 flows to production wells. The CO2 is stored in-situ and is not produced unless the injected gas front reaches the production wells. The process, in general, is terminated at CO2 breakthrough. A full understanding of all of the complex process mechanisms involved in the CO2 storage process in which CO2 is injected into the coalbed to replace the adsorbed CH4, is essential to test and evaluate the ability of the numerical simulators to model this process. The objective of this study of comparison of numerical simulators is to provide the incentive to improve existing CBM simulators for capability and performance assessment of the GHG storage processes. This paper describes the third part of the study for CO2 storage in coalbeds with more complex problems investigating the effects of gas desorption time (or gas diffusion) between the coal matrix and the natural fracture system; and natural fracture permeability changes as a function of natural fracture pressure and adsorbed gas content (i.e., coal shrinkage/swelling). The first and second parts of the study are with simple problems, which ignore the aforementioned complex mechanisms. The comparison results for Parts I and II with pure CO2 and flue gas injection, respectively, have been described in details by Law et al. [4-6] and also available on the Internet at http://www.arc.ab.ca/extranet/ecbm (password can be obtained by contacting the first author at [email protected]). Descriptions of CBM Numerical Simulators Existing CBM numerical simulators have been developed to model primary CBM recovery taken into account of many important features such as:
1. dual porosity nature of coalbed; 2. Darcy flows of gas and water (i.e., multiphase flow) in the natural fracture system;
2
3. diffusion of pure gas from coal matrix to the natural fracture system; 4. adsorption/desorption of pure gas at the coal surface; and 5. coal matrix shrinkage due to gas desorption.
However, process mechanisms become more complex with CO2 or flue gas injection. Law et al. [7] have suggested that improvements on the numerical simulators are needed to consider the additional features such as:
1. capability to handle multiple gas components (e.g., three or more components: CH4, CO2 and N2);
2. coal matrix swelling due to CO2 adsorption on coal surface; 3. diffusion of mixed gas between coal matrix and natural fracture system; 4. adsorption/desorption of mixed gas at the coal surface; 5. non-isothermal effect due to difference in temperatures between coalbed and injected
gases; and 6. water movement between coal matrix and natural fracture system.
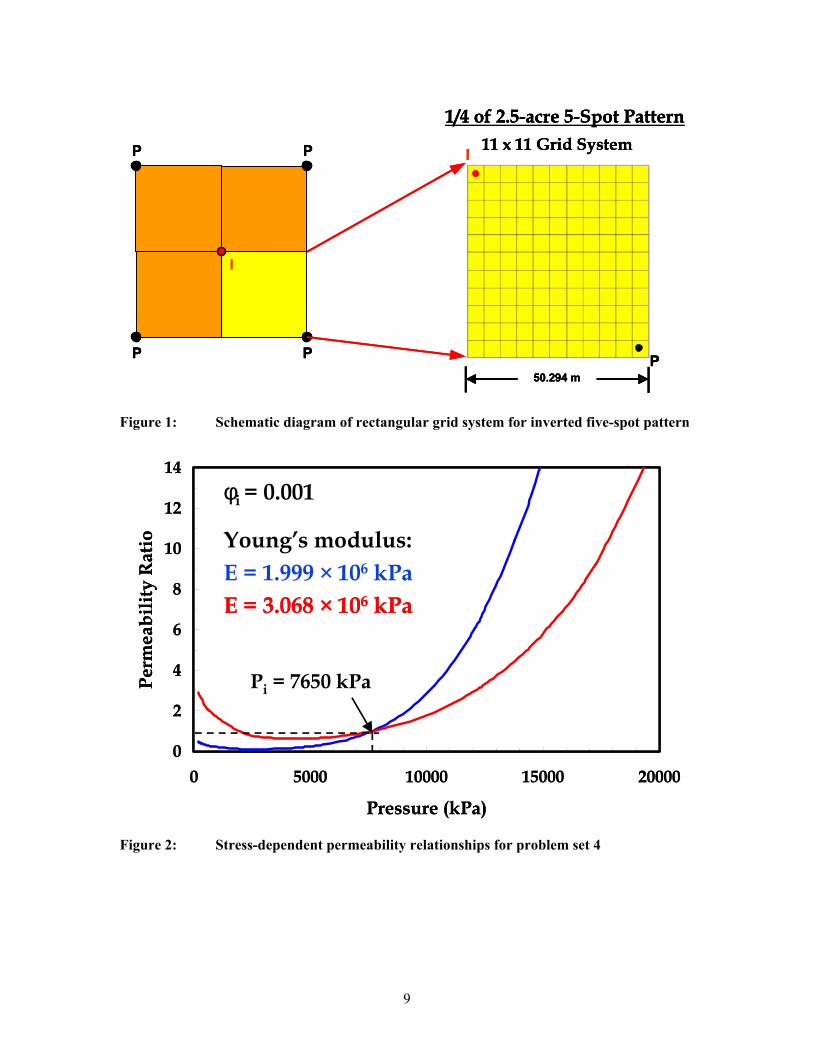
Six numerical simulators have made the necessary improvements and participated in the third part of the comparison study: (1) GEM, Computer Modelling Group (CMG) Ltd., Canada; (2) ECLIPSE, Schlumberger GeoQuest, U.K.; (3) COMET 2, Advanced Resources International (ARI), U.S.A.; (4) SIMED II, Netherlands Institute of Applied Geoscience TNO, The Netherlands/Commonwealth Scientific and Industrial Research Organization (CSIRO), Australia; (5) GCOMP, BP-Amoco, U.S.A., and (6) METSIM 2, Imperial College, U.K. Descriptions of Test Problem Sets Two test problem sets, which are the extensions of the similar problem set in the first part of the study dealing with enhanced CBM (ECBM) recovery with pure CO2 injection in an inverted five-spot pattern (see Figure 1), are selected for comparison. A complete description of the two problem sets as offered to the participants is available on the Internet at http://www.arc.ab.ca/extranet/ecbm. The coalbed characteristics also given in details by Law et al. [5] are the same for both problem sets. These test problems do not necessary represent real field situations. The first problem set (problem set 3) investigates the effect of gas desorption time (or gas diffusion) between the coal matrix and the natural fracture system. The gas desorption time is defined by the following equation:
cdes
Dt
σ=1 (1)
and
++= 222
1114zyx lll
σ (2)
where: Dc: diffusion coefficient, [m2/d or ft2/d] lx,ly,lz: fracture spacing, [m or ft] tdes: desorption time constant, [day] σ: geometric factor, [1/m2 or 1/ft2]
3
The gas desorption times suggested for the comparison study are 38.6 and 77.2 days (see Table 1) for both CH4 and CO2. A longer gas desorption time corresponds to a slower diffusive gas flow between coal matrix and natural fracture system. A baseline case (problem 2 in Table 1) which is one of the problems used in the first part of the study [4,5], used a very short gas desorption time in the order of 10-3 days or 0 day to mimic instantaneous gas flow between coal matrix and natural fractures. The second problem set (problem set 4) investigates the effect of natural fracture permeability changes as a function of natural fracture pressure and adsorbed gas content (i.e., coal shrinkage/swelling). Palmer and Mansoori [8] have presented a theory for calculating pore volume compressibility and permeability in coals as a function of effective stress and matrix shrinkage using the following equation for permeability ratio:
+
−+
−+−+=
LL
i
i
L
i
i
i ppp
PPP
MK
Mpp
kk 11
31
φε
φ (3)
and
−+=
νν
11
31
MK
(4)
( )( )ννν
2111
−+−= EM (5)
where: E Young’s modulus, [kPa or psia] k absolute permeability, [md] ki initial absolute permeability, [md] K Bulk modulus, [kPa or psia] M constrained axial modulus, [kPa or psia] p pressure of the free gas phase, [kPa or psia] pi initial pressure of the free gas phase, [kPa or psia]
pL Langmuir pressure, [kPa or psia] εL volumetric strain change due to matrix shrinkage, dimensionless ν Poisson’s ratio φ porosity, fraction φi initial porosity, fraction
For simplicity, it is assumed that the porosity ratio, φ/φi = 1 for the comparison study. The parameters used in Equations (3) to (5) suggested for the comparison study are given in Table 2. The corresponding stress-dependent permeability relationships are plotted in Figure 2. For E = 3.068 × 10⁶ kPa, there is significant permeability rebound due to coal matrix shrinkage when pressure decreases and CH4 is being desorbed. On the other hand, for E = 1.999 × 10⁶ kPa, permeability rebound is nonexistent, because stress effects dominate over coal matrix shrinkage in this case. The same baseline case in problem set 3 is used to represent no effect of stress and matrix shrinkage/swelling on the natural fracture permeability. The authors have worked very closely with various software developers to compare their CBM simulators and identify/recommend areas of improvement. In fact, most of the numerical runs using GEM, ECLIPSE, SIMED II and GCOMP in this comparison study are conducted in ARC and TNO with the help of the software developers to ensure that the final results are the best representatives of their simulators. Alternatively, participants such as ARI and Imperial College
4
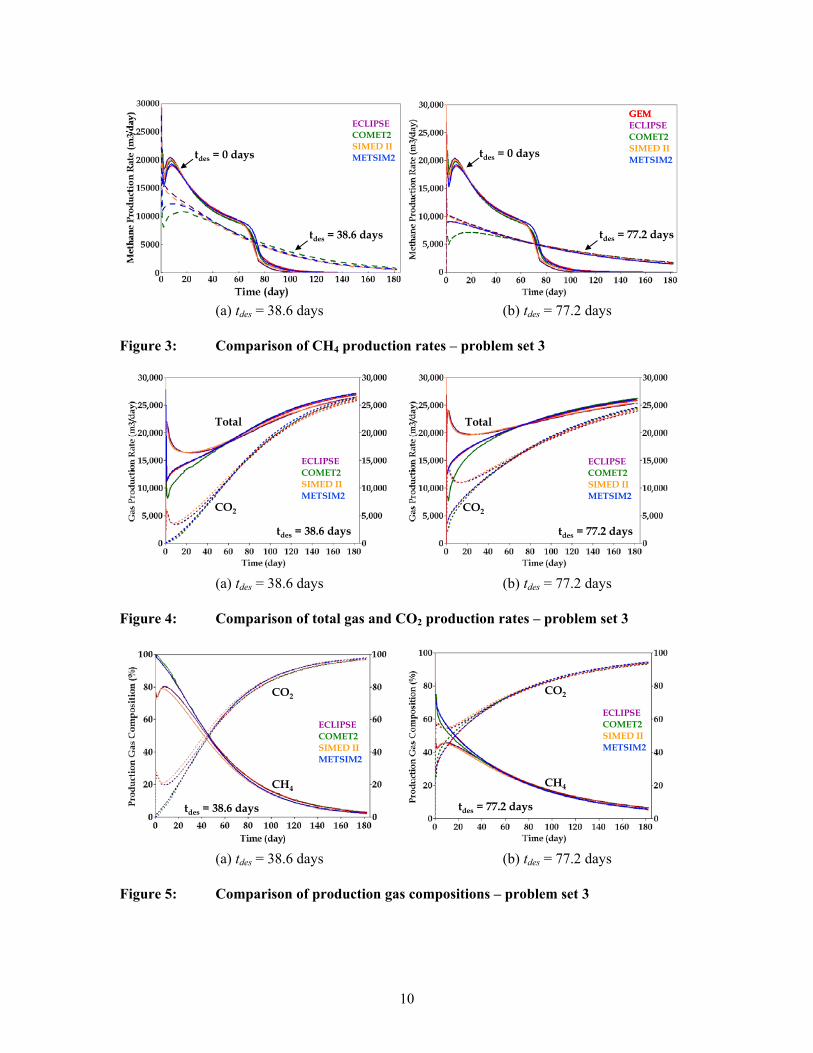
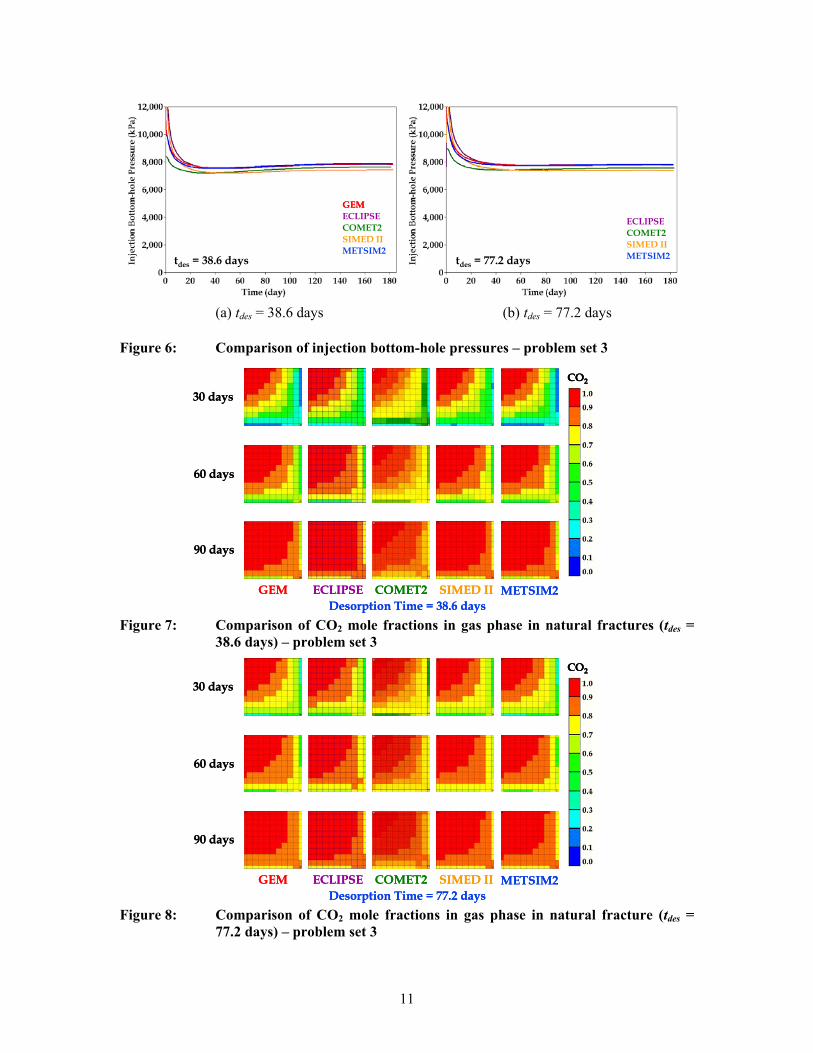
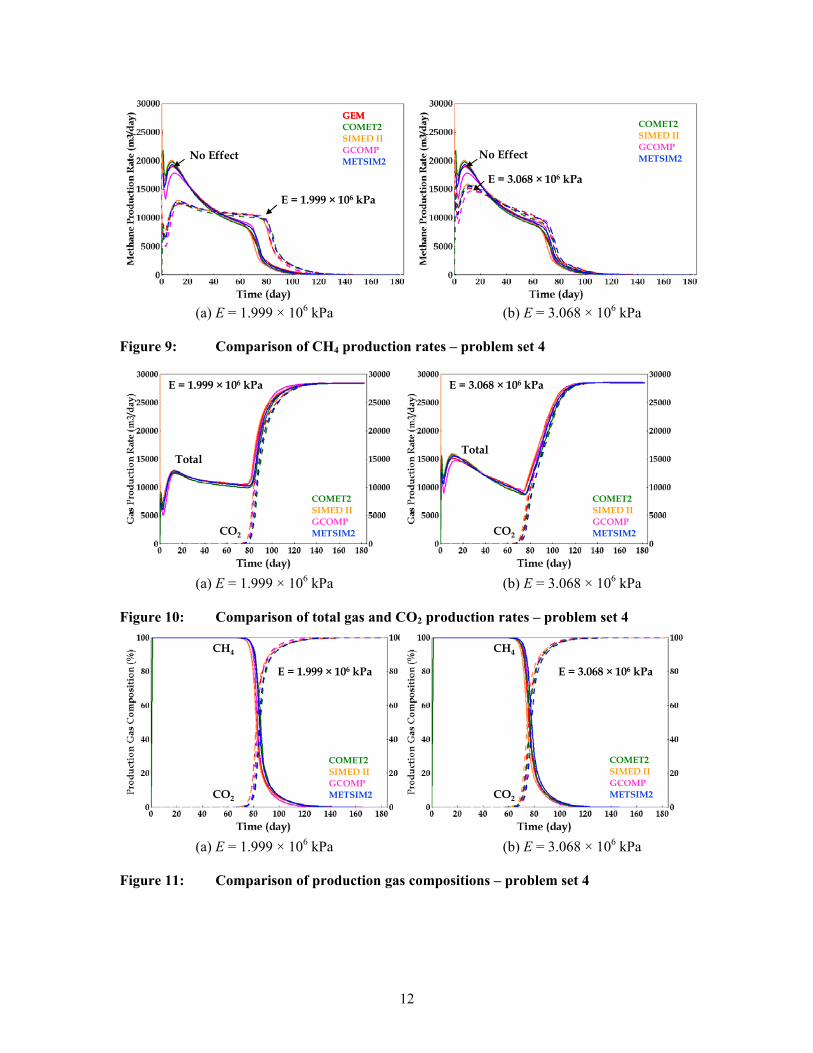
chose to model and study the test problems using their own CBM simulators, COMET 2 and METSIM 2, respectively, with frequent communication with ARC. Numerical Results All participants are asked to provide the initial gas-in-place (IGIP) (i.e., total adsorbed and free gas amounts of CH4 in the coalbed) in their simulation as the first screen of errors in input entry. A list of the initial gas-in-place for the problem sets (i.e., same for problem sets 3 and 4) for the six CBM simulators is given in Table 3. It is found that there is good agreement within a few percent errors between different CBM simulators. Furthermore, a five-point differencing scheme is recommended for the 5-spot pattern simulation, mainly because the more complex nine-point differencing scheme cannot be handled by the dual porosity approach used in some CBM simulators. GCOMP did not participate in problem set 3 mainly because only the single porosity version is available for this comparison study; hence, it cannot model diffusive gas flow between the coal matrix and natural fracture. On the other hand, ECLIPSE did not participate in problem set 4. All well data presented are on a full-well basis and pattern results are for the full 5-spot pattern consisting of four one-quarter producers and one full injector (see Figure 1). Problem Set 3 Figure 3 shows a comparison of CH4 production rates as functions of time for the cases of tdes = 38.6 and 77.2 days. Also shown in Figure 3 is the comparison for the baseline case with tdes = 0 day which represents instantaneous gas flow between coal matrix and natural fracture. It is noted that the longer the CH4 desorption time, results in the lower initial CH4 production rate mainly because it takes longer time for the CH4 to desorb and flow to the natural fracture. Figures 4 and 5 show comparisons of total gas/CO2 production rates and production gas compositions as functions of time for the cases of tdes = 38.6 and 77.2 days, respectively. It is noted that the longer the CO2 desorption time, results in the earlier CO2 breakthrough at the producer mainly it takes longer time for the CO2 to flow by diffusion from natural fracture into the coal matrix and being adsorbed. In this case, CO2 acts more like a weakly adsorbable gas. Figure 6 shows a comparison of injection bottom-hole pressures for the cases of tdes = 38.6 and 77.2 days. As CO2 acts like a weakly adsorbable gas for the case of tdes = 77.2 days, the injection bottom-hole pressure for this case is slightly higher than that for the case of tdes = 38.6 days. Figures 7 and 8 show comparisons of CO2 distribution as the CO2 mole fraction in the gas phase in the natural fracture system after 30, 60 and 90 days for the cases of tdes = 38.6 and 77.2 days, respectively. The contour plots represent a ¼ of the 5-spot pattern with injector located at the upper left-hand corner and the producer located at the lower right-hand corner. The longer the CO2 desorption time, results in faster propagation of the CO2 towards the producer, hence, the earlier CO2 breakthrough. Problem Set 4 Figure 9 shows a comparison of CH4 production rates as functions of time for the cases of E = 1.999 × 10⁶ and 3.068 × 10⁶ kPa. Also shown in Figure 9 is the comparison for the baseline case with no effect of stress and matrix shrinkage/swelling on the natural fracture permeability. It is
5
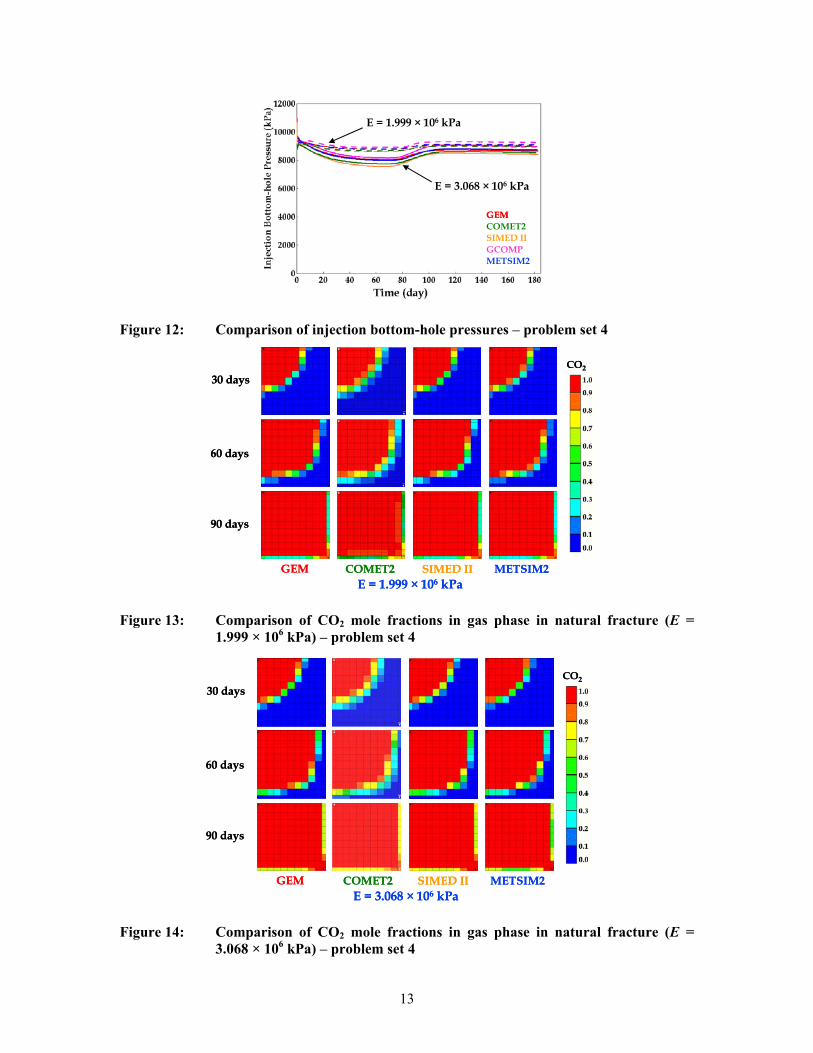
noted that for the case of E = 1.999 × 10⁶, the lower initial CH4 production rate is mainly due to the more compaction effect (i.e., reduction of natural fracture permeability) near the producer when the pressure decreases (see Figure 2). Figures 10 and 11 show comparisons of total gas/CO2 production rates and production gas compositions as functions of time for the cases of E = 1.999 × 10⁶ and 3.068 × 10⁶ kPa, respectively. It is noted that CO2 breakthrough is slightly faster for the case of E = 3.068 × 10⁶ kPa than for the case of E = 1.999 × 10⁶ kPa. As the dilation effect (i.e., increase in natural fracture permeability) is slightly more significant for the case of E = 1.999 × 10⁶ kPa when pressure increases near the injector (see Figure 2), one should anticipate that CO2 would propagate further towards the producer for this case, hence, faster CO2 breakthrough. Contrarily, it appears the permeability rebound and less compaction effect near the producer when pressure decreases for the case of E = 3.068 × 10⁶ kPa (see Figure 2) allows the CO2 to breakthrough faster. Figure 12 shows a comparison of injection bottom-hole pressures for the cases of E = 1.999 × 10⁶ and 3.068 × 10⁶ kPa. With the injection pressure less than 10,000 kPa, the compaction effect near the producer is more dominate than the dilation effect near the injector as mentioned above, which results in the higher injection pressure for the case of E = 1.999 × 10⁶ kPa. Figures 13 and 14 show comparisons of CO2 distribution as the CO2 mole fraction in the gas phase in the natural fracture system after 30, 60 and 90 days for the cases of E = 1.999 × 10⁶ and 3.068 × 10⁶ kPa. The contour plots appear quite similar for both cases. Discussion In general, there is very good agreement between the results from the different CBM simulators except during the early stage (< 40 days) for problem set 3. It is believed that the good agreement between the results at the later stage (> 40 days) rules out any input errors. The differences between the predictions from different simulators may result for a variety of reasons:
• possible different initialization procedure (e.g, initial gas-in-place); • possible different dual porosity approach in the simulators; • possible different diffusion model in the simulators; • handling of wells (e.g., ¼ well in 5-spot pattern); • tolerance on the convergence of iterations; and • selection of numerical control parameters.
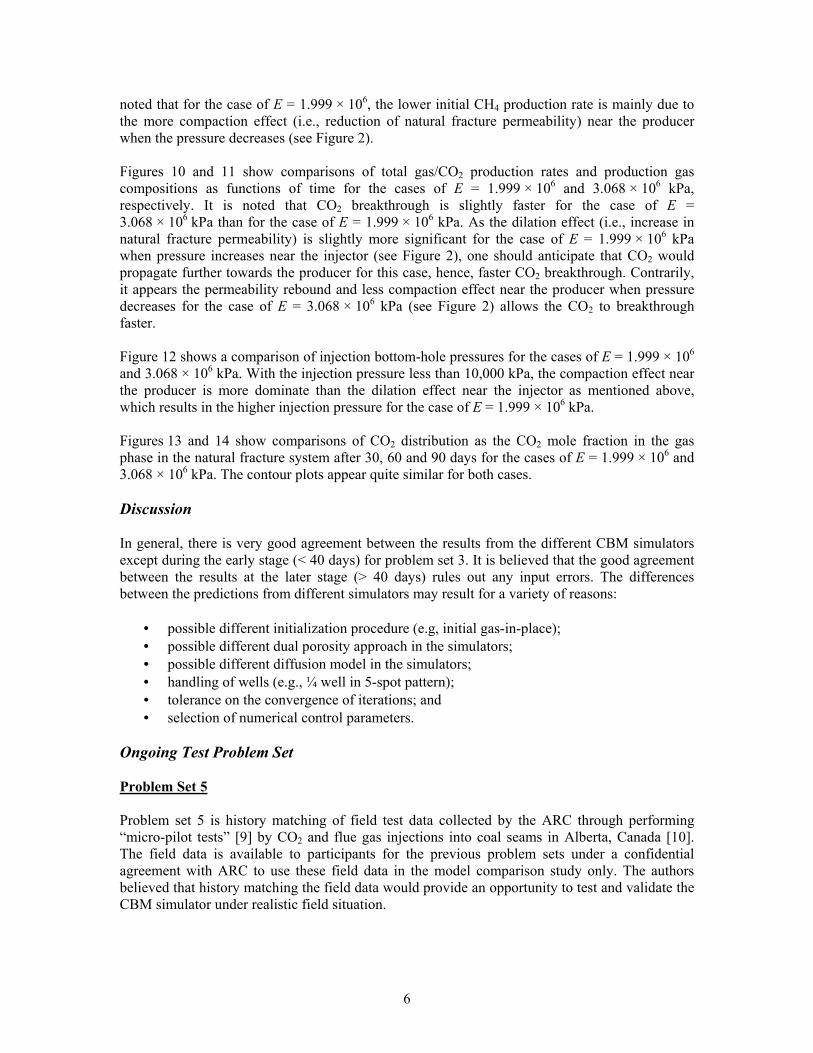
Ongoing Test Problem Set Problem Set 5 Problem set 5 is history matching of field test data collected by the ARC through performing “micro-pilot tests” [9] by CO2 and flue gas injections into coal seams in Alberta, Canada [10]. The field data is available to participants for the previous problem sets under a confidential agreement with ARC to use these field data in the model comparison study only. The authors believed that history matching the field data would provide an opportunity to test and validate the CBM simulator under realistic field situation.
6
Acknowledgement This study was supported by the University of California Ernest Orlando Lawrence Berkeley National Laboratory (LBNL) under the Contract LBNL No. 6502754 as part of the GEO-SEQ Project funded by the National Energy Technology Laboratory (NETL) of the U.S. Department of Energy (DOE). The authors would like to thank the following people for their helpful discussions and/or participation in this study: (1) GEM: Peter Sammon, Long Nghiem and Mohamed Hassam, Computer Modelling Group (CMG) Ltd., Calgary, Alberta, Canada; (2) ECLIPSE: Jim Bennett, Schlumberger GeoQuest, Abingdon, Oxon, U.K. and Sridhar Srinivassen, previously Schlumberger GeoQuest, Calgary, Alberta Canada; (32) COMET 2: Larry Pekot, Advanced Resources International (ARI), Arlington, Virginia, U.S.A. and Scott Reeves, ARI, Houston, Texas, U.S.A.; (4) SIMED II: Xavior Choi, Commonwealth Scientific and Industrial Research Organization (CSIRO), Kinnoull Grove, Syndal, Victoria, Australia; (5) GCOMP: John Mansoori, previously BP, Houston, Texas, U.S.A. and Mel Miner, Marlet Consulting, Calgary, Alberta, Canada; (6) METSIM 2: Ji Quan Shi and Sevket Durucan, Imperial College, London, U.K. References 1. Gunter, W.D., Gentzis, T., Rottenfusser, B.A. and Richardson, R.J.H. (1997) “Deep
Coalbed Methane in Alberta, Canada: A Fuel Resource with The Potential of Zero Greenhouse Gas Emissions,” Energy Convers. Mgmt, 38, Suppl., S217-S222.
2. Wong, S., Gunter, W.D. and Mavor, M.J. (2000) “Economics of CO2 Sequestration in Coalbed Methane Reservoirs,” Proceedings of SPE/CERI Gas Technology Symposium 2000, Paper SPE 59785, Calgary, Alberta, Canada, April 3-5, 631-638.
3. Wong, S., Gunter, W.D., Law, D.H.-S. and Mavor, M.J. (2000) “Flue Gas Injection and CO2 Sequestration in Coalbed Methane Reservoirs, Economic Considerations,” presented at The 5th International Conference on Greenhouse Gas Control Technologies (GHGT-5), Cairns, Australia, August 13-16.
4. Law, D.H.-S., van der Meer, L.G.H. and Gunter, W.D. (2001) “Comparison of Numerical Simulators for Greenhouse Gas Storage in Coalbeds, Part I: Pure Carbon Dioxide Injection,” presented at The 1st National Conference on Carbon Sequestration, Washington, D.C., U.S.A., May 14-17.
5. Law, D.H.-S., van der Meer, L.G.H. and Gunter, W.D. (2002) “Numerical Simulator Comparison Study for Enhanced Coalbed Methane Recovery Processes, Part I: Pure Carbon Dioxide Injection,” Paper SPE 75669 presented at The SPE Gas Technology Symposium, Calgary, Alberta, Canada, April 30-May 2.
6. Law, D.H.-S., van der Meer, L.G.H. and Gunter, W.D. (2002) “Comparison of Numerical Simulators for Greenhouse Gas Storage in Coalbeds, Part II: Flue Gas Injection,” presented at The 6th International Conference on Greenhouse Gas Control Technologies (GHGT-6), Kyoto, Japan, October 1-4.
7. Law, D.H.-S., van der Meer, L.G.H. and Gunter, W.D. (2000) “Modelling of Carbon Dioxide Sequestration in Coalbeds: A Numerical Challenge,” presented at The 5th International Conference on Greenhouse Gas Control Technologies (GHGT-5), Cairns, Australia, August 13-16.
8. Palmer, I. And Mansoori, J. (1996) “How Permeability Depends on Stress and Pore Pressure in Coalbeds: A New Model,” Paper SPE 36737 presented at the 1996 SPE Annual Technical Conference and Exhibition, Denver, Colorado, U.S.A., October 6-9.
7
9. Puri, R., Voltz, R. and Duhrkopf, D. (1995) “A Micro-Pilot Approach to Coalbed Methane Reservoir Assessment,” Proceedings of Intergas 95, University of Alabama/Tuscaloosa, Paper 9556, Tuscaloosa, Alabama, U.S.A., May 15-19, 265-274.
10. Wong, S. and Gunter, W.D. (1999) “Testing CO2 Enhanced Coalbed Methane Recovery,” Greenhouse Issues, IEA Greenhouse Gas R&D Programme, 45, November 1-3.
Table 1: Desorption time constants used in problem set 3
Gas Desorption Time Problem (day)
2 Very short 3 77.2
3C 38.6 Table 2: Parameters for Palmer and Mansoori theory used in problem set 4
Parameters Problem 4 Problem 4A
Initial Porosity, φi 0.001 0.001 kPa psia kPa psia Initial Pressure, pi 7650 1109.5 7650 1109.5
Poisson’s Ratio, ν 0.39 0.39 kPa psia kPa psia Young’s modulus, E
1.999 × 10⁶ 2.900 × 10⁵ 3.068 × 10⁶ 4.450 × 10⁵ kPa psia kPa psia Langmuir Pressure, pL
4688.5 680 4688.5 680 Volumetric Strain Change
due to Matrix Shrinkage, εL 0.01176 0.01176
Table 3: Initial gas-in-place for different CBM simulators
Initial gas-in-Place (sm3) – ¼ 2.5 acres 5-Spot Pattern
GEM ECLIPSE COMET 2 SIMED II GCOMP METSIM 2
2.3997 x 10⁵ 2.3925 x 10⁵ 2.3900 x 10⁵ 2.3993 x 10⁵ 2.3380 x 10⁵ 2.3943 x 10⁵
8
I
PP
P P P
I
50.294 m
1/4 of 2.5-acre 5-Spot Pattern11 x 11 Grid System
I
PP
P P
I
PP
P P P
I
50.294 m
1/4 of 2.5-acre 5-Spot Pattern11 x 11 Grid System
P
I
50.294 m
1/4 of 2.5-acre 5-Spot Pattern11 x 11 Grid System
Figure 1: Schematic diagram of rectangular grid system for inverted five-spot pattern
0
2
4
6
8
10
12
14
0 5000 10000 15000 20000
Pressure (kPa)
Perm
eabi
lity
Rat
io
φi = 0.001
Young’s modulus:E = 1.999 × 10⁶ kPa
Pi = 7650 kPa
0
2
4
6
8
10
12
14
0 5000 10000 15000 20000
Pressure (kPa)
Perm
eabi
lity
Rat
io
φi = 0.001
Young’s modulus:E = 1.999 × 10⁶ kPa
Pi = 7650 kPa
E = 3.068 × 10⁶ kPaE = 3.068 × 10⁶ kPa
Figure 2: Stress-dependent permeability relationships for problem set 4
9
tdes = 77.2 days
ECLIPSECOMET2SIMED IIMETSIM2tdes = 0 days
tdes = 77.2 days
ECLIPSECOMET2SIMED IIMETSIM2tdes = 0 days
(a) tdes = 38.6 days (b) tdes = 77.2 days Figure 3: Comparison of CH4 production rates – problem set 3
(a) tdes = 38.6 days (b) tdes = 77.2 days Figure 4: Comparison of total gas and CO2 production rates – problem set 3
GEMGEMGEMGEM
GEMGEM GEMGEM
GEMGEMGEMGEM
tdes = 38.6 days
ECLIPSECOMET2SIMED IIMETSIM2tdes = 0 days
tdes = 38.6 days
ECLIPSECOMET2SIMED IIMETSIM2tdes = 0 days
tdes = 38.6 days
ECLIPSECOMET2SIMED IIMETSIM2
CO2
Total
tdes = 38.6 days
ECLIPSECOMET2SIMED IIMETSIM2
CO2
Total
tdes = 77.2 days
ECLIPSECOMET2SIMED IIMETSIM2
CO2
Total
tdes = 77.2 days
ECLIPSECOMET2SIMED IIMETSIM2
CO2
Total
tdes = 77.2 days
ECLIPSECOMET2SIMED IIMETSIM2
CO2
CH4
tdes = 77.2 days
ECLIPSECOMET2SIMED IIMETSIM2
CO2
CH4
tdes = 38.6 days
ECLIPSECOMET2SIMED IIMETSIM2
CO2
CH4
tdes = 38.6 days
ECLIPSECOMET2SIMED IIMETSIM2
CO2
CH4
(a) tdes = 38.6 days (b) tdes = 77.2 days Figure 5: Comparison of production gas compositions – problem set 3
10
tdes = 38.6 days
ECLIPSECOMET2SIMED IIMETSIM2
tdes = 38.6 days
ECLIPSECOMET2SIMED IIMETSIM2
(a) tdes = 38.6 days (b) tdes = 77.2 days Figure 6: Comparison of injection bottom-hole pressures – problem set 3
Figure 7: Comparison of CO2 mole fractions in gas phase in natural fractures (tdes = 38.6 days) – problem set 3
GEMGEM GEMGEM
GEMGEM
GEMGEM
tdes = 77.2 days
ECLIPSECOMET2SIMED IIMETSIM2tdes = 77.2 days
ECLIPSECOMET2SIMED IIMETSIM2
ECLIPSE COMET2 SIMED II
30 days
60 days
90 days
CO2
METSIM2Desorption Time = 38.6 days
ECLIPSE COMET2 SIMED II
30 days
60 days
90 days
CO2CO2
METSIM2Desorption Time = 38.6 days
ECLIPSE COMET2 SIMED II
30 days
60 days
90 days
CO2
METSIM2Desorption Time = 77.2 days
ECLIPSE COMET2 SIMED II
30 days
60 days
90 days
CO2CO2
METSIM2Desorption Time = 77.2 days
Figure 8: Comparison of CO2 mole fractions in gas phase in natural fracture (tdes = 77.2 days) – problem set 3
11
No Effect
E = 1.999 × 10⁶ kPa
COMET2SIMED IIGCOMPMETSIM2No Effect
E = 1.999 × 10⁶ kPa
COMET2SIMED IIGCOMPMETSIM2
(a) E = 1.999 × 10⁶ kPa (b) E = 3.068 × 10⁶ kPa Figure 9: Comparison of CH4 production rates – problem set 4
(a) E = 1.999 × 10⁶ kPa (b) E = 3.068 × 10⁶ kPa Figure 10: Comparison of total gas and CO2 production rates – problem set 4
GEMGEM GEMGEM
GEMGEM GEMGEM
GEMGEM GEMGEM
No Effect
E = 3.068 × 10⁶ kPa
COMET2SIMED IIGCOMPMETSIM2No Effect
E = 3.068 × 10⁶ kPa
COMET2SIMED IIGCOMPMETSIM2
CO2
Total
E = 1.999 × 10⁶ kPa
COMET2SIMED IIGCOMPMETSIM2CO2
Total
E = 1.999 × 10⁶ kPa
COMET2SIMED IIGCOMPMETSIM2 CO2
Total
E = 3.068 × 10⁶ kPa
COMET2SIMED IIGCOMPMETSIM2CO2
Total
E = 3.068 × 10⁶ kPa
COMET2SIMED IIGCOMPMETSIM2
CO2
CH4
E = 1.999 × 10⁶ kPa
COMET2SIMED IIGCOMPMETSIM2CO2
CH4
E = 1.999 × 10⁶ kPa
COMET2SIMED IIGCOMPMETSIM2 CO2
CH4
E = 3.068 × 10⁶ kPa
COMET2SIMED IIGCOMPMETSIM2CO2
CH4
E = 3.068 × 10⁶ kPa
COMET2SIMED IIGCOMPMETSIM2
(a) E = 1.999 × 10⁶ kPa (b) E = 3.068 × 10⁶ kPa Figure 11: Comparison of production gas compositions – problem set 4
12
E = 3.068 × 10⁶ kPa
E = 1.999 × 10⁶ kPa
COMET2SIMED IIGCOMPMETSIM2
E = 3.068 × 10⁶ kPa
E = 1.999 × 10⁶ kPa
COMET2SIMED IIGCOMPMETSIM2
13
Figure 12: Comparison of injection bottom-hole pressures – problem set 4
Figure 13: Comparison of CO2 mole fractions in gas phase in natural fracture (E =
1.999 × 10⁶ kPa) – problem set 4
GEMGEM
GEMGEM
GEMGEM
30 days
60 days
90 days
CO2
COMET2 METSIM2SIMED IIE = 1.999 × 10⁶ kPa
30 days
60 days
90 days
CO2
COMET2 METSIM2SIMED IIE = 1.999 × 10⁶ kPa
30 days
60 days
90 days
CO2
COMET2 METSIM2SIMED IIE = 3.068 × 10⁶ kPa
30 days
60 days
90 days
CO2
COMET2 METSIM2SIMED IIE = 3.068 × 10⁶ kPa
Figure 14: Comparison of CO2 mole fractions in gas phase in natural fracture (E =
3.068 × 10⁶ kPa) – problem set 4