Embed Size (px)
Citation preview
COMPARISON OF NON-METALLIC TO METALLIC LATH REINFORCEMENT IN STUCCO CLADDING SYSTEMS
By
PATRICK MURRAY
A THESIS PRESENTED TO THE GRADUATE SCHOOL OF THE UNIVERSITY OF FLORIDA IN PARTIAL FULFILLMENT
OF THE REQUIREMENTS FOR THE DEGREE OF MASTER OF SCIENCE IN BUILDING CONSTRUCTION
UNIVERSITY OF FLORIDA
2006

Copyright 2006
by
Patrick Murray

iii
ACKNOWLEDGMENTS
I would like to thank my committee for their continued guidance and support
throughout the research process. Most of all I thank my family for their support while I
was at the University of Florida. I would like to thank my brother Charles Murray for his
dedication to the family which enabled me to pursue my degree. I thank Halbert Pipe &
Steel Company for their assistance in fabrication of testing equipment. I would also like
to thank Gary Milam for his guidance and wisdom.
iv
TABLE OF CONTENTS page
ACKNOWLEDGMENTS ................................................................................................. iii
LIST OF TABLES............................................................................................................ vii
LIST OF FIGURES ........................................................................................................... ix
CHAPTER
1 INTRODUCTION ........................................................................................................1
Three-Coat Stucco Systems..........................................................................................1 One-Coat Stucco Systems.............................................................................................2 Lathing..........................................................................................................................2 Research Objectives......................................................................................................3
2 LITERATURE REVIEW .............................................................................................4
Introduction...................................................................................................................4 Fiber Reinforced Concrete, Mortar, and Exterior Plaster.............................................5 Background of Glass Fiber Reinforcement in Concrete...............................................7 Portland Cement Stucco/Exterior Plaster .....................................................................8
Reinforcement/Plaster Base for Portland Cement Stucco .....................................9 Non Metallic Reinforcement/Plaster Base for Portland Cement Stucco...............9
3 METHODOLOGY .....................................................................................................11
Sample Combination ..................................................................................................11 Sample Preparation.....................................................................................................12
Frame Building....................................................................................................12 Step 1............................................................................................................12 Step 2............................................................................................................12 Step 3............................................................................................................13 Step 4............................................................................................................13
Mixing/Placing/Curing Stucco ............................................................................13 Step 1............................................................................................................13 Step 2............................................................................................................13 Step 3............................................................................................................13
v
Step 4............................................................................................................14 Step 5............................................................................................................14
Cutting Samples...................................................................................................14 Test Methods ..............................................................................................................15 Testing Procedures......................................................................................................16
Third-point Flexure Testing ................................................................................16 Initial Crack Test .................................................................................................17 Impact Test ..........................................................................................................18
4 RESULTS...................................................................................................................29
Initial Cracking Deflection Test .................................................................................29 Average B/D Overlapped ....................................................................................30 Average C/E Non-Overlapped ............................................................................30
Third-point Flexural Test............................................................................................31 Average Overlapped Section Results and Interpretations ...................................31 Average C/E Non-Overlapped Section Results and Interpretations....................32 Sample 10 and 11 Results and Interpretations (1 Longitudinal& 2 Transverse
Overlaps)..........................................................................................................33 Impact Test .................................................................................................................33 Individual Stucco Reinforcement Comparisons .........................................................34
Permalath® 1-Coat Comparison ..........................................................................35 Permalath® 3-Coat Comparison ..........................................................................35 Metal Lath 1-Coat Comparison ...........................................................................35 Metal Lath 3-Coat Comparison ...........................................................................35 Metal Wire 1-Coat Comparison ..........................................................................35 Metal Wire 3-Coat Comparison ..........................................................................36
“Real World” Stucco Product Comparisons...............................................................36
5 CONCLUSIONS AND RECOMMENDATIONS.....................................................63
Conclusions.................................................................................................................63 One-Coat Systems ...............................................................................................63 Three-Coat Systems.............................................................................................64
Recommendations.......................................................................................................64
APPENDIX
A DRAWINGS OF THE SAMPLES.............................................................................66
B FLEXURE DATA AND GRAPHS............................................................................72
C PICTURES OF TENSILE FLEXURE CRACKS ......................................................86
D INITIAL CRACKING DEFLECTION/STRENGTH ................................................99
E CRACK ANALYSIS DATA....................................................................................105

vi
LIST OF REFERENCES.................................................................................................107
BIOGRAPHICAL SKETCH ...........................................................................................108
vii
LIST OF TABLES
Table page 3-1: Flexure and Initial Crack Samples Layout .................................................................19
3-2: Impact Samples Layout ..............................................................................................20
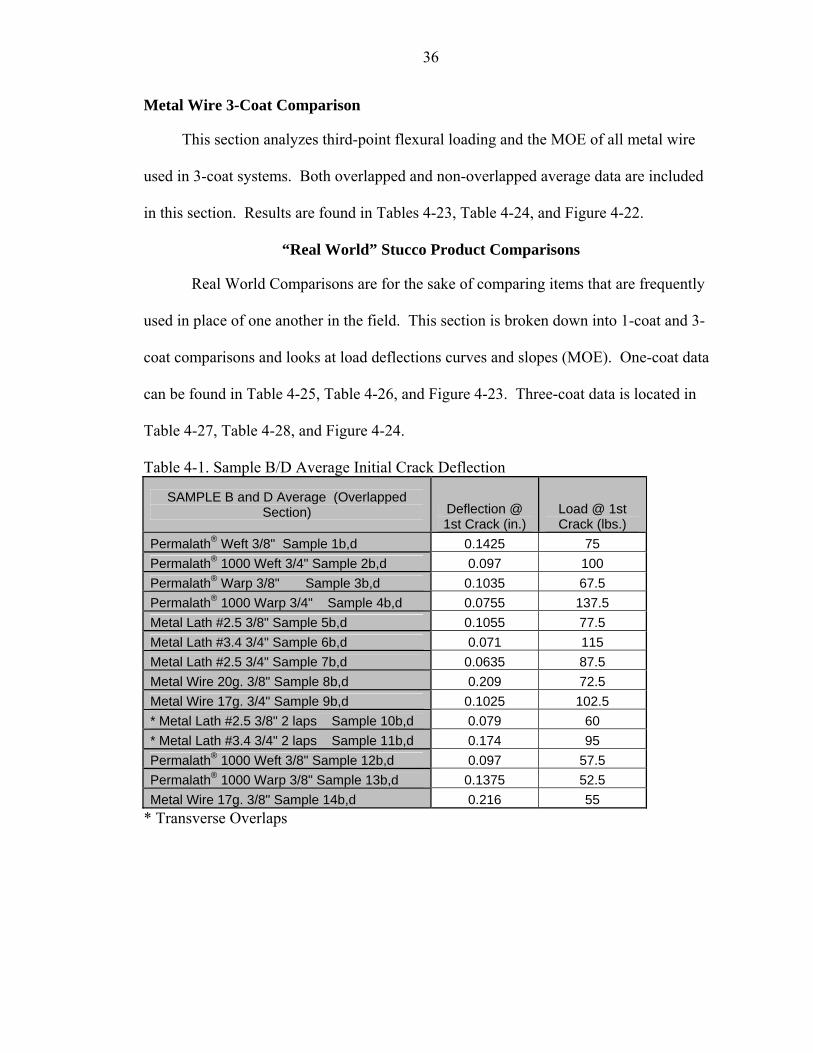
4-1. Sample B/D Average Initial Crack Deflection ...........................................................36
4-2. Sample C Initial Crack Deflection..............................................................................38
4-3. Sample B/D (overlapped) Average Load/Deflection .................................................39
4-4 Sample B/D Average Slope and R^2...........................................................................41
4-5 Sample B/D Average Crack Area................................................................................41
4-6. Sample C/E (non-overlapped) Average Load/Deflection ..........................................42
4-7. Sample C/E Average Slope and R^2 ..........................................................................44
4-8. Sample C/E Average Crack Area ...............................................................................44
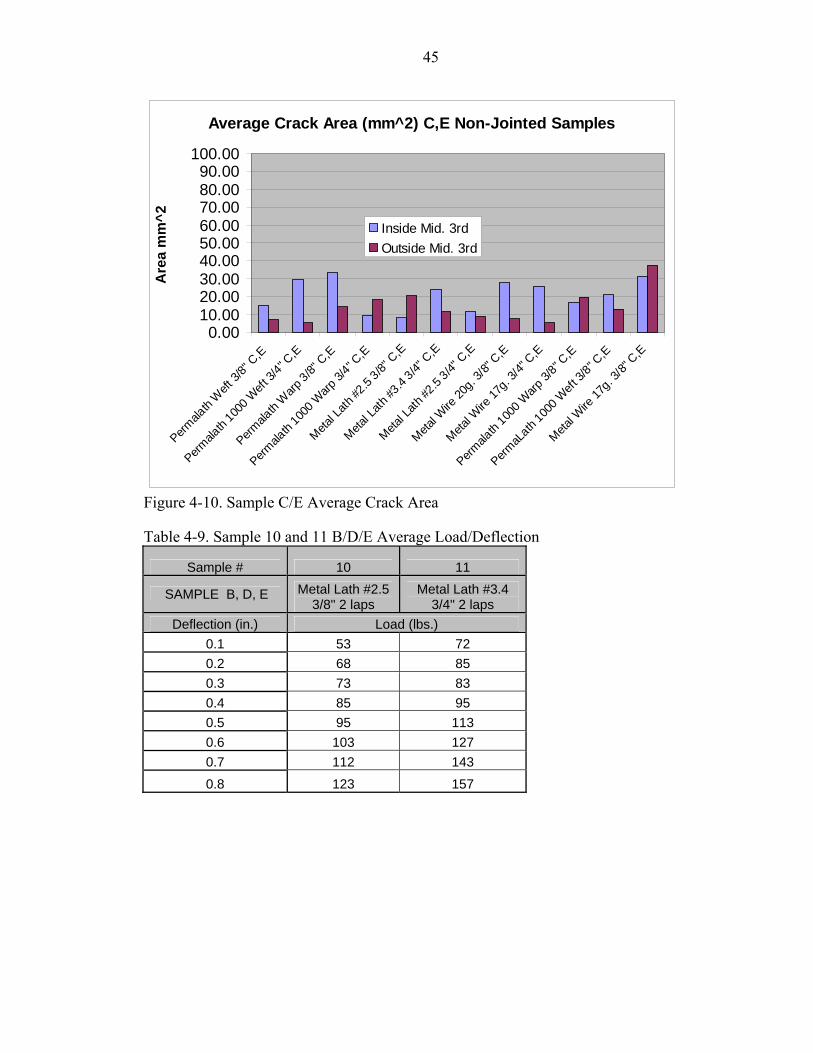
4-9. Sample 10 and 11 B/D/E Average Load/Deflection ..................................................45
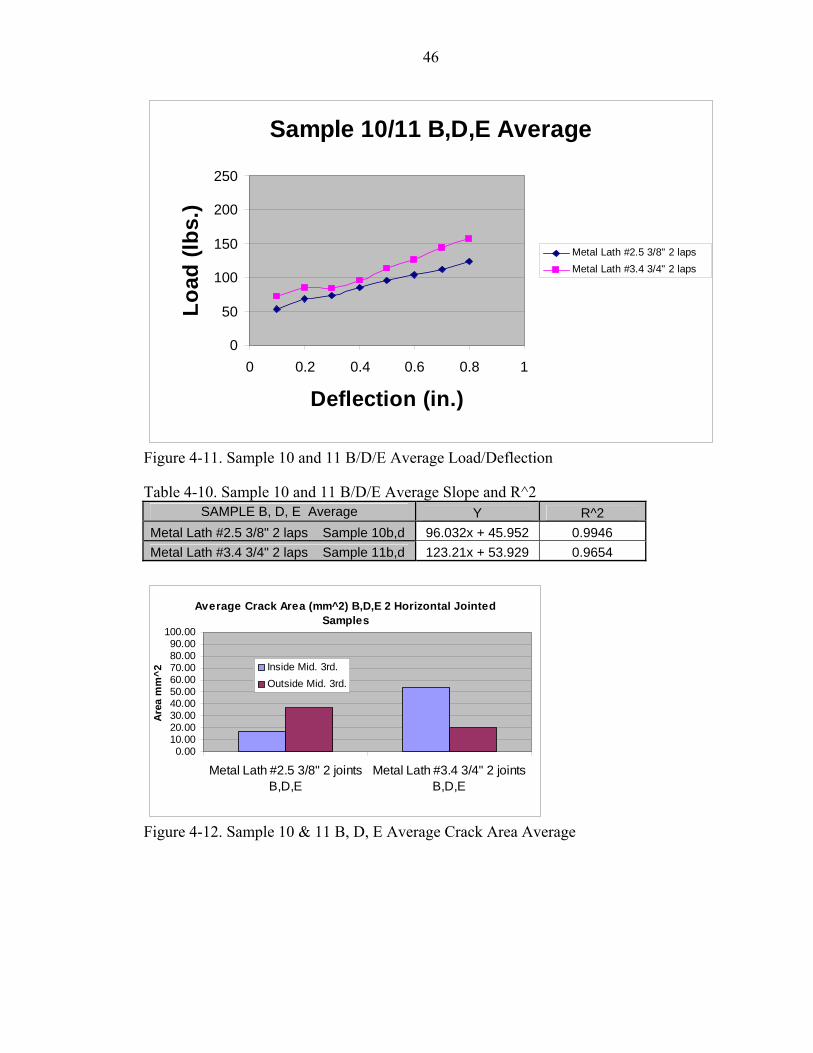
4-10. Sample 10 and 11 B/D/E Average Slope and R^2 ...................................................46
4-11. Sample 10 and 11 C Load/Deflection.......................................................................47
4-12. Sample 10 and 11 B/D/E Average Slope and R^2 ...................................................47
4-13. Permalath® 1-Coat Load v. Deflection Comparison ................................................50
4-14. Permalath® 1-Coat Slope Comparison .....................................................................51
4-15. Permalath® 3-Coat Load v. Deflection Comparison ................................................52
4-16. Permalath® 3-Coat Slope Comparison .....................................................................53
4-17. Metal Lath 1-Coat Load v. Deflection Comparison .................................................54
4-18. Metal Lath 1-Coat Slope Comparison ......................................................................55
viii
4-19. Metal Lath 3-Coat Load v. Deflection Comparison .................................................55
4-20. Metal Lath 3-Coat Slope Comparison ......................................................................56
4-21. Metal Wire 1-Coat Load v. Deflection Comparison ................................................57
4-22. Metal Wire 1-Coat Slope Comparison .....................................................................58
4-23. Metal Wire 3-Coat Load v. Deflection Comparison ................................................58
4-24. Metal Wire 3-Coat Slope Comparison .....................................................................59
4-25. “Real World” 1-Coat Stucco Comparison Load v. Deflection Data ........................59
4-26. “Real World” 1-Coat Stucco Slope Comparison......................................................60
4-27. “Real World” 3-Coat Stucco Comparison Load v. Deflection Data ........................61
4-28. “Real World” 3-Coat Stucco Slope Comparison......................................................62
ix
LIST OF FIGURES
Figure page 3-1. Warp v. Weft Diagram ...............................................................................................19
3-2. Flexure Sample Frame (2 longitudinal overlaps) .......................................................20
3-3. Flexure Sample Frame 2-way Overlaps (2 transverse and 1 vertical)........................21
3-4. Impact Sample Frame.................................................................................................21
3-5. Flexural Sample Screw/Cap and Staple Layout .........................................................22
3-6. Impact Sample Screw/Cap and Staple Layout ...........................................................22
3-7. ¾” System Scratch Coat .............................................................................................23
3-8. Cut through plywood..................................................................................................23
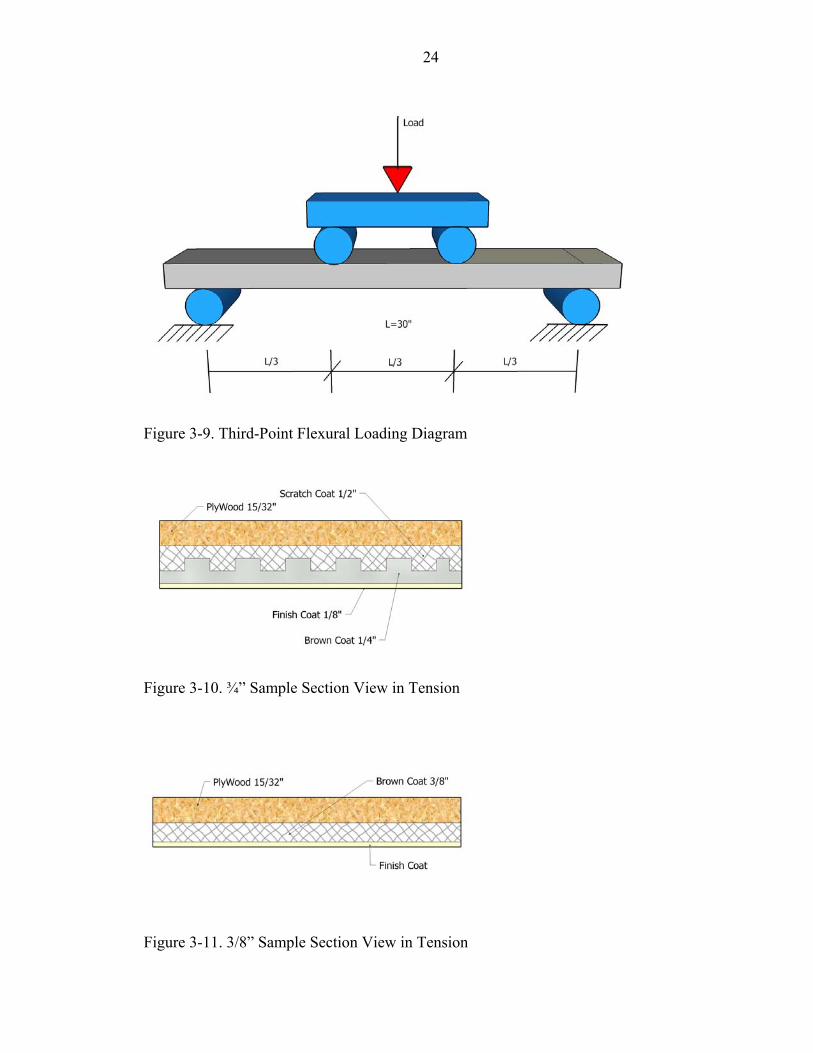
3-9. Third-Point Flexural Loading Diagram......................................................................24
3-10. ¾” Sample Section View in Tension........................................................................24
3-11. 3/8” Sample Section View in Tension......................................................................24
3-12. LSCT Controller .......................................................................................................25
3-13. Electrical Circuit 2D Model Layout .........................................................................25
3-14. Initial Crack Testing Set-up......................................................................................26
3-15. Initial Crack Testing Set-up (light-bulb) ..................................................................26
3-16. Impact Testing Set-up Top View..............................................................................27
3-17. Impact Testing Set-up Model ...................................................................................27
3-18. Impact Testing Set-up Transparent Model ...............................................................28
4-1 Sample B/D 1-Coat Average Initial Crack Deflection ................................................37
4-2. Sample B/D 3-Coat Average Initial Crack Deflection ...............................................37
x
4-3. Sample C 1-Coat Initial Crack Deflection..................................................................38
4-4. Sample C 3-Coat Initial Crack Deflection..................................................................39
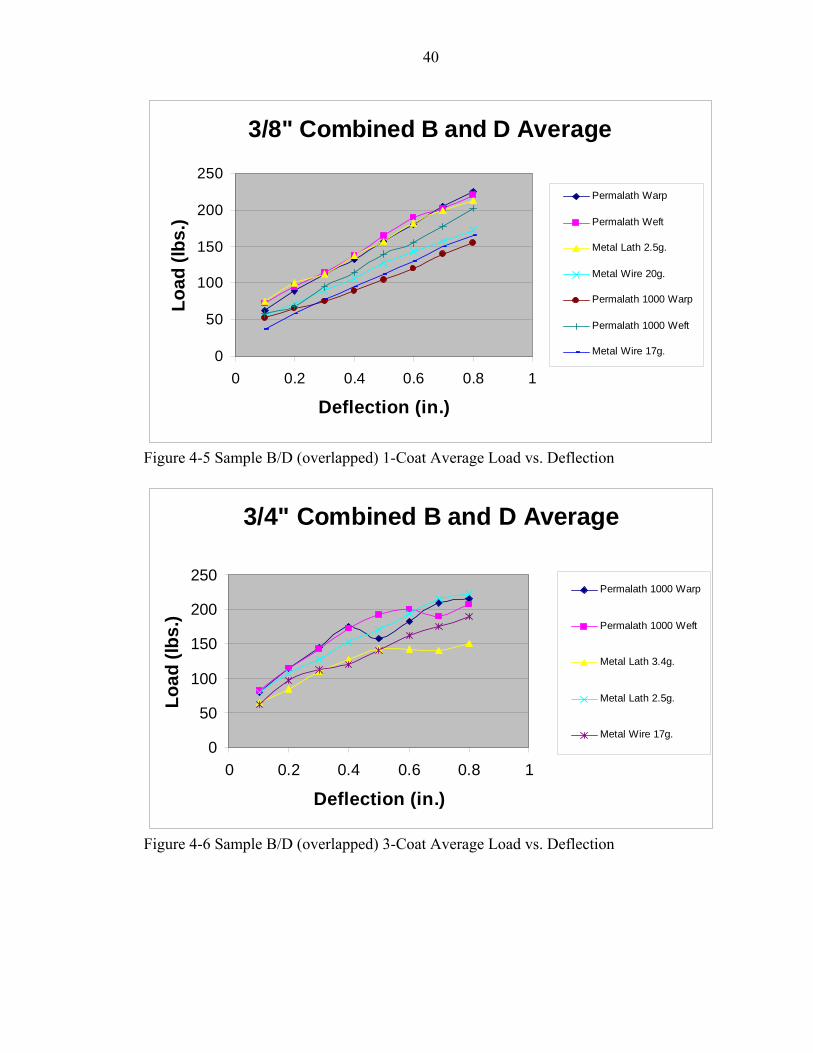
4-5 Sample B/D (overlapped) 1-Coat Average Load vs. Deflection .................................40
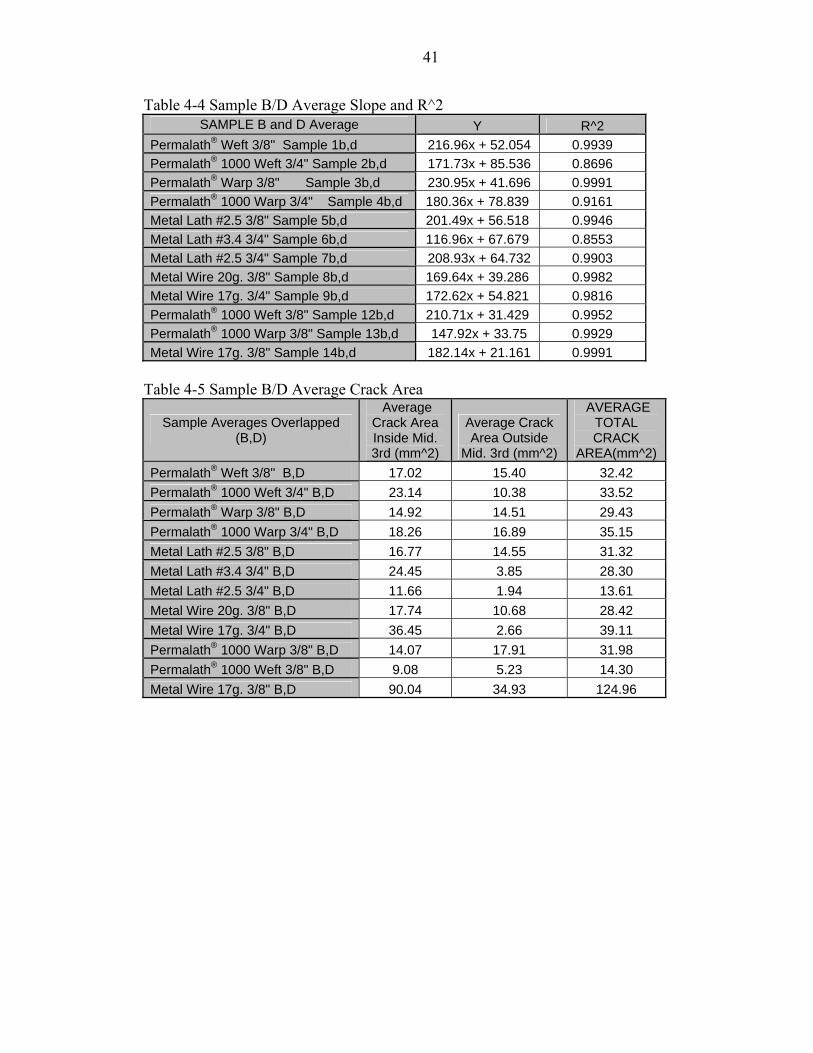
4-6 Sample B/D (overlapped) 3-Coat Average Load vs. Deflection .................................40
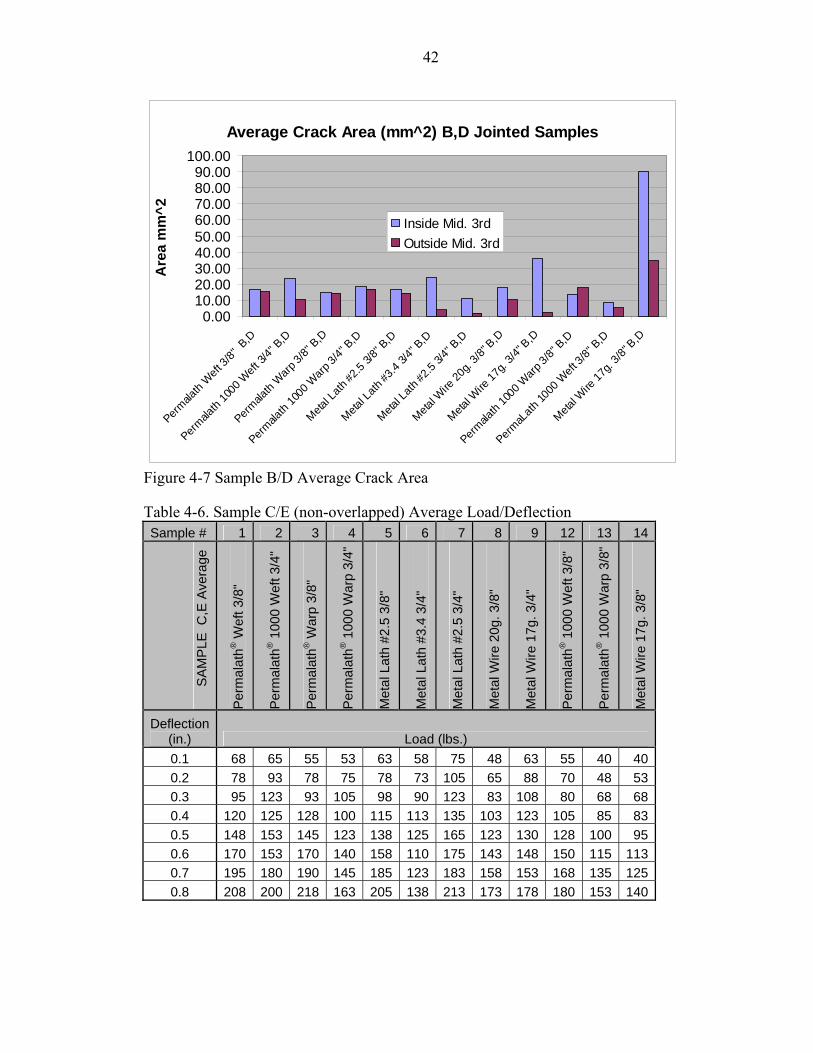
4-7 Sample B/D Average Crack Area................................................................................42
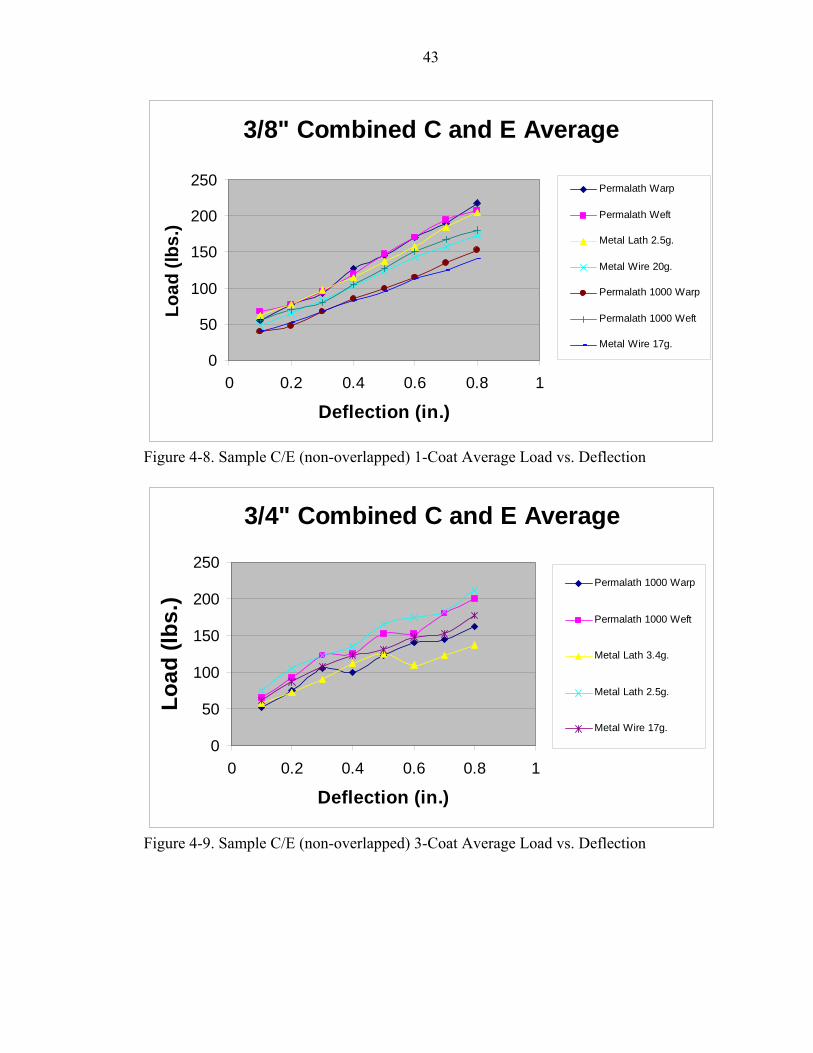
4-8. Sample C/E (non-overlapped) 1-Coat Average Load vs. Deflection .........................43
4-9. Sample C/E (non-overlapped) 3-Coat Average Load vs. Deflection .........................43
4-10. Sample C/E Average Crack Area .............................................................................45
4-11. Sample 10 and 11 B/D/E Average Load/Deflection ................................................46
4-12. Sample 10 & 11 B, D, E Average Crack Area Average...........................................46
4-13. Sample 10 and 11 C Load/Deflection.......................................................................47
4-14. Sample 10 & 11 C Crack Area Average...................................................................48
4-15. 3/8” Impact samples, 160 in-lbs. ..............................................................................48
4-16. ¾” Impact Samples, 320 in-lbs.................................................................................49
4-17. Permalath® 1-Coat Load v. Deflection Comparison Graph .....................................51
4-18. Permalath® 3-Coat Load v. Deflection Comparison Graph .....................................53
4-19. Metal Lath 1-Coat Load v. Deflection Comparison Graph ......................................54
4-20. Metal Lath 3-Coat Load v. Deflection Comparison Graph ......................................56
4-21. Metal Wire 1-Coat Load v. Deflection Comparison Graph .....................................57
4-22. Metal Wire 3-Coat Load v. Deflection Comparison Graph .....................................58
4-23. “Real World” 1-Coat Stucco Comparison Load v. Deflection Graph......................60
4-24. “Real World” 3-Coat Stucco Comparison Load v. Deflection Graph.....................61
xi
Abstract of Thesis Presented to the Graduate School
of the University of Florida in Partial Fulfillment of the Requirements for the Degree of Master of Science in Building Construction
COMPARISON OF NON-METALLIC TO METALLIC LATH REINFORCEMENT IN
STUCCO CLADDING SYSTEMS
By
Patrick W. Murray
August 2006 Chair: Larry Muszynski Cochair: R. Raymond Issa Major Department: Building Construction
Stucco/Plaster is a Portland cement based mixture used for exterior wall cladding.
Stucco is placed over traditional wood frame or CMU wall structures. A vapor barrier is
first attached to the wall followed by lathing over which stucco is applied resulting in a
½” to ¾” thick section. Lathing has traditionally been made from galvanized metal. The
lathing is used as reinforcement for the stucco. There are currently new, potentially
superior lathing products coming to the market that could increase the useful life of
stucco cladding as well as decrease the labor costs associated with installation.
This study shows how Degussas’ Permalath® Fiberglass lathing reinforcement
compares to traditional metal wire lath and expanded metal lath as reinforcement for
stucco wall systems. Tests performed in this study to make these comparisons were
third-point flexural loading, initial cracking deflection, and impact testing.

xii
Results show that Permalath® in both 1-coat and 3-coat systems perform as well
as other metal lath options. Permalath® performs equally as well in both the weft and
warp directions. Permalath® also performs well whether is it overlapped (longitudinally)
or non-overlapped.
1
CHAPTER 1 INTRODUCTION
Stucco is a Portland cement based plaster used as an exterior wall cladding in
building construction. Lathing and stucco are the two main components that comprise
stucco wall cladding. Depending on the physical structure, there may or may not be more
components to the systems.
There are many different proprietary blends of Portland cement based stucco
produced by many different suppliers. There are also a variety of lath options available
for use in stucco cladding systems. There are different weights, gauges, and patterns of
traditional metal cloth and mesh used to produce lathing. Combinations of different
stucco blends and laths have an effect on the thickness and number of coats required by
the stucco system. There are currently 1-coat and 3-coat stucco systems.
Three-Coat Stucco Systems
Three-coat stucco is the traditional system that has been used as cladding for
many years. This is a very labor intensive method with relatively high costs.
Three-coat stucco systems are comprised of three layers of stucco and one layer
of lathing. Scratch, Brown, and Finish coats comprise the three different coats applied
when using a three-coat system. The scratch coat is applied at approximately ½”
thickness and is scratched approximately ¼” deep before setting up. The scratches are
intended to help in the forming of a mechanical bond between the scratch coat and brown
coat. The second coat is the brown coat which is ¼” thick. The brown coat is left
2
smooth after it is applied. The finish coat or third coat is less than 1/8” thick and is
intended for aesthetic quality.
One-Coat Stucco Systems
One-coat stucco systems consist of only two layers, a brown coat and a finish
coat. The brown coat is applied between 3/8” and ½” thick. The finish layer is the
second coat in this process and is once again for aesthetic purposes only. This new
method is a streamlined and more economical process of stucco application.
Lathing
Stucco without reinforcement does not have the strength or bonding ability to
stand alone. Lathing acts as a mechanical bonding agent to the wall making the stucco
system act as one structure. Lathing has traditionally been either metal wire or expanded
metal. Metal wire is available in different gauges while expanded metal in available in
different weights. Metal wire gauges are a continuous gauge throughout the entire sheet
of lath. Expanded metal lath weights are based per square yard of lath.
Stucco can crack for many reasons, including shrinkage of cementitious materials
as well as metal lath incompatibility. Cracking is one of the major downsides of using
stucco as an exterior cladding. Control of stucco cracking has been an issue with no
answer for as long as stucco has been used in construction. Metal is also very susceptible
to aggressive environmental conditions. In marine conditions, freeze/thaw areas, and
high humidity areas metal lathing can corrode sacrificing many useful years of the stucco
system.
Permalath® is a new Fiberglass lath material which is not rigid and not as
susceptible to environmental conditions as metal lath. Being that it is not rigid; cracking
may become less of an issue. Permalath® also helps control the degree that
3
environmental conditions can affect the stucco system. Permalath® is less labor intensive
and safer to install than metal lath. Permalath® is also bundled in a roll making it easier
to handle than large sheets of metal lath.
Research Objectives
The objectives of this research were to compare the structural properties of
traditional metal lath applications and Permalath® as a stucco reinforcement system. This
research used three main test methods for study; third-point flexural loading, impact
testing, and initial crack deflection. Development of new testing methods for stucco
systems has also become a secondary objective of this research, as there are no testing
standards specific for stucco systems.
4
CHAPTER 2 LITERATURE REVIEW
Introduction
In 1824, English inventor Joseph Aspdin developed Portland cement, which is a
material that is now widely used in building construction as a component in concrete,
mortar, and exterior plaster. Later in 1849, Joseph Monier invented reinforced concrete,
which is a composite material consisting of concrete that incorporates an embedded
metal, usually steel. Un-reinforced concrete is high in compressive strength; however, it
has relatively low tensile properties. Consequently, the addition of reinforcement
significantly improves the ability of the material to tolerate tensile forces. Steel
reinforced concrete is overall durable, strong and expected to perform well throughout its
service life; however, sometimes the steel is subject to corrosion.
In the 1970s, fiber reinforced concrete was invented. The fibers can be formed
from a variety of materials such as steel as well as various fibrous products such as nylon,
fiberglass, and polypropylene. Fiber reinforcements increase concrete's toughness and
ductility (the ability to deform plastically without fracturing) by carrying a portion of the
load in the case of matrix failure, and by arresting crack growth. Dr. Victor Li of the
University of Michigan has researched the properties of high-performance fiber-
reinforced cementitious composites, a very high-performance subset of fiber-reinforced
concrete. He believes that acceptance of the material will grow, as long as performance,
low cost, and ease of execution are maintained (Black, 2005).
5
More recently, non-metallic reinforcing materials, such as plastic and fiberglass
reinforcing bar, have been developed as an alternative to traditional steel reinforcing bar.
The advantages of these products include higher tensile strength, resistance to corrosion
and other environmental factors, and decreased maintenance.
During the last two decades, government organizations, private industries, and
universities have performed research to produce fiber reinforced polymer (FRP)
reinforcements for structures exposed to aggressive environmental conditions
(freeze/thaw, marine conditions, chemicals) and mechanical overloading. The most
common FRPs used are glass, aramid, and carbon. FRPs can be placed in different
locations of a structure to achieve the following: flexural strength, tensile strength, shear
strength, provide confinement, or ductility. With the many new technologies and
materials available today, steel reinforcement is giving way to fiber reinforcement
(Balendran et al., 2002).
Fiber Reinforced Concrete, Mortar, and Exterior Plaster
As a result of metal corrosion and the fact that fiber reinforcement in concrete has
performed so well, it seems promising to search for new fibrous materials to substitute
for metal lath that has been historically used in exterior plaster (stucco). These materials
could be made from continuous and discontinuous glass and/or organic fibers.
In civil engineering applications, there are four dominate types of fibers utilized.
These are carbon, aramid, glass, and organic fibers. Continuous fiber such as carbon
fiber, aramid fiber and glass fiber have been accepted as a substitute for conventional
steel reinforcement in specific applications. This is because of their good characteristics:
high strength, lightness, anti-corrosiveness, anti-magnetism and flexibility. For instance,
Polyacetal Fiber (PAF) has previously been used as both external and internal

6
reinforcement. Research studies and tests done at Hokkaido University in Japan have
shown that PAF laminate sheets increase the ultimate deformation of specimens of
reinforced columns yielding in flexure (Ueda and Sato, 2002).
Fibers have different properties, including price, which may make one more
suitable than the other depending upon the application or intended purpose. All fibers
have generally higher stress capacity than ordinary steel and are linear elastic until
failure. One of the more important properties that differ between fiber types are stiffness
and tensile strain (Carolin, 2003).
Carbon: Carbon fibers do not absorb water and are resistant to many chemical
solutions. They withstand fatigue excellently, do not stress or corrode and do not show
any creep or relaxation. Carbon fibers have less relaxation than low relaxation, high
tensile, pre-stressed steel strands. Carbon fiber composites are used to increase the
flexural capacity of reinforced concrete bridges (Carolin, 2003).
Aramid: A well-known trademark of aramid fibers is Kevlar®, but there exist other
brands (e.g., Twaron, Technora, and SVM). Aramid fibers are sensitive to elevated
temperature, moisture and ultra violet radiation and are therefore not widely used in civil
engineering applications (Carolin, 2003).
Glass: Glass fibers are considerably more economical than carbon fibers and
aramid fibers. Therefore glass fiber composites have become popular in many
applications such as fiber reinforced concrete, fiber reinforcement polymer bars,
electronics, and many more applications. In order to clarify the content of this study a
brief review of glass fiber reinforced concrete follows (Carolin, 2003).

7
Organic: Polypropylene, nylon, acrylic, polyethylene, and polyester are all organic
synthetic fibers. These fibers can serve many different purposes. These fibers can be
used in small quantities to reduce plastic shrinkage cracking during the first 24 hours
after a pour. They can also be used in larger quantities to replace steel reinforcement in
many applications. All of these fibers act differently. Some have low bonding strength,
some are weak in tensile, and some have poor heat resistance. Fibers are chosen based on
the desired outcome.
Background of Glass Fiber Reinforcement in Concrete
Much of the original research performed on glass fiber reinforced cement paste
took place in the early 1960s. This work used conventional borosilicate glass fibers
(uncoated E-glass) and soda-lime-silica glass fibers (A-glass). Glass compositions of
uncoated E-glass and A-glass, used as reinforcement, were found to lose strength rather
quickly due to the very high alkalinity (pH≥12.5) of the cement-based matrix.
Consequently, early A-glass and uncoated E-glass composites were unsuitable for long-
term use. Continued research, however, resulted in the development of a new alkali
resistant fiber (AR-glass fiber) that provided improved long-term durability. This system
was named alkali resistant-glass fiber reinforced concrete (AR-GFRC). In 1967,
scientists at the United Kingdom Building Research Establishment (BRE) began an
investigation of alkali resistant glasses. They successfully formulated a glass
composition containing 16 percent zirconia that demonstrated high alkali resistance. The
National Research Development Corporation (NRDC) and BRE discussed with
Pilkington Brothers Limited the possibility of doing further work to develop the fibers for
commercial production. By 1971, BRE and Pilkington Brothers had collaborated and the
results of their work were licensed exclusively to Pilkington for commercial production
8
and distribution throughout the world. Since the introduction of AR-glass in the United
Kingdom in 1971 by Cem-FIL, other manufacturers of AR-glass have been established.
In 1975, Nippon Electric Glass (NEG) Company introduced an alkali resistant glass
containing a minimum of 20 percent zirconia. In 1976, Owens-Corning Fiberglass and
Pilkington Brothers, agreed to produce the same AR-glass formulation to enhance the
development of the alkali resistant glass product and related markets. A cross-license
was agreed upon. Subsequently, Owens –Corning Fiberglass stopped production of AR-
glass fiber in 1984 (ACI, 1999).
Alkali resistant-glass fiber reinforced concrete is by far the most widely used
system for the manufacturing of GFRC products. However coated E-glass in used in an
array of products. Coated E-glass is used to manufacture coated fiber mesh fabrics which
are used to reinforce and waterproof cement, gypsum, bitumen, and plastics. Coated E-
glass is also used in products intended to insulate exterior walls and in the manufacturing
of fireproofing applications. Within the last decade, the use of fibers has been adopted in
a wide range of applications in the construction industry.
Portland Cement Stucco/Exterior Plaster
Various private companies in North America are currently manufacturing
‘factory blended’ Portland cement stucco/exterior plaster products. These products are
sometimes referred to as one or three-coat stucco systems and are available through
companies such as Degussa Wall Systems, Dryvit Systems, Teifs Wall Systems, Parex
Inc., Sto Corp., Magna Wall, etc.
The products generally include a cementitious base coat followed by a finish coat.
The base coat for the one-coat system is generally 3/8” to ½” thick while the base coat for
the three-coat systems ranges from 1/2” to ¾”. Additionally, Portland cement
9
stucco/exterior plaster can also be proportioned and applied as a ‘field mix’ per ASTM C
926. The ingredients for the base coat may include polymer modifiers, sand, Portland
cement, lime, non-metallic fibers and, in the case of the factory blended products, other
proprietary ingredients. The finish coats may be a field mixed cementious material or
factory prepared material that typically is no greater than 1/8” thick.
Reinforcement/Plaster Base for Portland Cement Stucco
Lath or wire is typically used as a plaster base and reinforcement for both one-
coat and three-coat exterior plaster (stucco) regardless whether the stucco is field or
factory mix. Longstanding and common practice has been for lath or wire to be typically
fabricated from galvanized metal that is available in various configurations as well as
weights. The lath or wire is mechanically attached to a substrate which is generally the
frame of the building. Staples 1 ½” or larger or screws with caps are the main means of
mechanical fastening. The lath or wire serves as a mechanical key for the stucco which is
trowel or spray applied to the lath.
Non Metallic Reinforcement/Plaster Base for Portland Cement Stucco
A new non-metallic glass fiber lath has been recently introduced by Degussa Wall
Systems. The Permalath® reinforcement for cement plaster (stucco) wall systems is a
patent-pending, non-metallic lath reinforcement that is an alternative to metal lath and
stucco netting. Permalath® was initially designed specifically for use in the 3/8- to 1/2-
inch thick (one-coat) stucco systems however a Permalath® 1000 will also be available
for three-coat stucco applications. Since the product is pliable and has no sharp edges,
it’s safer to handle, easier to cut to size, and its ease of handling reduces installation
costs. It is also alkali resistant to ensure long-term durability and performance. Its open,
3-D weave, self-furring design provides numerous solutions to issues encountered with

10
metal lath or wire. It is non-metallic, so it will not rust. It is packaged in lightweight
rolls for efficient handling and shipping, and the roll’s wide width gives better coverage
with fewer overlapping overlaps. Existing application methods are used eliminating the
need to learn new methods, and the product is non-directional so it can be applied
transversely or vertically (Degussa Wall Systems, 2004).
11
CHAPTER 3 METHODOLOGY
The scope of the project was to provide sufficient scientific information for the
comparison of Permalath® fiberglass reinforcement to metal lath and wire cloth in 3/8”
thick (1-coat) and ¾” thick (3-coat) stucco applications.
Sample Combination
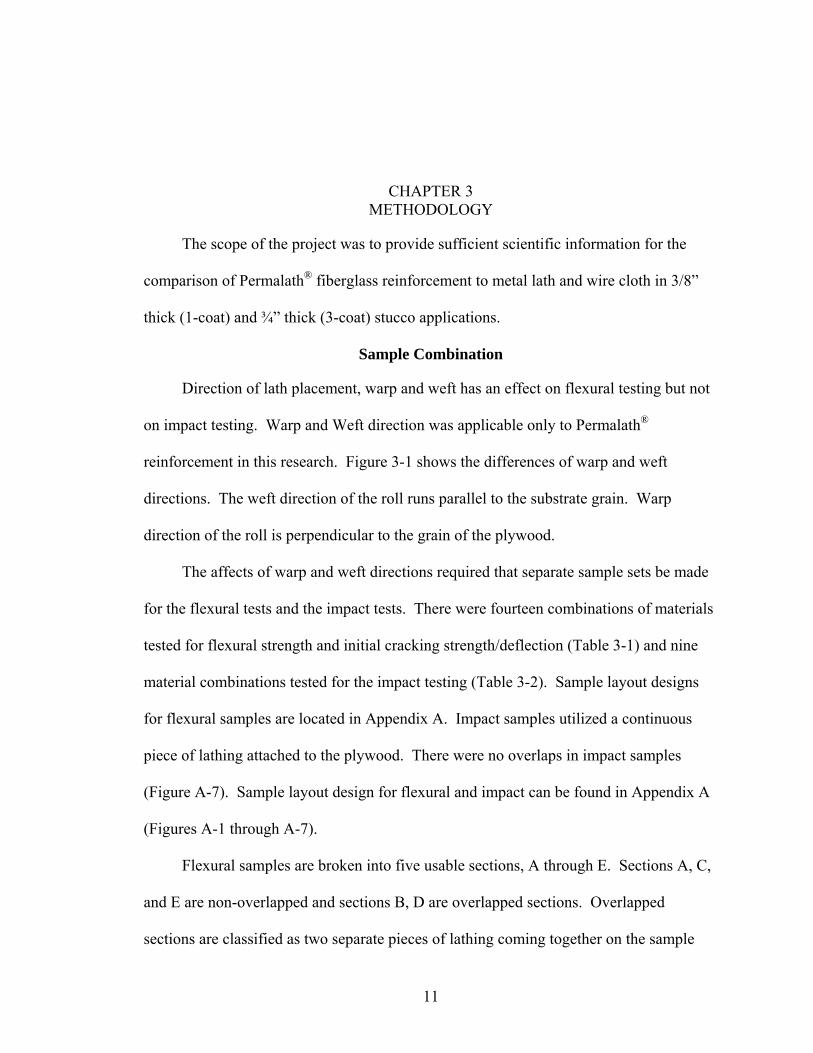
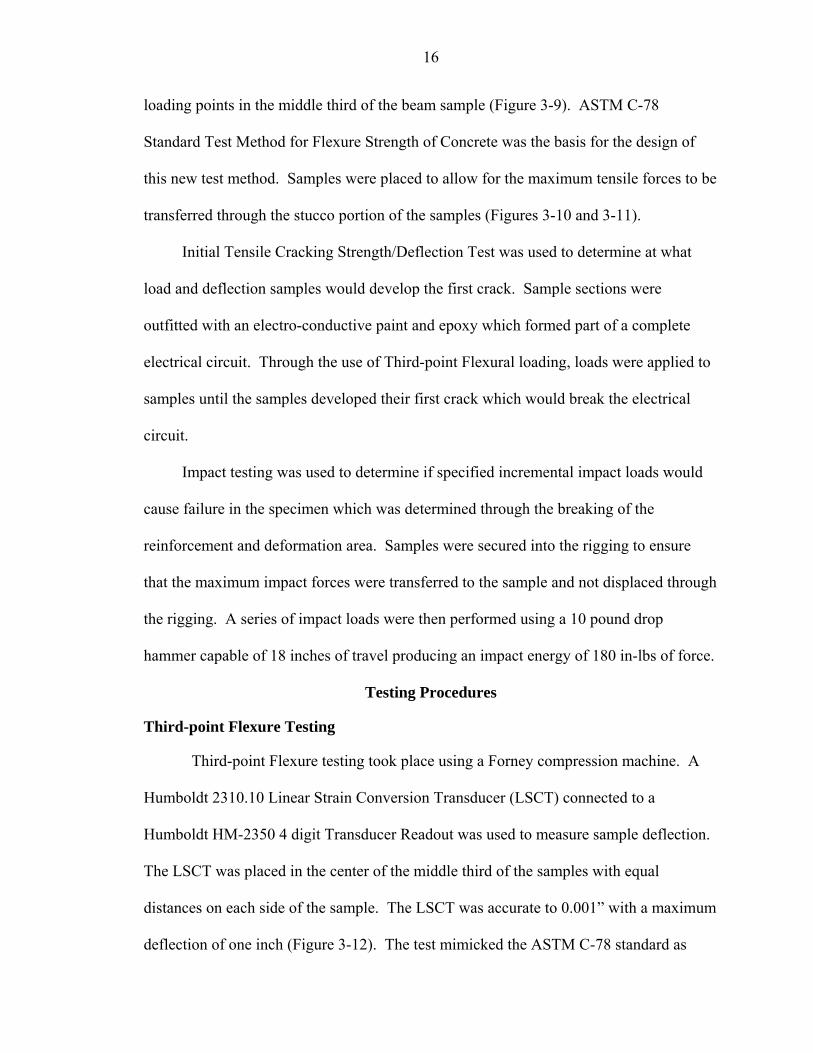
Direction of lath placement, warp and weft has an effect on flexural testing but not
on impact testing. Warp and Weft direction was applicable only to Permalath®
reinforcement in this research. Figure 3-1 shows the differences of warp and weft
directions. The weft direction of the roll runs parallel to the substrate grain. Warp
direction of the roll is perpendicular to the grain of the plywood.
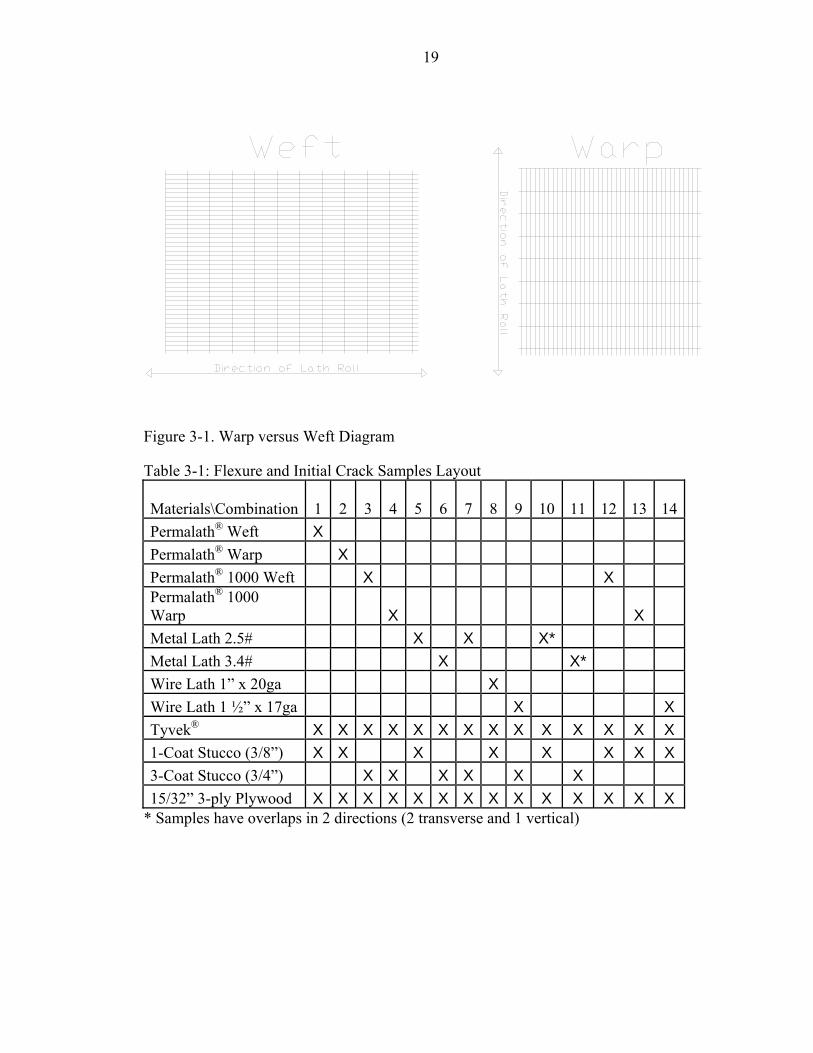
The affects of warp and weft directions required that separate sample sets be made
for the flexural tests and the impact tests. There were fourteen combinations of materials
tested for flexural strength and initial cracking strength/deflection (Table 3-1) and nine
material combinations tested for the impact testing (Table 3-2). Sample layout designs
for flexural samples are located in Appendix A. Impact samples utilized a continuous
piece of lathing attached to the plywood. There were no overlaps in impact samples
(Figure A-7). Sample layout design for flexural and impact can be found in Appendix A
(Figures A-1 through A-7).
Flexural samples are broken into five usable sections, A through E. Sections A, C,
and E are non-overlapped and sections B, D are overlapped sections. Overlapped
sections are classified as two separate pieces of lathing coming together on the sample
12
forming a longitudinal overlap. This is done to represent what happens in the field since
the areas of a building require multiple pieces or rolls of lath to be used to cover the
surface area. Non-overlapped sections are those that have on solid piece of reinforcement
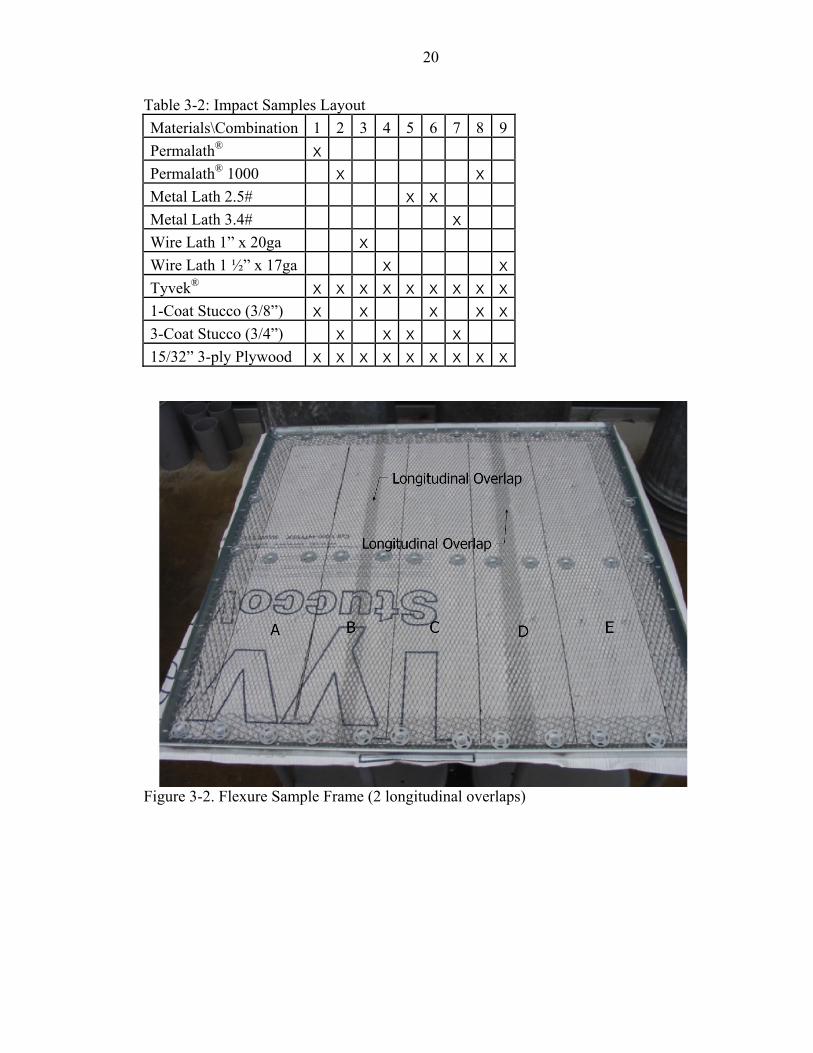
running through the sample (Figures A-1 through A-5). Flexural samples 1 through 9
and 12 through 14 resemble Figure 3-2. These samples only have longitudinal overlaps.
A longitudinal overlap is perpendicular to the load but parallel to the tensile stresses.
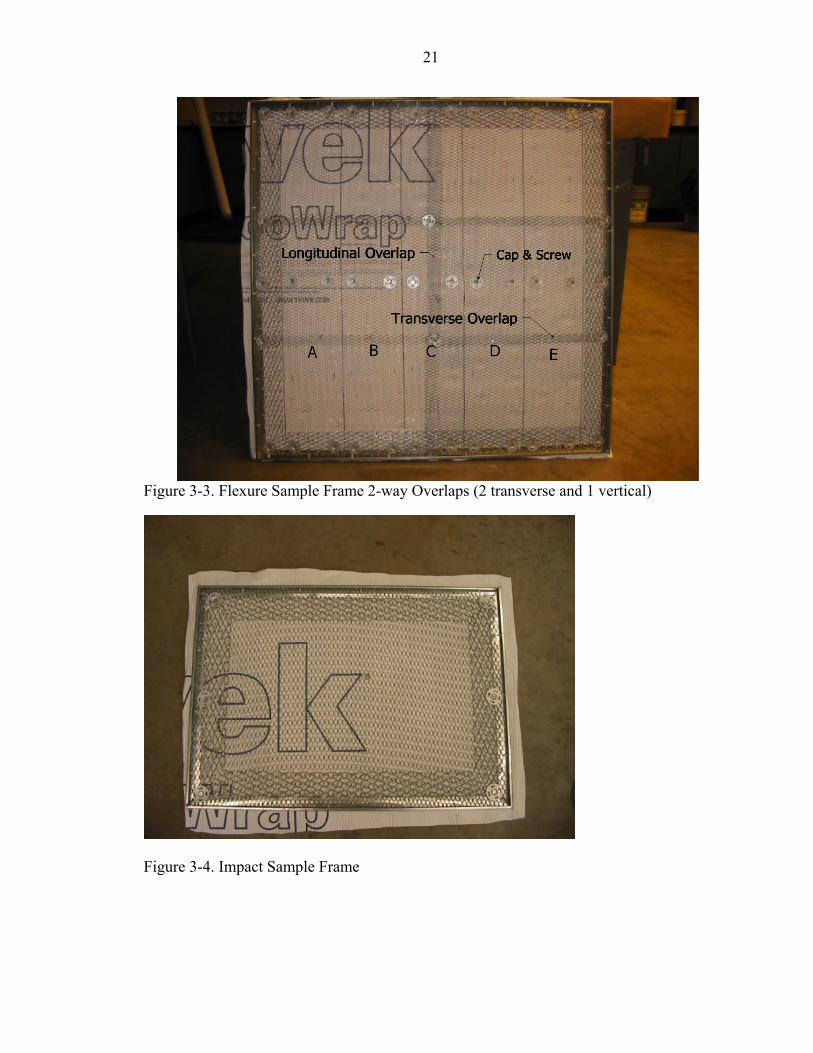
Sample 10 and 11 are the exception to the preceding paragraph. Samples 10 and 11
are samples that have overlaps in both the longitudinal and transverse (Figure 3-3).
Sections B, D, and E all have two transverse overlaps. Section C has both two transverse
overlaps and one continuous longitudinal overlap. Transverse overlaps are parallel to
load but perpendicular to the tensile stresses.
Sample Preparation
Frame Building
Step 1
Flexural Samples
• Cut a 4’x 8’ x 15/32” sheet of plywood to 2 (4’x4’).
• Cut the 4’x 4’ sheet of plywood to 3’x 3’.
• Note which 3’ x 3’ sections came from the same 4’ x 8’ sheet of plywood (this is to check for invalid results from plywood inconsistencies).
Impact Samples
• Cut a 4’ x 8’ x 15/32” plywood to 17” x 24” x 15/32”.
• All cuts in step 1 utilize a 13 amp table saw equipped with a 36 carbide tooth 7¼” finish blade.
Step 2
• Attach vapor barrier (Tyvek® House Wrap) to sample using 3/8” staples.
13
• Mark cut lines on Tyvek® to ensure proper placement of metal caps.
Step 3
• Attach metal trims to all four edges of sample using metal caps and #6 ½” wood screws for flexural samples. Refer to Figure 3-2 and 3-3 for layout on flexure samples and Figure 3-4 of impact samples.
Step 4
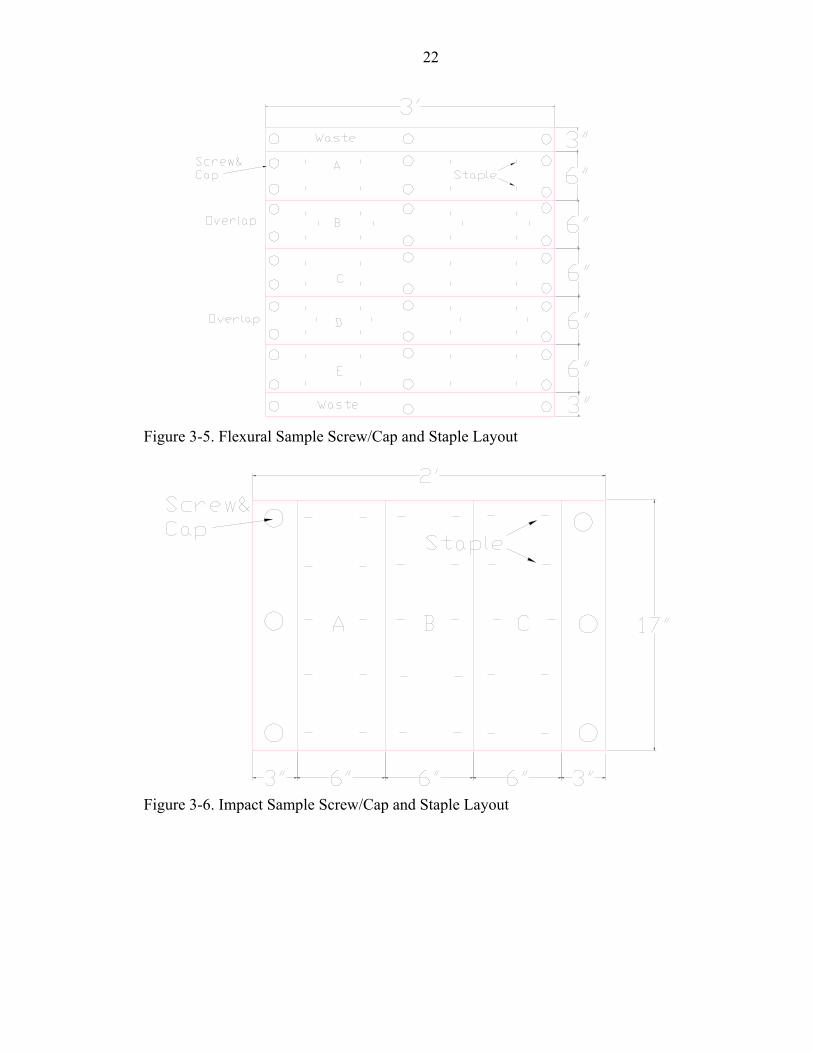
• Install lathing with the specified overlaps (Figures A-1 through A-6). Attach lathing with both staples and metal caps. Metal cap placement is crucial for both impact and flexural samples. Refer to Figures 3-2 through 3-7 for metal cap and staple placement.
• No screws/metal caps were used anywhere within the middle 18” of the impact samples. Screws and Caps were only used running parallel to the 17” side of the sample. 3/8” staples were used throughout the rest of the sample to allow for separation of the stucco from the plywood for testing.
Mixing/Placing/Curing Stucco
Step 1
• Add one bag of sanded Stucco Base to the mixer.
• Add approximately one to one-and-one-half gallon of water to the mixer through a spray hose while simultaneously turning the mixer on. Proper water volume was determined by workability. If too much or too little water was added a proper workability was not achieved which can be determined by being either too stiff or too soupy.
• Mix the stucco for five minutes; mixture is now ready for application onto sample frames.
Step 2
• Trowel stucco onto sample frames using a metal float. Screed to a thickness of 3/8” for the 1-coat systems and a thickness of ½” for the 3-coat systems.
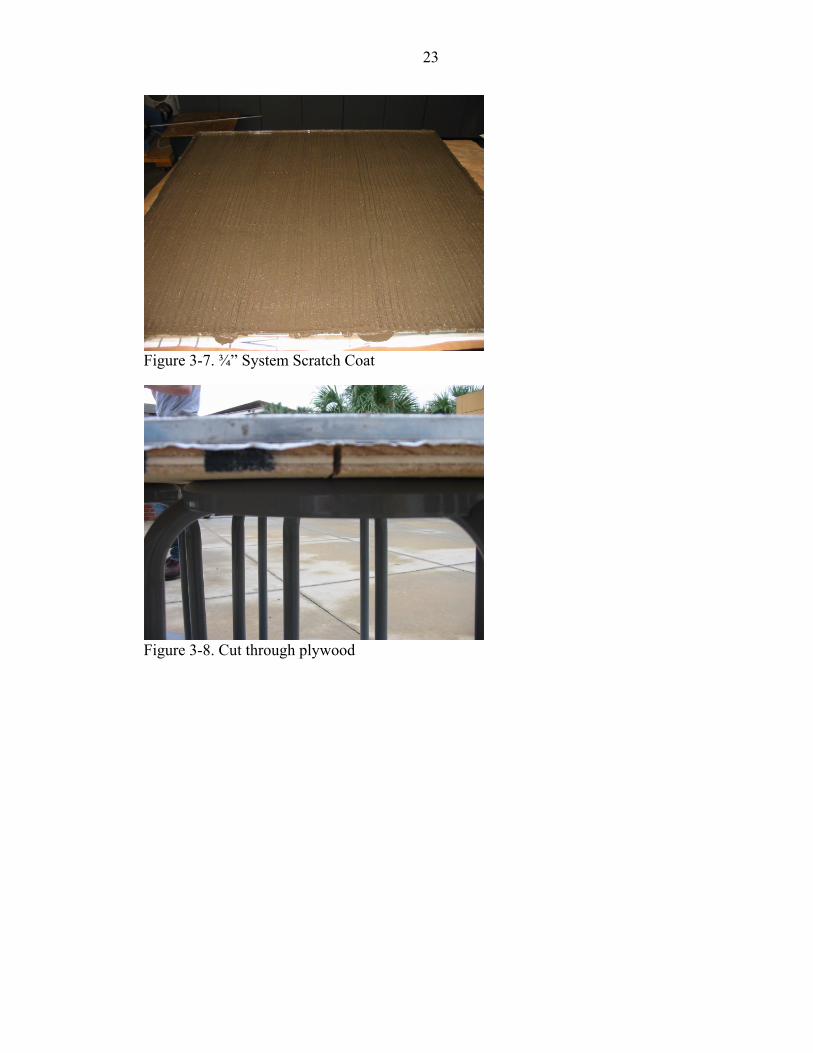
• 15 minutes after application of the scratch coat on the 3-coat systems, scratch the
surface to approximately ¼” depth (Figure 3-7).
Step 3
• 24 hours after the application of the scratch coat on the 3-coat system, follow step 1 again for mixing stucco. While stucco is mixing mist sample with water until
14
water takes more than 30 to 45 seconds for absorption. Trowel stucco onto the scratch coat to a finish level of ¾” thick.
• 1-coat samples should also be misted with water at this time.
Step 4
• 48 hours after the first coat of stucco is applied, all samples are to be misted again.
Step 5
• Samples cured on a horizontal, flat surface at an air temperature between 72° - 78°.
• Samples were cured for 14 days before any testing was performed on them.
Cutting Samples
Samples were cut after seven days of curing following the layouts found in
Appendix A. Flexure samples were cut from the 3’ x 3’ specimen into five 6” x 36”
samples with two 3” x 36” pieces of waste from the sides. Impact samples were cut from
the 17” x 24” specimen into three 6” x 17” samples with two 3” x 17” pieces of waste
from the sides. All samples were cut using a 13 amp table saw. To avoid compromising
the integrity of the stucco portion of the samples, the following procedure was followed
to cut the samples.
Using a 7 ½” 36 tooth carbide finish blade on the table saw, the blade depth was set
to 15/32” and the rip fence was adjusted to 15”. The rip fence adjustment measurements
were taken from the outside of the saw blade to compensate for the area that the blades
removes when cutting. The samples first pass across the saw, cut only through the
plywood (Figure 3-8). The blade was then changed to a 7 ¼” dry/wet diamond blade.
The blade was then adjusted to cut through the full thickness of the sample. This second
pass across the saw completes the cut through the stucco. The following process was
15
repeated (rip fence measurements adjusted to allow for proper sample size) to cut the rest
of the specimen into the designed size of samples according to layout (Appendix A).
The process of changing the blade out after every cut was a time consuming
process, but is necessary not to damage the samples. During the trial sample making and
cutting process of this research, cutting through the entire sample with both a finish blade
and a diamond blade was attempted. The result was a sample with “spawling” stucco on
the top portion. Blades were also burned up after one pass.
There was an extra step needed for the cutting process of the impact samples. After
cutting samples into proper sizes the stucco portion needed to be separated from the
plywood. These samples were only attached with staples in the testing area (Figure 3-6),
so they separated from the plywood with the slightest amount of force using a flat bar to
keep from damaging the samples.
Test Methods
Various tests were performed on the different material combinations and
thicknesses in order achieve sufficient data to form valid conclusions. Multiple types of
tests were needed since some materials perform differently under various testing
conditions. Third-Point Flexure, initial tensile cracking strength/deflection, and impact
tests were the three types of tests performed during this research. Crack analyses were
performed on the samples subjected to flexure loads.
Third-Point Flexure testing allowed for the determination of the flexural strength of
the samples. The simply supported beam (6” x 36” sample) is supported on two outer
points, and loaded through the application of two concentrated loads. All contact points
along the beam are located at equal distances which are ten inches from each other. The
maximum stress endured by the sample is located at and between the two concentrated
16
loading points in the middle third of the beam sample (Figure 3-9). ASTM C-78
Standard Test Method for Flexure Strength of Concrete was the basis for the design of
this new test method. Samples were placed to allow for the maximum tensile forces to be
transferred through the stucco portion of the samples (Figures 3-10 and 3-11).
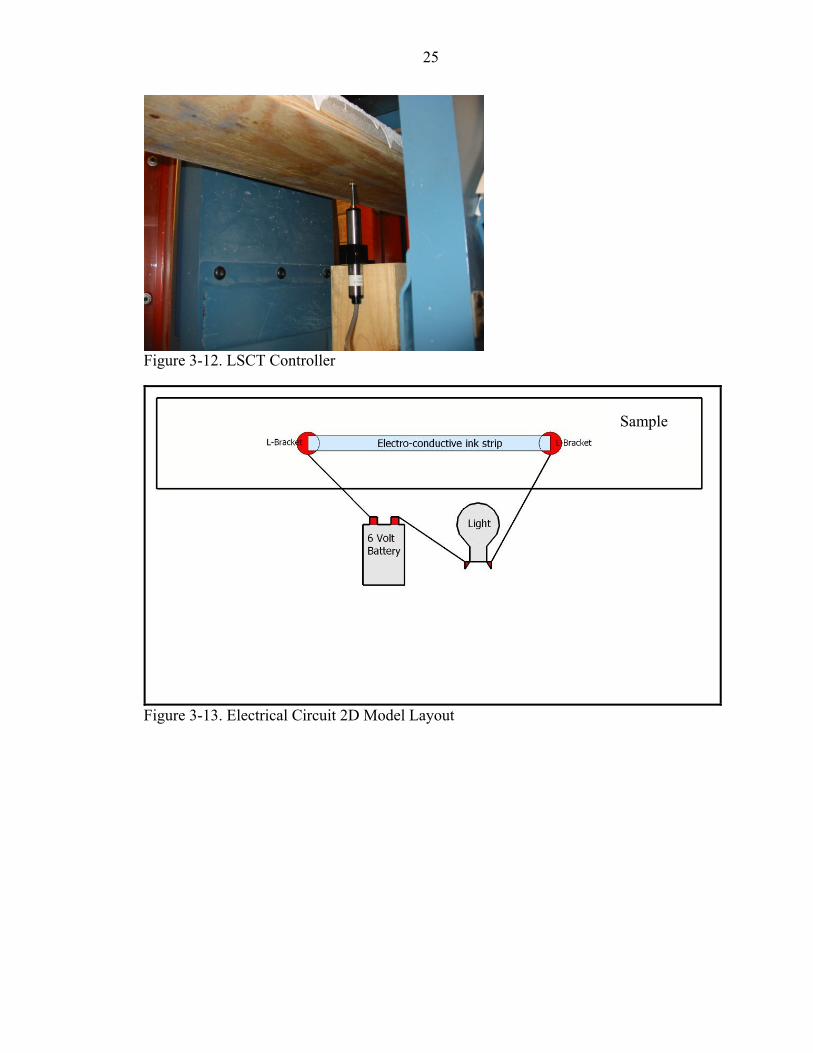
Initial Tensile Cracking Strength/Deflection Test was used to determine at what
load and deflection samples would develop the first crack. Sample sections were
outfitted with an electro-conductive paint and epoxy which formed part of a complete
electrical circuit. Through the use of Third-point Flexural loading, loads were applied to
samples until the samples developed their first crack which would break the electrical
circuit.
Impact testing was used to determine if specified incremental impact loads would
cause failure in the specimen which was determined through the breaking of the
reinforcement and deformation area. Samples were secured into the rigging to ensure
that the maximum impact forces were transferred to the sample and not displaced through
the rigging. A series of impact loads were then performed using a 10 pound drop
hammer capable of 18 inches of travel producing an impact energy of 180 in-lbs of force.
Testing Procedures
Third-point Flexure Testing
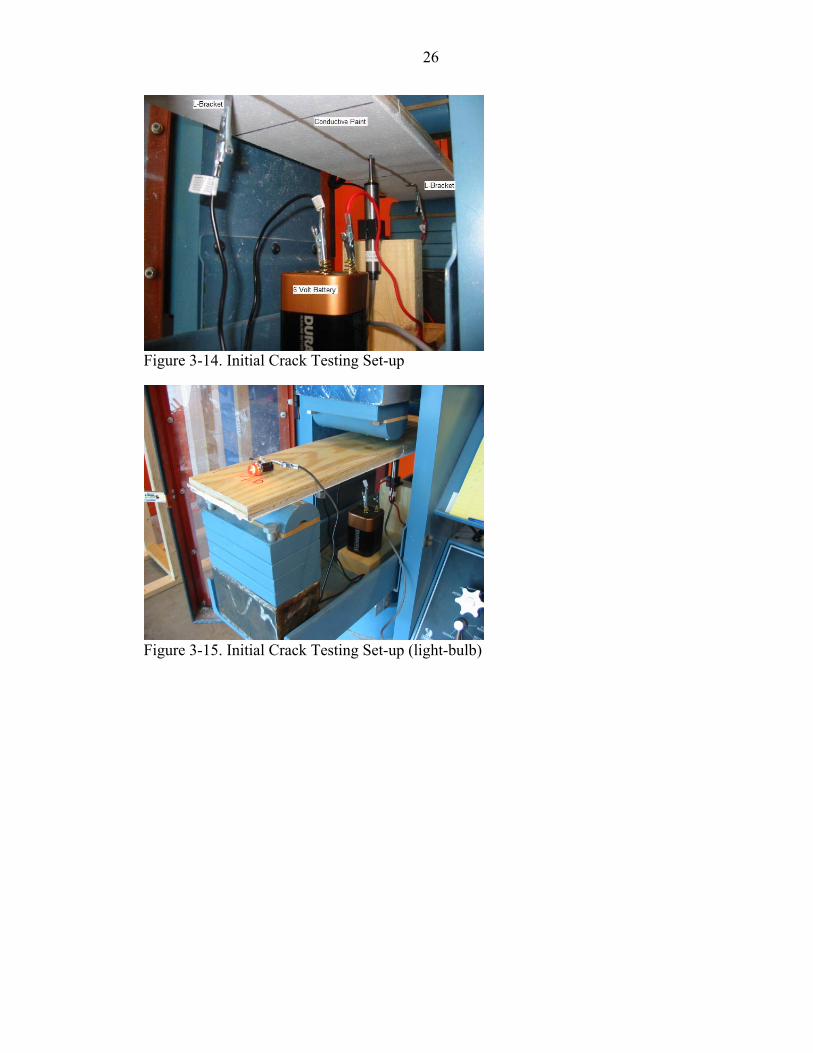
Third-point Flexure testing took place using a Forney compression machine. A
Humboldt 2310.10 Linear Strain Conversion Transducer (LSCT) connected to a
Humboldt HM-2350 4 digit Transducer Readout was used to measure sample deflection.
The LSCT was placed in the center of the middle third of the samples with equal
distances on each side of the sample. The LSCT was accurate to 0.001” with a maximum
deflection of one inch (Figure 3-12). The test mimicked the ASTM C-78 standard as
17
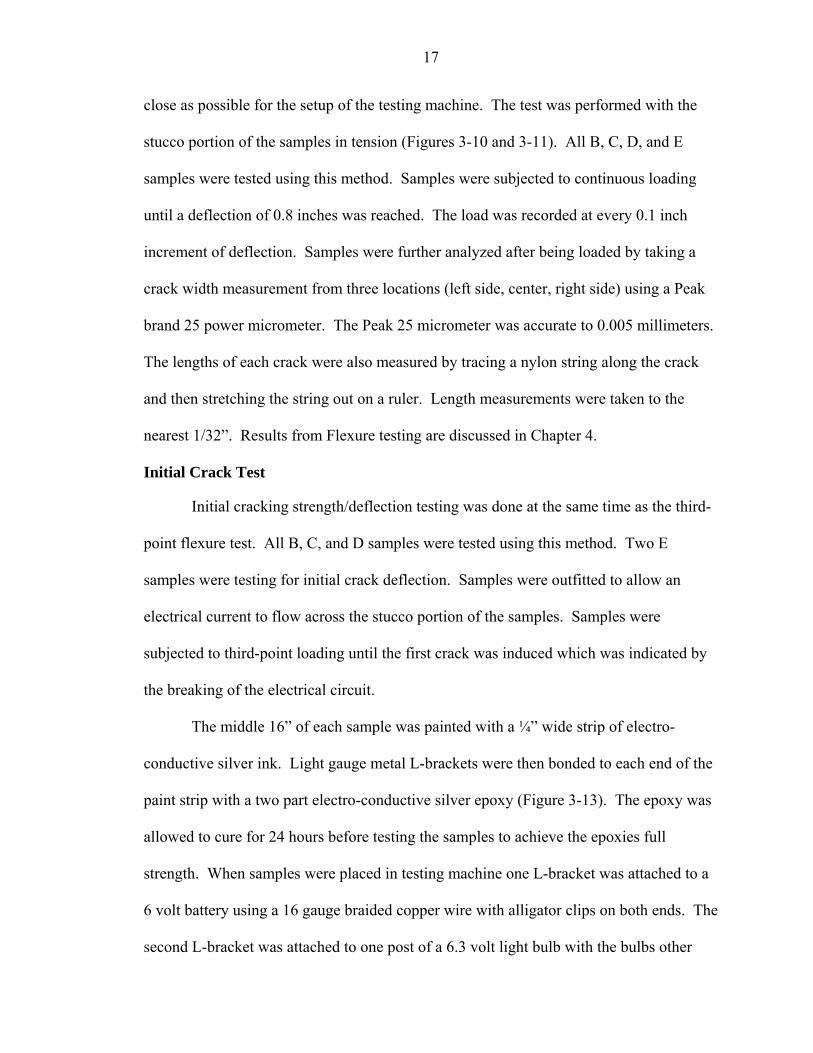
close as possible for the setup of the testing machine. The test was performed with the
stucco portion of the samples in tension (Figures 3-10 and 3-11). All B, C, D, and E
samples were tested using this method. Samples were subjected to continuous loading
until a deflection of 0.8 inches was reached. The load was recorded at every 0.1 inch
increment of deflection. Samples were further analyzed after being loaded by taking a
crack width measurement from three locations (left side, center, right side) using a Peak
brand 25 power micrometer. The Peak 25 micrometer was accurate to 0.005 millimeters.
The lengths of each crack were also measured by tracing a nylon string along the crack
and then stretching the string out on a ruler. Length measurements were taken to the
nearest 1/32”. Results from Flexure testing are discussed in Chapter 4.
Initial Crack Test
Initial cracking strength/deflection testing was done at the same time as the third-
point flexure test. All B, C, and D samples were tested using this method. Two E
samples were testing for initial crack deflection. Samples were outfitted to allow an
electrical current to flow across the stucco portion of the samples. Samples were
subjected to third-point loading until the first crack was induced which was indicated by
the breaking of the electrical circuit.
The middle 16” of each sample was painted with a ¼” wide strip of electro-
conductive silver ink. Light gauge metal L-brackets were then bonded to each end of the
paint strip with a two part electro-conductive silver epoxy (Figure 3-13). The epoxy was
allowed to cure for 24 hours before testing the samples to achieve the epoxies full
strength. When samples were placed in testing machine one L-bracket was attached to a
6 volt battery using a 16 gauge braided copper wire with alligator clips on both ends. The
second L-bracket was attached to one post of a 6.3 volt light bulb with the bulbs other
18
post connecting to the battery using the wire with alligator clips completing the circuit
(Figures 3-13, 3-14, 3-15). Samples were subjected to a constantly increasing third-point
flexural load until the electrical circuit was broken causing the light to turn off due to a
crack at which time data was recorded. Results are discussed in Chapter 4.
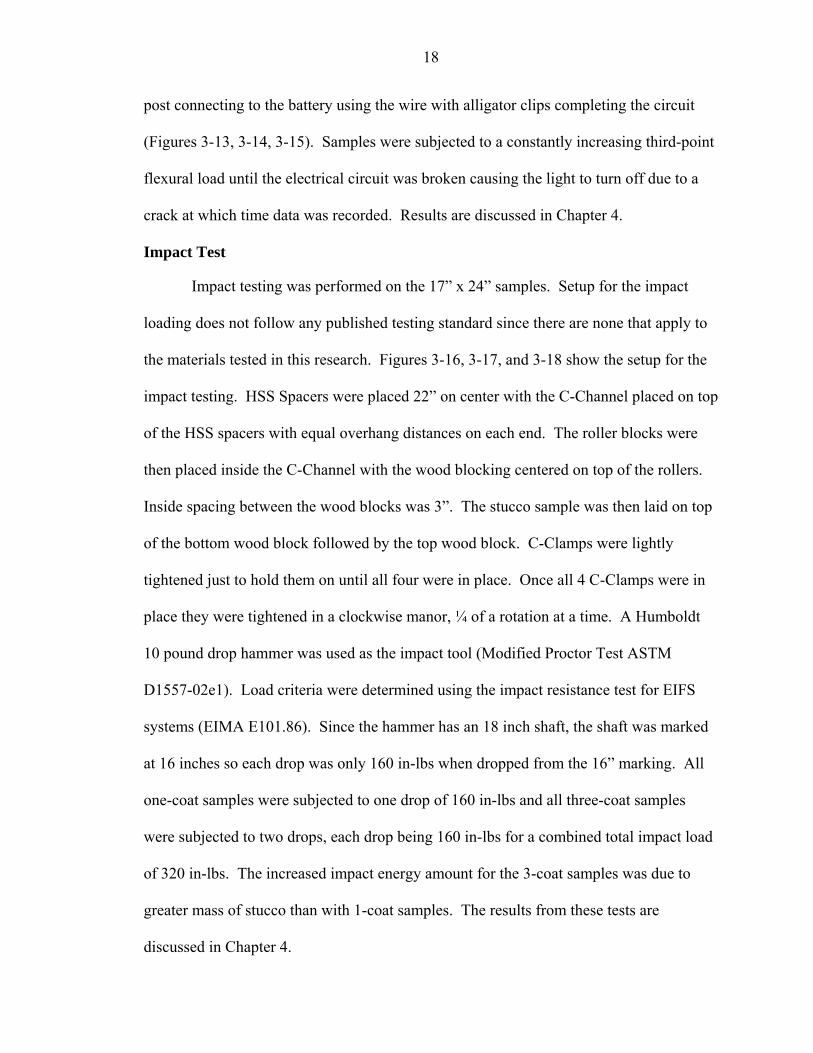
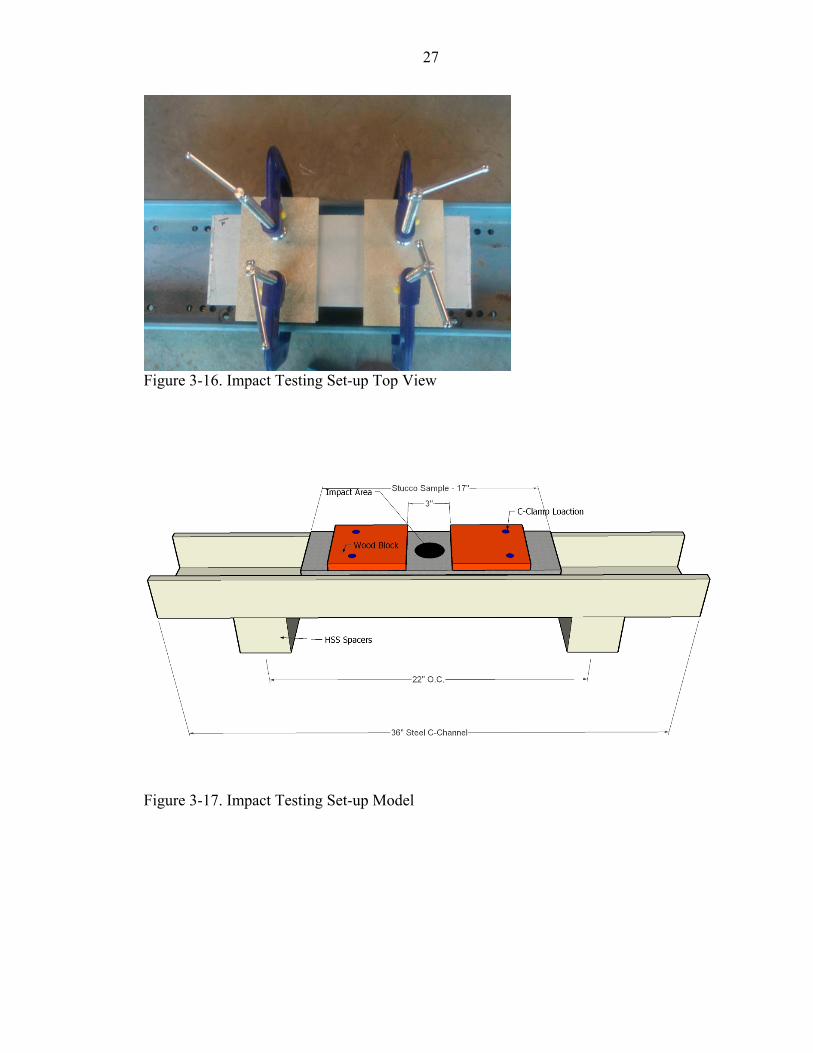
Impact Test
Impact testing was performed on the 17” x 24” samples. Setup for the impact
loading does not follow any published testing standard since there are none that apply to
the materials tested in this research. Figures 3-16, 3-17, and 3-18 show the setup for the
impact testing. HSS Spacers were placed 22” on center with the C-Channel placed on top
of the HSS spacers with equal overhang distances on each end. The roller blocks were
then placed inside the C-Channel with the wood blocking centered on top of the rollers.
Inside spacing between the wood blocks was 3”. The stucco sample was then laid on top
of the bottom wood block followed by the top wood block. C-Clamps were lightly
tightened just to hold them on until all four were in place. Once all 4 C-Clamps were in
place they were tightened in a clockwise manor, ¼ of a rotation at a time. A Humboldt
10 pound drop hammer was used as the impact tool (Modified Proctor Test ASTM
D1557-02e1). Load criteria were determined using the impact resistance test for EIFS
systems (EIMA E101.86). Since the hammer has an 18 inch shaft, the shaft was marked
at 16 inches so each drop was only 160 in-lbs when dropped from the 16” marking. All
one-coat samples were subjected to one drop of 160 in-lbs and all three-coat samples
were subjected to two drops, each drop being 160 in-lbs for a combined total impact load
of 320 in-lbs. The increased impact energy amount for the 3-coat samples was due to
greater mass of stucco than with 1-coat samples. The results from these tests are
discussed in Chapter 4.
19
Figure 3-1. Warp versus Weft Diagram
Table 3-1: Flexure and Initial Crack Samples Layout Materials\Combination 1 2 3 4 5 6 7 8 9 10 11 12 13 14Permalath® Weft X
Permalath® Warp X
Permalath® 1000 Weft X X Permalath® 1000 Warp X X
Metal Lath 2.5# X X X*
Metal Lath 3.4# X X*
Wire Lath 1” x 20ga X
Wire Lath 1 ½” x 17ga X X Tyvek® X X X X X X X X X X X X X X 1-Coat Stucco (3/8”) X X X X X X X X 3-Coat Stucco (3/4”) X X X X X X
15/32” 3-ply Plywood X X X X X X X X X X X X X X * Samples have overlaps in 2 directions (2 transverse and 1 vertical)
20
Table 3-2: Impact Samples Layout Materials\Combination 1 2 3 4 5 6 7 8 9Permalath® X
Permalath® 1000 X X
Metal Lath 2.5# X X
Metal Lath 3.4# X
Wire Lath 1” x 20ga X
Wire Lath 1 ½” x 17ga X X
Tyvek® X X X X X X X X X
1-Coat Stucco (3/8”) X X X X X
3-Coat Stucco (3/4”) X X X X
15/32” 3-ply Plywood X X X X X X X X X
Figure 3-2. Flexure Sample Frame (2 longitudinal overlaps)
21
Figure 3-3. Flexure Sample Frame 2-way Overlaps (2 transverse and 1 vertical)
Figure 3-4. Impact Sample Frame
22
Figure 3-5. Flexural Sample Screw/Cap and Staple Layout
Figure 3-6. Impact Sample Screw/Cap and Staple Layout
23
Figure 3-7. ¾” System Scratch Coat
Figure 3-8. Cut through plywood
24
Figure 3-9. Third-Point Flexural Loading Diagram
Figure 3-10. ¾” Sample Section View in Tension
Figure 3-11. 3/8” Sample Section View in Tension
25
Figure 3-12. LSCT Controller
Figure 3-13. Electrical Circuit 2D Model Layout
Sample
26
Figure 3-14. Initial Crack Testing Set-up
Figure 3-15. Initial Crack Testing Set-up (light-bulb)
27
Figure 3-16. Impact Testing Set-up Top View
Figure 3-17. Impact Testing Set-up Model
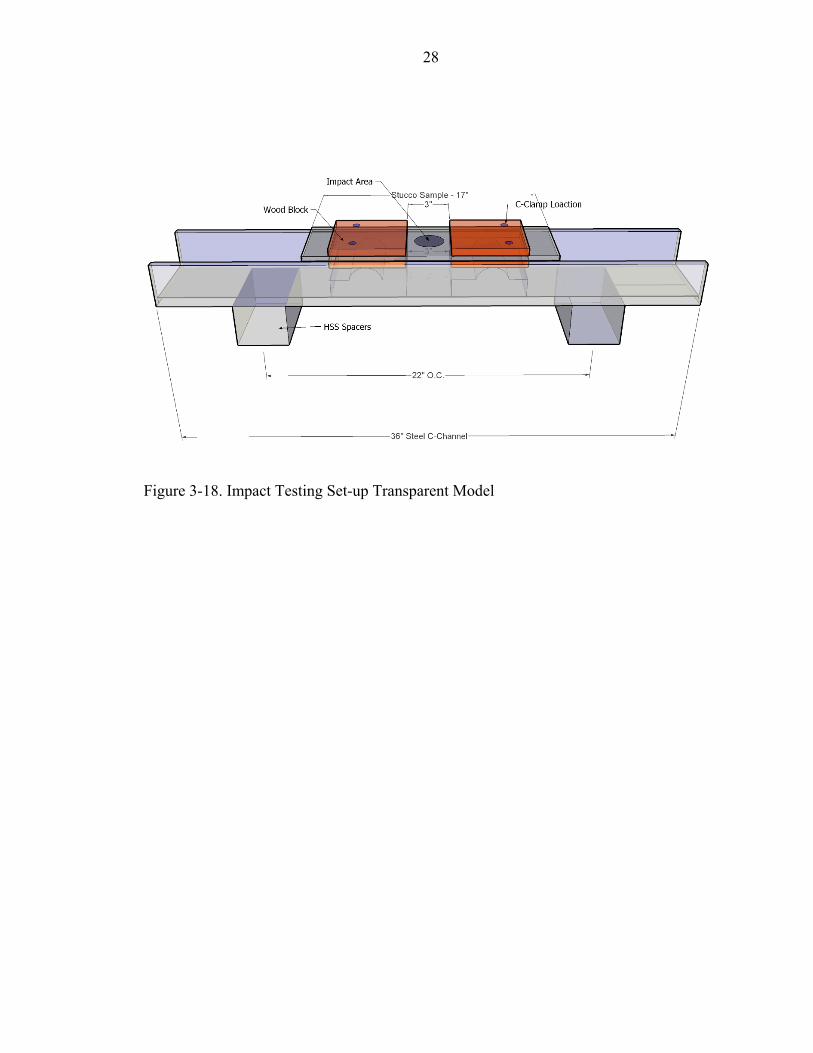
28
Figure 3-18. Impact Testing Set-up Transparent Model
29
CHAPTER 4 RESULTS
Results from third-point flexural loading, initial crack deflection, and impact
testing are included in this chapter. Samples tested for flexure were sections B, C, D, and
E of all combinations from Table 3-1. B/D (overlapped) and C/E (non-overlapped)
sections of all samples except 10 and 11 were averaged to formulate more accurate
results. Sections B, D, E were averaged for samples 10 and 11. Sample C was analyzed
of sample 10 and 11 by itself because it has one longitudinal and two transverse overlaps.
Samples tested for initial crack deflection were sections B, C, D, and select E sections.
All samples from Table 3-2 were used for impact testing. All impact samples were non-
overlapped. Two sections, A and B from the impact samples were tested using the
impact method discussed in Chapter 3. Section C of impact samples was left intact for
future testing.
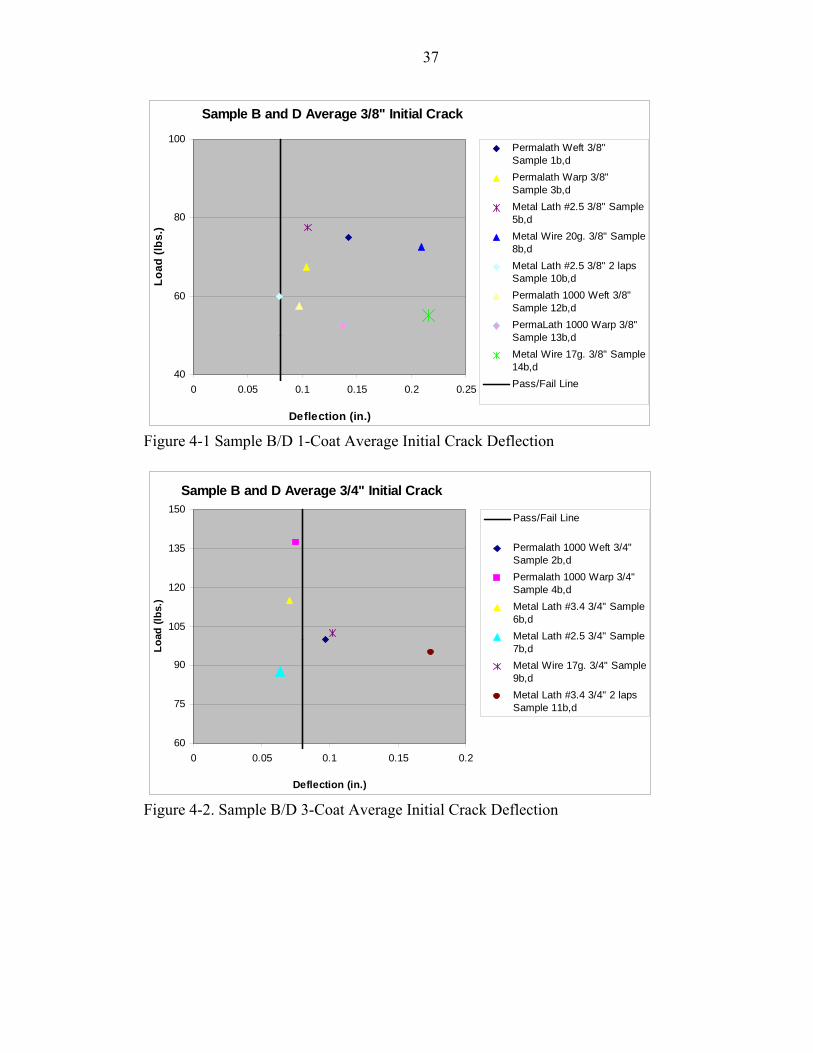
Initial Cracking Deflection Test
Data were recorded for all samples subjected to initial cracking deflection test
(Table 4.1 and Table 4.2). Samples that surpassed 0.08” of deflection before the first
crack was induced were considered to have passed this test. Samples that did not meet
this criterion were considered to have failed. This can be easily seen in Figures 4-1
through 4-4. Those samples that fall on the left side of the pass/fail line, cracked before
reaching 0.08” of deflection and those to the right of the line passed.
Sample 8 - 20 gauge wire 3/8” thick, Sample 9 - 17 gauge wire ¾” thick, and
Sample 14 - 17 gauge wire 3/8” thick were the most difficult to obtain accurate results
30
from due to a variety of factors. Some of the samples developed plastic shrinkage cracks
in them, cracks from lathing being to close to the stucco surface, and cracks during the
cutting process. During the testing process cracks were audibly heard, but the electrical
circuit was not broken immediately upon audible confirmation.
There was no need for a separation of samples 10 and 11 for analysis of initial
crack deflection test because section E of only samples 13 and 14 were tested using this
method. Sample 10 C and 11 C are longitudinally overlapped as well as transversely
overlapped in 2 locations but were left in the same table as the rest of the C sections for
ease of reading and interpreting.
Average B/D Overlapped
Four sample combinations failed from the overlapped sections; Permalath® 1000
warp and weft 3-coat and 2.5 lb. metal lath in the one-coat and three-coat applications.
Metal Wire 17 gauge and 20 gauge had the highest initial cracking deflection values of
the one-coat system. Metal Lath 3.4 lb. with 2 overlaps (2 transverse and 1 longitudinal)
had the highest initial cracking deflection value of the 3-coat system.
Average C/E Non-Overlapped
Only samples 12 and 13 are the combined average of sections C and E. The rest
of the samples in this section are only sample C data. This is because samples 1 through
11 were tested before the initial crack test was formulated. Sample 14 did not work
because the sample developed plastic shrinkage cracking. Five sample combinations
failed from the non-overlapped sections. Permalath® 1000 Warp and Weft 3-coat,
Permalath® 1000 Weft 1-coat, Metal wire 17 gauge one-coat, and 2.5 lb. metal lath three-
coat. Metal lath, 2.5 lb., one-coat and 3.4 lb. metal lath with 2 overlaps (transverse and
vertical) had the highest initial cracking deflection values.
31
Third-point Flexural Test
The samples tested in third-point flexure, were sections B, C, D, and E of all
combinations from Table 3-1. B/D (overlapped) and C/E (non-overlapped) sections were
averaged (except samples 10 and 11) to formulate more representative results. Individual
results for each sample section are contained in Appendix B.
Average Overlapped Section Results and Interpretations
In the 1-coat systems there were three overlapped combinations that stand out
above the others. Permalath® Weft, Permalath® Warp, and 2.5 lb. metal lath have the
highest tensile strengths (Table 4-3). This is easily visualized in Table 4-3 and Figure 4-
5. Permalath® Warp is however the overall best performer of the overlapped section 1-
coat samples. Permalath® Warp has the steepest slope which is a function of its modulus
of elasticity (MOE) or relative stiffness, and has the highest R^2, a linearity descriptor
(Table 4-4). The higher the Y value (Table 4-4), the steeper the slope of the best fit line
and the more elastic the sample. The steepness of this line is a function of the MOE of
the sample. The slope and the R^2 need to be looked at together to form conclusions.
The 3-coat stucco systems graphs are very different than that of the 1-coat
systems. They are undulating, which is a result of them being constructed from multiple
layers of stucco with the top layer having no reinforcement. The top layer (brown coat)
is subjected to the greatest tensile forces and cracks before the base layer (scratch coat).
This is the reason for the non-linearity of the load versus deflection curves.
In the 3-coat system there are three combinations that stand out above the rest,
Permalath® 1000 Warp, Permalath® 1000Weft, and 2.5 lb metal lath (Figure 4-6). Both
of the Permalath® 1000 samples are very linear until 4/10” of deflection where they begin
to show signs of failure from tensile forces. The 2.5 lb. metal lath has a steeper slope and
32
a higher R^2 than either of the Permalath® 1000’s (Table 4-4). The load vs. deflection
curve for the 2.5 lb. metal lath is also more linear than any of the other 3-coat overlapped
sections.
Crack area of the overlapped samples is the second part of the flexure analysis
(Table 4-5). Cracks outside the middle third were calculated and are graphed in Figure 4-
7, but are a resultant of shear and tensile forces which do not help in the determining the
“true” tensile strength of the composite material, but instead they should be looked at
individually and not combined with other tests in overall analysis. Permalath® Warp and
Permalath® 1000 Weft have the smallest crack area inside the middle third of the sample.
Metal Lath 3.4 lb. with 2 overlaps has the largest crack area of the samples.
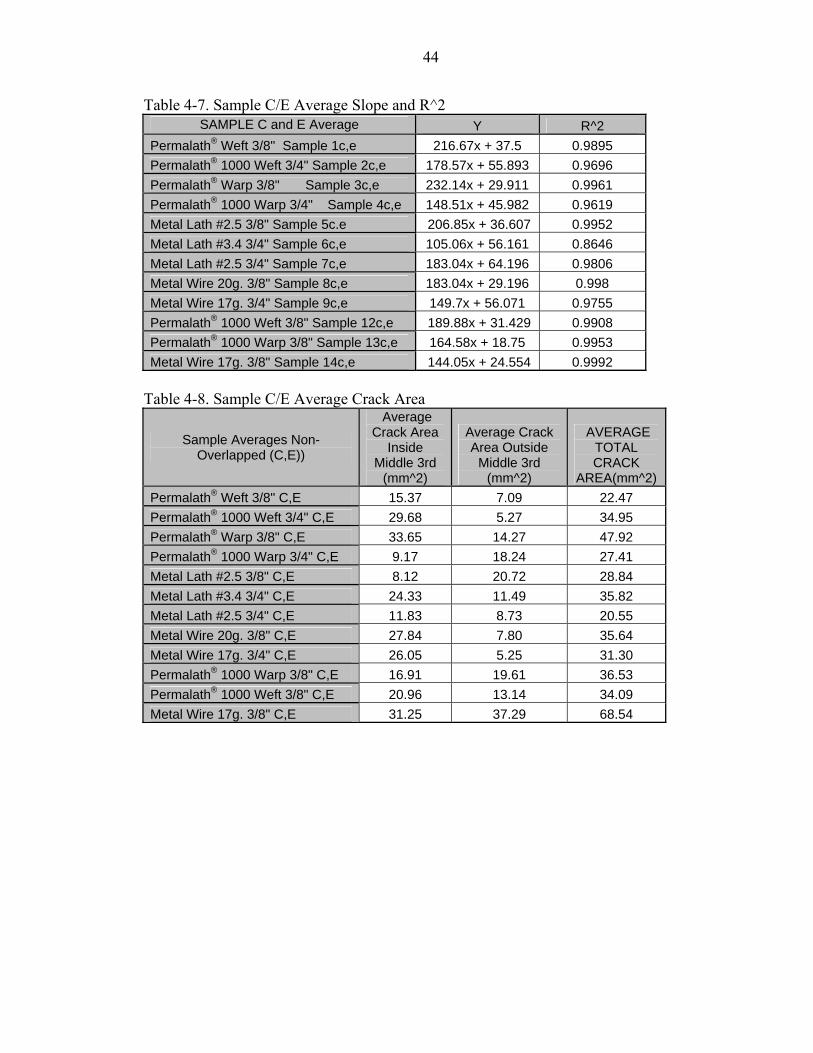
Average C/E Non-Overlapped Section Results and Interpretations
Results from the average flexure non-overlapped sections are very similar to that
of the overlapped sections flexure results (Table 4-6). The same three combinations
Permalath® Warp, Permalath® weft and 2.5 lb. metal lath had the highest tensile strengths
from the 1-coat systems ( Figure 4-8). The Permalath® Warp is the best performer of the
1-coat non-overlapped sections. Permalath® Warp has the highest tensile strength (Table
4-6), the steepest slope, and the highest R^2 value (Table 4-7).
Results for the 3-coat system non-overlapped samples are very similar to that of
the overlapped 3-coat samples (Figure 4-9). There are once again highly non-linear load
versus deflection curves as a result of the same reasons with the overlapped sections. The
2.5 lb. metal lath is the clearly the best performer followed closely by Permalath® 1000
warp and weft. Metal Lath, 2.5 lb., has the steepest slope and the highest R^2 value
(Table 4-7) indicating a higher MOE and strength combination than the other samples.
33
Metal Lath, 2.5 lb., and Metal Lath, 2.5 lb., with 2 overlaps (transverse and
longitudinal) have the smallest crack area of the 1-coat non-overlapped sections.
Permalath® 1000 Warp and 2.5 lb. metal lath had the smallest area of cracking from the
3-coat non-overlapped sections (Table 4-8 and Figure 4-10).
Sample 10 and 11 Results and Interpretations (1 Longitudinal& 2 Transverse Overlaps)
Samples 10 and 11 as mentioned earlier have a different lath layout which
prescribes a different analysis section than the other samples which are all homogeneous
in the layout of the lath and overlaps. Samples B, D, and E (2 transverse overlaps) were
combined. Sample C (2 transverse, 1 longitudinal overlap) was analyzed by itself since it
is heterogeneous from all other sections. Results for sample sections 10 and 11 are
located in Tables 4-9 through 4-12 and Figures 4-11 through 4-14.
Impact Test
Impact test samples were analyzed through a visual inspection of cracking
patterns, deformation/indentation, and broken reinforcement. One-coat and three-coat
systems were analyzed separately since they were tested at different impact energies
Figures 4-15 and 4-16). Greater impact energies were used for the 3-coat samples since
they are constructed from greater mass.
Permalath® was the best performing material in the 3/8” thick samples. The
deformation on the back side of the Permalath® samples was the smallest and there was
no broken reinforcement observed. No samples tested observed broken reinforcement.
20 gauge wire lath was the poorest performer of the 1-coat samples. It had the largest
deformation area and there was stucco that was broken apart from the lathing on the back
side (substrate side) of the sample.
34
Three-coat samples all performed almost the same. The deformation on the back
side of the samples was not visible to the naked eye which indicated none of the samples
had broken reinforcement. Deformation from the impact on the top of the sample
resulted in the slight main differences. These differences would be more likely due to
differences in the stucco mix than from the lathing. These differences were most likely
because the stucco mix was field mixed to mimic as closely as possible what would
happen in the field at the jobsite. Metal lath 3.4 lb. was best performer in this test for the
three-coat system.
When comparing the 3/8” thick to the ¾” thick samples, the differences are quite
noticeable. Top of sample indentation of the 3/8” samples was observed in every
specimen to a much greater extent than in the ¾” samples after 160 in-lbs. All samples
cracked through the center of the impact area (ex. Sample 6a in Figure 4-15) or through
the edges of the impact area and spanned from one side of the sample to the other (ex.
Sample 5a in Figure 4-16).
Individual Stucco Reinforcement Comparisons
This section is included to highlight some comparisons that are more easily
visualized through graphs with fewer samples included. This section makes comparisons
of all the averaged data for six samples types . It is just a check to make sure that data
analyzed was in fact reliable and valid.
In this section, design numbers were used instead of the material combinations for
the legend of each graph as well as the tables that include the slope and R^2 values.
Design number descriptions can be found in the corresponding sections load versus
deflection data table. The first number denotes 1-coat or 3-coat, the second grouping of
35
letters and numbers denotes the material, and the last grouping denotes the overlap status
of the sample.
Permalath® 1-Coat Comparison
This section analyzes third-point flexural loading and MOE of all Permalath® used
in 1-coat systems. Both overlapped and non-overlapped average data are included in this
section. Results are found in Tables 4-13, Table 4-14, and Figure 4-17.
Permalath® 3-Coat Comparison
This section analyzes third-point flexural loading and the MOE of all Permalath®
used in 3-coat systems. Both overlapped and non-overlapped average data are included
in this section. Results are found in Tables 4-15, Table 4-16, and Figure 4-18.
Metal Lath 1-Coat Comparison
This section analyzes third-point flexural loading and the MOE of all metal lath
used in 1-coat systems. Both overlapped and non-overlapped average data are included
in this section. Results are found in Tables 4-17, Table 4-18, and Figure 4-19.
Metal Lath 3-Coat Comparison
This section analyzes third-point flexural loading and the MOE of all metal lath
used in 3-coat systems. Both overlapped and non-overlapped average data are included
in this section. Results are found in Tables 4-19, Table 4-20, and Figure 4-20.
Metal Wire 1-Coat Comparison
This section analyzes third-point flexural loading and the MOE of all metal wire
used in 1-coat systems. Both overlapped and non-overlapped average data are included
in this section. Results are found in Tables 4-21, Table 4-22, and Figure 4-21.
36
Metal Wire 3-Coat Comparison
This section analyzes third-point flexural loading and the MOE of all metal wire
used in 3-coat systems. Both overlapped and non-overlapped average data are included
in this section. Results are found in Tables 4-23, Table 4-24, and Figure 4-22.
“Real World” Stucco Product Comparisons
Real World Comparisons are for the sake of comparing items that are frequently
used in place of one another in the field. This section is broken down into 1-coat and 3-
coat comparisons and looks at load deflections curves and slopes (MOE). One-coat data
can be found in Table 4-25, Table 4-26, and Figure 4-23. Three-coat data is located in
Table 4-27, Table 4-28, and Figure 4-24.
Table 4-1. Sample B/D Average Initial Crack Deflection
SAMPLE B and D Average (Overlapped Section) Deflection @
1st Crack (in.) Load @ 1st Crack (lbs.)
Permalath® Weft 3/8" Sample 1b,d 0.1425 75 Permalath® 1000 Weft 3/4" Sample 2b,d 0.097 100 Permalath® Warp 3/8" Sample 3b,d 0.1035 67.5 Permalath® 1000 Warp 3/4" Sample 4b,d 0.0755 137.5 Metal Lath #2.5 3/8" Sample 5b,d 0.1055 77.5 Metal Lath #3.4 3/4" Sample 6b,d 0.071 115 Metal Lath #2.5 3/4" Sample 7b,d 0.0635 87.5 Metal Wire 20g. 3/8" Sample 8b,d 0.209 72.5 Metal Wire 17g. 3/4" Sample 9b,d 0.1025 102.5 * Metal Lath #2.5 3/8" 2 laps Sample 10b,d 0.079 60 * Metal Lath #3.4 3/4" 2 laps Sample 11b,d 0.174 95 Permalath® 1000 Weft 3/8" Sample 12b,d 0.097 57.5 Permalath® 1000 Warp 3/8" Sample 13b,d 0.1375 52.5 Metal Wire 17g. 3/8" Sample 14b,d 0.216 55
* Transverse Overlaps
37
Sample B and D Average 3/8" Initial Crack
40
60
80
100
0 0.05 0.1 0.15 0.2 0.25
Deflection (in.)
Load
(lbs
.)Permalath Weft 3/8" Sample 1b,dPermalath Warp 3/8" Sample 3b,dMetal Lath #2.5 3/8" Sample5b,dMetal Wire 20g. 3/8" Sample8b,dMetal Lath #2.5 3/8" 2 laps Sample 10b,dPermalath 1000 Weft 3/8"Sample 12b,dPermaLath 1000 Warp 3/8"Sample 13b,dMetal Wire 17g. 3/8" Sample14b,dPass/Fail Line
Figure 4-1 Sample B/D 1-Coat Average Initial Crack Deflection
Sample B and D Average 3/4" Initial Crack
60
75
90
105
120
135
150
0 0.05 0.1 0.15 0.2
Deflection (in.)
Load
(lbs
.)
Pass/Fail Line
Permalath 1000 Weft 3/4"Sample 2b,dPermalath 1000 Warp 3/4" Sample 4b,dMetal Lath #3.4 3/4" Sample6b,dMetal Lath #2.5 3/4" Sample7b,dMetal Wire 17g. 3/4" Sample9b,dMetal Lath #3.4 3/4" 2 laps Sample 11b,d
Figure 4-2. Sample B/D 3-Coat Average Initial Crack Deflection
38
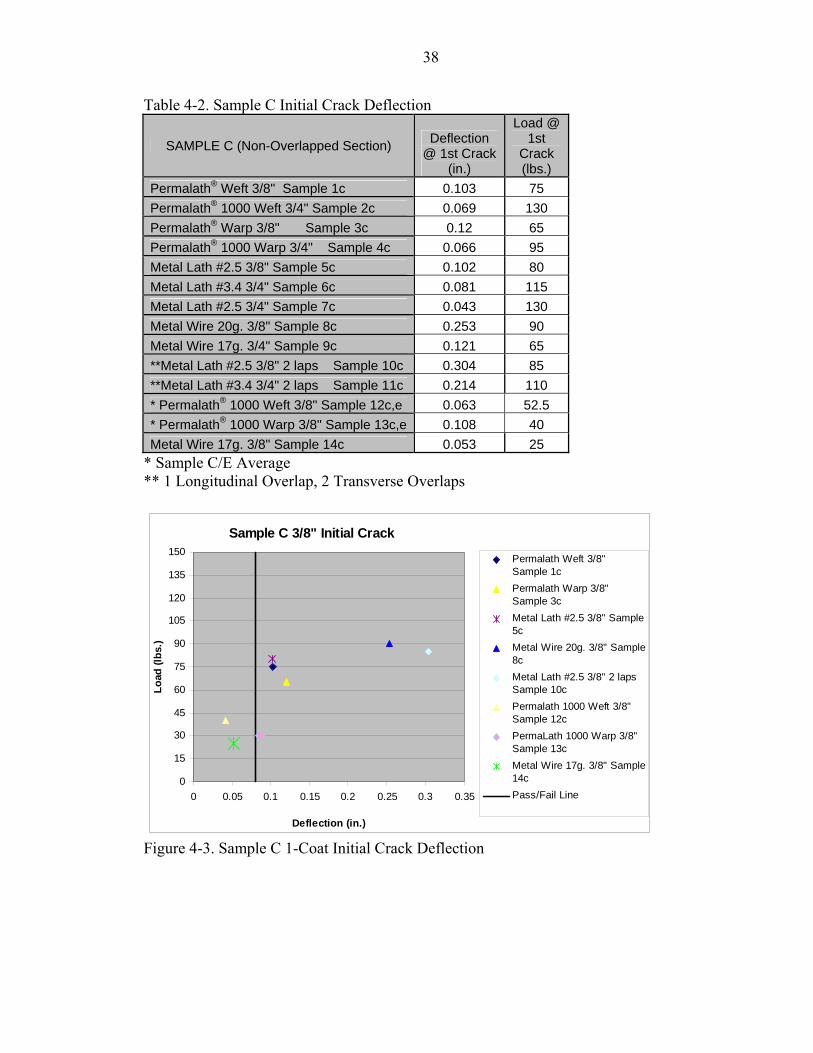
Table 4-2. Sample C Initial Crack Deflection
SAMPLE C (Non-Overlapped Section) Deflection @ 1st Crack
(in.)
Load @ 1st
Crack (lbs.)
Permalath® Weft 3/8" Sample 1c 0.103 75 Permalath® 1000 Weft 3/4" Sample 2c 0.069 130 Permalath® Warp 3/8" Sample 3c 0.12 65 Permalath® 1000 Warp 3/4" Sample 4c 0.066 95 Metal Lath #2.5 3/8" Sample 5c 0.102 80 Metal Lath #3.4 3/4" Sample 6c 0.081 115 Metal Lath #2.5 3/4" Sample 7c 0.043 130 Metal Wire 20g. 3/8" Sample 8c 0.253 90 Metal Wire 17g. 3/4" Sample 9c 0.121 65 **Metal Lath #2.5 3/8" 2 laps Sample 10c 0.304 85 **Metal Lath #3.4 3/4" 2 laps Sample 11c 0.214 110 * Permalath® 1000 Weft 3/8" Sample 12c,e 0.063 52.5 * Permalath® 1000 Warp 3/8" Sample 13c,e 0.108 40 Metal Wire 17g. 3/8" Sample 14c 0.053 25
* Sample C/E Average ** 1 Longitudinal Overlap, 2 Transverse Overlaps
Sample C 3/8" Initial Crack
0
15
30
45
60
75
90
105
120
135
150
0 0.05 0.1 0.15 0.2 0.25 0.3 0.35
Deflection (in.)
Load
(lbs
.)
Permalath Weft 3/8" Sample 1cPermalath Warp 3/8" Sample 3cMetal Lath #2.5 3/8" Sample5cMetal Wire 20g. 3/8" Sample8cMetal Lath #2.5 3/8" 2 laps Sample 10cPermalath 1000 Weft 3/8"Sample 12cPermaLath 1000 Warp 3/8"Sample 13cMetal Wire 17g. 3/8" Sample14cPass/Fail Line
Figure 4-3. Sample C 1-Coat Initial Crack Deflection
39
Sample C 3/4" Initial Crack
45
60
75
90
105
120
135
150
0 0.05 0.1 0.15 0.2 0.25
Deflection (in.)
Load
(lbs
.)
Pass/Fail Line
Permalath 1000 Weft 3/4"Sample 2cPermalath 1000 Warp 3/4" Sample 4cMetal Lath #3.4 3/4" Sample6cMetal Lath #2.5 3/4" Sample7cMetal Wire 17g. 3/4" Sample9cMetal Lath #3.4 3/4" 2 laps Sample 11c
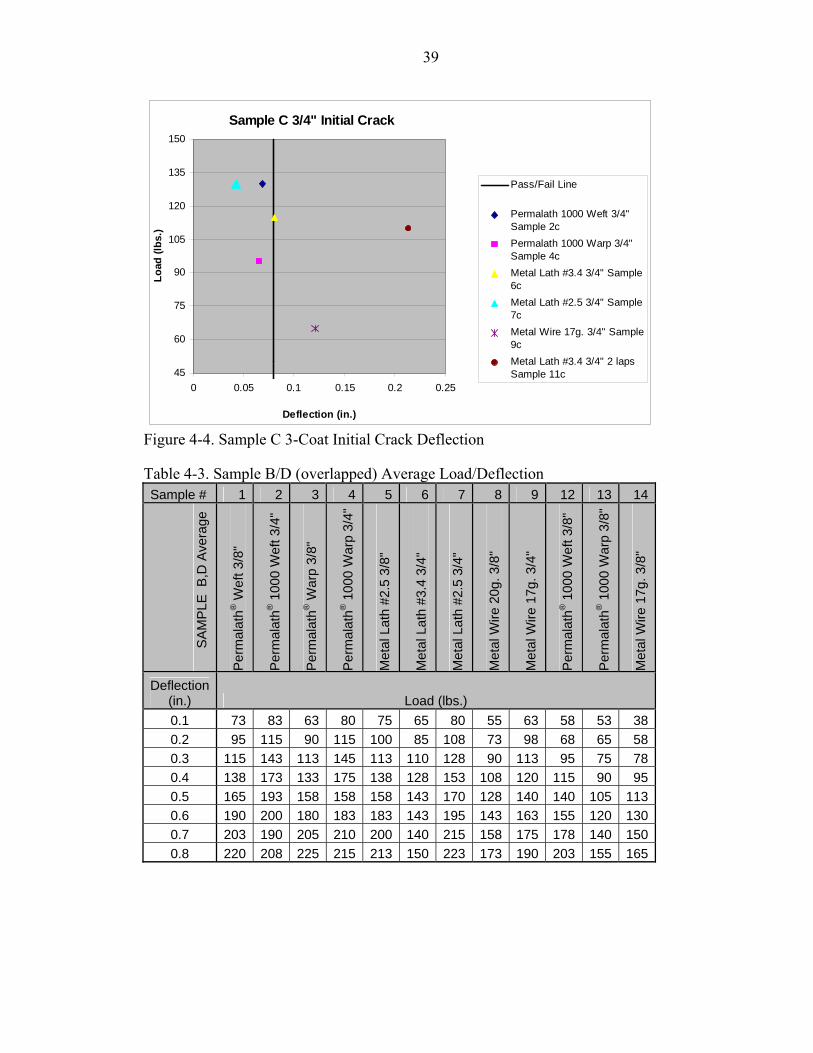
Figure 4-4. Sample C 3-Coat Initial Crack Deflection
Table 4-3. Sample B/D (overlapped) Average Load/Deflection Sample # 1 2 3 4 5 6 7 8 9 12 13 14
S
AM
PLE
B,D
Ave
rage
Per
mal
ath®
Wef
t 3/8
"
Per
mal
ath®
100
0 W
eft 3
/4"
Per
mal
ath®
War
p 3/
8"
Per
mal
ath®
100
0 W
arp
3/4"
Met
al L
ath
#2.5
3/8
"
Met
al L
ath
#3.4
3/4
"
Met
al L
ath
#2.5
3/4
"
Met
al W
ire 2
0g. 3
/8"
Met
al W
ire 1
7g. 3
/4"
Per
mal
ath®
100
0 W
eft 3
/8"
Per
mal
ath®
100
0 W
arp
3/8"
Met
al W
ire 1
7g. 3
/8"
Deflection (in.) Load (lbs.) 0.1 73 83 63 80 75 65 80 55 63 58 53 38 0.2 95 115 90 115 100 85 108 73 98 68 65 58 0.3 115 143 113 145 113 110 128 90 113 95 75 78 0.4 138 173 133 175 138 128 153 108 120 115 90 95 0.5 165 193 158 158 158 143 170 128 140 140 105 113 0.6 190 200 180 183 183 143 195 143 163 155 120 130 0.7 203 190 205 210 200 140 215 158 175 178 140 150 0.8 220 208 225 215 213 150 223 173 190 203 155 165
40
3/8" Combined B and D Average
0
50
100
150
200
250
0 0.2 0.4 0.6 0.8 1
Deflection (in.)
Load
(lbs
.)Permalath Warp
Permalath Weft
Metal Lath 2.5g.
Metal Wire 20g.
Permalath 1000 Warp
Permalath 1000 Weft
Metal Wire 17g.
Figure 4-5 Sample B/D (overlapped) 1-Coat Average Load vs. Deflection
3/4" Combined B and D Average
0
50
100
150
200
250
0 0.2 0.4 0.6 0.8 1
Deflection (in.)
Load
(lbs
.)
Permalath 1000 Warp
Permalath 1000 Weft
Metal Lath 3.4g.
Metal Lath 2.5g.
Metal Wire 17g.
Figure 4-6 Sample B/D (overlapped) 3-Coat Average Load vs. Deflection
41
Table 4-4 Sample B/D Average Slope and R^2 SAMPLE B and D Average Y R^2
Permalath® Weft 3/8" Sample 1b,d 216.96x + 52.054 0.9939 Permalath® 1000 Weft 3/4" Sample 2b,d 171.73x + 85.536 0.8696 Permalath® Warp 3/8" Sample 3b,d 230.95x + 41.696 0.9991 Permalath® 1000 Warp 3/4" Sample 4b,d 180.36x + 78.839 0.9161 Metal Lath #2.5 3/8" Sample 5b,d 201.49x + 56.518 0.9946 Metal Lath #3.4 3/4" Sample 6b,d 116.96x + 67.679 0.8553 Metal Lath #2.5 3/4" Sample 7b,d 208.93x + 64.732 0.9903 Metal Wire 20g. 3/8" Sample 8b,d 169.64x + 39.286 0.9982 Metal Wire 17g. 3/4" Sample 9b,d 172.62x + 54.821 0.9816 Permalath® 1000 Weft 3/8" Sample 12b,d 210.71x + 31.429 0.9952 Permalath® 1000 Warp 3/8" Sample 13b,d 147.92x + 33.75 0.9929 Metal Wire 17g. 3/8" Sample 14b,d 182.14x + 21.161 0.9991
Table 4-5 Sample B/D Average Crack Area
Sample Averages Overlapped (B,D)
Average Crack Area Inside Mid. 3rd (mm^2)
Average Crack Area Outside
Mid. 3rd (mm^2)
AVERAGE TOTAL CRACK
AREA(mm^2) Permalath® Weft 3/8" B,D 17.02 15.40 32.42 Permalath® 1000 Weft 3/4" B,D 23.14 10.38 33.52 Permalath® Warp 3/8" B,D 14.92 14.51 29.43 Permalath® 1000 Warp 3/4" B,D 18.26 16.89 35.15 Metal Lath #2.5 3/8" B,D 16.77 14.55 31.32 Metal Lath #3.4 3/4" B,D 24.45 3.85 28.30 Metal Lath #2.5 3/4" B,D 11.66 1.94 13.61 Metal Wire 20g. 3/8" B,D 17.74 10.68 28.42 Metal Wire 17g. 3/4" B,D 36.45 2.66 39.11 Permalath® 1000 Warp 3/8" B,D 14.07 17.91 31.98 Permalath® 1000 Weft 3/8" B,D 9.08 5.23 14.30 Metal Wire 17g. 3/8" B,D 90.04 34.93 124.96
42
Average Crack Area (mm^2) B,D Jointed Samples
0.0010.0020.0030.0040.0050.0060.0070.0080.0090.00
100.00
Permala
th Weft
3/8"
B,D
Permala
th 10
00 W
eft 3/
4" B,D
Permala
th Warp
3/8"
B,D
Permala
th 10
00 W
arp 3/
4" B,D
Metal L
ath #2
.5 3/8
" B,D
Metal L
ath #3
.4 3/4
" B,D
Metal L
ath #2
.5 3/4
" B,D
Metal W
ire 20
g. 3/8
" B,D
Metal W
ire 17
g. 3/4
" B,D
Permala
th 10
00 W
arp 3/
8" B,D
PermaL
ath 10
00 W
eft 3/
8" B,D
Metal W
ire 17
g. 3/8
" B,D
Are
a m
m^2
Inside Mid. 3rdOutside Mid. 3rd
Figure 4-7 Sample B/D Average Crack Area
Table 4-6. Sample C/E (non-overlapped) Average Load/Deflection Sample # 1 2 3 4 5 6 7 8 9 12 13 14
S
AM
PLE
C,E
Ave
rage
Per
mal
ath®
Wef
t 3/8
"
Per
mal
ath®
100
0 W
eft 3
/4"
Per
mal
ath®
War
p 3/
8"
Per
mal
ath®
100
0 W
arp
3/4"
Met
al L
ath
#2.5
3/8
"
Met
al L
ath
#3.4
3/4
"
Met
al L
ath
#2.5
3/4
"
Met
al W
ire 2
0g. 3
/8"
Met
al W
ire 1
7g. 3
/4"
Per
mal
ath®
100
0 W
eft 3
/8"
Per
mal
ath®
100
0 W
arp
3/8"
Met
al W
ire 1
7g. 3
/8"
Deflection (in.) Load (lbs.) 0.1 68 65 55 53 63 58 75 48 63 55 40 40 0.2 78 93 78 75 78 73 105 65 88 70 48 53 0.3 95 123 93 105 98 90 123 83 108 80 68 68 0.4 120 125 128 100 115 113 135 103 123 105 85 83 0.5 148 153 145 123 138 125 165 123 130 128 100 95 0.6 170 153 170 140 158 110 175 143 148 150 115 113 0.7 195 180 190 145 185 123 183 158 153 168 135 125 0.8 208 200 218 163 205 138 213 173 178 180 153 140
43
3/8" Combined C and E Average
0
50
100
150
200
250
0 0.2 0.4 0.6 0.8 1
Deflection (in.)
Load
(lbs
.)Permalath Warp
Permalath Weft
Metal Lath 2.5g.
Metal Wire 20g.
Permalath 1000 Warp
Permalath 1000 Weft
Metal Wire 17g.
Figure 4-8. Sample C/E (non-overlapped) 1-Coat Average Load vs. Deflection
3/4" Combined C and E Average
0
50
100
150
200
250
0 0.2 0.4 0.6 0.8 1
Deflection (in.)
Load
(lbs
.)
Permalath 1000 Warp
Permalath 1000 Weft
Metal Lath 3.4g.
Metal Lath 2.5g.
Metal Wire 17g.
Figure 4-9. Sample C/E (non-overlapped) 3-Coat Average Load vs. Deflection
44
Table 4-7. Sample C/E Average Slope and R^2 SAMPLE C and E Average Y R^2
Permalath® Weft 3/8" Sample 1c,e 216.67x + 37.5 0.9895 Permalath® 1000 Weft 3/4" Sample 2c,e 178.57x + 55.893 0.9696 Permalath® Warp 3/8" Sample 3c,e 232.14x + 29.911 0.9961 Permalath® 1000 Warp 3/4" Sample 4c,e 148.51x + 45.982 0.9619 Metal Lath #2.5 3/8" Sample 5c.e 206.85x + 36.607 0.9952 Metal Lath #3.4 3/4" Sample 6c,e 105.06x + 56.161 0.8646 Metal Lath #2.5 3/4" Sample 7c,e 183.04x + 64.196 0.9806 Metal Wire 20g. 3/8" Sample 8c,e 183.04x + 29.196 0.998 Metal Wire 17g. 3/4" Sample 9c,e 149.7x + 56.071 0.9755 Permalath® 1000 Weft 3/8" Sample 12c,e 189.88x + 31.429 0.9908 Permalath® 1000 Warp 3/8" Sample 13c,e 164.58x + 18.75 0.9953 Metal Wire 17g. 3/8" Sample 14c,e 144.05x + 24.554 0.9992
Table 4-8. Sample C/E Average Crack Area
Sample Averages Non-Overlapped (C,E))
Average Crack Area
Inside Middle 3rd
(mm^2)
Average Crack Area Outside
Middle 3rd (mm^2)
AVERAGE TOTAL CRACK
AREA(mm^2) Permalath® Weft 3/8" C,E 15.37 7.09 22.47 Permalath® 1000 Weft 3/4" C,E 29.68 5.27 34.95 Permalath® Warp 3/8" C,E 33.65 14.27 47.92 Permalath® 1000 Warp 3/4" C,E 9.17 18.24 27.41 Metal Lath #2.5 3/8" C,E 8.12 20.72 28.84 Metal Lath #3.4 3/4" C,E 24.33 11.49 35.82 Metal Lath #2.5 3/4" C,E 11.83 8.73 20.55 Metal Wire 20g. 3/8" C,E 27.84 7.80 35.64 Metal Wire 17g. 3/4" C,E 26.05 5.25 31.30 Permalath® 1000 Warp 3/8" C,E 16.91 19.61 36.53 Permalath® 1000 Weft 3/8" C,E 20.96 13.14 34.09 Metal Wire 17g. 3/8" C,E 31.25 37.29 68.54
45
Average Crack Area (mm^2) C,E Non-Jointed Samples
0.0010.0020.0030.0040.0050.0060.0070.0080.0090.00
100.00
Permala
th W
eft 3/
8" C,E
Permala
th 100
0 Weft
3/4" C
,E
Permala
th W
arp 3/8"
C,E
Permala
th 100
0 Warp
3/4" C
,E
Metal L
ath #2
.5 3/8"
C,E
Metal L
ath #3
.4 3/4"
C,E
Metal L
ath #2
.5 3/4"
C,E
Metal W
ire 20
g. 3/8"
C,E
Metal W
ire 17
g. 3/4"
C,E
Permala
th 100
0 Warp
3/8" C
,E
PermaL
ath 100
0 Weft
3/8" C
,E
Metal W
ire 17
g. 3/8"
C,E
Are
a m
m^2
Inside Mid. 3rdOutside Mid. 3rd
Figure 4-10. Sample C/E Average Crack Area
Table 4-9. Sample 10 and 11 B/D/E Average Load/Deflection
Sample # 10 11
SAMPLE B, D, E Metal Lath #2.5 3/8" 2 laps
Metal Lath #3.4 3/4" 2 laps
Deflection (in.) Load (lbs.) 0.1 53 72 0.2 68 85 0.3 73 83 0.4 85 95 0.5 95 113 0.6 103 127 0.7 112 143 0.8 123 157
46
Sample 10/11 B,D,E Average
0
50
100
150
200
250
0 0.2 0.4 0.6 0.8 1
Deflection (in.)
Load
(lbs
.)
Metal Lath #2.5 3/8" 2 laps Metal Lath #3.4 3/4" 2 laps
Figure 4-11. Sample 10 and 11 B/D/E Average Load/Deflection
Table 4-10. Sample 10 and 11 B/D/E Average Slope and R^2 SAMPLE B, D, E Average Y R^2
Metal Lath #2.5 3/8" 2 laps Sample 10b,d 96.032x + 45.952 0.9946 Metal Lath #3.4 3/4" 2 laps Sample 11b,d 123.21x + 53.929 0.9654
Average Crack Area (mm^2) B,D,E 2 Horizontal Jointed Samples
0.0010.0020.0030.0040.0050.0060.0070.0080.0090.00
100.00
Metal Lath #2.5 3/8" 2 jointsB,D,E
Metal Lath #3.4 3/4" 2 jointsB,D,E
Area
mm
^2 Inside Mid. 3rd.Outside Mid. 3rd.
Figure 4-12. Sample 10 & 11 B, D, E Average Crack Area Average
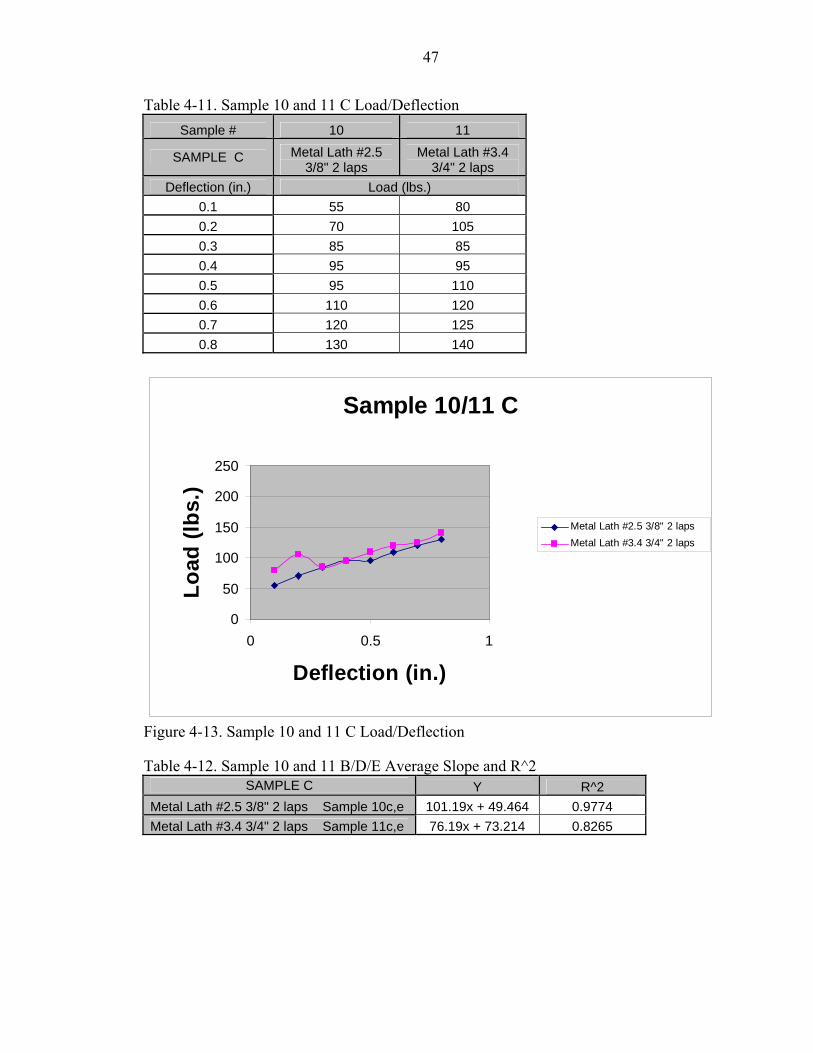
47
Table 4-11. Sample 10 and 11 C Load/Deflection Sample # 10 11
SAMPLE C Metal Lath #2.5 3/8" 2 laps
Metal Lath #3.4 3/4" 2 laps
Deflection (in.) Load (lbs.) 0.1 55 80 0.2 70 105 0.3 85 85 0.4 95 95 0.5 95 110 0.6 110 120 0.7 120 125 0.8 130 140
Sample 10/11 C
0
50
100
150
200
250
0 0.5 1
Deflection (in.)
Load
(lbs
.)
Metal Lath #2.5 3/8" 2 laps Metal Lath #3.4 3/4" 2 laps
Figure 4-13. Sample 10 and 11 C Load/Deflection
Table 4-12. Sample 10 and 11 B/D/E Average Slope and R^2 SAMPLE C Y R^2
Metal Lath #2.5 3/8" 2 laps Sample 10c,e 101.19x + 49.464 0.9774 Metal Lath #3.4 3/4" 2 laps Sample 11c,e 76.19x + 73.214 0.8265
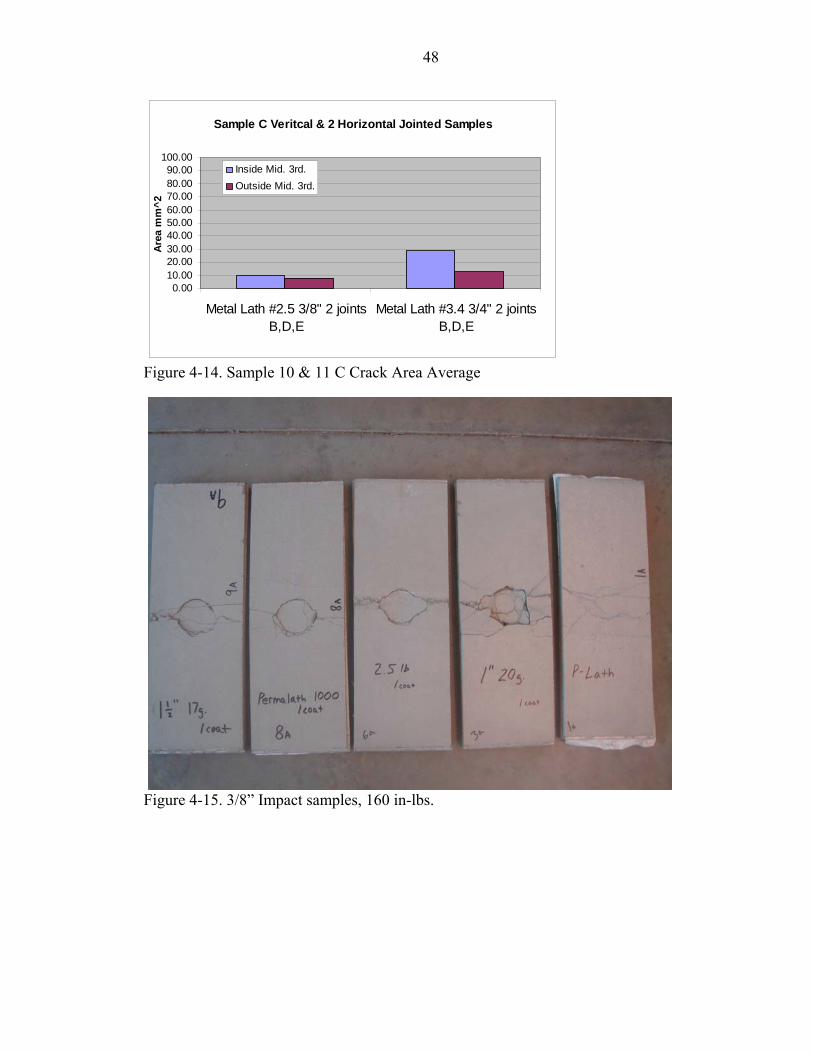
48
Sample C Veritcal & 2 Horizontal Jointed Samples
0.0010.0020.0030.0040.0050.0060.0070.0080.0090.00
100.00
Metal Lath #2.5 3/8" 2 jointsB,D,E
Metal Lath #3.4 3/4" 2 jointsB,D,E
Area
mm
^2Inside Mid. 3rd.Outside Mid. 3rd.
Figure 4-14. Sample 10 & 11 C Crack Area Average
Figure 4-15. 3/8” Impact samples, 160 in-lbs.
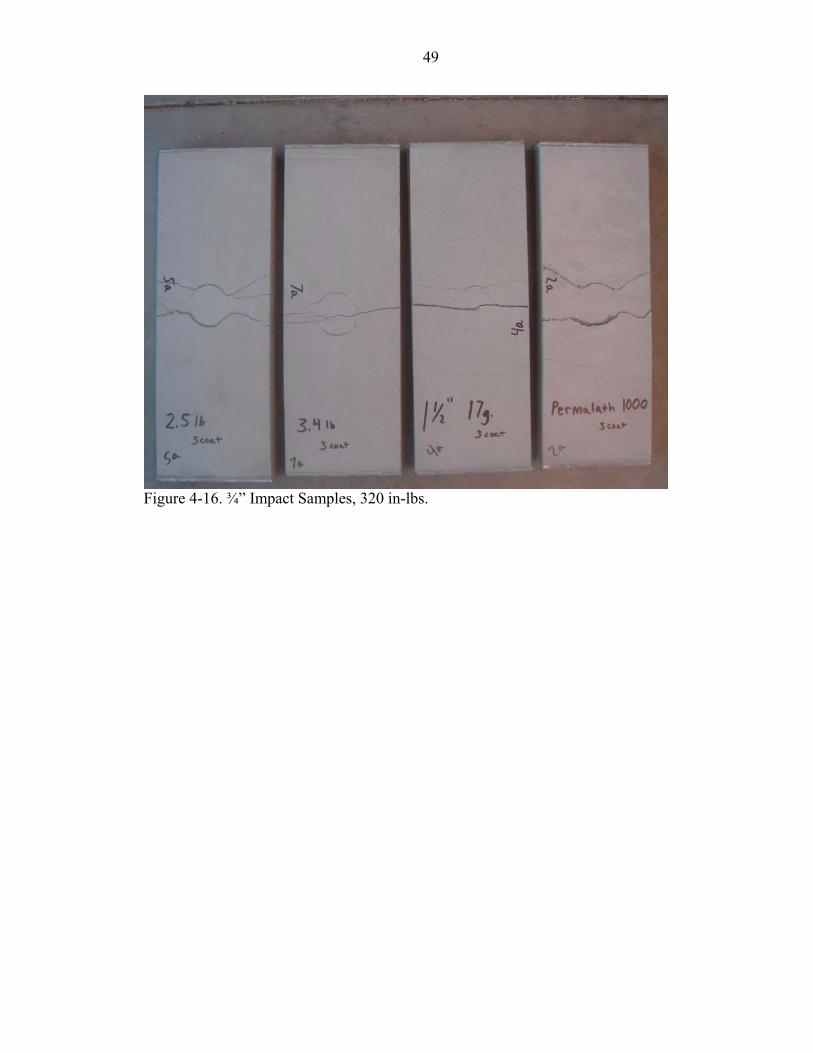
49
Figure 4-16. ¾” Impact Samples, 320 in-lbs.
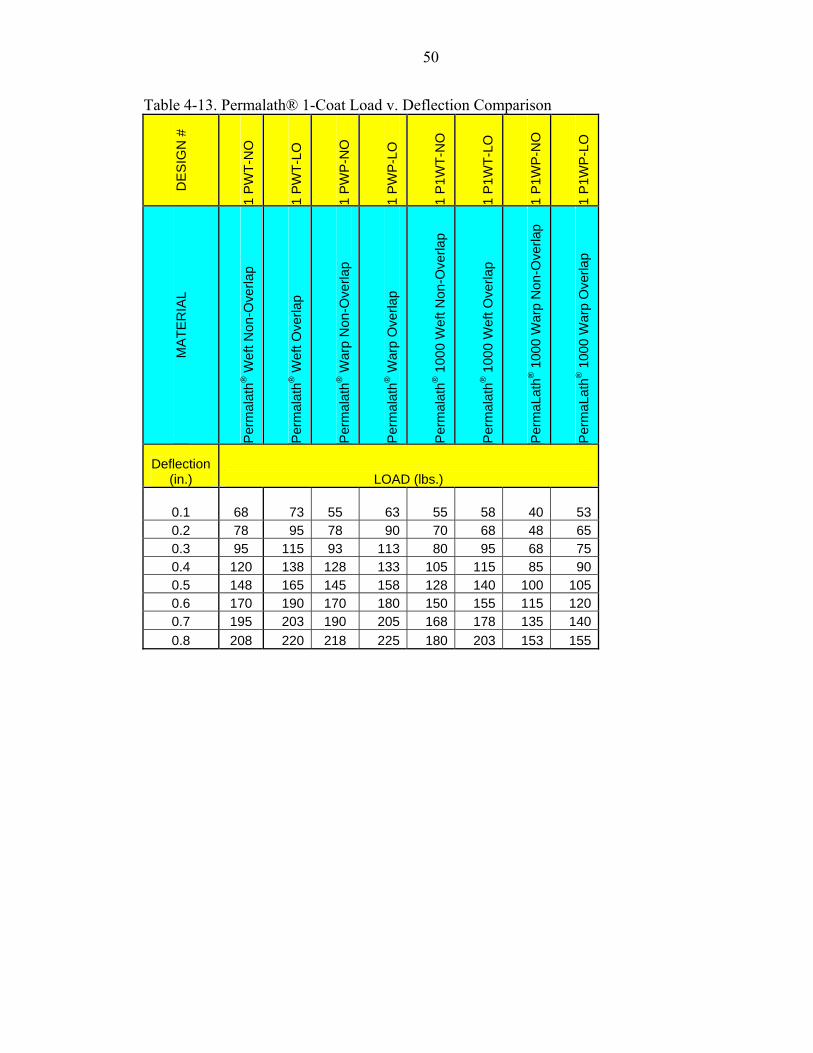
50
Table 4-13. Permalath® 1-Coat Load v. Deflection Comparison
DE
SIG
N #
1 P
WT-
NO
1 P
WT-
LO
1 P
WP
-NO
1 P
WP
-LO
1 P
1WT-
NO
1 P
1WT-
LO
1 P
1WP
-NO
1 P
1WP
-LO
MA
TER
IAL
Per
mal
ath®
Wef
t Non
-Ove
rlap
Per
mal
ath®
Wef
t Ove
rlap
Per
mal
ath®
War
p N
on-O
verla
p
Per
mal
ath®
War
p O
verla
p
Per
mal
ath®
100
0 W
eft N
on-O
verla
p
Per
mal
ath®
100
0 W
eft O
verla
p
Per
maL
ath®
100
0 W
arp
Non
-Ove
rlap
Per
maL
ath®
100
0 W
arp
Ove
rlap
Deflection (in.) LOAD (lbs.)
0.1 68 73 55 63 55 58 40 53 0.2 78 95 78 90 70 68 48 65 0.3 95 115 93 113 80 95 68 75 0.4 120 138 128 133 105 115 85 90 0.5 148 165 145 158 128 140 100 105 0.6 170 190 170 180 150 155 115 120 0.7 195 203 190 205 168 178 135 140 0.8 208 220 218 225 180 203 153 155
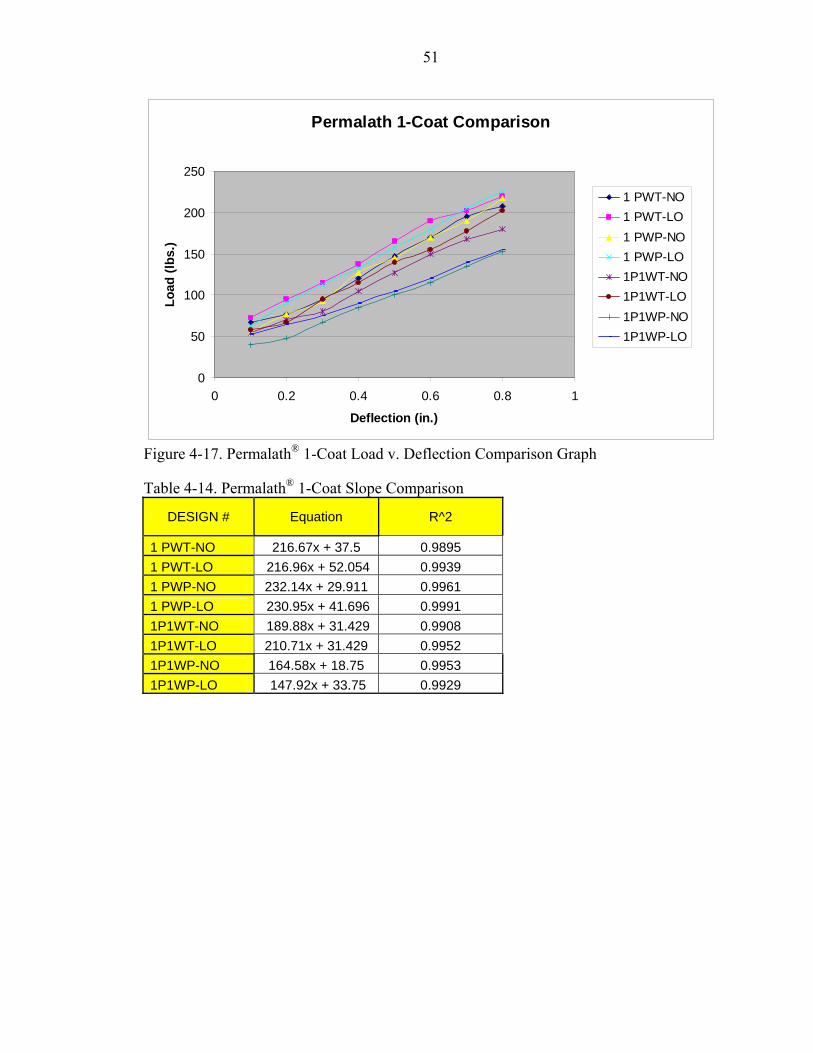
51
Permalath 1-Coat Comparison
0
50
100
150
200
250
0 0.2 0.4 0.6 0.8 1
Deflection (in.)
Load
(lbs
.)
1 PWT-NO1 PWT-LO1 PWP-NO1 PWP-LO1P1WT-NO1P1WT-LO1P1WP-NO1P1WP-LO
Figure 4-17. Permalath® 1-Coat Load v. Deflection Comparison Graph
Table 4-14. Permalath® 1-Coat Slope Comparison
DESIGN # Equation R^2
1 PWT-NO 216.67x + 37.5 0.9895 1 PWT-LO 216.96x + 52.054 0.9939 1 PWP-NO 232.14x + 29.911 0.9961 1 PWP-LO 230.95x + 41.696 0.9991 1P1WT-NO 189.88x + 31.429 0.9908 1P1WT-LO 210.71x + 31.429 0.9952 1P1WP-NO 164.58x + 18.75 0.9953 1P1WP-LO 147.92x + 33.75 0.9929
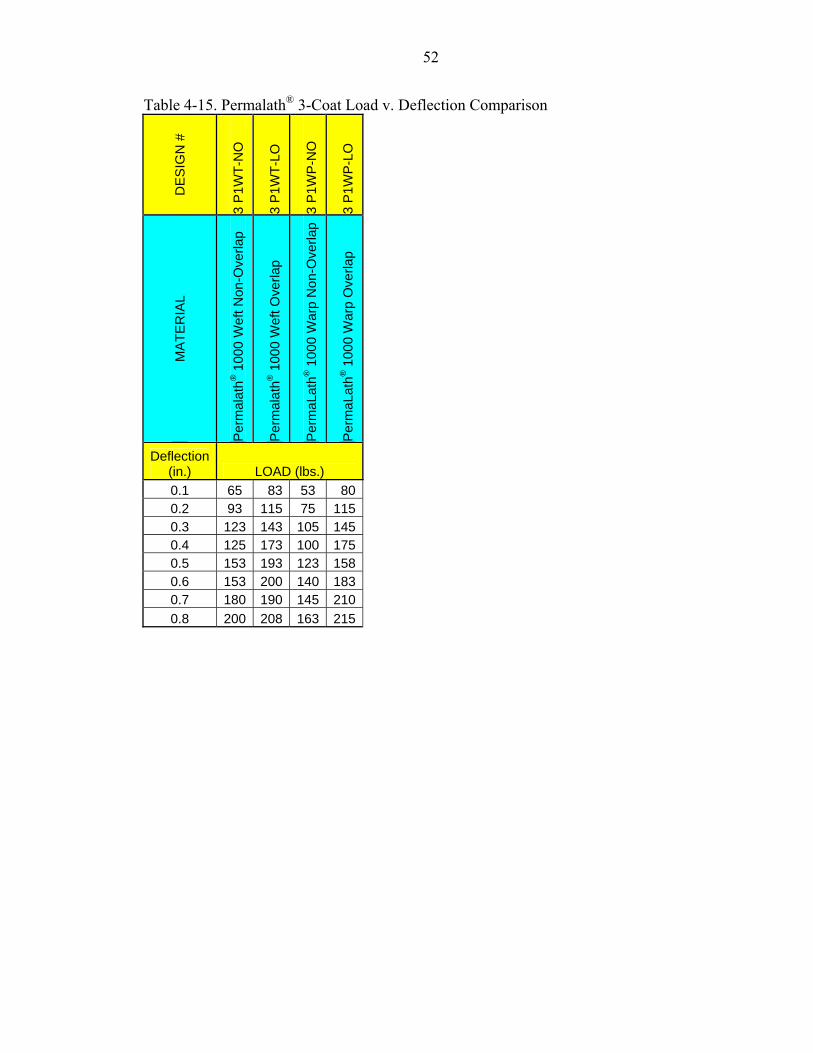
52
Table 4-15. Permalath® 3-Coat Load v. Deflection Comparison
DE
SIG
N #
3 P
1WT-
NO
3 P
1WT-
LO
3 P
1WP
-NO
3 P
1WP
-LO
MA
TER
IAL
Per
mal
ath®
100
0 W
eft N
on-O
verla
p
Per
mal
ath®
100
0 W
eft O
verla
p
Per
maL
ath®
100
0 W
arp
Non
-Ove
rlap
Per
maL
ath®
100
0 W
arp
Ove
rlap
Deflection (in.) LOAD (lbs.) 0.1 65 83 53 800.2 93 115 75 1150.3 123 143 105 1450.4 125 173 100 1750.5 153 193 123 1580.6 153 200 140 1830.7 180 190 145 2100.8 200 208 163 215
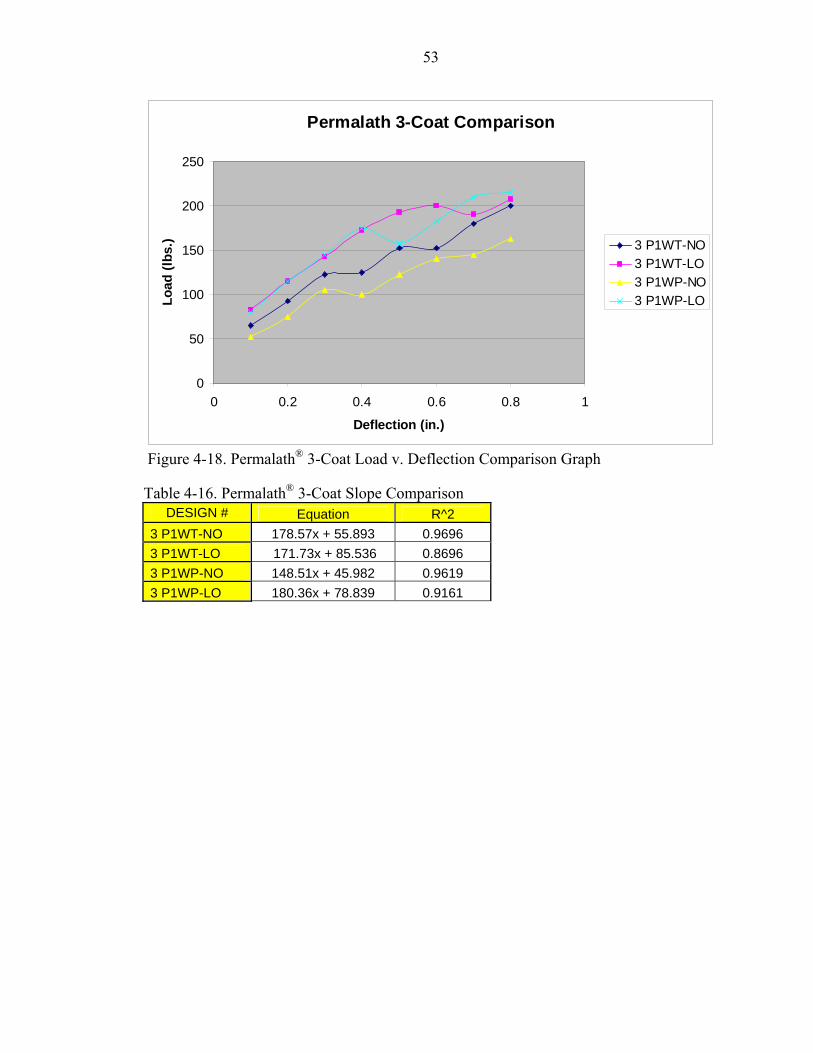
53
Permalath 3-Coat Comparison
0
50
100
150
200
250
0 0.2 0.4 0.6 0.8 1
Deflection (in.)
Load
(lbs
.) 3 P1WT-NO3 P1WT-LO3 P1WP-NO3 P1WP-LO
Figure 4-18. Permalath® 3-Coat Load v. Deflection Comparison Graph
Table 4-16. Permalath® 3-Coat Slope Comparison DESIGN # Equation R^2
3 P1WT-NO 178.57x + 55.893 0.9696 3 P1WT-LO 171.73x + 85.536 0.8696 3 P1WP-NO 148.51x + 45.982 0.9619 3 P1WP-LO 180.36x + 78.839 0.9161
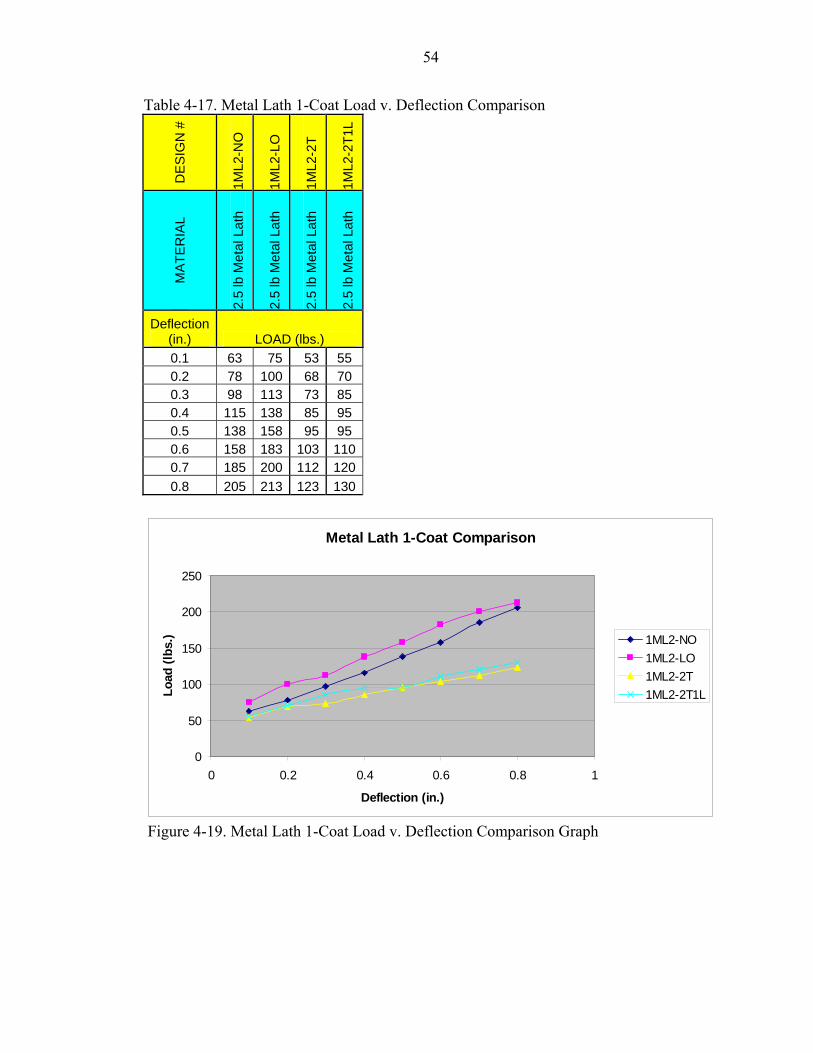
54
Table 4-17. Metal Lath 1-Coat Load v. Deflection Comparison
DE
SIG
N #
1ML2
-NO
1ML2
-LO
1ML2
-2T
1ML2
-2T1
L
MA
TER
IAL
2.5
lb M
etal
Lat
h
2.5
lb M
etal
Lat
h
2.5
lb M
etal
Lat
h
2.5
lb M
etal
Lat
h
Deflection (in.) LOAD (lbs.) 0.1 63 75 53 55 0.2 78 100 68 70 0.3 98 113 73 85 0.4 115 138 85 95 0.5 138 158 95 95 0.6 158 183 103 1100.7 185 200 112 1200.8 205 213 123 130
Metal Lath 1-Coat Comparison
0
50
100
150
200
250
0 0.2 0.4 0.6 0.8 1
Deflection (in.)
Load
(lbs
.) 1ML2-NO1ML2-LO1ML2-2T1ML2-2T1L
Figure 4-19. Metal Lath 1-Coat Load v. Deflection Comparison Graph
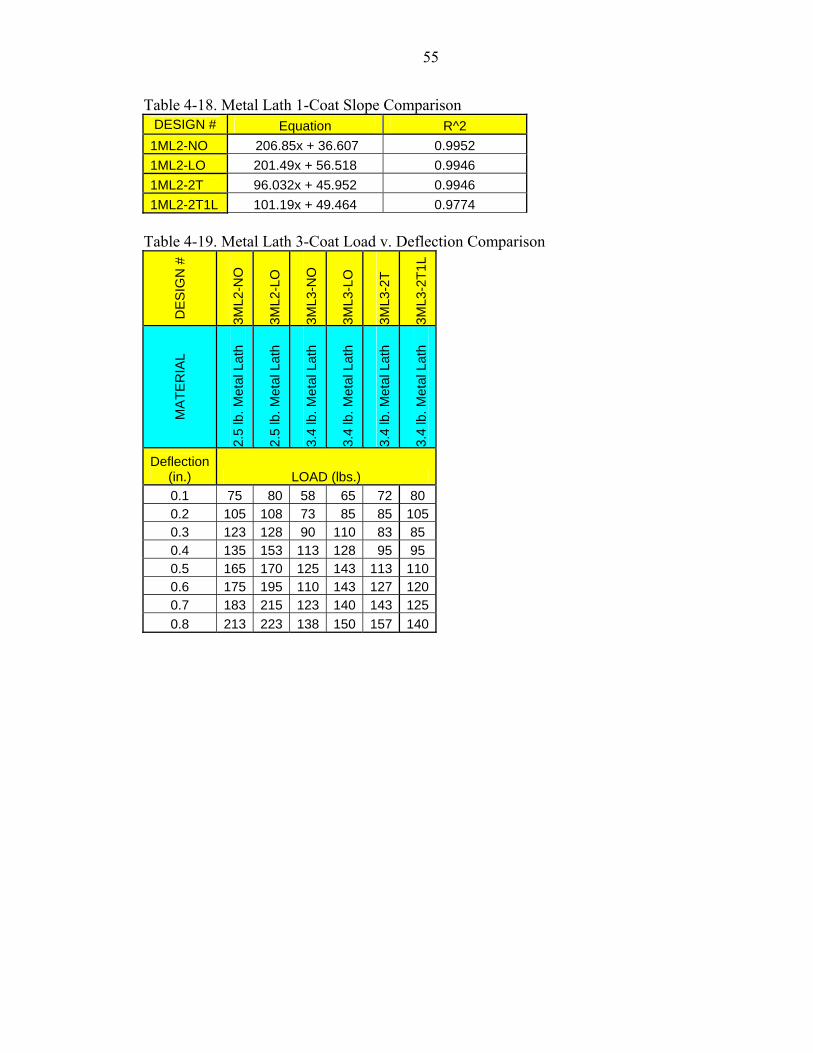
55
Table 4-18. Metal Lath 1-Coat Slope Comparison DESIGN # Equation R^2
1ML2-NO 206.85x + 36.607 0.9952 1ML2-LO 201.49x + 56.518 0.9946 1ML2-2T 96.032x + 45.952 0.9946 1ML2-2T1L 101.19x + 49.464 0.9774
Table 4-19. Metal Lath 3-Coat Load v. Deflection Comparison
DE
SIG
N #
3ML2
-NO
3ML2
-LO
3ML3
-NO
3ML3
-LO
3ML3
-2T
3ML3
-2T1
L
MA
TER
IAL
2.5
lb. M
etal
Lat
h
2.5
lb. M
etal
Lat
h
3.4
lb. M
etal
Lat
h
3.4
lb. M
etal
Lat
h
3.4
lb. M
etal
Lat
h
3.4
lb. M
etal
Lat
h
Deflection (in.) LOAD (lbs.) 0.1 75 80 58 65 72 80 0.2 105 108 73 85 85 1050.3 123 128 90 110 83 85 0.4 135 153 113 128 95 95 0.5 165 170 125 143 113 1100.6 175 195 110 143 127 1200.7 183 215 123 140 143 1250.8 213 223 138 150 157 140
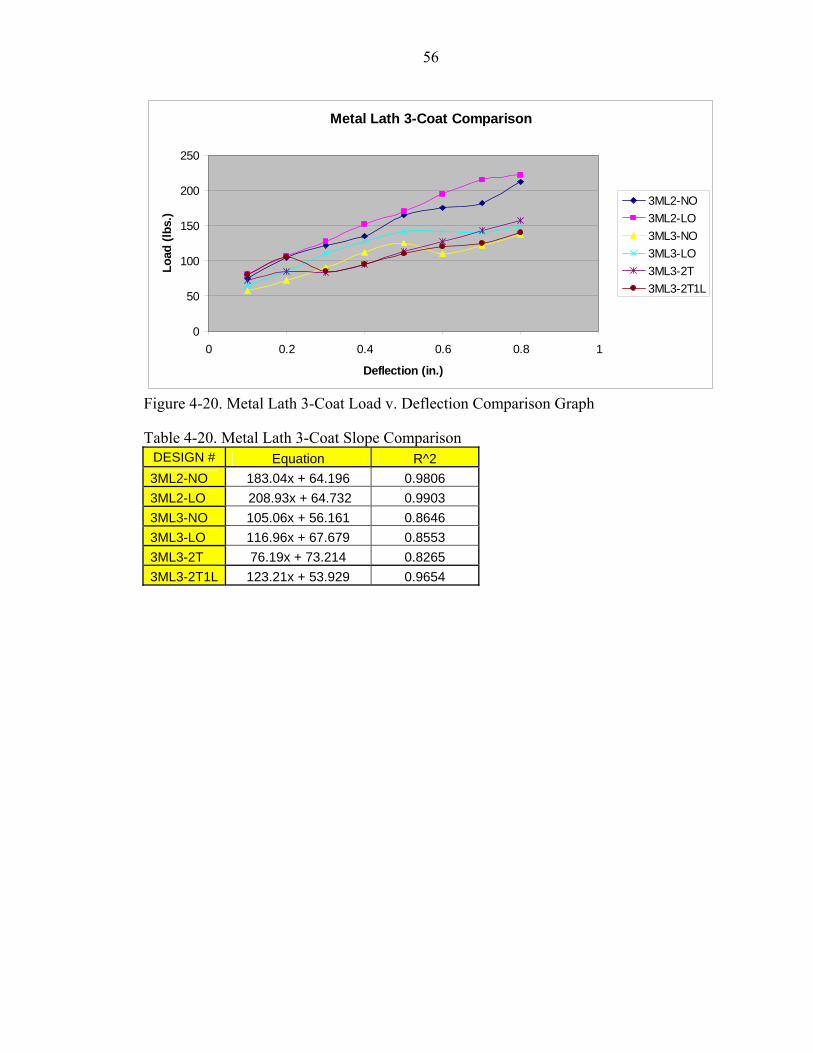
56
Metal Lath 3-Coat Comparison
0
50
100
150
200
250
0 0.2 0.4 0.6 0.8 1
Deflection (in.)
Load
(lbs
.)
3ML2-NO3ML2-LO3ML3-NO3ML3-LO3ML3-2T3ML3-2T1L
Figure 4-20. Metal Lath 3-Coat Load v. Deflection Comparison Graph
Table 4-20. Metal Lath 3-Coat Slope Comparison DESIGN # Equation R^2 3ML2-NO 183.04x + 64.196 0.9806 3ML2-LO 208.93x + 64.732 0.9903 3ML3-NO 105.06x + 56.161 0.8646 3ML3-LO 116.96x + 67.679 0.8553 3ML3-2T 76.19x + 73.214 0.8265 3ML3-2T1L 123.21x + 53.929 0.9654
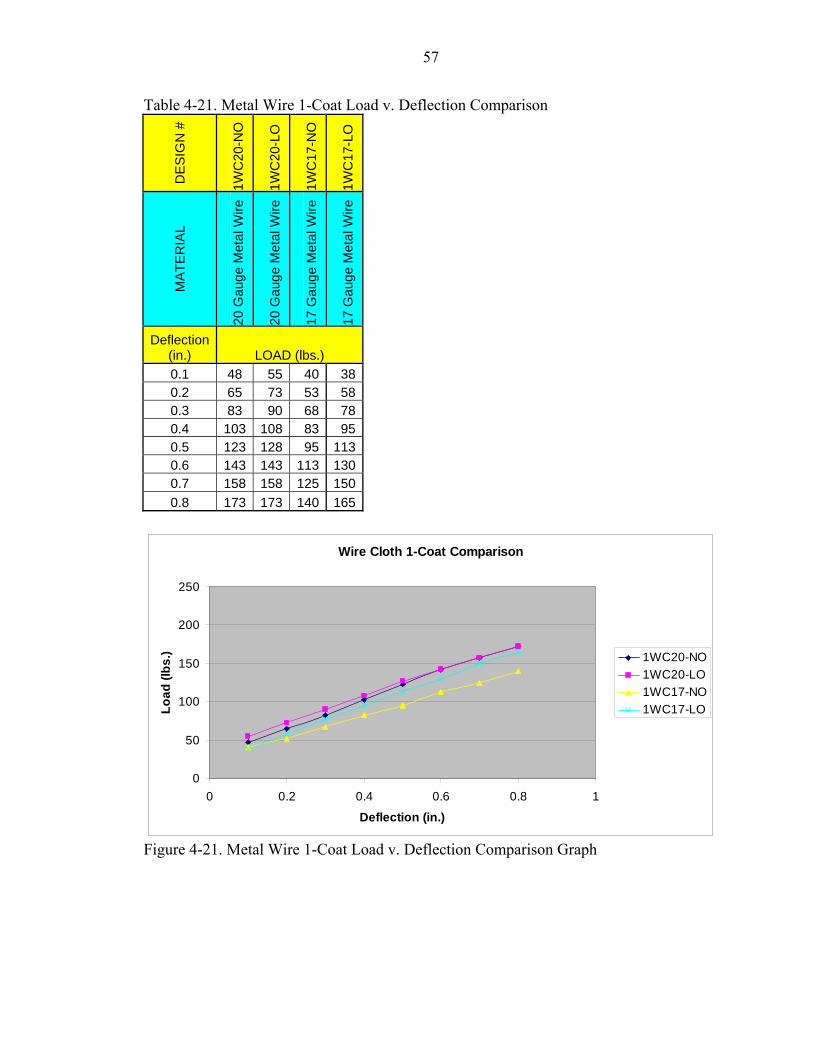
57
Table 4-21. Metal Wire 1-Coat Load v. Deflection Comparison
DE
SIG
N #
1WC
20-N
O
1WC
20-L
O
1WC
17-N
O
1WC
17-L
O
MA
TER
IAL
20 G
auge
Met
al W
ire
20 G
auge
Met
al W
ire
17 G
auge
Met
al W
ire
17 G
auge
Met
al W
ire
Deflection (in.) LOAD (lbs.) 0.1 48 55 40 380.2 65 73 53 580.3 83 90 68 780.4 103 108 83 950.5 123 128 95 1130.6 143 143 113 1300.7 158 158 125 1500.8 173 173 140 165
Wire Cloth 1-Coat Comparison
0
50
100
150
200
250
0 0.2 0.4 0.6 0.8 1
Deflection (in.)
Load
(lbs
.) 1WC20-NO1WC20-LO1WC17-NO1WC17-LO
Figure 4-21. Metal Wire 1-Coat Load v. Deflection Comparison Graph
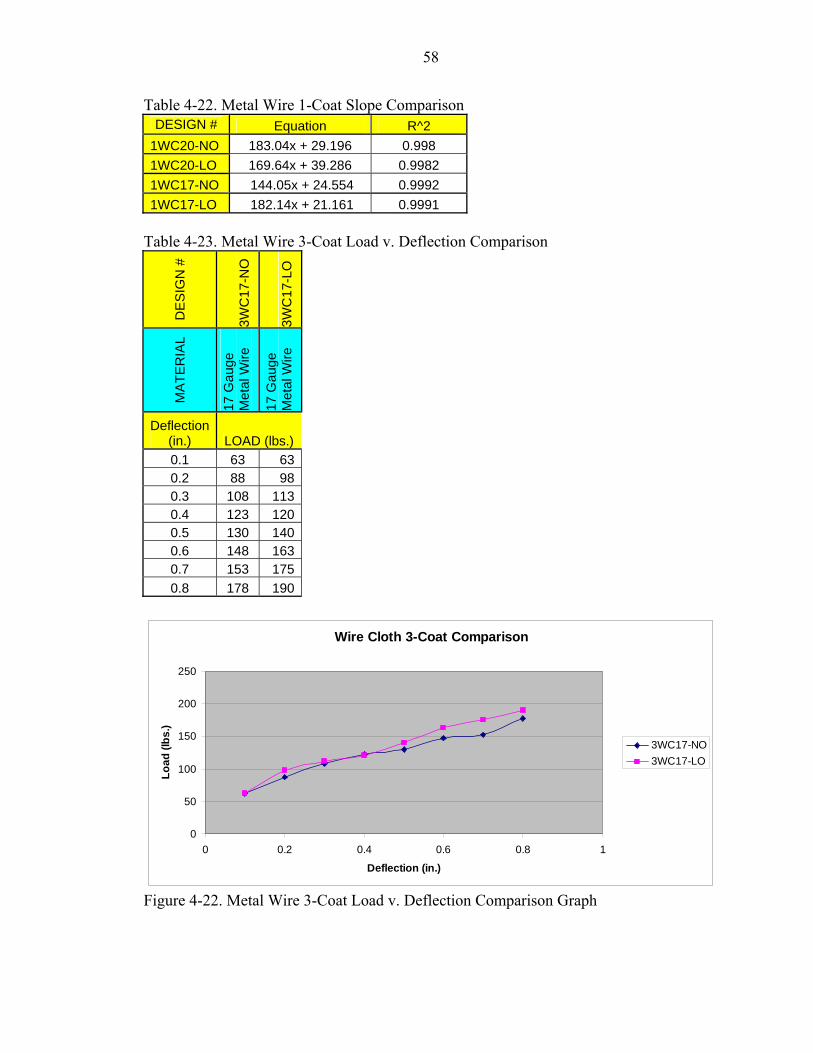
58
Table 4-22. Metal Wire 1-Coat Slope Comparison DESIGN # Equation R^2
1WC20-NO 183.04x + 29.196 0.998 1WC20-LO 169.64x + 39.286 0.9982 1WC17-NO 144.05x + 24.554 0.9992 1WC17-LO 182.14x + 21.161 0.9991
Table 4-23. Metal Wire 3-Coat Load v. Deflection Comparison
DE
SIG
N #
3WC
17-N
O
3WC
17-L
O
MA
TER
IAL
17 G
auge
M
etal
Wire
17 G
auge
M
etal
Wire
Deflection (in.) LOAD (lbs.) 0.1 63 63 0.2 88 98 0.3 108 113 0.4 123 120 0.5 130 140 0.6 148 163 0.7 153 175 0.8 178 190
Wire Cloth 3-Coat Comparison
0
50
100
150
200
250
0 0.2 0.4 0.6 0.8 1
Deflection (in.)
Load
(lbs
.)
3WC17-NO3WC17-LO
Figure 4-22. Metal Wire 3-Coat Load v. Deflection Comparison Graph
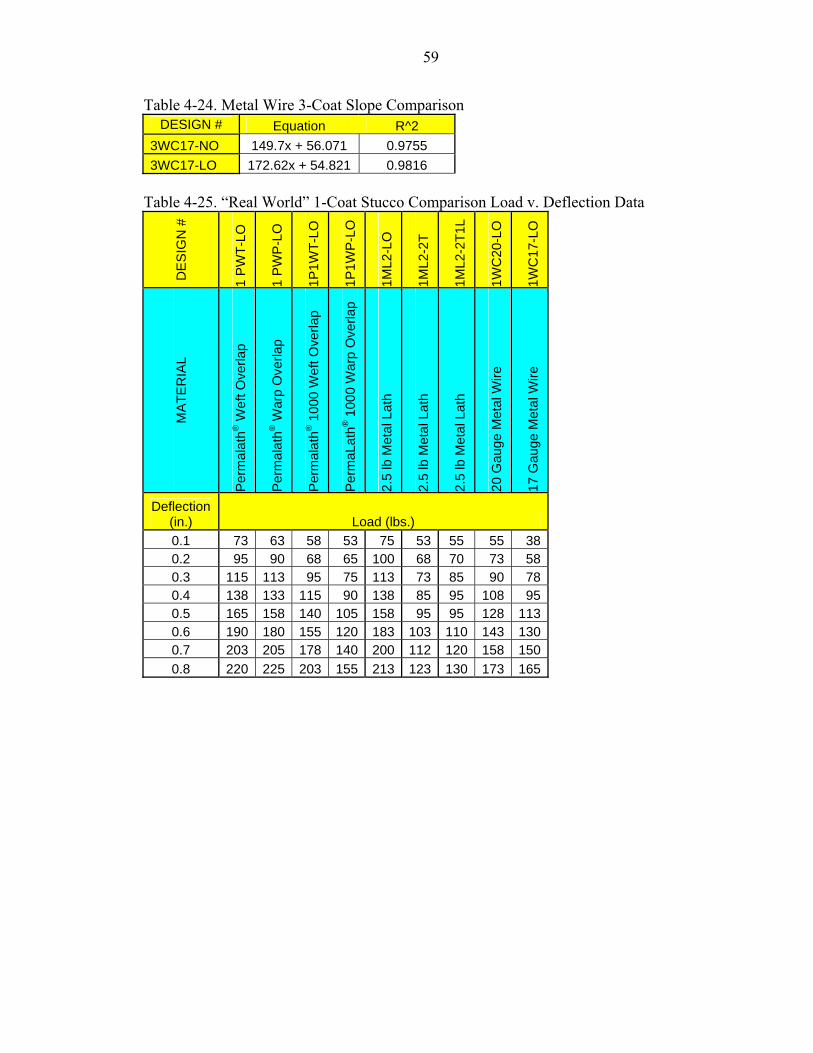
59
Table 4-24. Metal Wire 3-Coat Slope Comparison DESIGN # Equation R^2
3WC17-NO 149.7x + 56.071 0.9755 3WC17-LO 172.62x + 54.821 0.9816
Table 4-25. “Real World” 1-Coat Stucco Comparison Load v. Deflection Data
DE
SIG
N #
1 P
WT-
LO
1 P
WP
-LO
1P1W
T-LO
1P1W
P-LO
1ML2
-LO
1ML2
-2T
1ML2
-2T1
L
1WC
20-L
O
1WC
17-L
O
MA
TER
IAL
Per
mal
ath®
Wef
t Ove
rlap
Per
mal
ath®
War
p O
verla
p
Per
mal
ath®
100
0 W
eft O
verla
p
Per
maL
ath®
100
0 W
arp
Ove
rlap
2.5
lb M
etal
Lat
h
2.5
lb M
etal
Lat
h
2.5
lb M
etal
Lat
h
20 G
auge
Met
al W
ire
17 G
auge
Met
al W
ire
Deflection (in.) Load (lbs.) 0.1 73 63 58 53 75 53 55 55 380.2 95 90 68 65 100 68 70 73 580.3 115 113 95 75 113 73 85 90 780.4 138 133 115 90 138 85 95 108 950.5 165 158 140 105 158 95 95 128 1130.6 190 180 155 120 183 103 110 143 1300.7 203 205 178 140 200 112 120 158 1500.8 220 225 203 155 213 123 130 173 165
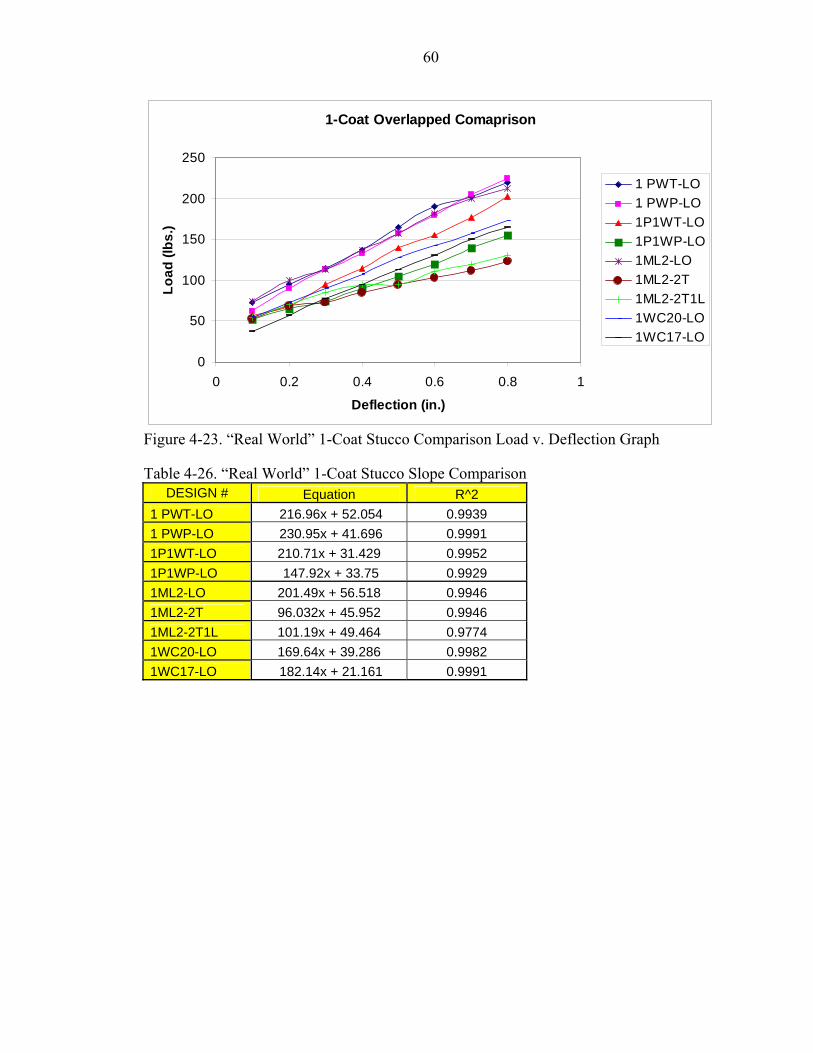
60
1-Coat Overlapped Comaprison
0
50
100
150
200
250
0 0.2 0.4 0.6 0.8 1
Deflection (in.)
Load
(lbs
.)1 PWT-LO1 PWP-LO1P1WT-LO1P1WP-LO1ML2-LO1ML2-2T1ML2-2T1L1WC20-LO1WC17-LO
Figure 4-23. “Real World” 1-Coat Stucco Comparison Load v. Deflection Graph
Table 4-26. “Real World” 1-Coat Stucco Slope Comparison DESIGN # Equation R^2
1 PWT-LO 216.96x + 52.054 0.9939 1 PWP-LO 230.95x + 41.696 0.9991 1P1WT-LO 210.71x + 31.429 0.9952 1P1WP-LO 147.92x + 33.75 0.9929 1ML2-LO 201.49x + 56.518 0.9946 1ML2-2T 96.032x + 45.952 0.9946 1ML2-2T1L 101.19x + 49.464 0.9774 1WC20-LO 169.64x + 39.286 0.9982 1WC17-LO 182.14x + 21.161 0.9991
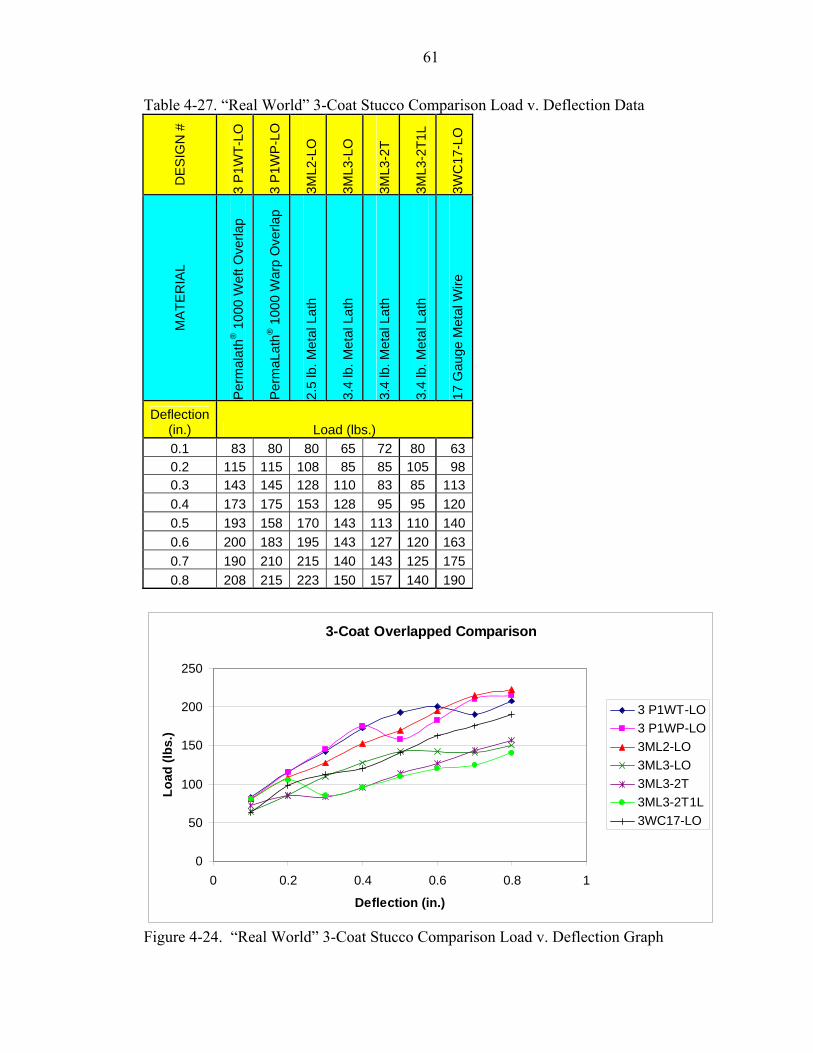
61
Table 4-27. “Real World” 3-Coat Stucco Comparison Load v. Deflection Data
DE
SIG
N #
3 P
1WT-
LO
3 P
1WP
-LO
3ML2
-LO
3ML3
-LO
3ML3
-2T
3ML3
-2T1
L
3WC
17-L
O
MA
TER
IAL
Per
mal
ath®
100
0 W
eft O
verla
p
Per
maL
ath®
100
0 W
arp
Ove
rlap
2.5
lb. M
etal
Lat
h
3.4
lb. M
etal
Lat
h
3.4
lb. M
etal
Lat
h
3.4
lb. M
etal
Lat
h
17 G
auge
Met
al W
ire
Deflection (in.) Load (lbs.) 0.1 83 80 80 65 72 80 630.2 115 115 108 85 85 105 980.3 143 145 128 110 83 85 1130.4 173 175 153 128 95 95 1200.5 193 158 170 143 113 110 1400.6 200 183 195 143 127 120 1630.7 190 210 215 140 143 125 1750.8 208 215 223 150 157 140 190
3-Coat Overlapped Comparison
0
50
100
150
200
250
0 0.2 0.4 0.6 0.8 1
Deflection (in.)
Load
(lbs
.)
3 P1WT-LO3 P1WP-LO3ML2-LO3ML3-LO3ML3-2T3ML3-2T1L3WC17-LO
Figure 4-24. “Real World” 3-Coat Stucco Comparison Load v. Deflection Graph
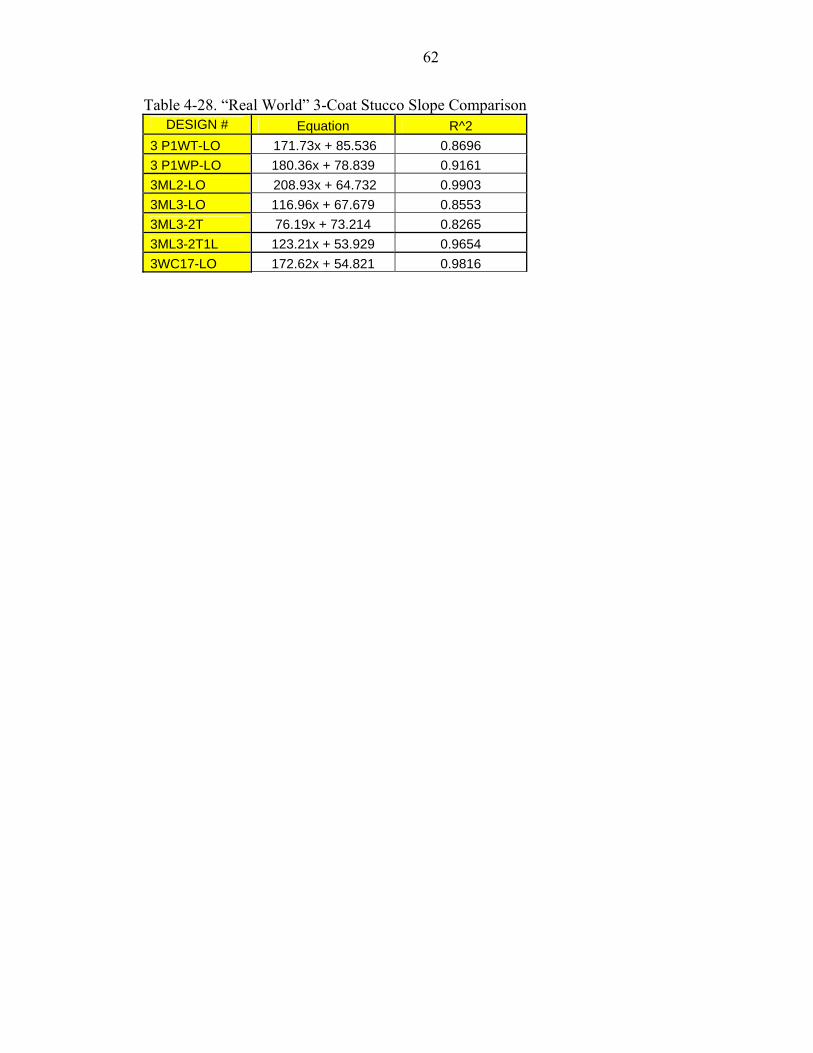
62
Table 4-28. “Real World” 3-Coat Stucco Slope Comparison DESIGN # Equation R^2
3 P1WT-LO 171.73x + 85.536 0.8696 3 P1WP-LO 180.36x + 78.839 0.9161 3ML2-LO 208.93x + 64.732 0.9903 3ML3-LO 116.96x + 67.679 0.8553 3ML3-2T 76.19x + 73.214 0.8265 3ML3-2T1L 123.21x + 53.929 0.9654 3WC17-LO 172.62x + 54.821 0.9816
63
CHAPTER 5 CONCLUSIONS AND RECOMMENDATIONS
Conclusions
The main objective of this research was to compare the mechanical properties of
Permalath® reinforcement to other lathing options currently in use in stucco wall
cladding. After an objective review of all the tests and their results, there are a number of
important conclusions that can be formed.
One-Coat Systems
Permalath® performs just as well in either the warp or weft direction, regardless of
whether or not the material is overlapped longitudinally (that is the overlap occurs along
the direction transverse to the load and parallel to the stress). Permalath® performs better
than Permalath® 1000 in 1-coat systems. Permalath® 1000’s performance is independent
of whether or not the product is overlap longitudinally or not, and Permalath® 1000
appears to be slightly better in the weft direction than the warp. Metal lath 2.5 lb also
performs well with and without longitudinal overlaps, but performs very poorly having
either transverse overlap joints or both transverse and longitudinal overlap joints. Wire
cloth 20 gauge performed slightly better than 17 gauge reinforcement for 1-coat systems.
Permalath® in either the warp or weft direction performs at least as well as the 2.5 lb
metal lath having no or only longitudinal overlaps; performs better than both 20 gauge
and 17 gauge wire cloth; and performs much better the metal lath having transverse
and/or both transverse and longitudinal overlap joints.
64
Three-Coat Systems
Permalath® 1000 performs just as well in either the warp or weft direction, and
regardless of whether or not the material is overlapped longitudinally. Metal lath 2.5 lb
also performs well with and without longitudinal overlaps in the 3-coat system, and
performs better that 3.5 lb metal lath regardless of whether it has any overlaps or not.
Wire Cloth 17 gauge performs well with and without longitudinal overlaps. Permalath®
1000 in either direction performs at least just as well as 2.5 lb metal lath having no
overlaps or only longitudinal overlap joints; performs better than 17 gauge wire cloth;
and much better than 3.5 lb meal lath having longitudinal, transverse or both types of
overlap joints in 3-coat systems.
Crack areas were not as valid a measurement of performance as were the number
of cracks per sample due to the effects of inconsistencies of the plywood backing. Some
of the plywood had slight warping to it at the beginning of the sample making process
which had an effect on the crack area calculations since the elastic nature of the plywood
caused the cracks to close back up when the load was released.
Recommendations
Further testing needs to be carried out to provide more definitive results that
compare Permalath® stucco reinforcement to other metallic reinforcements. There are
many areas of testing that can be explored to help show this.
Windborne Impact test for Hurricane Force Winds will determine whether the
materials will meet building codes for regions zoned as hurricane prone. Tensile
Adhesion Test will determine the bonding strength and crack resistance of the sample.
Further revise current and develop new test methods to potentially achieve more valid
results and formulate better conclusions concerning the use of Permalath® reinforcement.
65
One-coat stucco systems are designed to be applied between 3/8” to ½” thick.
Future testing should be carried out to determine if ½” would perform better than 3/8”
one-coat stucco systems.
There was approximately a 0.01” or 12.5% margin of error in the initial cracking
test from human error which could translate into more samples passing the test if the
error was minimized. This margin of error was due to the lack of electronic control when
adjusting the compression/flexure machine during the set-up and adjustment of the
LVDT with each sample. Samples should be tested in a strain controlled bending
apparatus that would allow for the margin of error to be as small as 0.001”. The
compression/flexure machine used should also have a load rate system controlled
electronically. All components should be connected into a computer management system
to allow for the most precise results possible.
Third-point Flexure Testing and Initial Cracking Deflection test samples could be
made using the same process as impact samples to allow for separation of stucco from
plywood. These samples when tested would give the ultimate values of the stucco only
without the concern of the plywood skewing the results. Sample sizes would need to be
adjusted to allow for safe handling when cutting samples since they would not be
securely fastening to plywood after trim edge was removed. A size of 36” by 24” would
be the recommended size for trial purposes.
Third-point Flexure Testing and Initial Cracking Deflection test samples could
also be constructed using a smaller thickness of plywood, which would allow for a better
representation of the stucco performance. This would also require design keep the
samples from warping since thinner plywood has more of a tendency to warp.
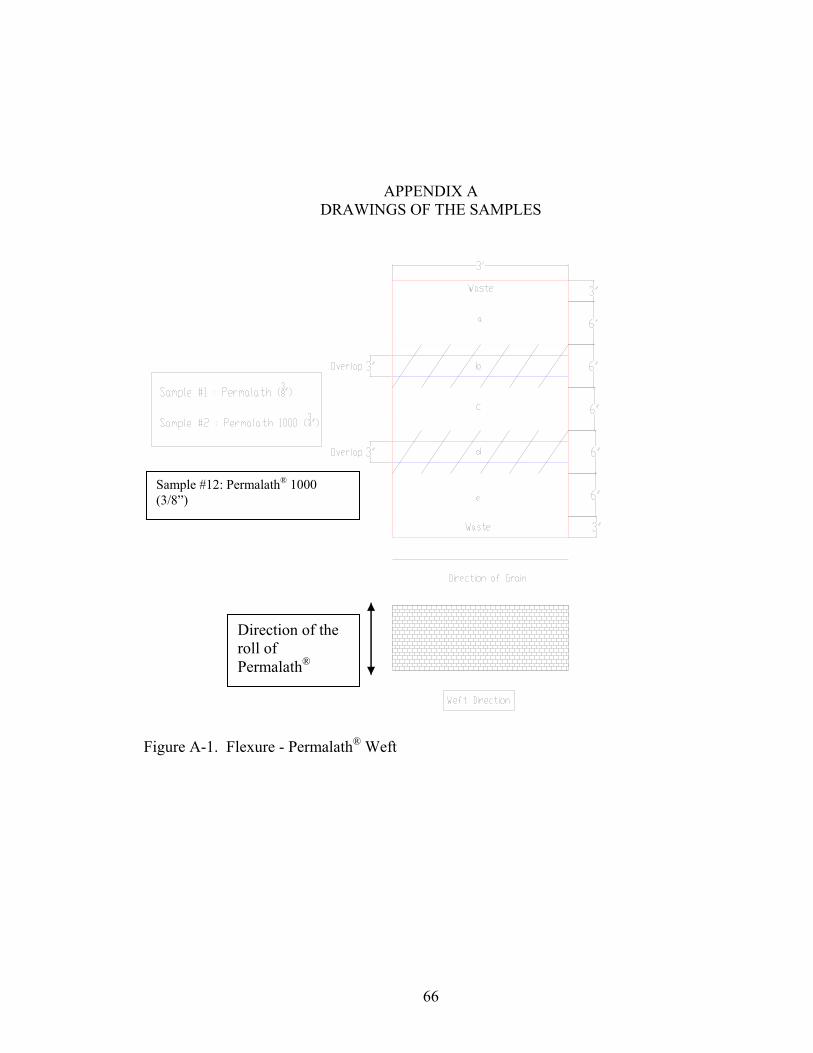
66
APPENDIX A DRAWINGS OF THE SAMPLES
Figure A-1. Flexure - Permalath® Weft
Direction of the roll of Permalath®
Sample #12: Permalath® 1000 (3/8”)
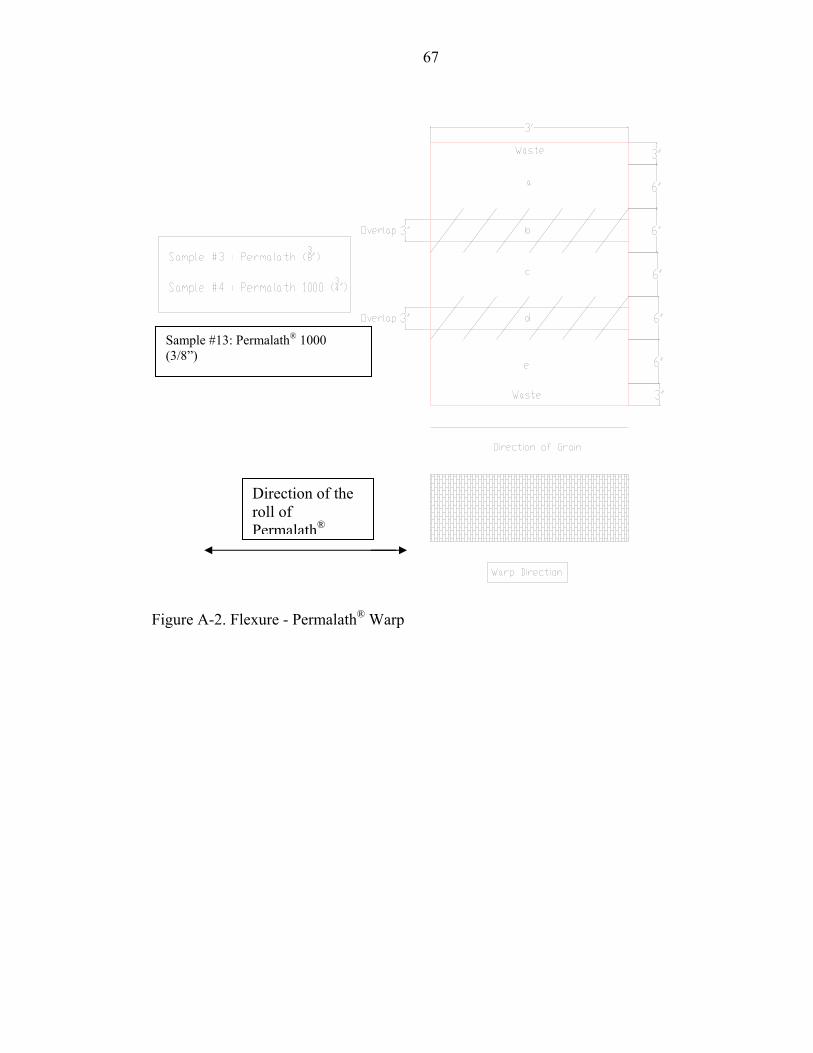
67
Figure A-2. Flexure - Permalath® Warp
Direction of the roll of Permalath®
Sample #13: Permalath® 1000 (3/8”)
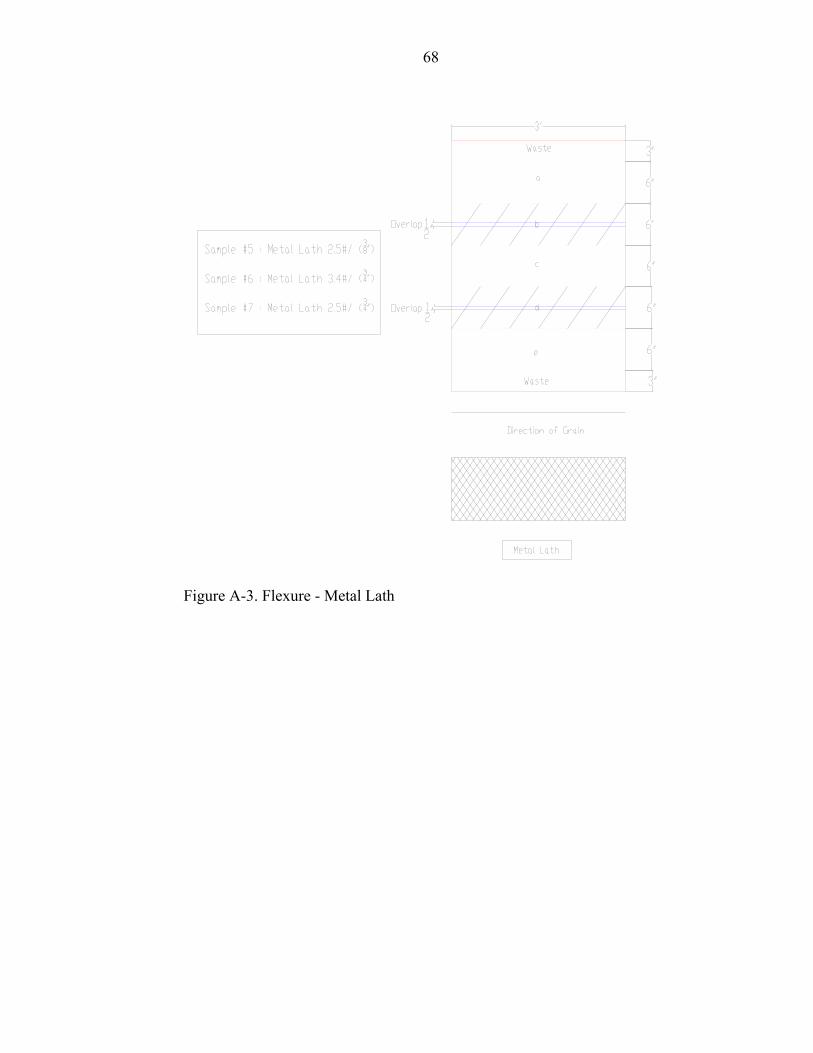
68
Figure A-3. Flexure - Metal Lath
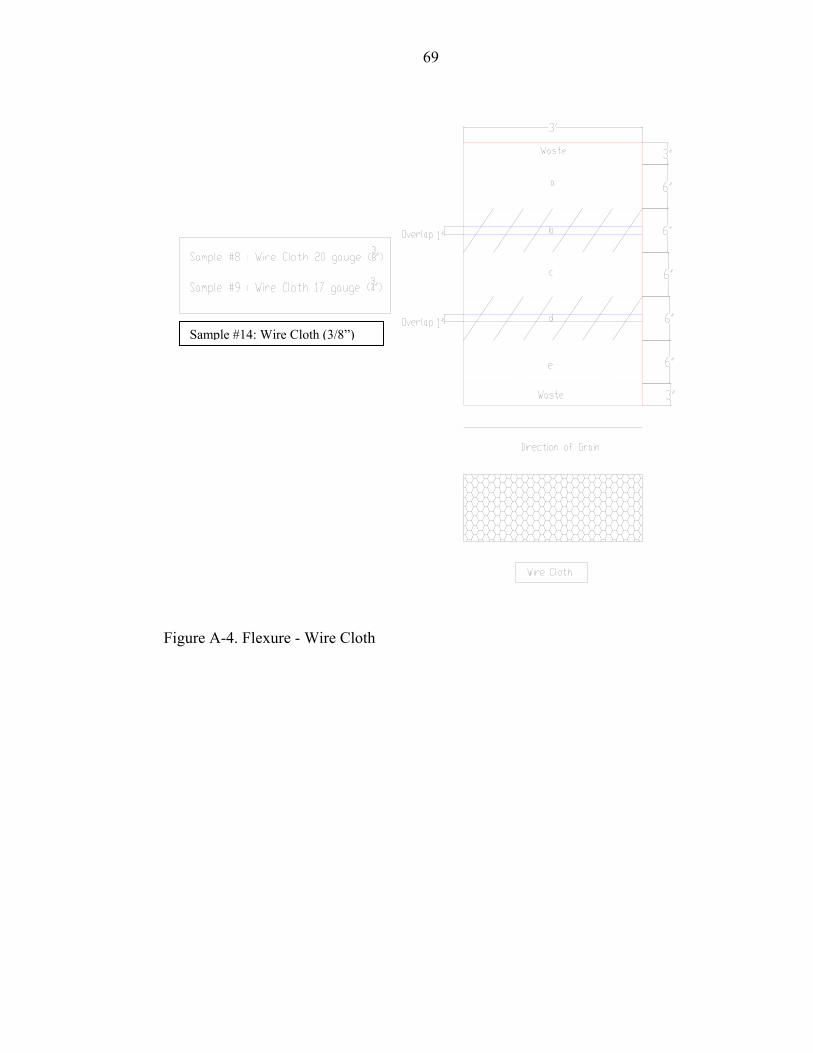
69
Figure A-4. Flexure - Wire Cloth
Sample #14: Wire Cloth (3/8”)
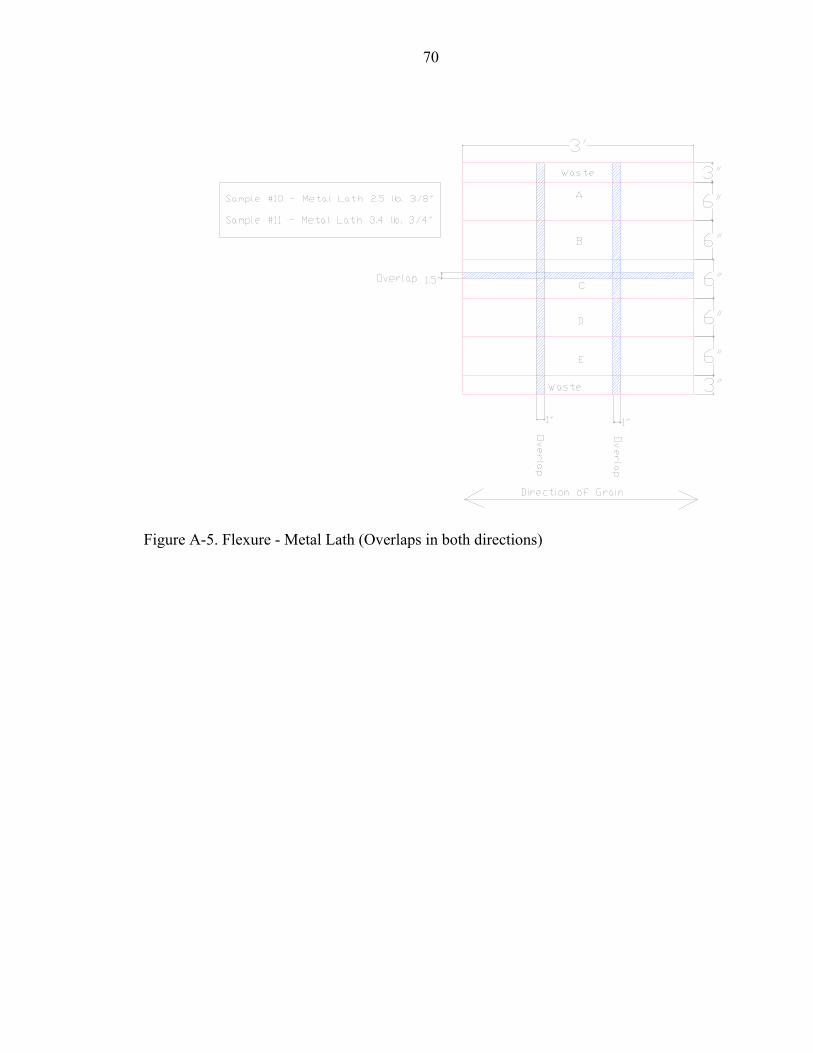
70
Figure A-5. Flexure - Metal Lath (Overlaps in both directions)
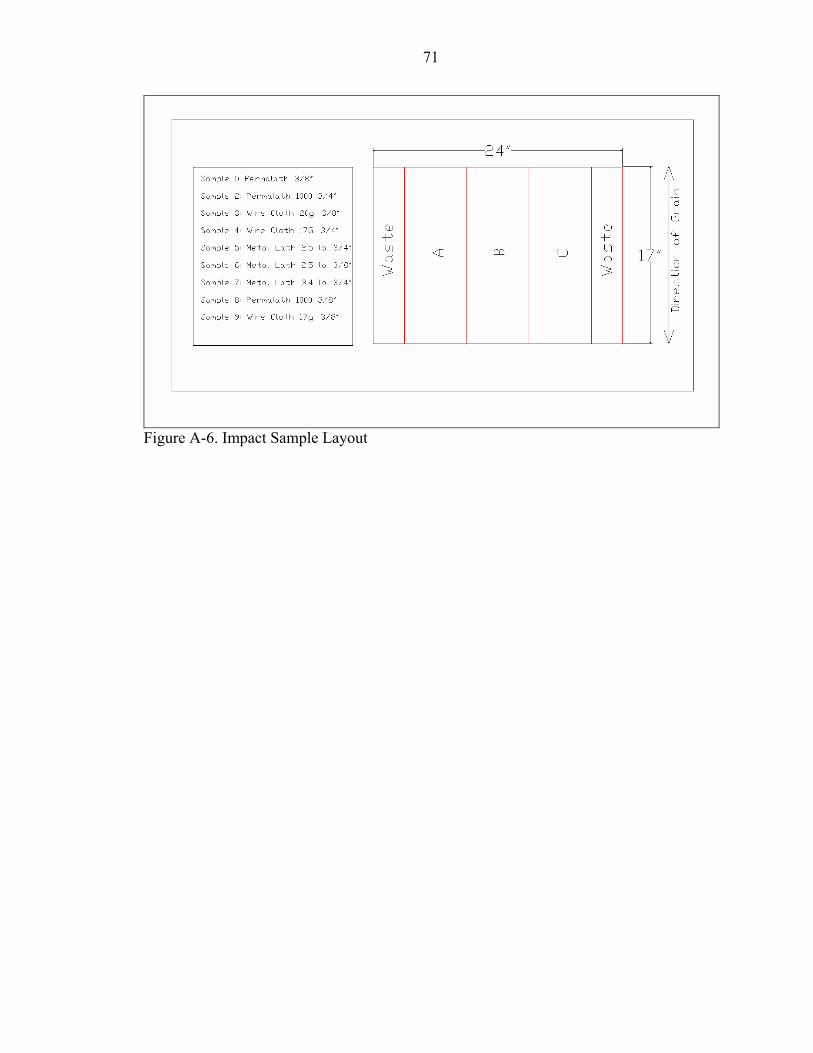
71
Figure A-6. Impact Sample Layout
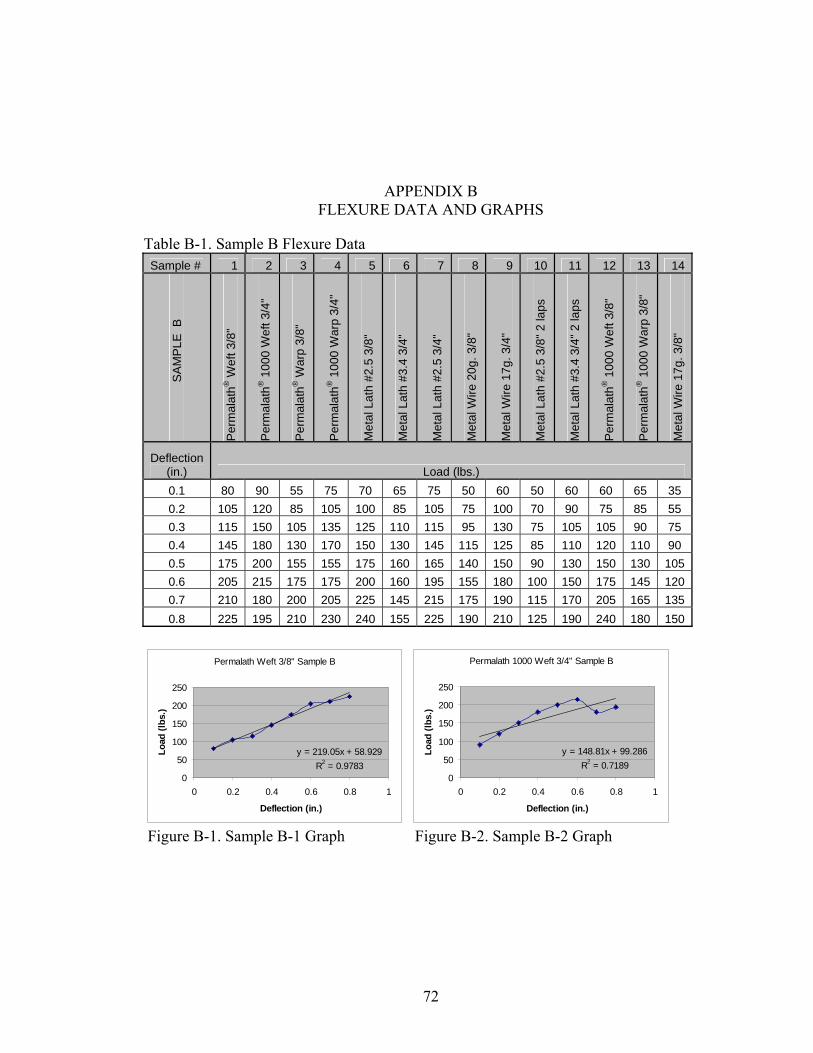
72
APPENDIX B FLEXURE DATA AND GRAPHS
Table B-1. Sample B Flexure Data Sample # 1 2 3 4 5 6 7 8 9 10 11 12 13 14
S
AM
PLE
B
Per
mal
ath®
Wef
t 3/8
"
Per
mal
ath®
100
0 W
eft 3
/4"
Per
mal
ath®
War
p 3/
8"
Per
mal
ath®
100
0 W
arp
3/4"
Met
al L
ath
#2.5
3/8
"
Met
al L
ath
#3.4
3/4
"
Met
al L
ath
#2.5
3/4
"
Met
al W
ire 2
0g. 3
/8"
Met
al W
ire 1
7g. 3
/4"
Met
al L
ath
#2.5
3/8
" 2 la
ps
Met
al L
ath
#3.4
3/4
" 2 la
ps
Per
mal
ath®
100
0 W
eft 3
/8"
Per
mal
ath®
100
0 W
arp
3/8"
Met
al W
ire 1
7g. 3
/8"
Deflection (in.) Load (lbs.) 0.1 80 90 55 75 70 65 75 50 60 50 60 60 65 35 0.2 105 120 85 105 100 85 105 75 100 70 90 75 85 55 0.3 115 150 105 135 125 110 115 95 130 75 105 105 90 75 0.4 145 180 130 170 150 130 145 115 125 85 110 120 110 90 0.5 175 200 155 155 175 160 165 140 150 90 130 150 130 1050.6 205 215 175 175 200 160 195 155 180 100 150 175 145 1200.7 210 180 200 205 225 145 215 175 190 115 170 205 165 1350.8 225 195 210 230 240 155 225 190 210 125 190 240 180 150
Permalath Weft 3/8" Sample B
y = 219.05x + 58.929R2 = 0.9783
0
50
100
150
200
250
0 0.2 0.4 0.6 0.8 1
Deflection (in.)
Load
(lbs
.)
Permalath 1000 Weft 3/4" Sample B
y = 148.81x + 99.286R2 = 0.7189
0
50
100
150
200
250
0 0.2 0.4 0.6 0.8 1
Deflection (in.)
Load
(lbs
.)
Figure B-1. Sample B-1 Graph Figure B-2. Sample B-2 Graph
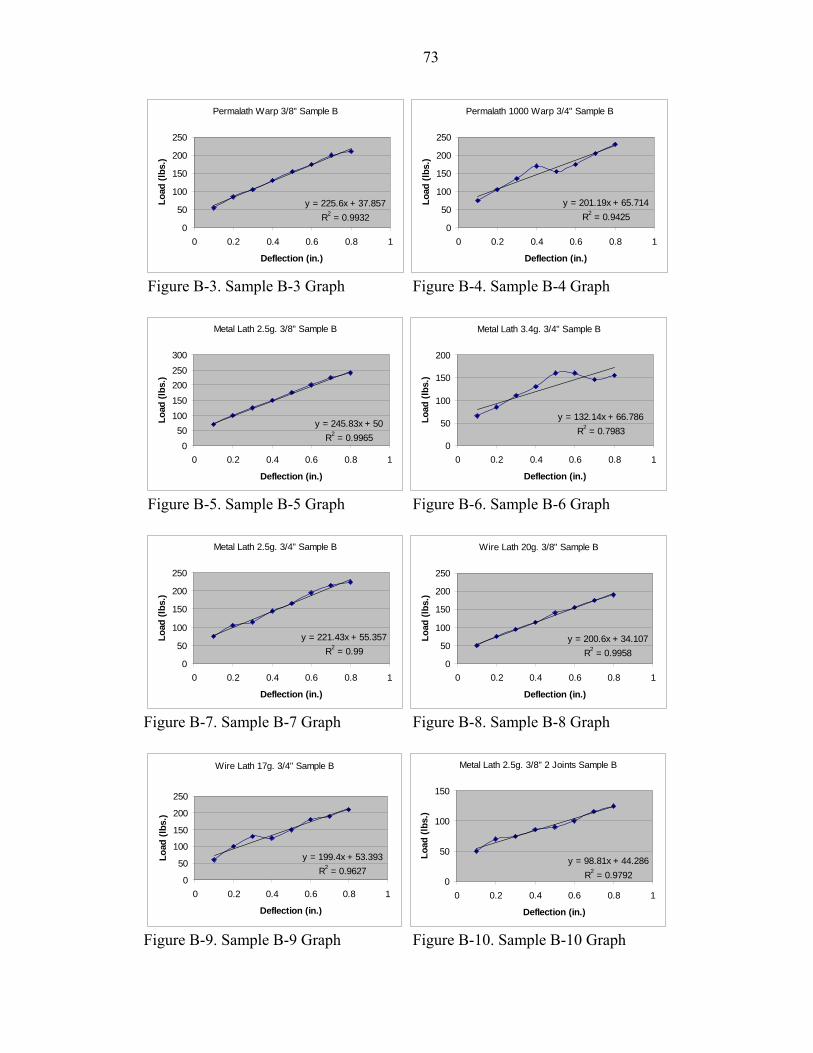
73
Permalath Warp 3/8" Sample B
y = 225.6x + 37.857R2 = 0.9932
0
50
100
150
200
250
0 0.2 0.4 0.6 0.8 1
Deflection (in.)
Load
(lbs
.)
Permalath 1000 Warp 3/4" Sample B
y = 201.19x + 65.714R2 = 0.9425
0
50
100
150
200
250
0 0.2 0.4 0.6 0.8 1
Deflection (in.)
Load
(lbs
.)
Figure B-3. Sample B-3 Graph Figure B-4. Sample B-4 Graph
Metal Lath 2.5g. 3/8" Sample B
y = 245.83x + 50R2 = 0.9965
050
100150200250300
0 0.2 0.4 0.6 0.8 1
Deflection (in.)
Load
(lbs
.)
Metal Lath 3.4g. 3/4" Sample B
y = 132.14x + 66.786R2 = 0.7983
0
50
100
150
200
0 0.2 0.4 0.6 0.8 1
Deflection (in.)
Load
(lbs
.)
Figure B-5. Sample B-5 Graph Figure B-6. Sample B-6 Graph
Metal Lath 2.5g. 3/4" Sample B
y = 221.43x + 55.357R2 = 0.99
0
50
100
150
200
250
0 0.2 0.4 0.6 0.8 1
Deflection (in.)
Load
(lbs
.)
Wire Lath 20g. 3/8" Sample B
y = 200.6x + 34.107R2 = 0.9958
0
50
100
150
200
250
0 0.2 0.4 0.6 0.8 1
Deflection (in.)
Load
(lbs
.)
Figure B-7. Sample B-7 Graph Figure B-8. Sample B-8 Graph
Wire Lath 17g. 3/4" Sample B
y = 199.4x + 53.393R2 = 0.9627
0
50
100
150
200
250
0 0.2 0.4 0.6 0.8 1
Deflection (in.)
Load
(lbs
.)
Metal Lath 2.5g. 3/8" 2 Joints Sample B
y = 98.81x + 44.286R2 = 0.9792
0
50
100
150
0 0.2 0.4 0.6 0.8 1
Deflection (in.)
Load
(lbs
.)
Figure B-9. Sample B-9 Graph Figure B-10. Sample B-10 Graph
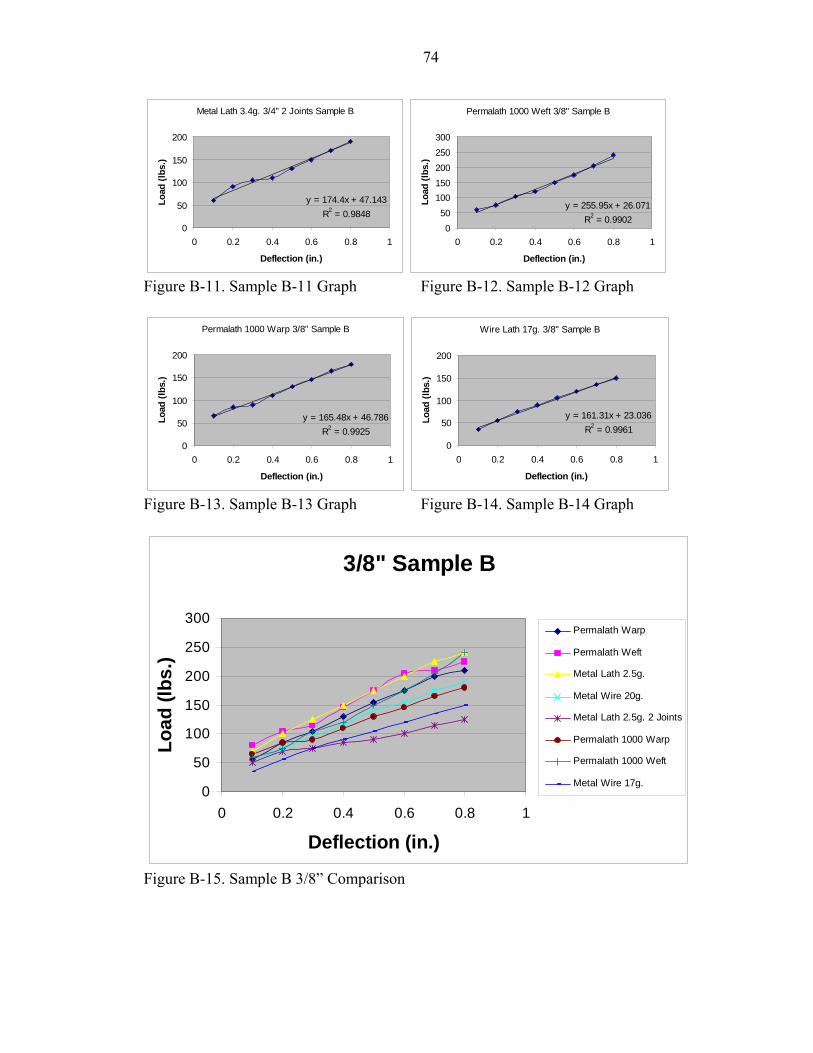
74
Metal Lath 3.4g. 3/4" 2 Joints Sample B
y = 174.4x + 47.143R2 = 0.9848
0
50
100
150
200
0 0.2 0.4 0.6 0.8 1
Deflection (in.)
Load
(lbs
.)
Permalath 1000 Weft 3/8" Sample B
y = 255.95x + 26.071R2 = 0.9902
050
100150200250300
0 0.2 0.4 0.6 0.8 1
Deflection (in.)
Load
(lbs
.)
Figure B-11. Sample B-11 Graph Figure B-12. Sample B-12 Graph
Permalath 1000 Warp 3/8" Sample B
y = 165.48x + 46.786R2 = 0.9925
0
50
100
150
200
0 0.2 0.4 0.6 0.8 1
Deflection (in.)
Load
(lbs
.)
Wire Lath 17g. 3/8" Sample B
y = 161.31x + 23.036R2 = 0.9961
0
50
100
150
200
0 0.2 0.4 0.6 0.8 1
Deflection (in.)
Load
(lbs
.)
Figure B-13. Sample B-13 Graph Figure B-14. Sample B-14 Graph
3/8" Sample B
0
50
100
150
200
250
300
0 0.2 0.4 0.6 0.8 1
Deflection (in.)
Load
(lbs
.)
Permalath Warp
Permalath Weft
Metal Lath 2.5g.
Metal Wire 20g.
Metal Lath 2.5g. 2 Joints
Permalath 1000 Warp
Permalath 1000 Weft
Metal Wire 17g.
Figure B-15. Sample B 3/8” Comparison
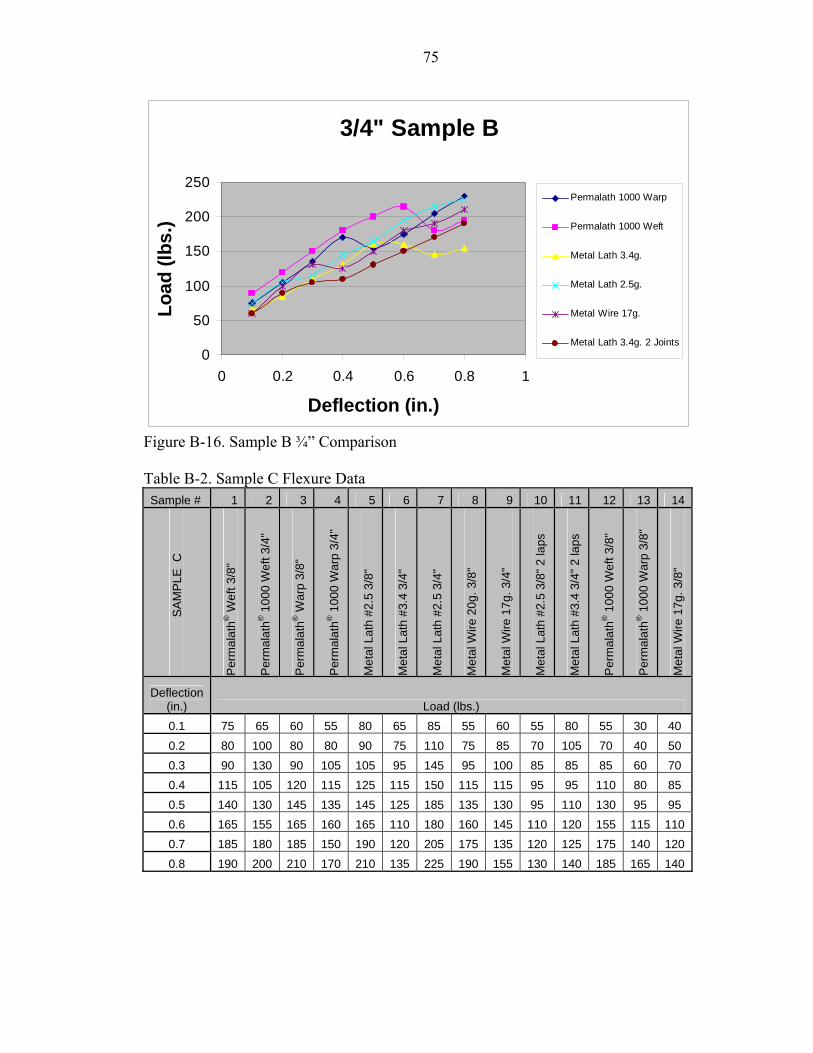
75
3/4" Sample B
0
50
100
150
200
250
0 0.2 0.4 0.6 0.8 1
Deflection (in.)
Load
(lbs
.)Permalath 1000 Warp
Permalath 1000 Weft
Metal Lath 3.4g.
Metal Lath 2.5g.
Metal Wire 17g.
Metal Lath 3.4g. 2 Joints
Figure B-16. Sample B ¾” Comparison Table B-2. Sample C Flexure Data
Sample # 1 2 3 4 5 6 7 8 9 10 11 12 13 14
S
AM
PLE
C
Per
mal
ath®
Wef
t 3/8
"
Per
mal
ath®
100
0 W
eft 3
/4"
Per
mal
ath®
War
p 3/
8"
Per
mal
ath®
100
0 W
arp
3/4"
Met
al L
ath
#2.5
3/8
"
Met
al L
ath
#3.4
3/4
"
Met
al L
ath
#2.5
3/4
"
Met
al W
ire 2
0g. 3
/8"
Met
al W
ire 1
7g. 3
/4"
Met
al L
ath
#2.5
3/8
" 2 la
ps
Met
al L
ath
#3.4
3/4
" 2 la
ps
Per
mal
ath®
100
0 W
eft 3
/8"
Per
mal
ath®
100
0 W
arp
3/8"
Met
al W
ire 1
7g. 3
/8"
Deflection (in.) Load (lbs.) 0.1 75 65 60 55 80 65 85 55 60 55 80 55 30 40 0.2 80 100 80 80 90 75 110 75 85 70 105 70 40 50 0.3 90 130 90 105 105 95 145 95 100 85 85 85 60 70 0.4 115 105 120 115 125 115 150 115 115 95 95 110 80 85 0.5 140 130 145 135 145 125 185 135 130 95 110 130 95 95 0.6 165 155 165 160 165 110 180 160 145 110 120 155 115 1100.7 185 180 185 150 190 120 205 175 135 120 125 175 140 1200.8 190 200 210 170 210 135 225 190 155 130 140 185 165 140
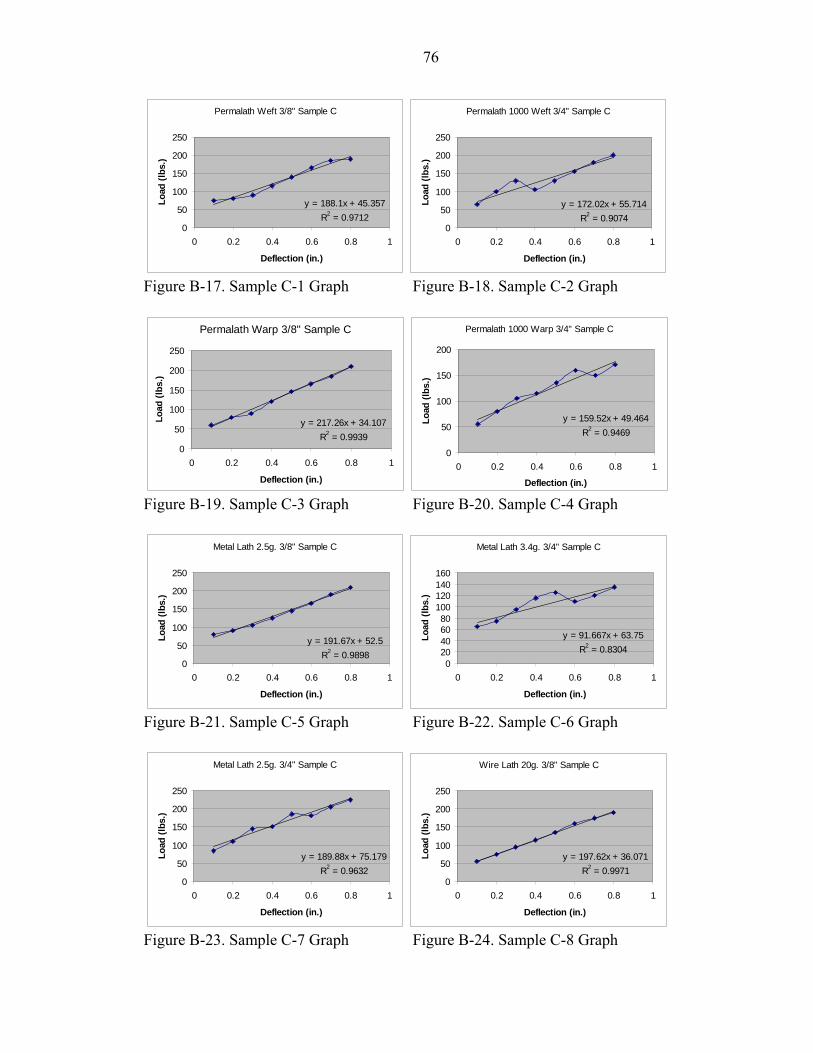
76
Permalath Weft 3/8" Sample C
y = 188.1x + 45.357R2 = 0.9712
0
50
100
150
200
250
0 0.2 0.4 0.6 0.8 1
Deflection (in.)
Load
(lbs
.)
Permalath 1000 Weft 3/4" Sample C
y = 172.02x + 55.714R2 = 0.9074
0
50
100
150
200
250
0 0.2 0.4 0.6 0.8 1
Deflection (in.)
Load
(lbs
.)
Figure B-17. Sample C-1 Graph Figure B-18. Sample C-2 Graph
Permalath Warp 3/8" Sample C
y = 217.26x + 34.107R2 = 0.9939
0
50
100
150
200
250
0 0.2 0.4 0.6 0.8 1
Deflection (in.)
Load
(lbs
.)
Permalath 1000 Warp 3/4" Sample C
y = 159.52x + 49.464R2 = 0.9469
0
50
100
150
200
0 0.2 0.4 0.6 0.8 1
Deflection (in.)
Load
(lbs
.)
Figure B-19. Sample C-3 Graph Figure B-20. Sample C-4 Graph
Metal Lath 2.5g. 3/8" Sample C
y = 191.67x + 52.5R2 = 0.9898
0
50
100
150
200
250
0 0.2 0.4 0.6 0.8 1
Deflection (in.)
Load
(lbs
.)
Metal Lath 3.4g. 3/4" Sample C
y = 91.667x + 63.75R2 = 0.8304
020406080
100120140160
0 0.2 0.4 0.6 0.8 1
Deflection (in.)
Load
(lbs
.)
Figure B-21. Sample C-5 Graph Figure B-22. Sample C-6 Graph
Metal Lath 2.5g. 3/4" Sample C
y = 189.88x + 75.179R2 = 0.9632
0
50
100
150
200
250
0 0.2 0.4 0.6 0.8 1
Deflection (in.)
Load
(lbs
.)
Wire Lath 20g. 3/8" Sample C
y = 197.62x + 36.071R2 = 0.9971
0
50
100
150
200
250
0 0.2 0.4 0.6 0.8 1
Deflection (in.)
Load
(lbs
.)
Figure B-23. Sample C-7 Graph Figure B-24. Sample C-8 Graph
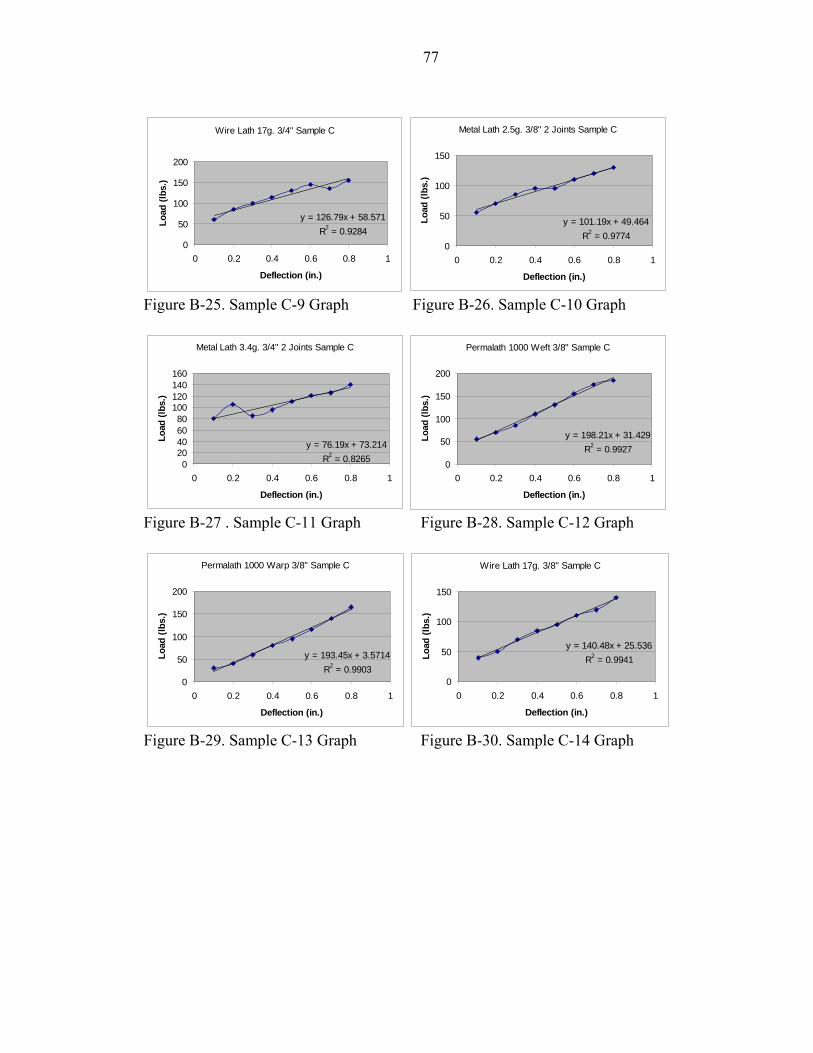
77
Wire Lath 17g. 3/4" Sample C
y = 126.79x + 58.571R2 = 0.9284
0
50
100
150
200
0 0.2 0.4 0.6 0.8 1
Deflection (in.)
Load
(lbs
.)
Metal Lath 2.5g. 3/8" 2 Joints Sample C
y = 101.19x + 49.464R2 = 0.9774
0
50
100
150
0 0.2 0.4 0.6 0.8 1
Deflection (in.)
Load
(lbs
.)
Figure B-25. Sample C-9 Graph Figure B-26. Sample C-10 Graph
Metal Lath 3.4g. 3/4" 2 Joints Sample C
y = 76.19x + 73.214R2 = 0.82650
20406080
100120140160
0 0.2 0.4 0.6 0.8 1
Deflection (in.)
Load
(lbs
.)
Permalath 1000 Weft 3/8" Sample C
y = 198.21x + 31.429R2 = 0.9927
0
50
100
150
200
0 0.2 0.4 0.6 0.8 1
Deflection (in.)
Load
(lbs
.)
Figure B-27 . Sample C-11 Graph Figure B-28. Sample C-12 Graph
Permalath 1000 Warp 3/8" Sample C
y = 193.45x + 3.5714R2 = 0.9903
0
50
100
150
200
0 0.2 0.4 0.6 0.8 1
Deflection (in.)
Load
(lbs
.)
Wire Lath 17g. 3/8" Sample C
y = 140.48x + 25.536R2 = 0.9941
0
50
100
150
0 0.2 0.4 0.6 0.8 1
Deflection (in.)
Load
(lbs
.)
Figure B-29. Sample C-13 Graph Figure B-30. Sample C-14 Graph
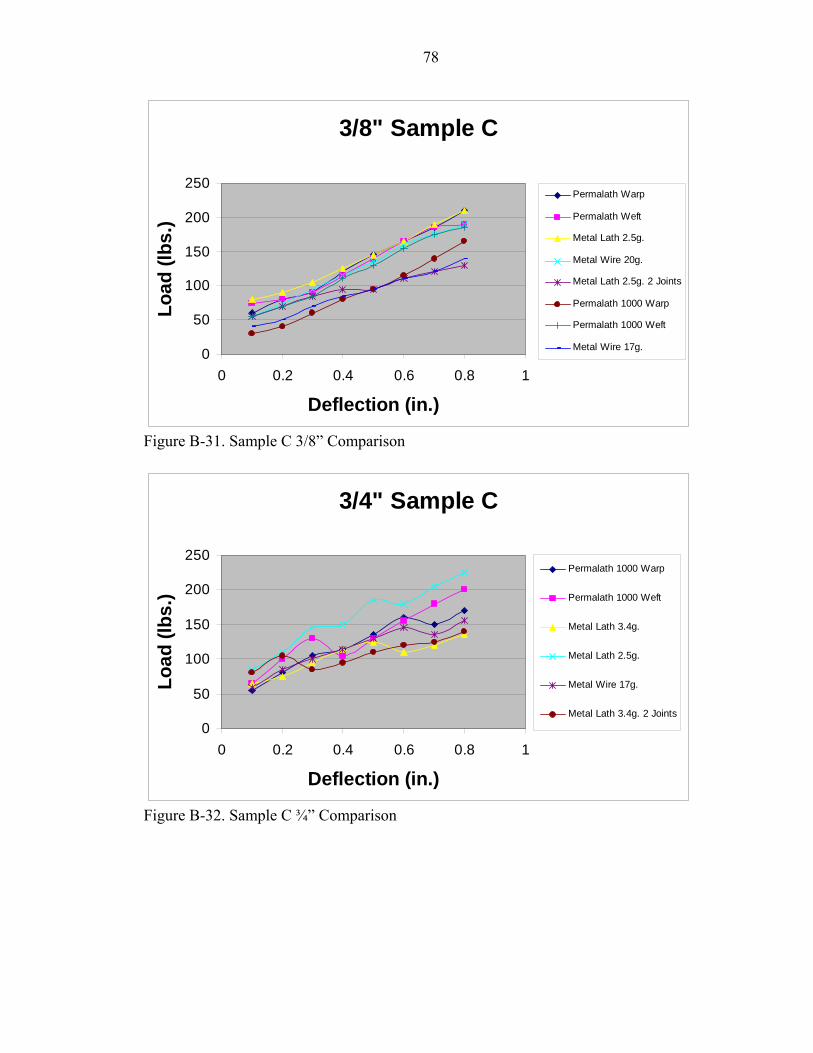
78
3/8" Sample C
0
50
100
150
200
250
0 0.2 0.4 0.6 0.8 1
Deflection (in.)
Load
(lbs
.)Permalath Warp
Permalath Weft
Metal Lath 2.5g.
Metal Wire 20g.
Metal Lath 2.5g. 2 Joints
Permalath 1000 Warp
Permalath 1000 Weft
Metal Wire 17g.
Figure B-31. Sample C 3/8” Comparison
3/4" Sample C
0
50
100
150
200
250
0 0.2 0.4 0.6 0.8 1
Deflection (in.)
Load
(lbs
.)
Permalath 1000 Warp
Permalath 1000 Weft
Metal Lath 3.4g.
Metal Lath 2.5g.
Metal Wire 17g.
Metal Lath 3.4g. 2 Joints
Figure B-32. Sample C ¾” Comparison
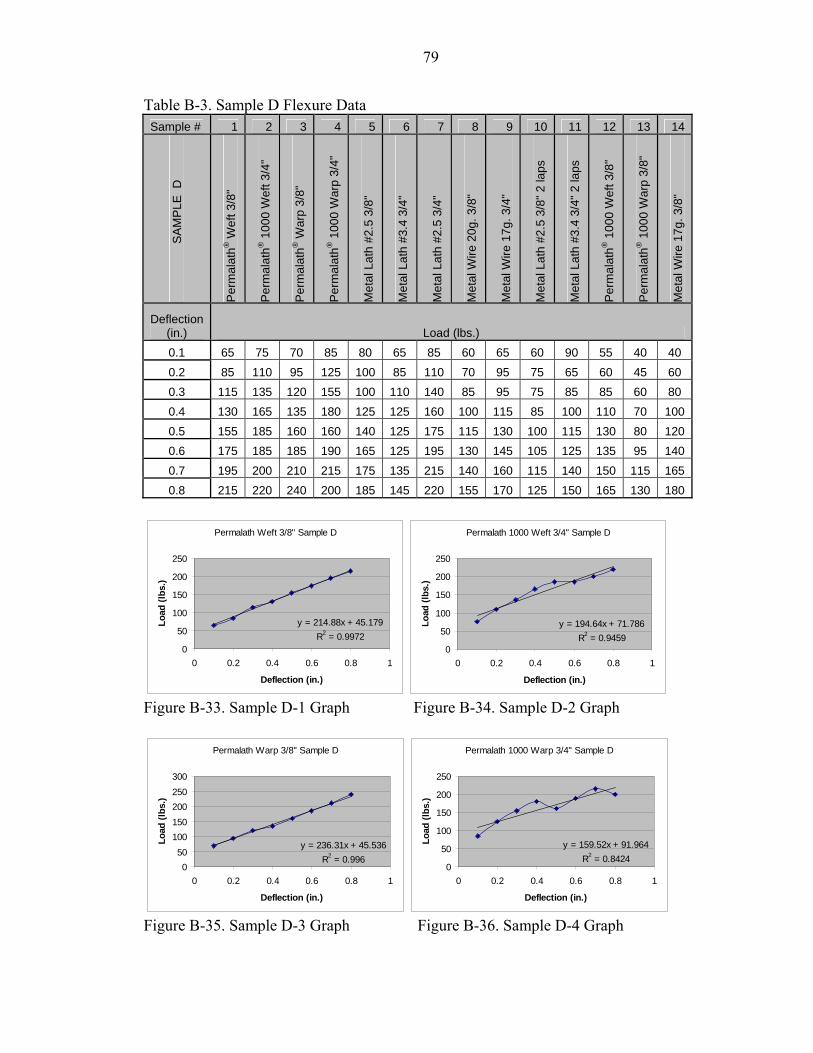
79
Table B-3. Sample D Flexure Data
Sample # 1 2 3 4 5 6 7 8 9 10 11 12 13 14
S
AM
PLE
D
Per
mal
ath®
Wef
t 3/8
"
Per
mal
ath®
100
0 W
eft 3
/4"
Per
mal
ath®
War
p 3/
8"
Per
mal
ath®
100
0 W
arp
3/4"
Met
al L
ath
#2.5
3/8
"
Met
al L
ath
#3.4
3/4
"
Met
al L
ath
#2.5
3/4
"
Met
al W
ire 2
0g. 3
/8"
Met
al W
ire 1
7g. 3
/4"
Met
al L
ath
#2.5
3/8
" 2 la
ps
Met
al L
ath
#3.4
3/4
" 2 la
ps
Per
mal
ath®
100
0 W
eft 3
/8"
Per
mal
ath®
100
0 W
arp
3/8"
Met
al W
ire 1
7g. 3
/8"
Deflection (in.) Load (lbs.) 0.1 65 75 70 85 80 65 85 60 65 60 90 55 40 40 0.2 85 110 95 125 100 85 110 70 95 75 65 60 45 60 0.3 115 135 120 155 100 110 140 85 95 75 85 85 60 80 0.4 130 165 135 180 125 125 160 100 115 85 100 110 70 1000.5 155 185 160 160 140 125 175 115 130 100 115 130 80 1200.6 175 185 185 190 165 125 195 130 145 105 125 135 95 1400.7 195 200 210 215 175 135 215 140 160 115 140 150 115 1650.8 215 220 240 200 185 145 220 155 170 125 150 165 130 180
Permalath Weft 3/8" Sample D
y = 214.88x + 45.179R2 = 0.9972
0
50
100
150
200
250
0 0.2 0.4 0.6 0.8 1
Deflection (in.)
Load
(lbs
.)
Permalath 1000 Weft 3/4" Sample D
y = 194.64x + 71.786R2 = 0.9459
0
50
100
150
200
250
0 0.2 0.4 0.6 0.8 1
Deflection (in.)
Load
(lbs
.)
Figure B-33. Sample D-1 Graph Figure B-34. Sample D-2 Graph
Permalath Warp 3/8" Sample D
y = 236.31x + 45.536R2 = 0.996
050
100150200250300
0 0.2 0.4 0.6 0.8 1
Deflection (in.)
Load
(lbs
.)
Permalath 1000 Warp 3/4" Sample D
y = 159.52x + 91.964R2 = 0.8424
0
50
100
150
200
250
0 0.2 0.4 0.6 0.8 1
Deflection (in.)
Load
(lbs
.)
Figure B-35. Sample D-3 Graph Figure B-36. Sample D-4 Graph
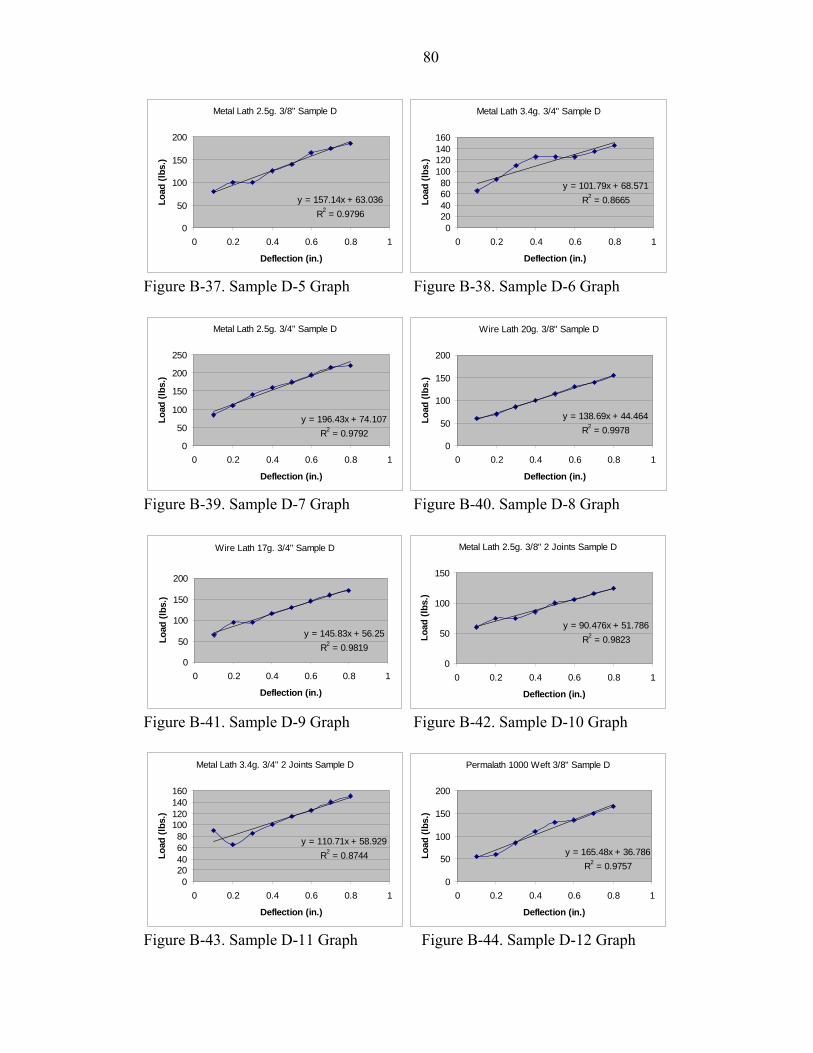
80
Metal Lath 2.5g. 3/8" Sample D
y = 157.14x + 63.036R2 = 0.9796
0
50
100
150
200
0 0.2 0.4 0.6 0.8 1
Deflection (in.)
Load
(lbs
.)
Metal Lath 3.4g. 3/4" Sample D
y = 101.79x + 68.571R2 = 0.8665
020406080
100120140160
0 0.2 0.4 0.6 0.8 1
Deflection (in.)
Load
(lbs
.)
Figure B-37. Sample D-5 Graph Figure B-38. Sample D-6 Graph
Metal Lath 2.5g. 3/4" Sample D
y = 196.43x + 74.107R2 = 0.9792
0
50
100
150
200
250
0 0.2 0.4 0.6 0.8 1
Deflection (in.)
Load
(lbs
.)
Wire Lath 20g. 3/8" Sample D
y = 138.69x + 44.464R2 = 0.9978
0
50
100
150
200
0 0.2 0.4 0.6 0.8 1
Deflection (in.)
Load
(lbs
.)
Figure B-39. Sample D-7 Graph Figure B-40. Sample D-8 Graph
Wire Lath 17g. 3/4" Sample D
y = 145.83x + 56.25R2 = 0.9819
0
50
100
150
200
0 0.2 0.4 0.6 0.8 1
Deflection (in.)
Load
(lbs
.)
Metal Lath 2.5g. 3/8" 2 Joints Sample D
y = 90.476x + 51.786R2 = 0.9823
0
50
100
150
0 0.2 0.4 0.6 0.8 1
Deflection (in.)
Load
(lbs
.)
Figure B-41. Sample D-9 Graph Figure B-42. Sample D-10 Graph
Metal Lath 3.4g. 3/4" 2 Joints Sample D
y = 110.71x + 58.929R2 = 0.8744
020406080
100120140160
0 0.2 0.4 0.6 0.8 1
Deflection (in.)
Load
(lbs
.)
Permalath 1000 Weft 3/8" Sample D
y = 165.48x + 36.786R2 = 0.9757
0
50
100
150
200
0 0.2 0.4 0.6 0.8 1
Deflection (in.)
Load
(lbs
.)
Figure B-43. Sample D-11 Graph Figure B-44. Sample D-12 Graph
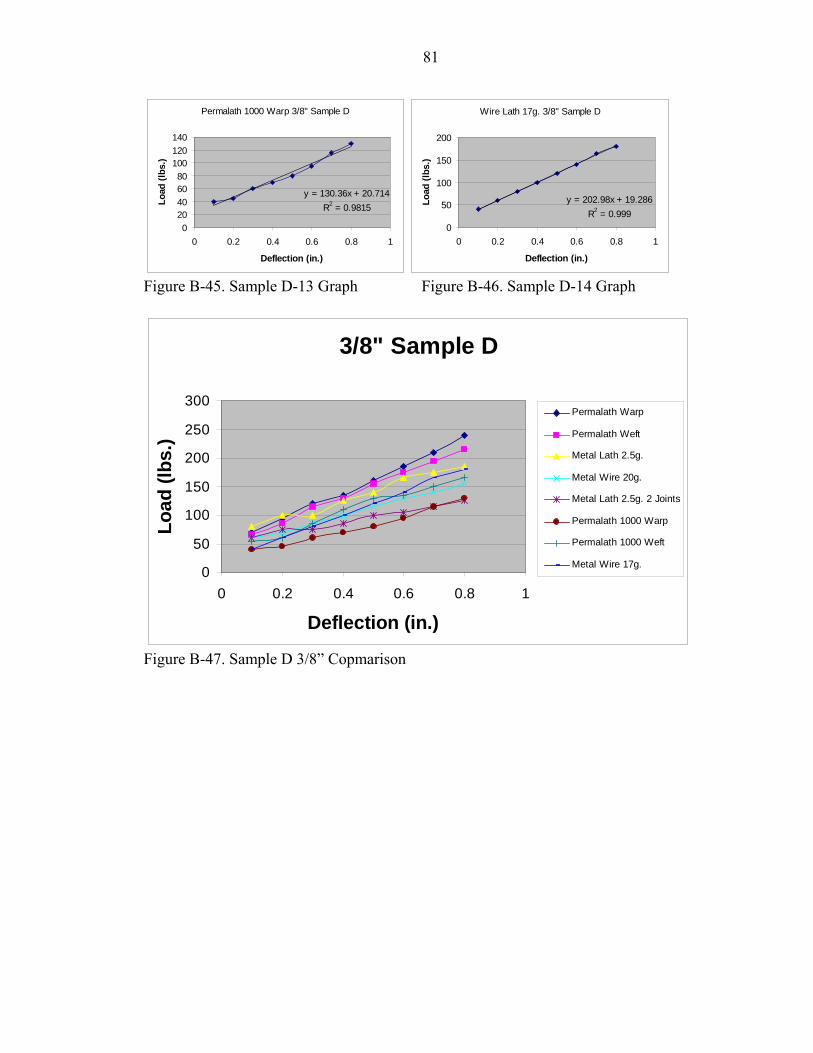
81
Permalath 1000 Warp 3/8" Sample D
y = 130.36x + 20.714R2 = 0.9815
020406080
100120140
0 0.2 0.4 0.6 0.8 1
Deflection (in.)
Load
(lbs
.)
Wire Lath 17g. 3/8" Sample D
y = 202.98x + 19.286R2 = 0.999
0
50
100
150
200
0 0.2 0.4 0.6 0.8 1
Deflection (in.)
Load
(lbs
.)
Figure B-45. Sample D-13 Graph Figure B-46. Sample D-14 Graph
3/8" Sample D
0
50
100
150
200
250
300
0 0.2 0.4 0.6 0.8 1
Deflection (in.)
Load
(lbs
.)
Permalath Warp
Permalath Weft
Metal Lath 2.5g.
Metal Wire 20g.
Metal Lath 2.5g. 2 Joints
Permalath 1000 Warp
Permalath 1000 Weft
Metal Wire 17g.
Figure B-47. Sample D 3/8” Copmarison
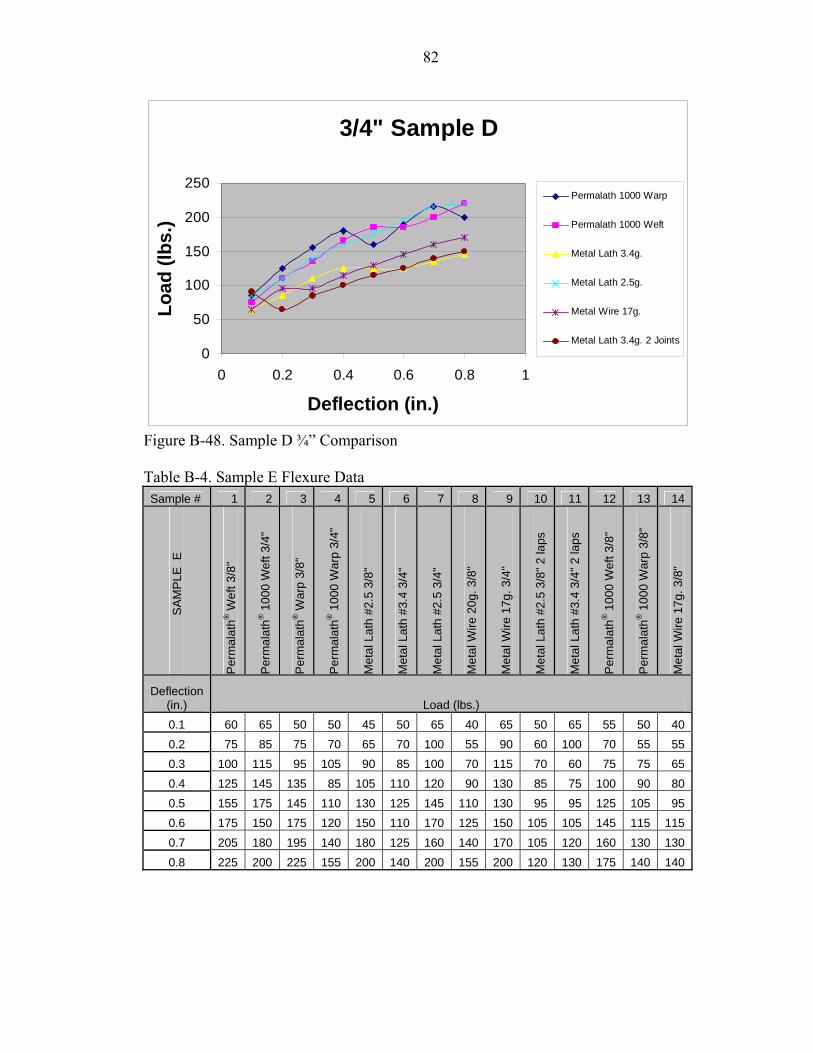
82
3/4" Sample D
0
50
100
150
200
250
0 0.2 0.4 0.6 0.8 1
Deflection (in.)
Load
(lbs
.)Permalath 1000 Warp
Permalath 1000 Weft
Metal Lath 3.4g.
Metal Lath 2.5g.
Metal Wire 17g.
Metal Lath 3.4g. 2 Joints
Figure B-48. Sample D ¾” Comparison Table B-4. Sample E Flexure Data Sample # 1 2 3 4 5 6 7 8 9 10 11 12 13 14
S
AM
PLE
E
Per
mal
ath®
Wef
t 3/8
"
Per
mal
ath®
100
0 W
eft 3
/4"
Per
mal
ath®
War
p 3/
8"
Per
mal
ath®
100
0 W
arp
3/4"
Met
al L
ath
#2.5
3/8
"
Met
al L
ath
#3.4
3/4
"
Met
al L
ath
#2.5
3/4
"
Met
al W
ire 2
0g. 3
/8"
Met
al W
ire 1
7g. 3
/4"
Met
al L
ath
#2.5
3/8
" 2 la
ps
Met
al L
ath
#3.4
3/4
" 2 la
ps
Per
mal
ath®
100
0 W
eft 3
/8"
Per
mal
ath®
100
0 W
arp
3/8"
Met
al W
ire 1
7g. 3
/8"
Deflection (in.) Load (lbs.) 0.1 60 65 50 50 45 50 65 40 65 50 65 55 50 400.2 75 85 75 70 65 70 100 55 90 60 100 70 55 550.3 100 115 95 105 90 85 100 70 115 70 60 75 75 650.4 125 145 135 85 105 110 120 90 130 85 75 100 90 800.5 155 175 145 110 130 125 145 110 130 95 95 125 105 950.6 175 150 175 120 150 110 170 125 150 105 105 145 115 1150.7 205 180 195 140 180 125 160 140 170 105 120 160 130 1300.8 225 200 225 155 200 140 200 155 200 120 130 175 140 140
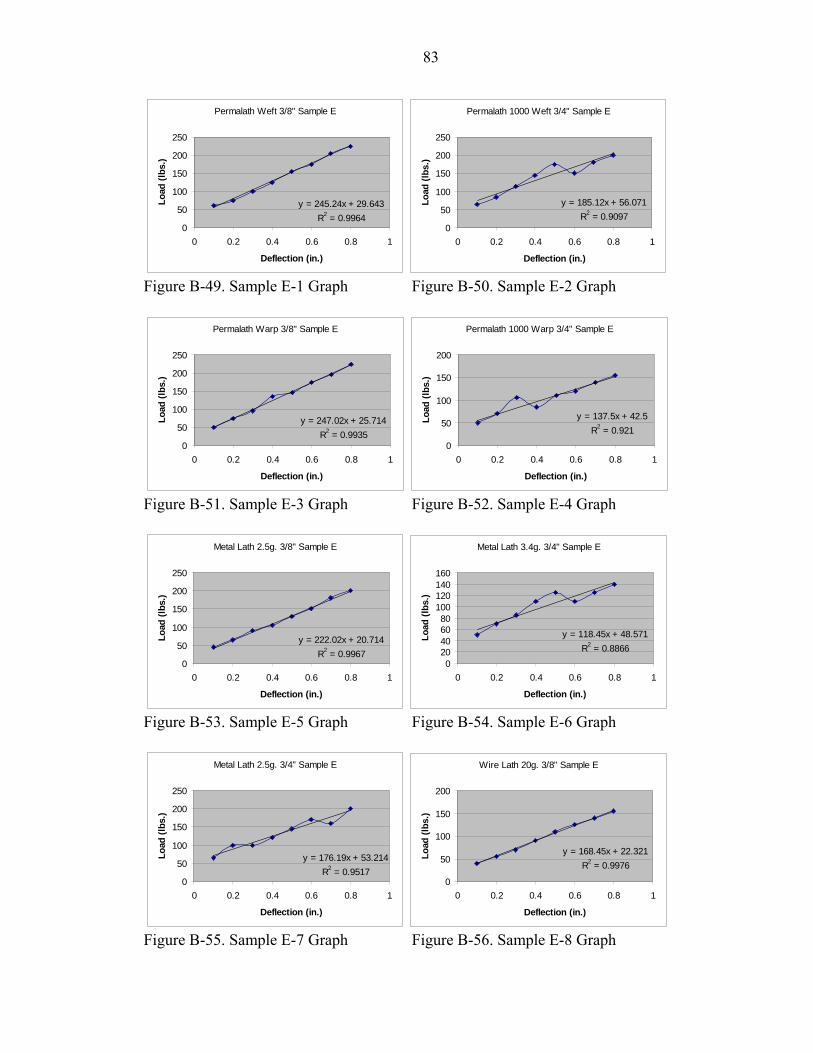
83
Permalath Weft 3/8" Sample E
y = 245.24x + 29.643R2 = 0.9964
0
50
100
150
200
250
0 0.2 0.4 0.6 0.8 1
Deflection (in.)
Load
(lbs
.)
Permalath 1000 Weft 3/4" Sample E
y = 185.12x + 56.071R2 = 0.9097
0
50
100
150
200
250
0 0.2 0.4 0.6 0.8 1
Deflection (in.)
Load
(lbs
.)
Figure B-49. Sample E-1 Graph Figure B-50. Sample E-2 Graph
Permalath Warp 3/8" Sample E
y = 247.02x + 25.714R2 = 0.9935
0
50
100
150
200
250
0 0.2 0.4 0.6 0.8 1
Deflection (in.)
Load
(lbs
.)
Permalath 1000 Warp 3/4" Sample E
y = 137.5x + 42.5R2 = 0.921
0
50
100
150
200
0 0.2 0.4 0.6 0.8 1
Deflection (in.)
Load
(lbs
.)
Figure B-51. Sample E-3 Graph Figure B-52. Sample E-4 Graph
Metal Lath 2.5g. 3/8" Sample E
y = 222.02x + 20.714R2 = 0.9967
0
50
100
150
200
250
0 0.2 0.4 0.6 0.8 1
Deflection (in.)
Load
(lbs
.)
Metal Lath 3.4g. 3/4" Sample E
y = 118.45x + 48.571R2 = 0.8866
020406080
100120140160
0 0.2 0.4 0.6 0.8 1
Deflection (in.)
Load
(lbs
.)
Figure B-53. Sample E-5 Graph Figure B-54. Sample E-6 Graph
Metal Lath 2.5g. 3/4" Sample E
y = 176.19x + 53.214R2 = 0.9517
0
50
100
150
200
250
0 0.2 0.4 0.6 0.8 1
Deflection (in.)
Load
(lbs
.)
Wire Lath 20g. 3/8" Sample E
y = 168.45x + 22.321R2 = 0.9976
0
50
100
150
200
0 0.2 0.4 0.6 0.8 1
Deflection (in.)
Load
(lbs
.)
Figure B-55. Sample E-7 Graph Figure B-56. Sample E-8 Graph
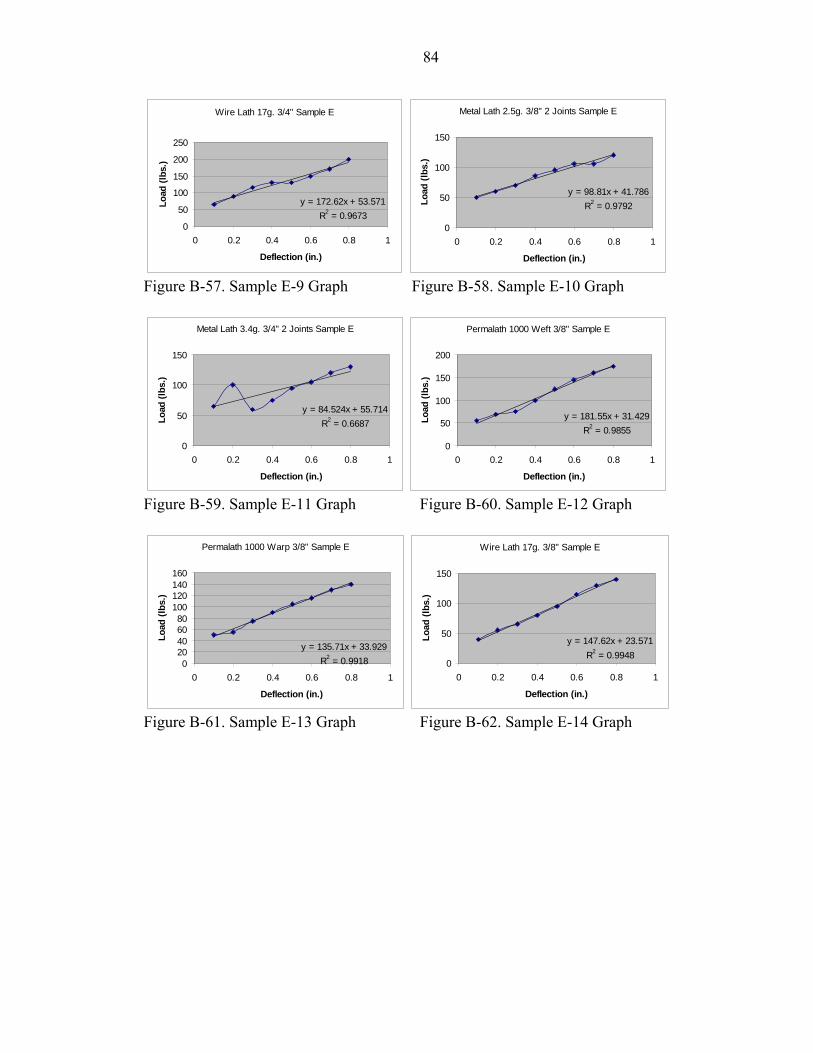
84
Wire Lath 17g. 3/4" Sample E
y = 172.62x + 53.571R2 = 0.9673
0
50
100
150
200
250
0 0.2 0.4 0.6 0.8 1
Deflection (in.)
Load
(lbs
.)
Metal Lath 2.5g. 3/8" 2 Joints Sample E
y = 98.81x + 41.786R2 = 0.9792
0
50
100
150
0 0.2 0.4 0.6 0.8 1
Deflection (in.)
Load
(lbs
.)
Figure B-57. Sample E-9 Graph Figure B-58. Sample E-10 Graph
Metal Lath 3.4g. 3/4" 2 Joints Sample E
y = 84.524x + 55.714R2 = 0.6687
0
50
100
150
0 0.2 0.4 0.6 0.8 1
Deflection (in.)
Load
(lbs
.)
Permalath 1000 Weft 3/8" Sample E
y = 181.55x + 31.429R2 = 0.9855
0
50
100
150
200
0 0.2 0.4 0.6 0.8 1
Deflection (in.)
Load
(lbs
.)
Figure B-59. Sample E-11 Graph Figure B-60. Sample E-12 Graph
Permalath 1000 Warp 3/8" Sample E
y = 135.71x + 33.929R2 = 0.99180
20406080
100120140160
0 0.2 0.4 0.6 0.8 1
Deflection (in.)
Load
(lbs
.)
Wire Lath 17g. 3/8" Sample E
y = 147.62x + 23.571R2 = 0.9948
0
50
100
150
0 0.2 0.4 0.6 0.8 1
Deflection (in.)
Load
(lbs
.)
Figure B-61. Sample E-13 Graph Figure B-62. Sample E-14 Graph
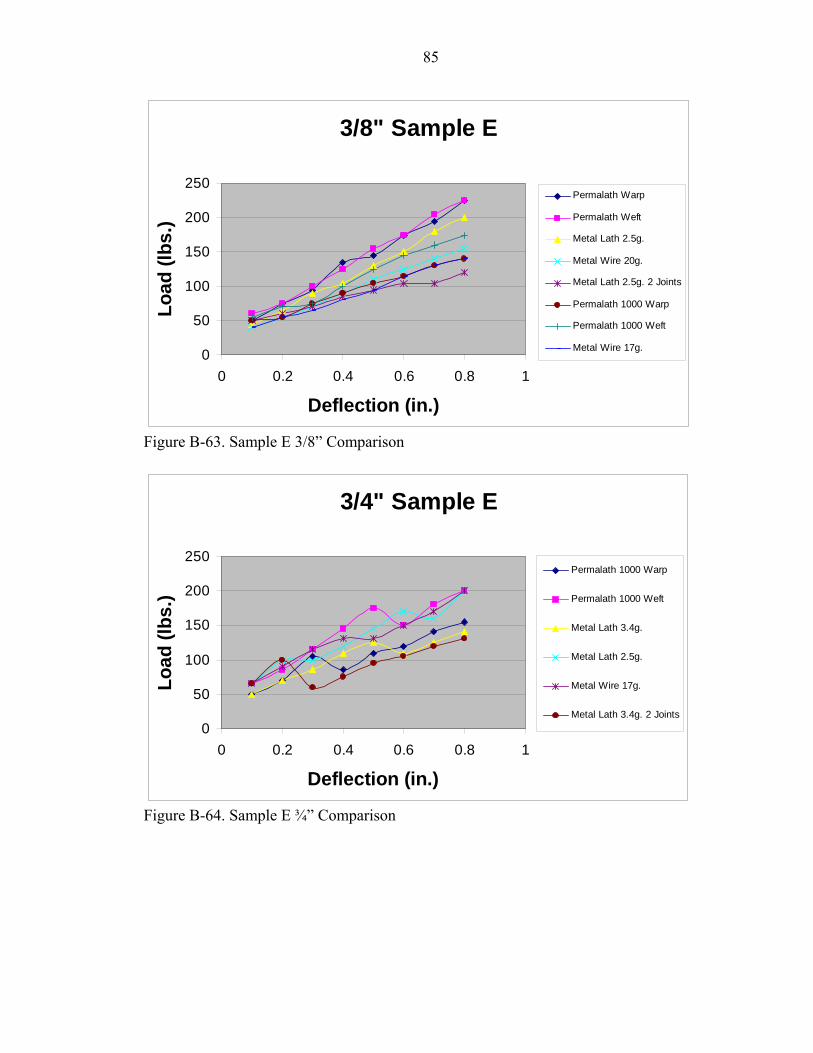
85
3/8" Sample E
0
50
100
150
200
250
0 0.2 0.4 0.6 0.8 1
Deflection (in.)
Load
(lbs
.)Permalath Warp
Permalath Weft
Metal Lath 2.5g.
Metal Wire 20g.
Metal Lath 2.5g. 2 Joints
Permalath 1000 Warp
Permalath 1000 Weft
Metal Wire 17g.
Figure B-63. Sample E 3/8” Comparison
3/4" Sample E
0
50
100
150
200
250
0 0.2 0.4 0.6 0.8 1
Deflection (in.)
Load
(lbs
.)
Permalath 1000 Warp
Permalath 1000 Weft
Metal Lath 3.4g.
Metal Lath 2.5g.
Metal Wire 17g.
Metal Lath 3.4g. 2 Joints
Figure B-64. Sample E ¾” Comparison
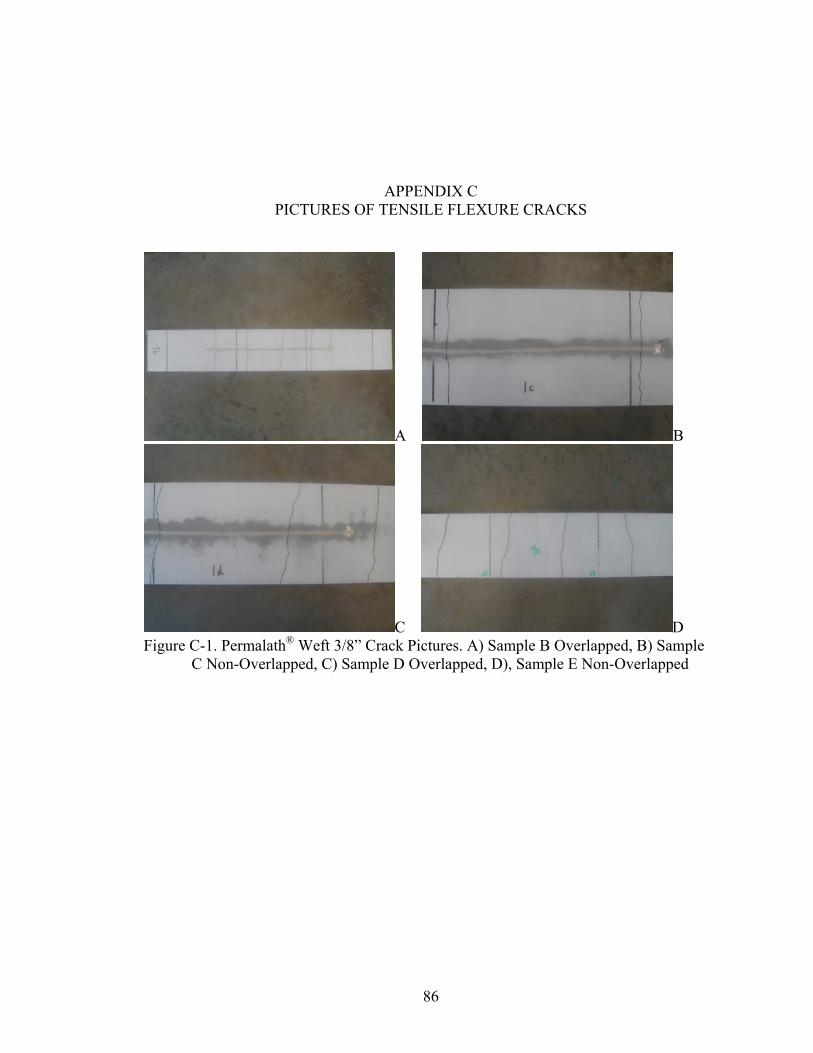
86
APPENDIX C PICTURES OF TENSILE FLEXURE CRACKS
A B
C D Figure C-1. Permalath® Weft 3/8” Crack Pictures. A) Sample B Overlapped, B) Sample
C Non-Overlapped, C) Sample D Overlapped, D), Sample E Non-Overlapped
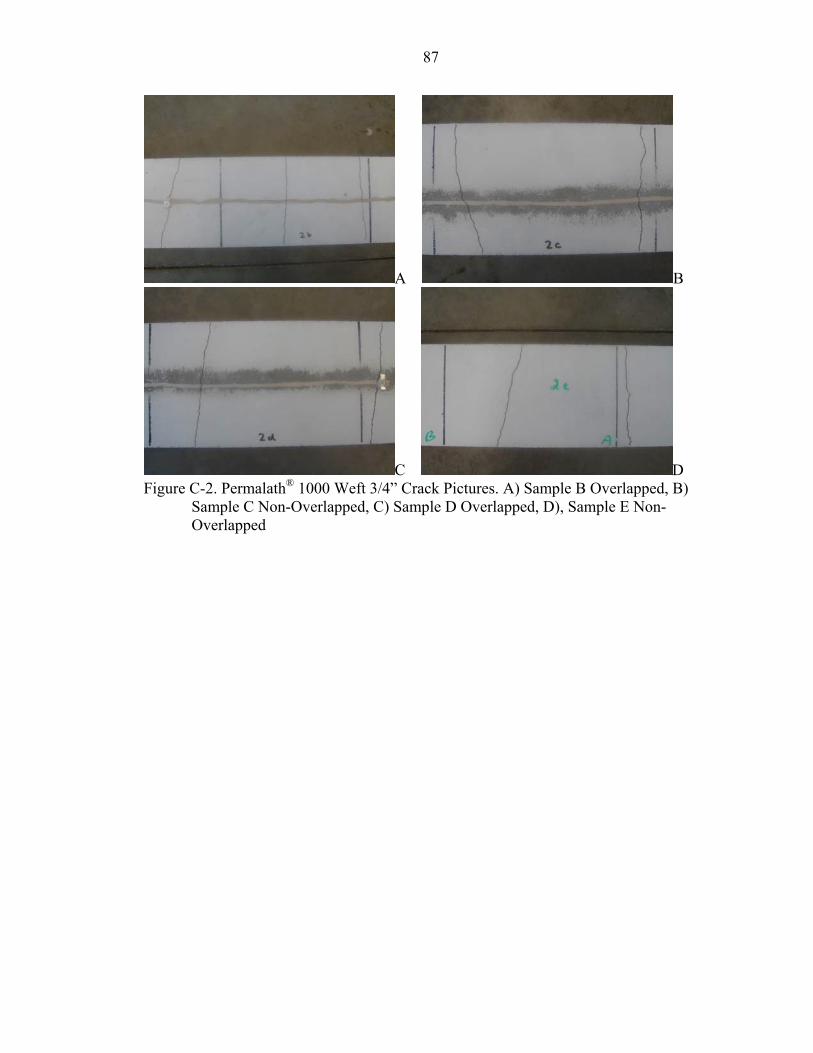
87
A B
C D Figure C-2. Permalath® 1000 Weft 3/4” Crack Pictures. A) Sample B Overlapped, B)
Sample C Non-Overlapped, C) Sample D Overlapped, D), Sample E Non-Overlapped
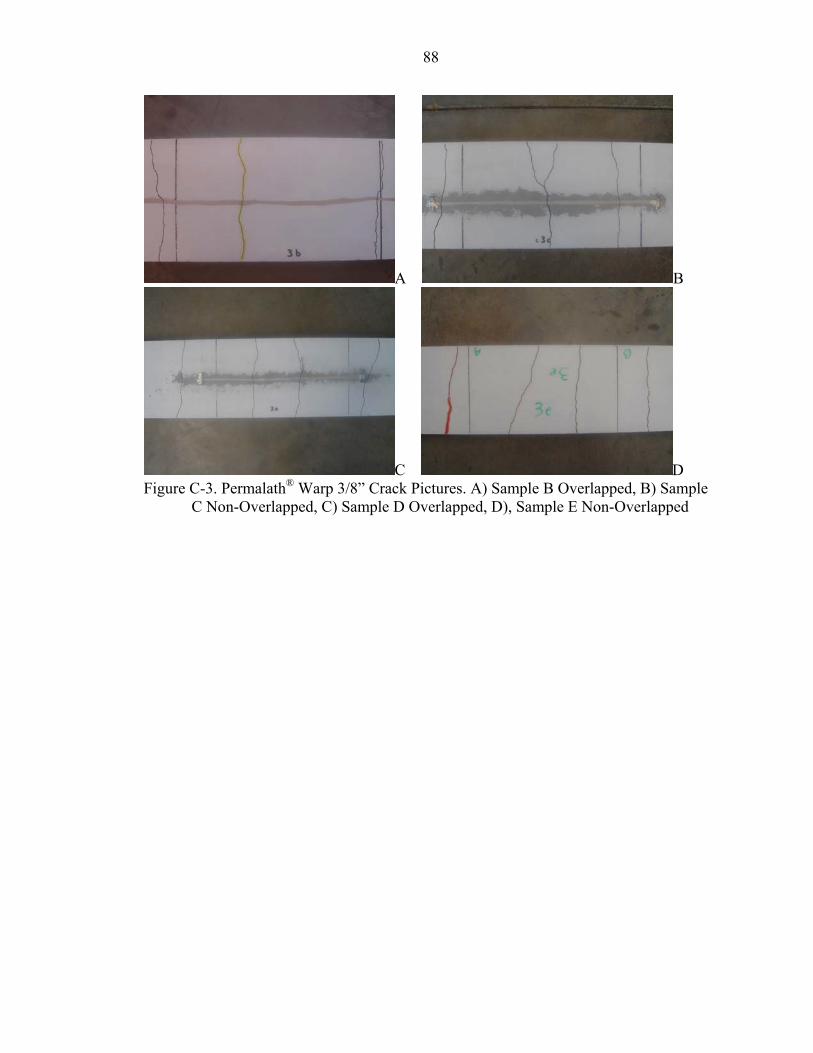
88
A B
C D Figure C-3. Permalath® Warp 3/8” Crack Pictures. A) Sample B Overlapped, B) Sample
C Non-Overlapped, C) Sample D Overlapped, D), Sample E Non-Overlapped
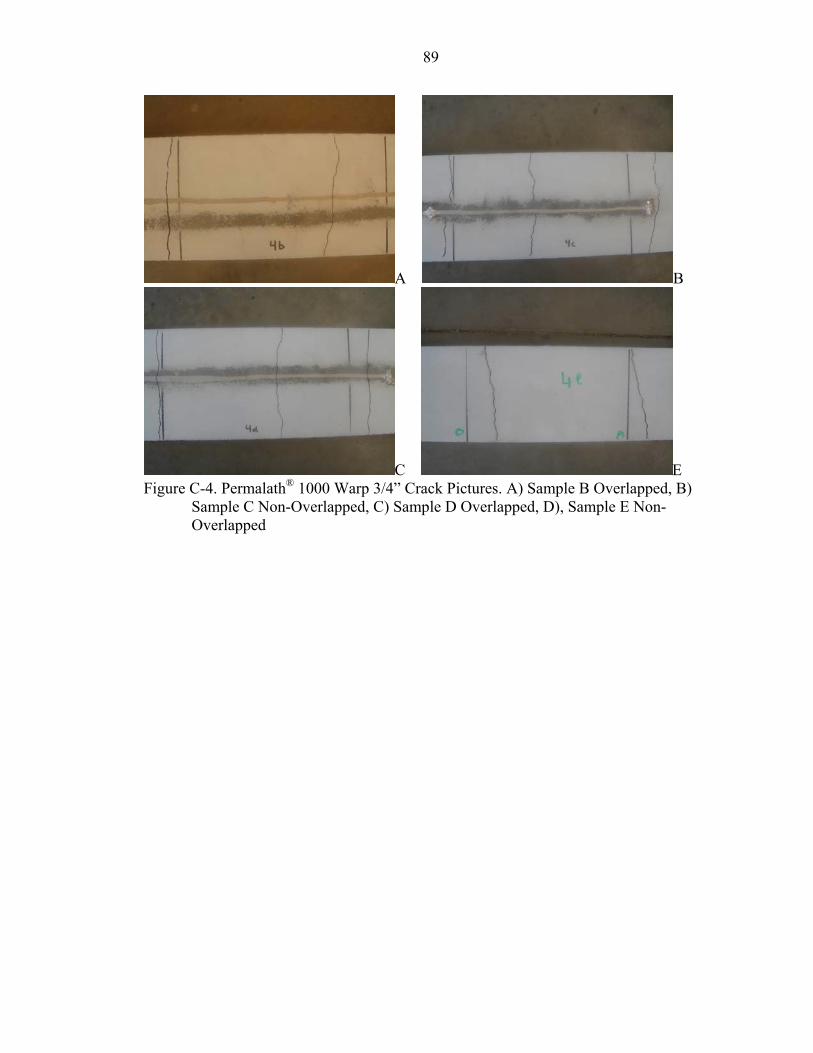
89
A B
C E Figure C-4. Permalath® 1000 Warp 3/4” Crack Pictures. A) Sample B Overlapped, B)
Sample C Non-Overlapped, C) Sample D Overlapped, D), Sample E Non-Overlapped
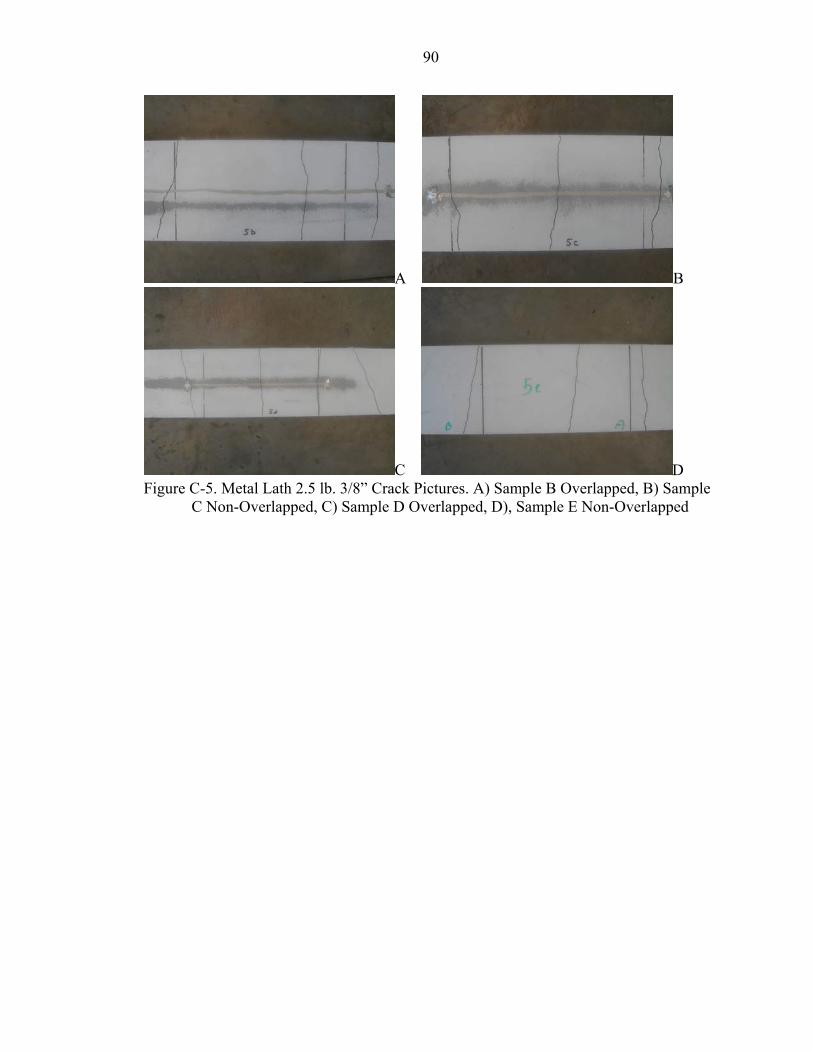
90
A B
C D Figure C-5. Metal Lath 2.5 lb. 3/8” Crack Pictures. A) Sample B Overlapped, B) Sample
C Non-Overlapped, C) Sample D Overlapped, D), Sample E Non-Overlapped
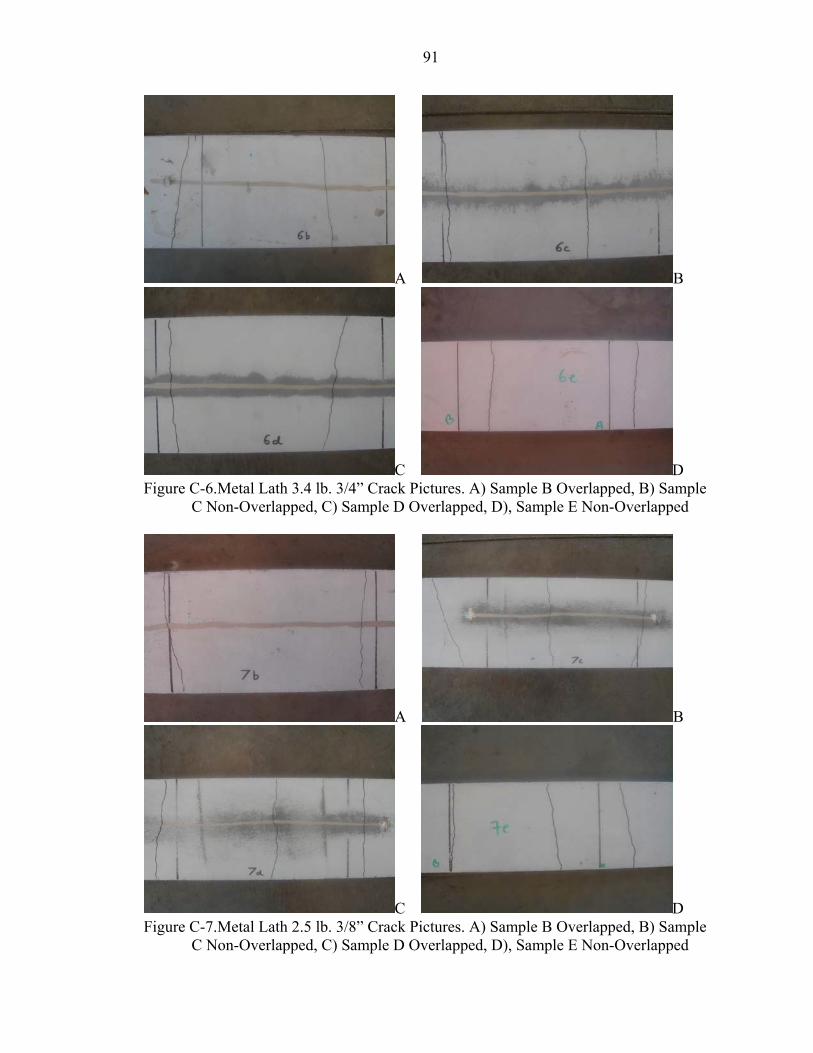
91
A B
C D Figure C-6.Metal Lath 3.4 lb. 3/4” Crack Pictures. A) Sample B Overlapped, B) Sample
C Non-Overlapped, C) Sample D Overlapped, D), Sample E Non-Overlapped
A B
C D Figure C-7.Metal Lath 2.5 lb. 3/8” Crack Pictures. A) Sample B Overlapped, B) Sample
C Non-Overlapped, C) Sample D Overlapped, D), Sample E Non-Overlapped
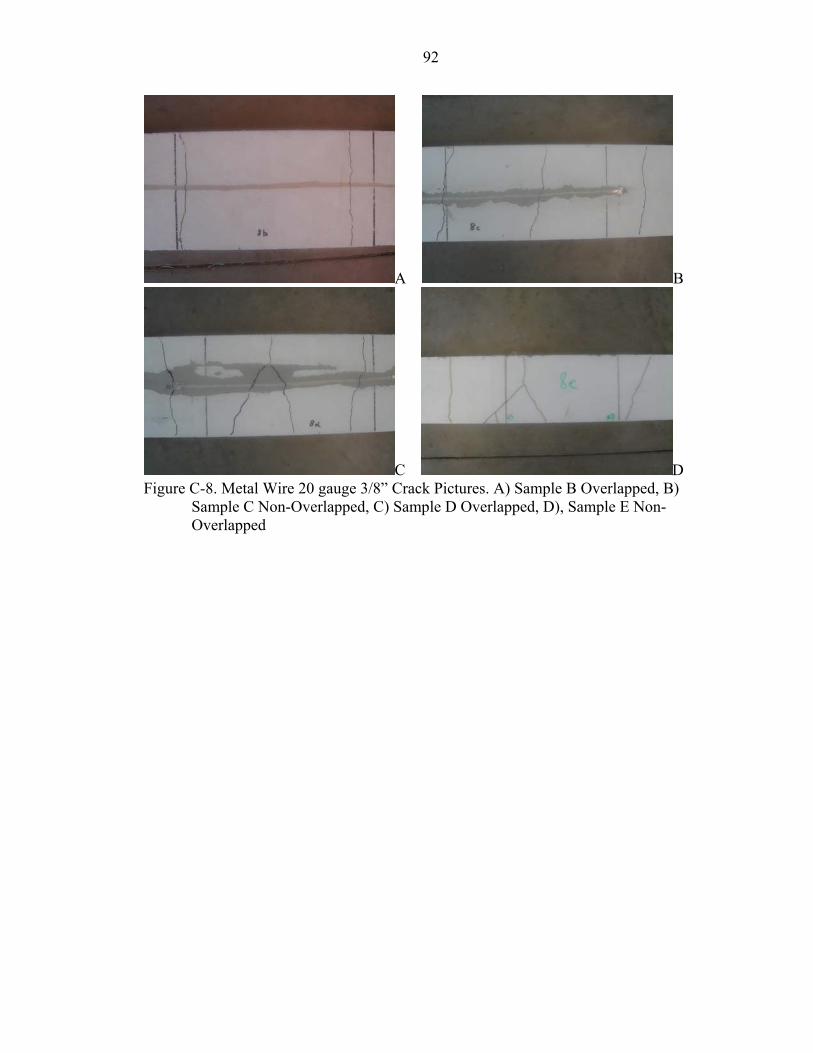
92
A B
C D Figure C-8. Metal Wire 20 gauge 3/8” Crack Pictures. A) Sample B Overlapped, B)
Sample C Non-Overlapped, C) Sample D Overlapped, D), Sample E Non-Overlapped
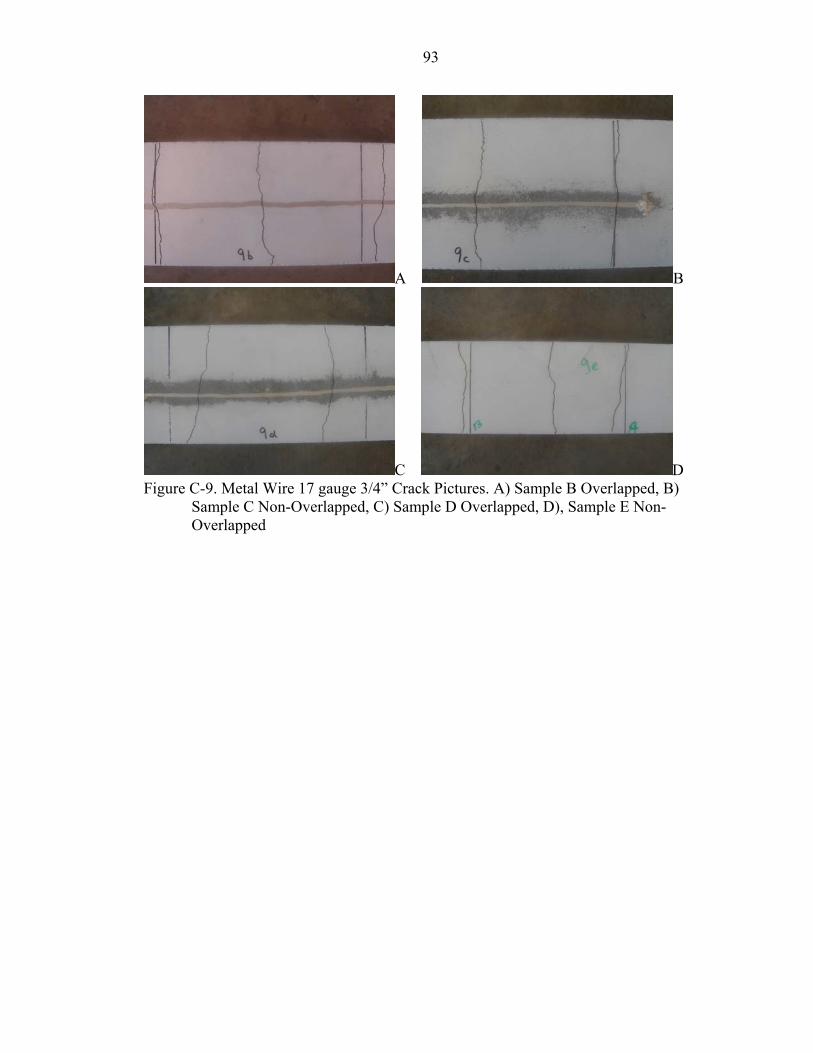
93
A B
C D Figure C-9. Metal Wire 17 gauge 3/4” Crack Pictures. A) Sample B Overlapped, B)
Sample C Non-Overlapped, C) Sample D Overlapped, D), Sample E Non-Overlapped
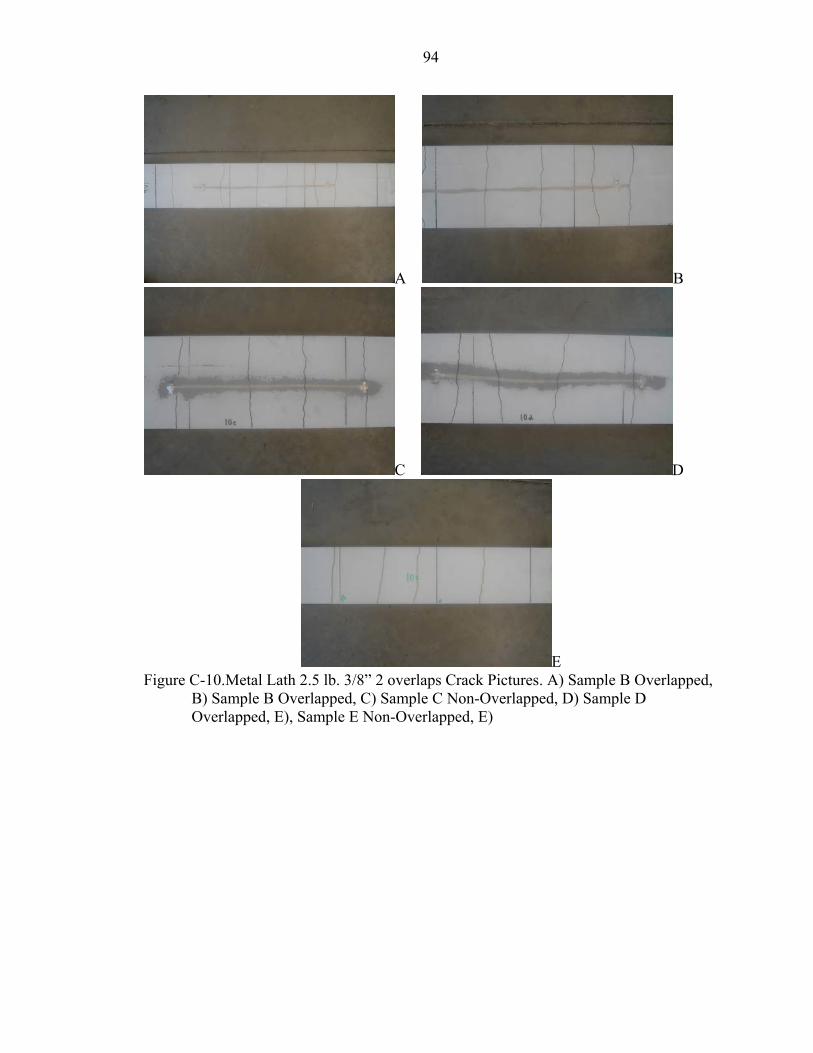
94
A B
C D
E Figure C-10.Metal Lath 2.5 lb. 3/8” 2 overlaps Crack Pictures. A) Sample B Overlapped,
B) Sample B Overlapped, C) Sample C Non-Overlapped, D) Sample D Overlapped, E), Sample E Non-Overlapped, E)
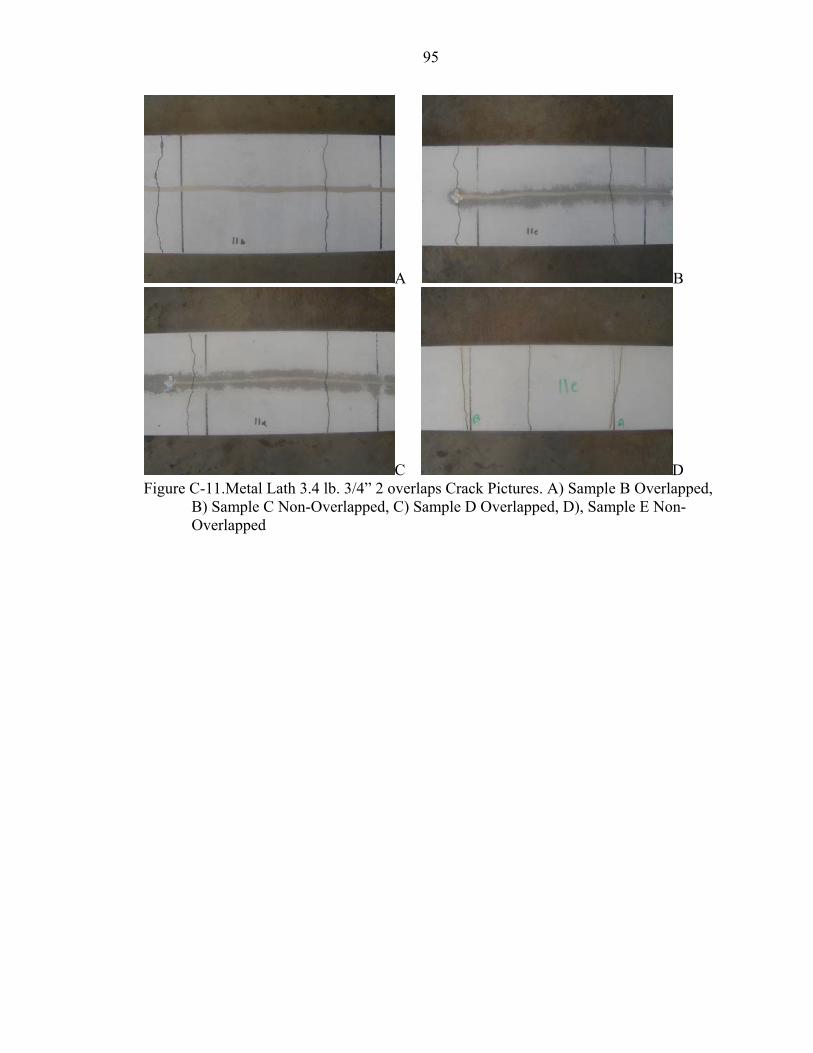
95
A B
C D Figure C-11.Metal Lath 3.4 lb. 3/4” 2 overlaps Crack Pictures. A) Sample B Overlapped,
B) Sample C Non-Overlapped, C) Sample D Overlapped, D), Sample E Non-Overlapped
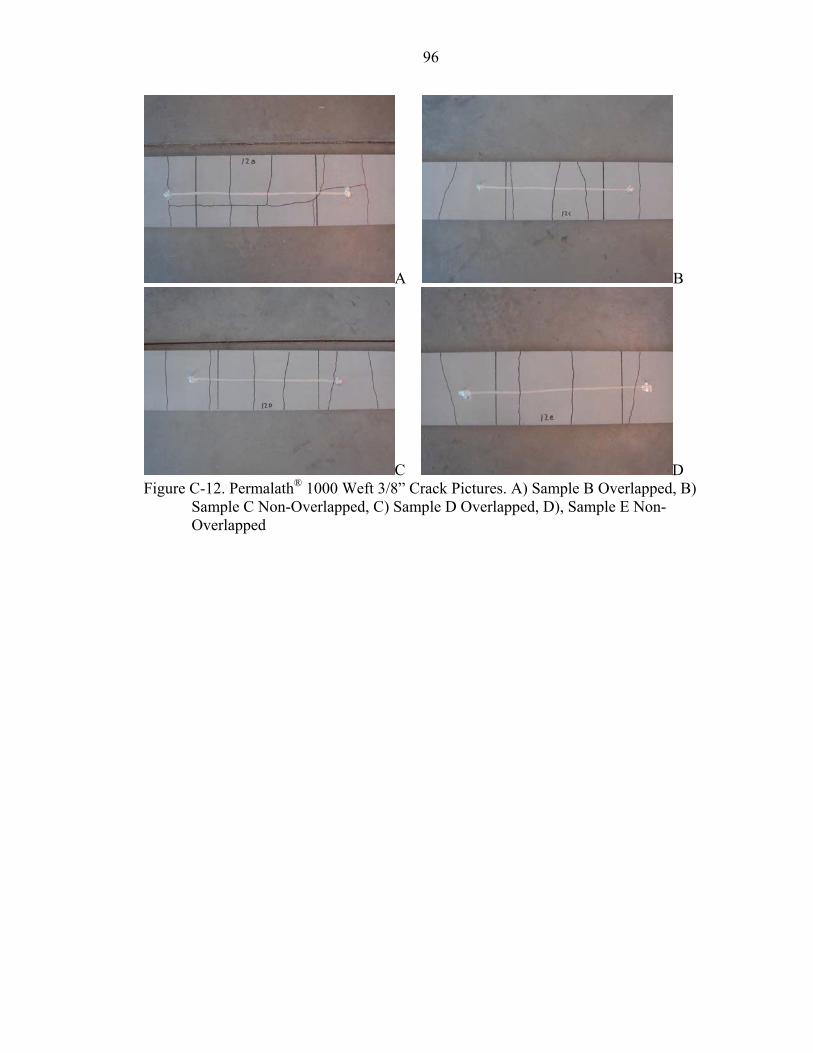
96
A B
C D Figure C-12. Permalath® 1000 Weft 3/8” Crack Pictures. A) Sample B Overlapped, B)
Sample C Non-Overlapped, C) Sample D Overlapped, D), Sample E Non-Overlapped
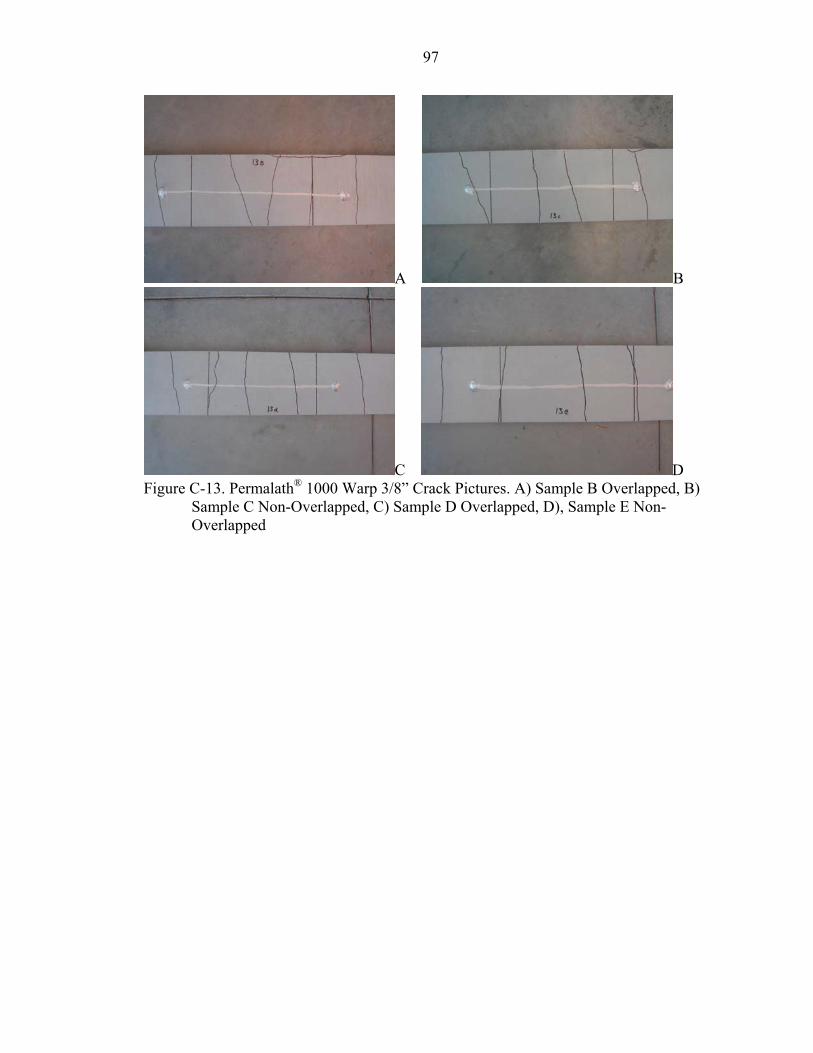
97
A B
C D Figure C-13. Permalath® 1000 Warp 3/8” Crack Pictures. A) Sample B Overlapped, B)
Sample C Non-Overlapped, C) Sample D Overlapped, D), Sample E Non-Overlapped
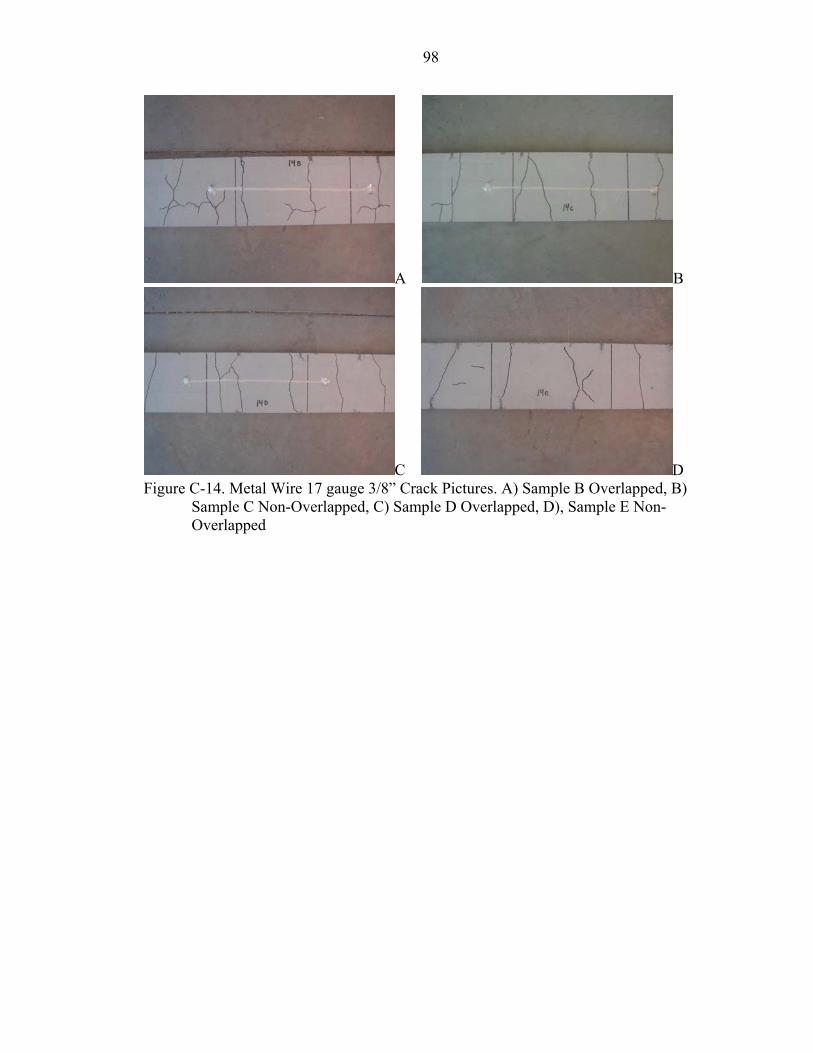
98
A B
C D Figure C-14. Metal Wire 17 gauge 3/8” Crack Pictures. A) Sample B Overlapped, B)
Sample C Non-Overlapped, C) Sample D Overlapped, D), Sample E Non-Overlapped
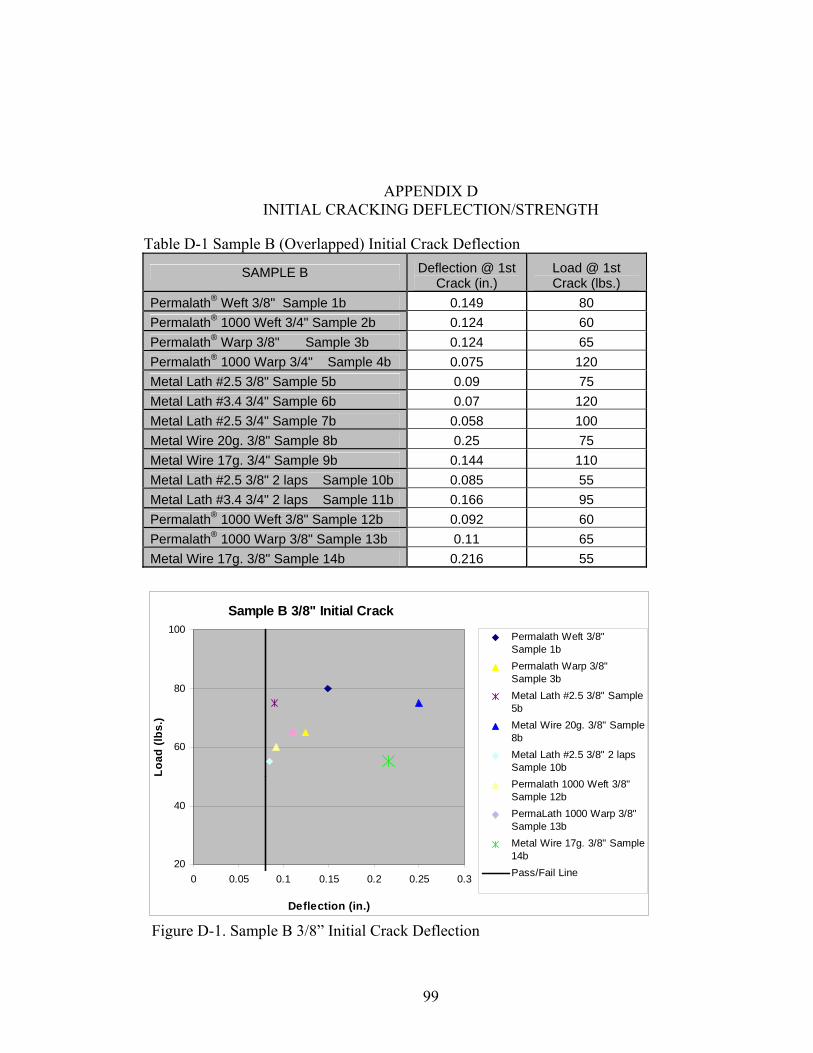
99
APPENDIX D INITIAL CRACKING DEFLECTION/STRENGTH
Table D-1 Sample B (Overlapped) Initial Crack Deflection
SAMPLE B Deflection @ 1st Crack (in.)
Load @ 1st Crack (lbs.)
Permalath® Weft 3/8" Sample 1b 0.149 80 Permalath® 1000 Weft 3/4" Sample 2b 0.124 60 Permalath® Warp 3/8" Sample 3b 0.124 65 Permalath® 1000 Warp 3/4" Sample 4b 0.075 120 Metal Lath #2.5 3/8" Sample 5b 0.09 75 Metal Lath #3.4 3/4" Sample 6b 0.07 120 Metal Lath #2.5 3/4" Sample 7b 0.058 100 Metal Wire 20g. 3/8" Sample 8b 0.25 75 Metal Wire 17g. 3/4" Sample 9b 0.144 110 Metal Lath #2.5 3/8" 2 laps Sample 10b 0.085 55 Metal Lath #3.4 3/4" 2 laps Sample 11b 0.166 95 Permalath® 1000 Weft 3/8" Sample 12b 0.092 60 Permalath® 1000 Warp 3/8" Sample 13b 0.11 65 Metal Wire 17g. 3/8" Sample 14b 0.216 55
Sample B 3/8" Initial Crack
20
40
60
80
100
0 0.05 0.1 0.15 0.2 0.25 0.3
Deflection (in.)
Load
(lbs
.)
Permalath Weft 3/8" Sample 1bPermalath Warp 3/8" Sample 3bMetal Lath #2.5 3/8" Sample5bMetal Wire 20g. 3/8" Sample8bMetal Lath #2.5 3/8" 2 laps Sample 10bPermalath 1000 Weft 3/8"Sample 12bPermaLath 1000 Warp 3/8"Sample 13bMetal Wire 17g. 3/8" Sample14bPass/Fail Line
Figure D-1. Sample B 3/8” Initial Crack Deflection
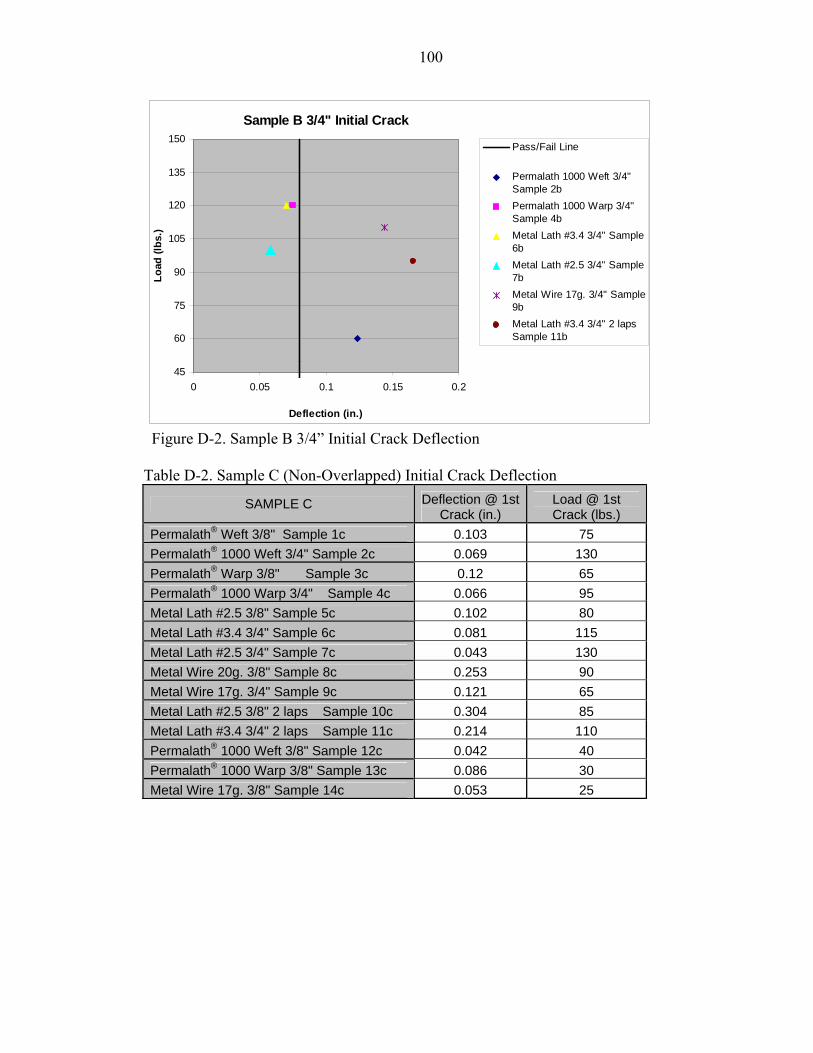
100
Sample B 3/4" Initial Crack
45
60
75
90
105
120
135
150
0 0.05 0.1 0.15 0.2
Deflection (in.)
Load
(lbs
.)Pass/Fail Line
Permalath 1000 Weft 3/4"Sample 2bPermalath 1000 Warp 3/4" Sample 4bMetal Lath #3.4 3/4" Sample6bMetal Lath #2.5 3/4" Sample7bMetal Wire 17g. 3/4" Sample9bMetal Lath #3.4 3/4" 2 laps Sample 11b
Figure D-2. Sample B 3/4” Initial Crack Deflection
Table D-2. Sample C (Non-Overlapped) Initial Crack Deflection
SAMPLE C Deflection @ 1st Crack (in.)
Load @ 1st Crack (lbs.)
Permalath® Weft 3/8" Sample 1c 0.103 75 Permalath® 1000 Weft 3/4" Sample 2c 0.069 130 Permalath® Warp 3/8" Sample 3c 0.12 65 Permalath® 1000 Warp 3/4" Sample 4c 0.066 95 Metal Lath #2.5 3/8" Sample 5c 0.102 80 Metal Lath #3.4 3/4" Sample 6c 0.081 115 Metal Lath #2.5 3/4" Sample 7c 0.043 130 Metal Wire 20g. 3/8" Sample 8c 0.253 90 Metal Wire 17g. 3/4" Sample 9c 0.121 65 Metal Lath #2.5 3/8" 2 laps Sample 10c 0.304 85 Metal Lath #3.4 3/4" 2 laps Sample 11c 0.214 110 Permalath® 1000 Weft 3/8" Sample 12c 0.042 40 Permalath® 1000 Warp 3/8" Sample 13c 0.086 30 Metal Wire 17g. 3/8" Sample 14c 0.053 25
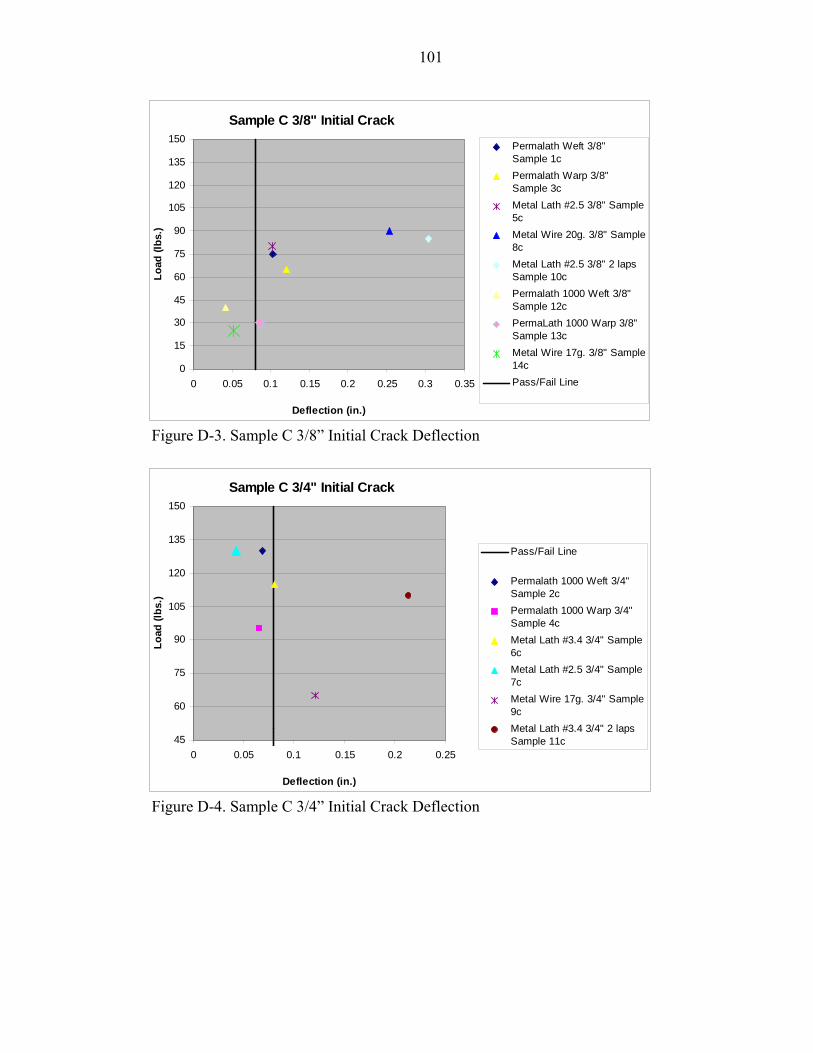
101
Sample C 3/8" Initial Crack
0
15
30
45
60
75
90
105
120
135
150
0 0.05 0.1 0.15 0.2 0.25 0.3 0.35
Deflection (in.)
Load
(lbs
.)Permalath Weft 3/8" Sample 1cPermalath Warp 3/8" Sample 3cMetal Lath #2.5 3/8" Sample5cMetal Wire 20g. 3/8" Sample8cMetal Lath #2.5 3/8" 2 laps Sample 10cPermalath 1000 Weft 3/8"Sample 12cPermaLath 1000 Warp 3/8"Sample 13cMetal Wire 17g. 3/8" Sample14cPass/Fail Line
Figure D-3. Sample C 3/8” Initial Crack Deflection
Sample C 3/4" Initial Crack
45
60
75
90
105
120
135
150
0 0.05 0.1 0.15 0.2 0.25
Deflection (in.)
Load
(lbs
.)
Pass/Fail Line
Permalath 1000 Weft 3/4"Sample 2cPermalath 1000 Warp 3/4" Sample 4cMetal Lath #3.4 3/4" Sample6cMetal Lath #2.5 3/4" Sample7cMetal Wire 17g. 3/4" Sample9cMetal Lath #3.4 3/4" 2 laps Sample 11c
Figure D-4. Sample C 3/4” Initial Crack Deflection
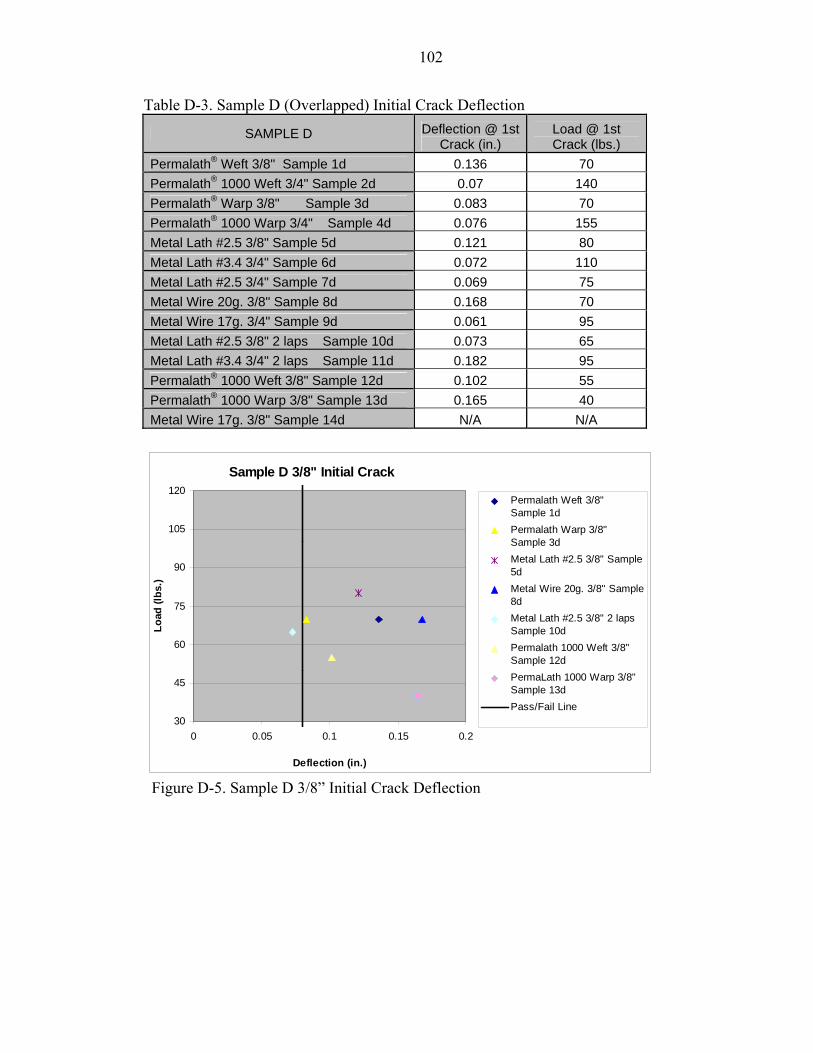
102
Table D-3. Sample D (Overlapped) Initial Crack Deflection
SAMPLE D Deflection @ 1st Crack (in.)
Load @ 1st Crack (lbs.)
Permalath® Weft 3/8" Sample 1d 0.136 70 Permalath® 1000 Weft 3/4" Sample 2d 0.07 140 Permalath® Warp 3/8" Sample 3d 0.083 70 Permalath® 1000 Warp 3/4" Sample 4d 0.076 155 Metal Lath #2.5 3/8" Sample 5d 0.121 80 Metal Lath #3.4 3/4" Sample 6d 0.072 110 Metal Lath #2.5 3/4" Sample 7d 0.069 75 Metal Wire 20g. 3/8" Sample 8d 0.168 70 Metal Wire 17g. 3/4" Sample 9d 0.061 95 Metal Lath #2.5 3/8" 2 laps Sample 10d 0.073 65 Metal Lath #3.4 3/4" 2 laps Sample 11d 0.182 95 Permalath® 1000 Weft 3/8" Sample 12d 0.102 55 Permalath® 1000 Warp 3/8" Sample 13d 0.165 40 Metal Wire 17g. 3/8" Sample 14d N/A N/A
Sample D 3/8" Initial Crack
30
45
60
75
90
105
120
0 0.05 0.1 0.15 0.2
Deflection (in.)
Load
(lbs
.)
Permalath Weft 3/8" Sample 1dPermalath Warp 3/8" Sample 3dMetal Lath #2.5 3/8" Sample5dMetal Wire 20g. 3/8" Sample8dMetal Lath #2.5 3/8" 2 laps Sample 10dPermalath 1000 Weft 3/8"Sample 12dPermaLath 1000 Warp 3/8"Sample 13dPass/Fail Line
Figure D-5. Sample D 3/8” Initial Crack Deflection
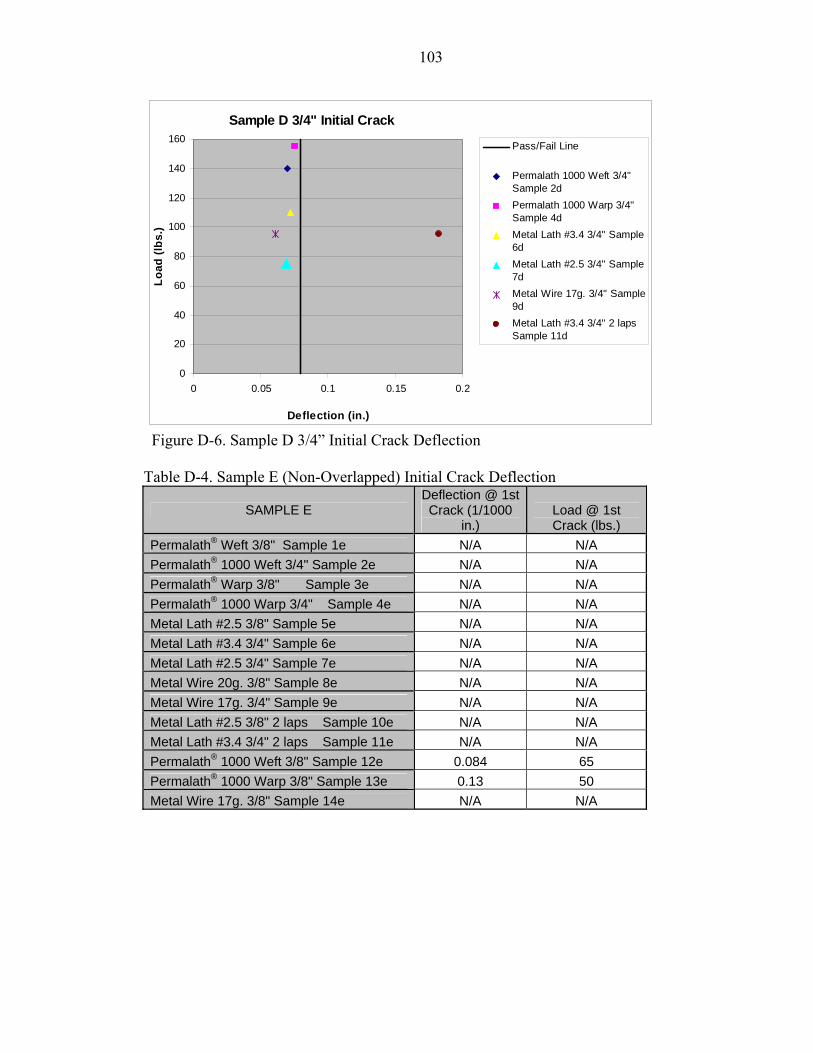
103
Sample D 3/4" Initial Crack
0
20
40
60
80
100
120
140
160
0 0.05 0.1 0.15 0.2
Deflection (in.)
Load
(lbs
.)Pass/Fail Line
Permalath 1000 Weft 3/4"Sample 2dPermalath 1000 Warp 3/4" Sample 4dMetal Lath #3.4 3/4" Sample6dMetal Lath #2.5 3/4" Sample7dMetal Wire 17g. 3/4" Sample9dMetal Lath #3.4 3/4" 2 laps Sample 11d
Figure D-6. Sample D 3/4” Initial Crack Deflection
Table D-4. Sample E (Non-Overlapped) Initial Crack Deflection
SAMPLE E Deflection @ 1st Crack (1/1000
in.) Load @ 1st Crack (lbs.)
Permalath® Weft 3/8" Sample 1e N/A N/A Permalath® 1000 Weft 3/4" Sample 2e N/A N/A Permalath® Warp 3/8" Sample 3e N/A N/A Permalath® 1000 Warp 3/4" Sample 4e N/A N/A Metal Lath #2.5 3/8" Sample 5e N/A N/A Metal Lath #3.4 3/4" Sample 6e N/A N/A Metal Lath #2.5 3/4" Sample 7e N/A N/A Metal Wire 20g. 3/8" Sample 8e N/A N/A Metal Wire 17g. 3/4" Sample 9e N/A N/A Metal Lath #2.5 3/8" 2 laps Sample 10e N/A N/A Metal Lath #3.4 3/4" 2 laps Sample 11e N/A N/A Permalath® 1000 Weft 3/8" Sample 12e 0.084 65 Permalath® 1000 Warp 3/8" Sample 13e 0.13 50 Metal Wire 17g. 3/8" Sample 14e N/A N/A
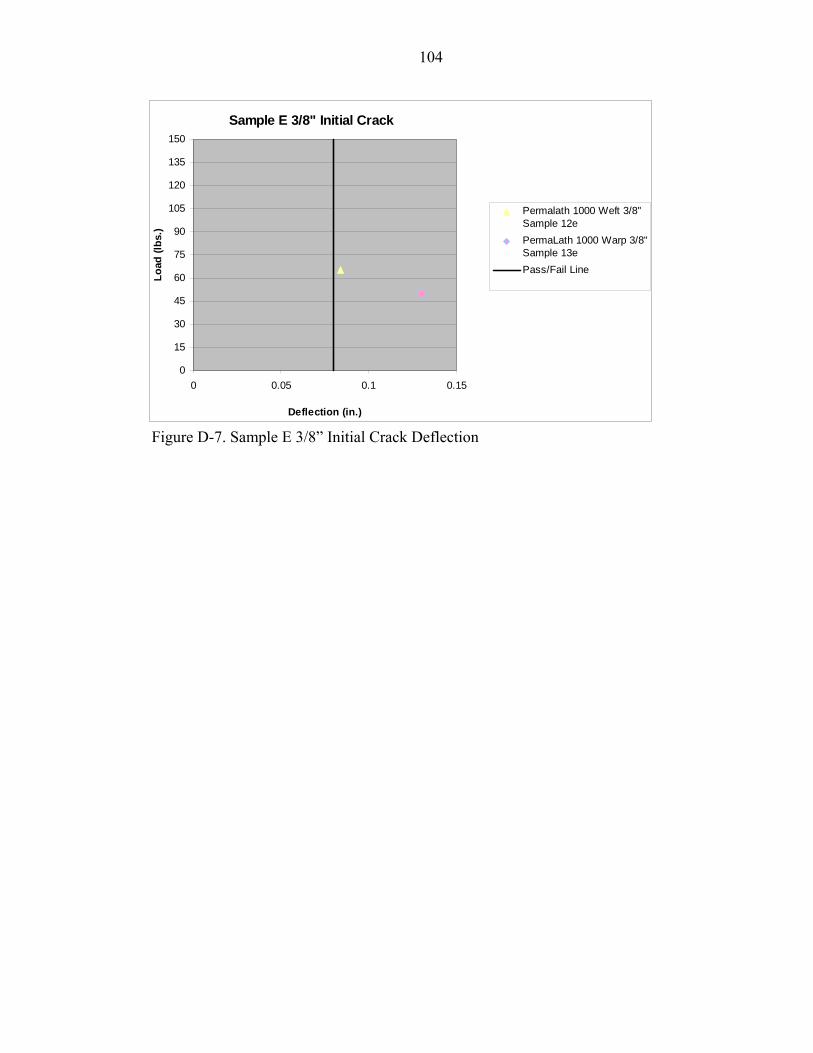
104
Sample E 3/8" Initial Crack
0
15
30
45
60
75
90
105
120
135
150
0 0.05 0.1 0.15
Deflection (in.)
Load
(lbs
.)
Permalath 1000 Weft 3/8"Sample 12ePermaLath 1000 Warp 3/8"Sample 13ePass/Fail Line
Figure D-7. Sample E 3/8” Initial Crack Deflection
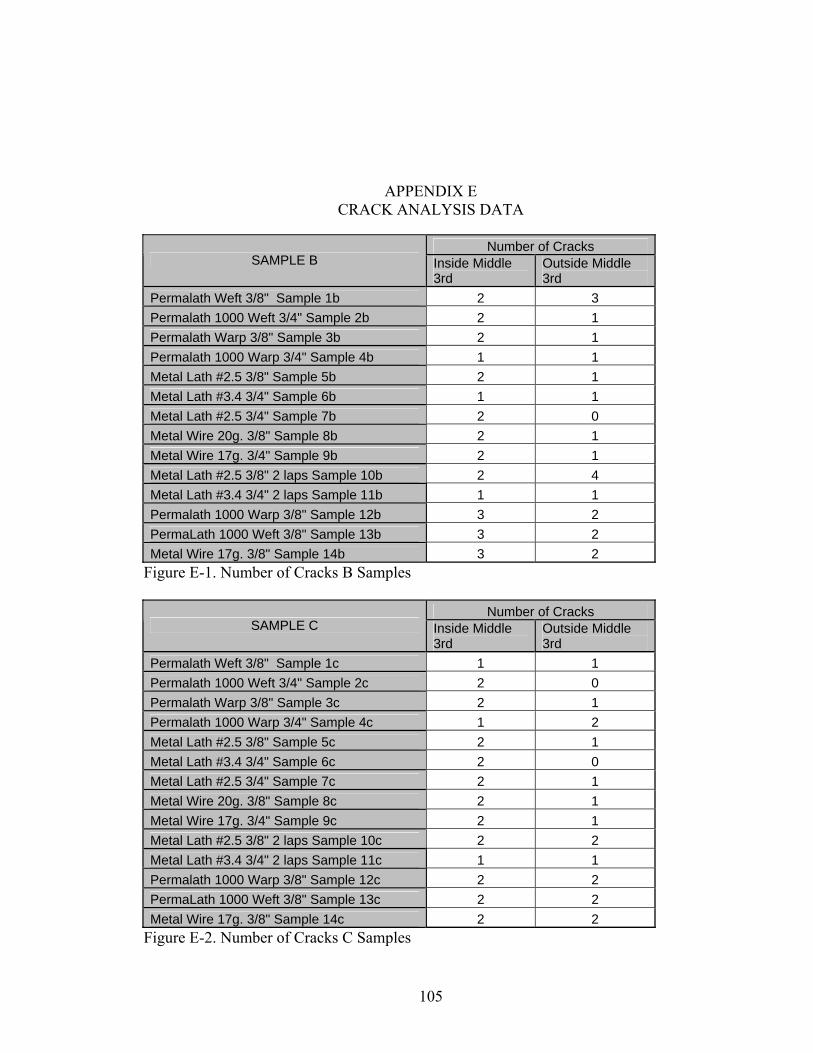
105
APPENDIX E CRACK ANALYSIS DATA
Number of Cracks SAMPLE B Inside Middle
3rd Outside Middle 3rd
Permalath Weft 3/8" Sample 1b 2 3 Permalath 1000 Weft 3/4" Sample 2b 2 1 Permalath Warp 3/8" Sample 3b 2 1 Permalath 1000 Warp 3/4" Sample 4b 1 1 Metal Lath #2.5 3/8" Sample 5b 2 1 Metal Lath #3.4 3/4" Sample 6b 1 1 Metal Lath #2.5 3/4" Sample 7b 2 0 Metal Wire 20g. 3/8" Sample 8b 2 1 Metal Wire 17g. 3/4" Sample 9b 2 1 Metal Lath #2.5 3/8" 2 laps Sample 10b 2 4 Metal Lath #3.4 3/4" 2 laps Sample 11b 1 1 Permalath 1000 Warp 3/8" Sample 12b 3 2 PermaLath 1000 Weft 3/8" Sample 13b 3 2 Metal Wire 17g. 3/8" Sample 14b 3 2
Figure E-1. Number of Cracks B Samples
Number of Cracks SAMPLE C Inside Middle
3rd Outside Middle 3rd
Permalath Weft 3/8" Sample 1c 1 1 Permalath 1000 Weft 3/4" Sample 2c 2 0 Permalath Warp 3/8" Sample 3c 2 1 Permalath 1000 Warp 3/4" Sample 4c 1 2 Metal Lath #2.5 3/8" Sample 5c 2 1 Metal Lath #3.4 3/4" Sample 6c 2 0 Metal Lath #2.5 3/4" Sample 7c 2 1 Metal Wire 20g. 3/8" Sample 8c 2 1 Metal Wire 17g. 3/4" Sample 9c 2 1 Metal Lath #2.5 3/8" 2 laps Sample 10c 2 2 Metal Lath #3.4 3/4" 2 laps Sample 11c 1 1 Permalath 1000 Warp 3/8" Sample 12c 2 2 PermaLath 1000 Weft 3/8" Sample 13c 2 2 Metal Wire 17g. 3/8" Sample 14c 2 2
Figure E-2. Number of Cracks C Samples
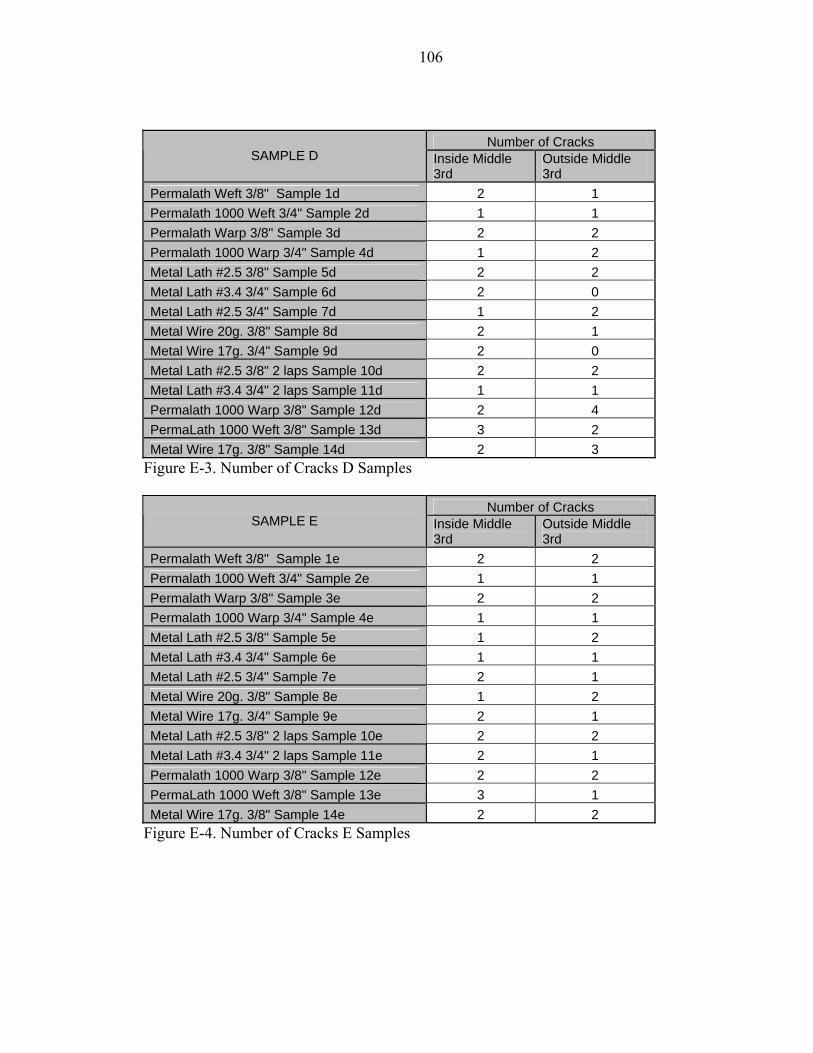
106
Number of Cracks SAMPLE D Inside Middle
3rd Outside Middle 3rd
Permalath Weft 3/8" Sample 1d 2 1 Permalath 1000 Weft 3/4" Sample 2d 1 1 Permalath Warp 3/8" Sample 3d 2 2 Permalath 1000 Warp 3/4" Sample 4d 1 2 Metal Lath #2.5 3/8" Sample 5d 2 2 Metal Lath #3.4 3/4" Sample 6d 2 0 Metal Lath #2.5 3/4" Sample 7d 1 2 Metal Wire 20g. 3/8" Sample 8d 2 1 Metal Wire 17g. 3/4" Sample 9d 2 0 Metal Lath #2.5 3/8" 2 laps Sample 10d 2 2 Metal Lath #3.4 3/4" 2 laps Sample 11d 1 1 Permalath 1000 Warp 3/8" Sample 12d 2 4 PermaLath 1000 Weft 3/8" Sample 13d 3 2 Metal Wire 17g. 3/8" Sample 14d 2 3
Figure E-3. Number of Cracks D Samples
Number of Cracks SAMPLE E Inside Middle
3rd Outside Middle 3rd
Permalath Weft 3/8" Sample 1e 2 2 Permalath 1000 Weft 3/4" Sample 2e 1 1 Permalath Warp 3/8" Sample 3e 2 2 Permalath 1000 Warp 3/4" Sample 4e 1 1 Metal Lath #2.5 3/8" Sample 5e 1 2 Metal Lath #3.4 3/4" Sample 6e 1 1 Metal Lath #2.5 3/4" Sample 7e 2 1 Metal Wire 20g. 3/8" Sample 8e 1 2 Metal Wire 17g. 3/4" Sample 9e 2 1 Metal Lath #2.5 3/8" 2 laps Sample 10e 2 2 Metal Lath #3.4 3/4" 2 laps Sample 11e 2 1 Permalath 1000 Warp 3/8" Sample 12e 2 2 PermaLath 1000 Weft 3/8" Sample 13e 3 1 Metal Wire 17g. 3/8" Sample 14e 2 2
Figure E-4. Number of Cracks E Samples

107
LIST OF REFERENCES
American Concrete Institute, Measurement of Properties of Fiber Reinforced Concrete, ACI Committee 544- ACI 544.2R-89 (1999).
Anders, Carolin, Carbon fibre Reinforced Polymers for Strengthening of Structural
Elements, Lulea University of Technology, Sweden (2003). Balendran R.V, Maqsood T., Rana T.M, Tang W.C, Application of FRP Bars as
Reinforcement in Civil Engineering Structure, Structural Survey (2002) Vol, 20, Number 2, pp62-72.
Bellis, Mary, The History of Concrete and Cement, Inventors (2005). Black, Sara, Fiber-Reinforced Concrete: Coming on Strong, Composites and Concrete
(April 2005). Degussa Wall Systems, Permalath®, Product Bulletin 1027195, Degussa Wall Systems
Inc. (2004). SPEC-DATA, Quikrete, Portland Cement Plaster 09220, Reed Construction Data
(2005). Ueda, Tamon, and Sato, Yasuhiko, New Approach for Usage of Continuous Fiber as
Non-Metallic Reinforcement of Concrete, Advanced Materials, Japan, (2002) pp111-116.
108
BIOGRAPHICAL SKETCH
Patrick W. Murray was born July 11, 1981 in Little Rock, Arkansas. He is the
second son of Walter Murray and Linda Young. He received his high school diploma
from Parkview High School in 1999. He earned his Bachelor of Science in Business
Management from the University of Arkansas at Little Rock in 2003. Patrick moved to
Gainesville, Florida in 2005 to pursue his Master of Science in Building Construction at
the University of Florida.