Embed Size (px)
Citation preview

Title
Comparison Of Non-Heme Liver Iron And Iron Metabolism Protein Levels In Superoxide Dismutase 1 Knock-Out Mice Versus Superoxide Dismutase 1 Wild-Type
Mice
Abstract
Iron is an important micronutrient that is necessary for multiple cellular functions. However, iron levels must be tightly regulated in order to prevent iron-deficiency and iron-toxicity. There are many proteins involved in iron metabolism. This study focuses on iron-regulatory proteins 1 and 2 (IRP112), ferritin, and transferrin receptor protein (TfR). IRPs are key iron sensors that bind to iron response elements (IREs) located on mRNA when the IRP Fe-S clusters are removed, regulating translation or stability of mRNA. Ferritin is the storage form of iron. Ferritin levels must increase in ironsufficient or overloaded conditions to store the excess iron in a safe form. TfR takes up iron and moves it into afree iron poolfor utilization by the body. TfR levels must increase in iron-deficient conditions to mobilize iron to necessary tissues. When IRP binds to a ferritin IRE, ferritin mRNA translation is inhibited causing ferritin protein levels to decrease. However, when IRP binds to TfR IRE, TfR mRNA is stabilized causing TfR protein levels to increase. Reactive oxygen species (ROS) such as the superoxide anion have been known to destabilize the F'e-S cluster in IRP, possibly leading to IRP degradation in high concentrations ofROS. Superoxide dismutase 1 (SOD1) reacts with the superoxide anion to yield safer complexes (hydrogen peroxide and water). I hypothesized that SOD1 knock-out (KO) mice would have increased non-heme liver iron and ferritin levels as well as decreased TfR and IRP112 levels due to the increased levels ofsuperoxide anions removing the Fe-S clusters, decreasing IRPIIRE TfR and ferritin mRNA binding. My data supported my hypothesis. I used a non-heme liver assay, hematocrit measurements, and western blots to measure the levels ofnon-heme liver iron and protein levels in KO and WT male mice (C57BU61 background) at ages 8 weeks, 2.5-3 months, 4 months, 6 months, and 12 months.
. fJ} C1 00, Lf d
"""TCitCl 81fu1JL SC/1JViA.;1Y1' Author Name/Major
'feud)( Lxi:JA*'= Author Signature

COVER SHEET
TITLE: _______ Comparison Of Non-Heme Liver Iron And Iron Metabolism Protein Levels In Superoxide Dismutase 1 Knock-Out Mice Versus Superoxide Dismutase 1 Wild-Type Mice___________________ ___________________________________
AUTHOR’S NAME:____Tara Bittner_________________________________________
MAJOR: _____Biology and Nutritional Sciences_ __________________
DEPARTMENT: ____ _Nutritional Sciences________________________________
MENTOR: _____Richard Eisenstein _______________________________________
DEPARTMENT:_______Nutritional Sciences _______________________________
MENTOR(2): ____________________________________________________________
DEPARTMENT(2):_______________________________________________________
YEAR: _____2007________________________________________________________
(The following statement must be included if you want your paper included in the library’s electronic repository.) The author hereby grants to University of Wisconsin-Madison the permission to reproduce and to distribute publicly paper and electronic copies of this thesis document in whole or in part in any medium now known or hereafter created.
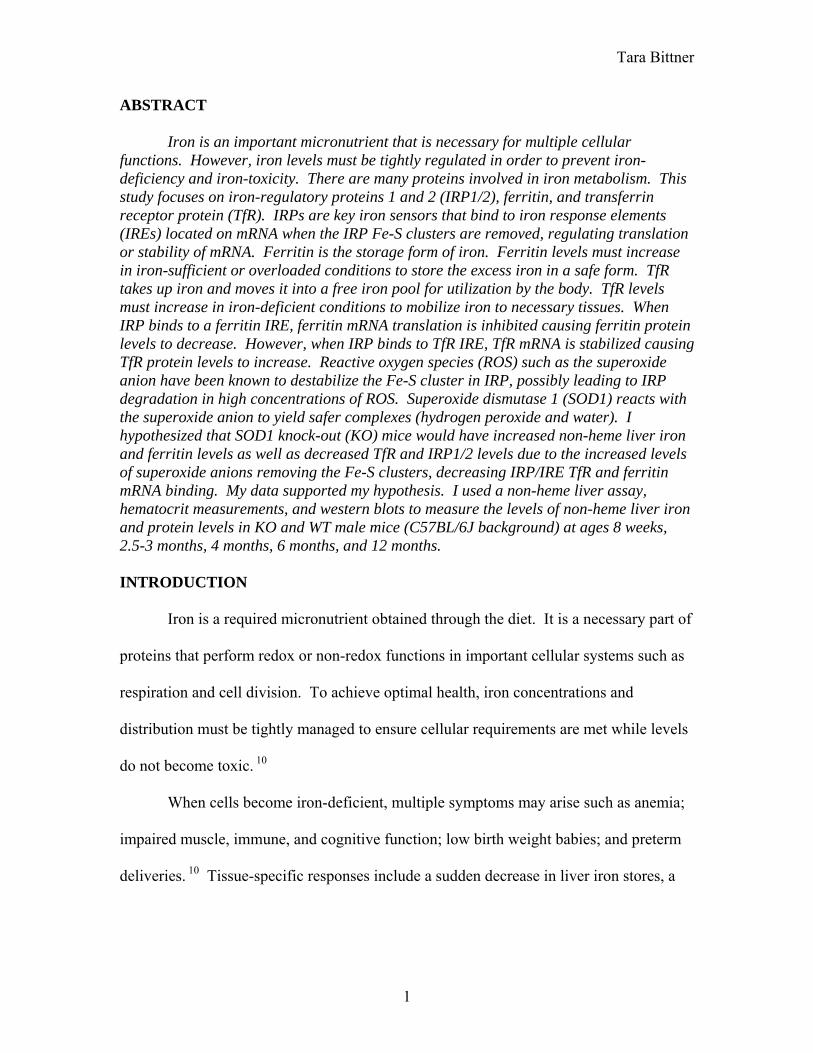
Comparison Of Non-Heme Liver Iron And Iron Metabolism Protein Levels In Superoxide Dismutase 1 Knock-Out Mice Versus
Superoxide Dismutase 1 Wild-Type Mice
By: Tara Bittner
A Senior Honors Thesis prepared under the mentorship of Rick Eisenstein
Department of Nutritional Sciences University of Wisconsin- Madison
May 19th, 2007
Tara Bittner
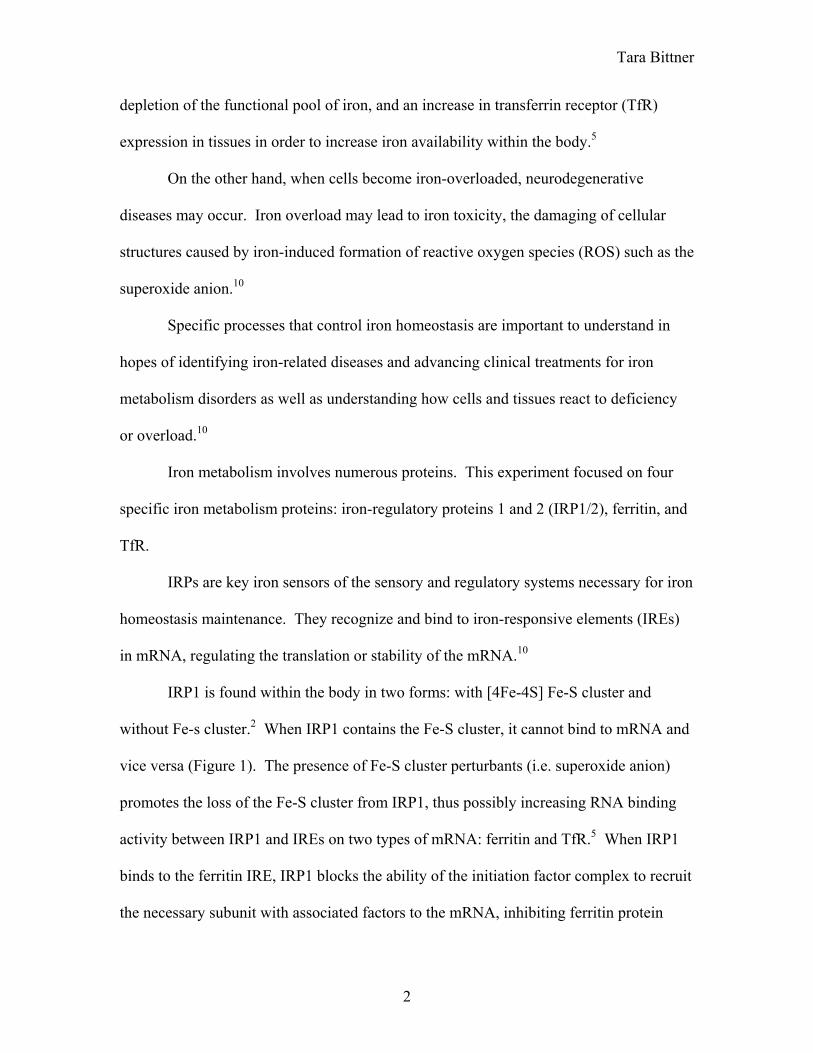
ABSTRACT
Iron is an important micronutrient that is necessary for multiple cellular functions. However, iron levels must be tightly regulated in order to prevent iron-deficiency and iron-toxicity. There are many proteins involved in iron metabolism. This study focuses on iron-regulatory proteins 1 and 2 (IRP1/2), ferritin, and transferrin receptor protein (TfR). IRPs are key iron sensors that bind to iron response elements (IREs) located on mRNA when the IRP Fe-S clusters are removed, regulating translation or stability of mRNA. Ferritin is the storage form of iron. Ferritin levels must increase in iron-sufficient or overloaded conditions to store the excess iron in a safe form. TfR takes up iron and moves it into a free iron pool for utilization by the body. TfR levels must increase in iron-deficient conditions to mobilize iron to necessary tissues. When IRP binds to a ferritin IRE, ferritin mRNA translation is inhibited causing ferritin protein levels to decrease. However, when IRP binds to TfR IRE, TfR mRNA is stabilized causing TfR protein levels to increase. Reactive oxygen species (ROS) such as the superoxide anion have been known to destabilize the Fe-S cluster in IRP, possibly leading to IRP degradation in high concentrations of ROS. Superoxide dismutase 1 (SOD1) reacts with the superoxide anion to yield safer complexes (hydrogen peroxide and water). I hypothesized that SOD1 knock-out (KO) mice would have increased non-heme liver iron and ferritin levels as well as decreased TfR and IRP1/2 levels due to the increased levels of superoxide anions removing the Fe-S clusters, decreasing IRP/IRE TfR and ferritin mRNA binding. My data supported my hypothesis. I used a non-heme liver assay, hematocrit measurements, and western blots to measure the levels of non-heme liver iron and protein levels in KO and WT male mice (C57BL/6J background) at ages 8 weeks, 2.5-3 months, 4 months, 6 months, and 12 months. INTRODUCTION
Iron is a required micronutrient obtained through the diet. It is a necessary part of
proteins that perform redox or non-redox functions in important cellular systems such as
respiration and cell division. To achieve optimal health, iron concentrations and
distribution must be tightly managed to ensure cellular requirements are met while levels
do not become toxic. 10
When cells become iron-deficient, multiple symptoms may arise such as anemia;
impaired muscle, immune, and cognitive function; low birth weight babies; and preterm
deliveries. 10 Tissue-specific responses include a sudden decrease in liver iron stores, a
1
Tara Bittner
depletion of the functional pool of iron, and an increase in transferrin receptor (TfR)
expression in tissues in order to increase iron availability within the body.5
On the other hand, when cells become iron-overloaded, neurodegenerative
diseases may occur. Iron overload may lead to iron toxicity, the damaging of cellular
structures caused by iron-induced formation of reactive oxygen species (ROS) such as the
superoxide anion.10
Specific processes that control iron homeostasis are important to understand in
hopes of identifying iron-related diseases and advancing clinical treatments for iron
metabolism disorders as well as understanding how cells and tissues react to deficiency
or overload.10
Iron metabolism involves numerous proteins. This experiment focused on four
specific iron metabolism proteins: iron-regulatory proteins 1 and 2 (IRP1/2), ferritin, and
TfR.
IRPs are key iron sensors of the sensory and regulatory systems necessary for iron
homeostasis maintenance. They recognize and bind to iron-responsive elements (IREs)
in mRNA, regulating the translation or stability of the mRNA.10
IRP1 is found within the body in two forms: with [4Fe-4S] Fe-S cluster and
without Fe-s cluster.2 When IRP1 contains the Fe-S cluster, it cannot bind to mRNA and
vice versa (Figure 1). The presence of Fe-S cluster perturbants (i.e. superoxide anion)
promotes the loss of the Fe-S cluster from IRP1, thus possibly increasing RNA binding
activity between IRP1 and IREs on two types of mRNA: ferritin and TfR.5 When IRP1
binds to the ferritin IRE, IRP1 blocks the ability of the initiation factor complex to recruit
the necessary subunit with associated factors to the mRNA, inhibiting ferritin protein
2
Tara Bittner
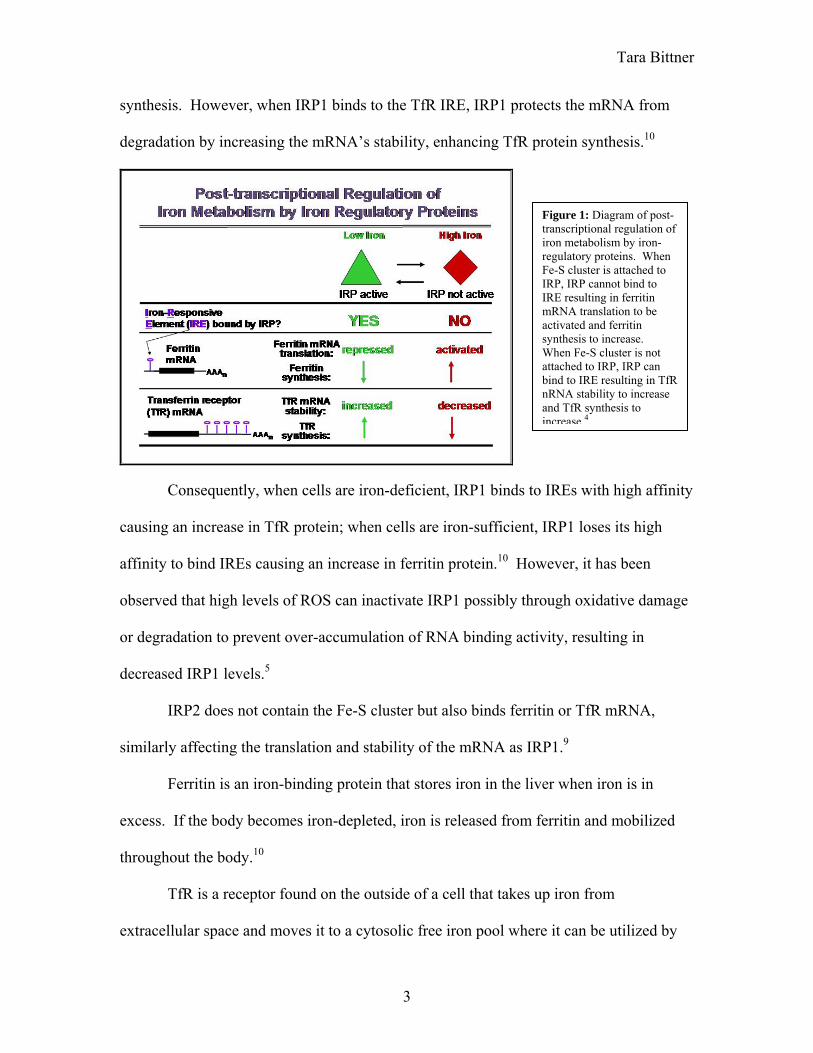
synthesis. However, when IRP1 binds to the TfR IRE, IRP1 protects the mRNA from
degradation by increasing the mRNA’s stability, enhancing TfR protein synthesis.10
Figure 1: Diagram of post-transcriptional regulation of iron metabolism by iron-regulatory proteins. When Fe-S cluster is attached to IRP, IRP cannot bind to IRE resulting in ferritin mRNA translation to be activated and ferritin synthesis to increase. When Fe-S cluster is not attached to IRP, IRP can bind to IRE resulting in TfR nRNA stability to increase and TfR synthesis to increase.4
Consequently, when cells are iron-deficient, IRP1 binds to IREs with high affinity
causing an increase in TfR protein; when cells are iron-sufficient, IRP1 loses its high
affinity to bind IREs causing an increase in ferritin protein.10 However, it has been
observed that high levels of ROS can inactivate IRP1 possibly through oxidative damage
or degradation to prevent over-accumulation of RNA binding activity, resulting in
decreased IRP1 levels.5
IRP2 does not contain the Fe-S cluster but also binds ferritin or TfR mRNA,
similarly affecting the translation and stability of the mRNA as IRP1.9
Ferritin is an iron-binding protein that stores iron in the liver when iron is in
excess. If the body becomes iron-depleted, iron is released from ferritin and mobilized
throughout the body.10
TfR is a receptor found on the outside of a cell that takes up iron from
extracellular space and moves it to a cytosolic free iron pool where it can be utilized by
3
Tara Bittner
the body when iron is needed. The iron that is not utilized is stored as ferritin or exported
by another iron metabolism protein, ferroportin. Transferrin-mediated iron uptake is the
primary way most cells take up non-heme iron.10
Superoxide dismutase enzyme 1 (SOD1, CuZnSOD) reacts with ROS like
superoxide anion to produce peroxide and water. SOD1 deficiency promotes oxidative
damage and increased sensitivity to oxidative stress. SOD1 transgenic and mutant mice
have been commonly used to study the role of ROS in a variety of experiments.6
I hypothesized that increased levels of superoxide anions in SOD1 knock-out
(KO) mice due to the lack of the SOD1 gene would increase the removal of the Fe-S
cluster in IRP1, increasing IRP1 instability/degradation and decreasing IRP1/IRE mRNA
binding. I further hypothesized that this change in binding would cause an increase in
non-heme liver iron and ferritin levels due to an increased need to store the excess iron, a
decrease in TfR levels due to decreased TfR mRNA stability and IRP1 levels due to high
levels of IRP1 without Fe-S cluster increasing IRP1 degradation, and no change in IRP2
levels. I studied SOD1 KO and wild-type (WT) male mice (C57BL/6J background) at
ages 8 weeks, 2.5-3 months, 4 months, 6 months, and 12 months to observe the effects
that increased levels of superoxide anions have on non-heme liver iron content, blood
composition, and iron metabolism protein levels as measured by a non-heme liver assay,
hematocrit measurements, and western blots, respectively.
METHODS
Mouse Colonies
I used two different colonies of SOD1 KO and WT mice: a University of
California- San Francisco (UCSF) colony6 and a St. Louis colony7. Both colonies were
4
Tara Bittner
initially compared for genotype ratios, but only the St. Louis colony was used for all
further experimentation and analysis.
DNA Digestion Protocol6, 8
To digest the mouse ear sample for DNA extraction, a DNA digestion protocol
was followed. The DNA extraction buffer was composed of 50 mM Tris pH 8.0, 20 mM
NaCl, 1 mM EDTA, and 1% SDS. The Proteinase K stock solution had a concentration
of 20mg/mL in DepC H2O. To make the digestion solution, 20 parts DNA extraction
buffer was added to 1 part Proteinase K stock solution. 20 µL of the digestion solution
was added to each labeled microcentrifuge tube containing each mouse ear sample. Each
tube was incubated in a H2O bath for 15 minutes at 55-60°C then vortexed briefly; this
step was repeated once more. Next, 180 µL of MQ H2O was added to each tube and
vortexed briefly. The tubes were finally boil in a H2O bath for 5 minutes then cooled for
1-2 minutes and vortexed briefly.
Polymerase Chain Reaction Protocol6
To increase the amount of DNA per mouse ear sample, a polymerase chain
reaction (PCR) protocol was followed. Solution 1 was composed of 4.4 µL MQ H2O, 2
µL Buffer, 2.5 µL MgCl2, and 2 µL each primer (328, 329, 330) per ear sample.
Solution 2 was composed of 1.6 µL dNTP, 0.2 µL Taq (Promega), and 3.2 µL MQ H2O
per ear sample. 14.9 µL solution 1 and 0.5 µL digested DNA mouse ear sample was
added to a 0.5 mL PCR tube. One drop of mineral oil was added to each tube as well as
to each well in the thermocycler. The thermocycler was set to the appropriate program of
heating and cooling and the tubes were placed into the wells before starting the
thermocycler. Once the program was started, 5 µL solution 2 was added to each tube
5
Tara Bittner
during the first 5 minutes. Once the program was finished, the samples were stored at a
constant 4ºC.
Gel Electrophoresis Protocol1, 6
To determine the genotypes of each mouse ear sample after the PCR, a gel
electrophoresis protocol was followed. The 20x SB buffer was composed of 8 g.
NaOH/800 mL H2O at a pH of 8.0 by adding solid boric acid. The 1x SB buffer was
composed of 50 mL 20x SB buffer/1000 mL final volume. The 1x SB agarose gel was
composed of 0.72 g. agarose/60 mL 1x SB buffer. The 1x SB agarose gel mixture was
microwaved for 1.5-2 minutes until clear and let cool to the touch. 2 µL EtBr stock
solution was added and mixed thoroughly. The gel mixture was then poured into a
casting tray and the well comb was inserted. The comb was removed after the gel
solidified; the gel was placed into the electrophoresis apparatus and covered with 1x SB.
15 µL thermocycled DNA sample was combined with 1.5 µL 6x sample buffer then
vortexed. 16.5 µL DNA sol’n was loaded to each well using loading tips; 5 µL molecular
weight marker (2 kb log ladder) was loaded into own well. The gel was run at a constant
200-225 V until the dye reached the middle of the gel. The gel was visualized under a
UV box; pictures of the gel results were taken via computer.
Surgery Protocol
In order to obtain mouse liver samples, a surgery protocol was followed. Each
mouse weight was measured and recorded. Each mouse was anesthetized using
isofluorene. After the liver was removed and blood was drawn for hematocrit
measurements, the diaphragm was perforated to ensure mouse death. Each liver was
6

Tara Bittner
weighed. A liver sample of ~0.1 g. was obtained and both the sample and remaining
liver were immediately stored in liquid Nitrogen.
Non-Heme Liver Assay Protocol3
To measure the non-heme liver content of each mouse, a non-heme liver assay
protocol was followed. The Chromagen stock was composed of 50 mg
bathophenanthrolinedisulfuric acid, 0.7145 mL 70% thiglycolic acid, and MQ H2O (final
volume of 50 mL). The acid solution was composed of 12.4 mL 12.1 M HCl, 5 mL
100% TCA, and MQ H2O (final volume of 50 mL). The 1:1 saturated NaAc: H2O
solution was composed of 18.8 g. NaAc and MQ H2O (final volume of 50 mL). 0.5 mL
acid sol’n was added to each liver sample then vortexed and incubated in H2O bath at
65°C for 24-72 hours. The samples were cooled and brought up to 0.75 mL with acid
solution then spun for 5 minutes. 50 µL sample supernatant was added to designated
epindorff tube for spectrophotometry measurements. Iron standards were composed of
the following:
1- 50 µL MQ H2O 2- 50 µL acid sol’n 3- 50 µL 50 µg/dL Fe standard + 50 µL acid sol’n 4- 50 µL 200 µg/dL Fe standard + 50 µL acid sol’n 5- 50 µL 500 µg/dL Fe standard + 50 µL acid sol’n 6- 50 µL 500 µg/dL Fe standard + 50 µL acid sol’n 7- 50 µL 500 µg/dL Fe standard + 50 µL acid sol’n 8- 50 µL 1000 µg/dL Fe standard + 50 µL acid sol’n A working chromagen reagent (WCR) was composed of 1 part chromagen stock + 10
parts 1:1 saturated NaAc:MQ H2O solution. 1 mL WCR was added to each epindorff
tube then vortexed briefly and let sit for 10 minutes. Absorbances were measured at 535
7
Tara Bittner
nm (visible light); the blank was the H2O standard. Liver tissue iron (µg/g wet weight
tissue) was calculated using the following equation:
[(At-Ab) x Fes x 0.75 x (1+Ve)]/[(As-Ab) x W x Ve x 1.1] At= absorbance of test sample Ab= absorbance of blank As= absorbance of standard 500 (average of 5-7) Fes= µg iron present in standard (0.2492) W= weight of tissue dissolved (g) Ve= volume of acid tissue extract used for calorimetric analysis in mL (0.05) Homogenization Protocol2
To prepare the mouse liver samples for western blot analysis, a homogenization
protocol was followed. The homogenization buffer was composed of 40 µL 1M citrate,
20 µL DTT, 20 µL PMSF, 80 µL each protease (SBT1, Pep), 10 mL 2x buffer, and MQ
H2O (final volume of 20mL). The liver samples were minced with a scissors.
Homogenization buffer was added to each sample tube (1:3 sample:buffer) then vortexed
well. Homogenate + buffer mixture was homogenized with mortar and pestle and put
into separate tubes for storage. The leftover homogenate + buffer mixture was
centrifuged in Optima (TLA 55) at 45,000 rpm for 30 minutes at 4ºC. The cytosol was
removed after centrifugation and stored at 4ºC.
BCA Protocol (Pierce BCA Protein Assay Kit #23225)
To determine the protein concentration in the homogenate and cytosol, a BCA
protocol was followed. The 1x lysis buffer was composed of 2x HG buffer diluted with
MQ H2O. The BCA reagent was composed of 49 parts solution A and 1 part solution B.
10 µL of the cytosol sample was added to 40 µL 1x lysis buffer and vortexed; 5 µL of the
homogenate sample was added to 45 µL 1x lysis buffer and vortexed. 5 µL of either
cytosol or homogenate dilution was then added to 45 µL H2O. 1 mL BCA reagent was
8
Tara Bittner
added to each sample. Samples were incubated for 30 minutes in H2O bath at 37ºC.
Spectrophotometry absorbances were measured at 562 nm (blank was H2O) and used to
determine amount of each sample necessary for final concentration of 2mg/mL.
Western Blot Protocol2
To determine the IRP1/2, ferritin, and TfR protein levels for each mouse liver
sample, a western blot protocol was followed. The 12% resolving gel was composed of
MQ H2O, 30% acrylamide mix, 1.5 M Tris (pH 8.8), 10% SDS, 10% ammonium
persulfate, and TEMED, while the 5% stacking gel was composed of MQ H2O, 30%
acrylamide mix, 1.0 M Tris (pH 6.8), 10% SDS, 10% ammonium persulfate, and
TEMED. H2O saturated butanol was added to 12% resolving gel before set and poured
out before adding 5% stacking gel. After adding 5% stacking gel, wells were set. Gels
were rinsed and placed into cassette, covered with SDS page buffer. Samples and MW
was loaded and run at constant current of 15 mA until reached bottom of gel. Proteins
were transferred to nitrocellulose overnight. Blots were blocked for 1 hour in non-fat dry
milk, Tween 20, and PBS or Tris glycine block buffer (depending on homogenate or
cytosol). Primary Abs (IRP1, IRP2, ferritin, TfR, or tubulin) were added to blots for 1
hour and washed with Tween 20 and PBS or Tris glycine solution. Secondary Abs (goat
α mouse or goat α rabbit) were added to blots for 30 minutes and washed again. Blots
were developed in dark room for 15-30 minutes. Bands were quantified using Optiquant
computer program.
RESULTS
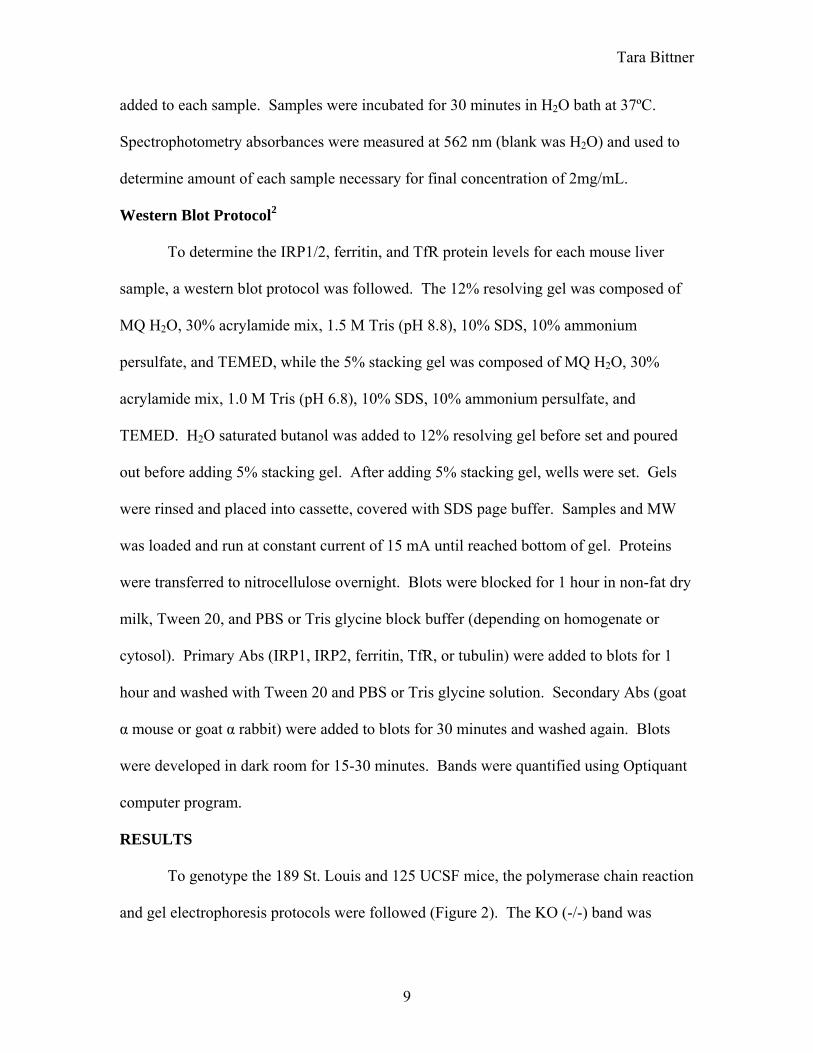
To genotype the 189 St. Louis and 125 UCSF mice, the polymerase chain reaction
and gel electrophoresis protocols were followed (Figure 2). The KO (-/-) band was
9
Tara Bittner
observed at 800kb, while the WT (+/+) band was observed at 1000kb. If both bands were
present in the same sample, the genotype was determined to be HET (+/-). The results of
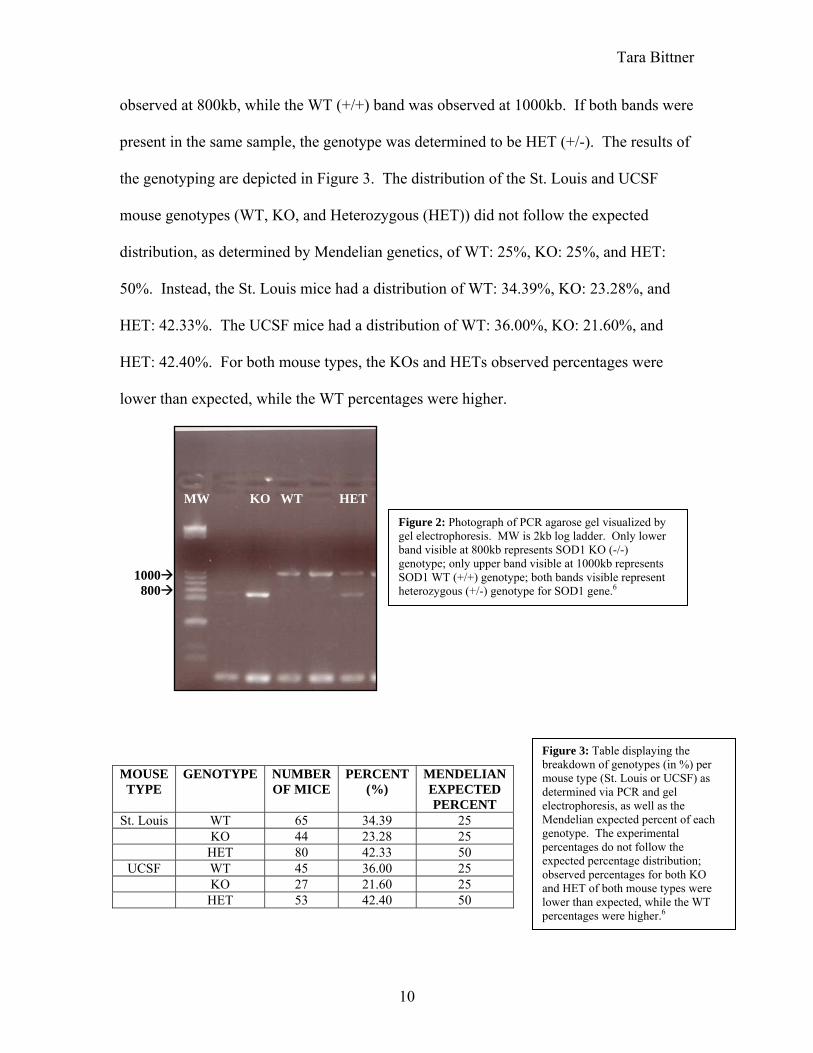
the genotyping are depicted in Figure 3. The distribution of the St. Louis and UCSF
mouse genotypes (WT, KO, and Heterozygous (HET)) did not follow the expected
distribution, as determined by Mendelian genetics, of WT: 25%, KO: 25%, and HET:
50%. Instead, the St. Louis mice had a distribution of WT: 34.39%, KO: 23.28%, and
HET: 42.33%. The UCSF mice had a distribution of WT: 36.00%, KO: 21.60%, and
HET: 42.40%. For both mouse types, the KOs and HETs observed percentages were
lower than expected, while the WT percentages were higher.
Figure 2: Photograph of PCR agarose gel visualized by gel electrophoresis. MW is 2kb log ladder. Only lower band visible at 800kb represents SOD1 KO (-/-) genotype; only upper band visible at 1000kb represents SOD1 WT (+/+) genotype; both bands visible represent heterozygous (+/-) genotype for SOD1 gene.6
MW KO WT HET 1000 800
Figure 3: Table displaying the
breakdown of genotypes (in %) per mouse type (St. Louis or UCSF) as determined via PCR and gel electrophoresis, as well as the Mendelian expected percent of each genotype. The experimental percentages do not follow the expected percentage distribution; observed percentages for both KO and HET of both mouse types were lower than expected, while the WT percentages were higher.6
MOUSE TYPE
GENOTYPE NUMBER OF MICE
PERCENT (%)
MENDELIANEXPECTED PERCENT
St. Louis WT 65 34.39 25 KO 44 23.28 25 HET 80 42.33 50
UCSF WT 45 36.00 25 KO 27 21.60 25 HET 53 42.40 50
10
Tara Bittner
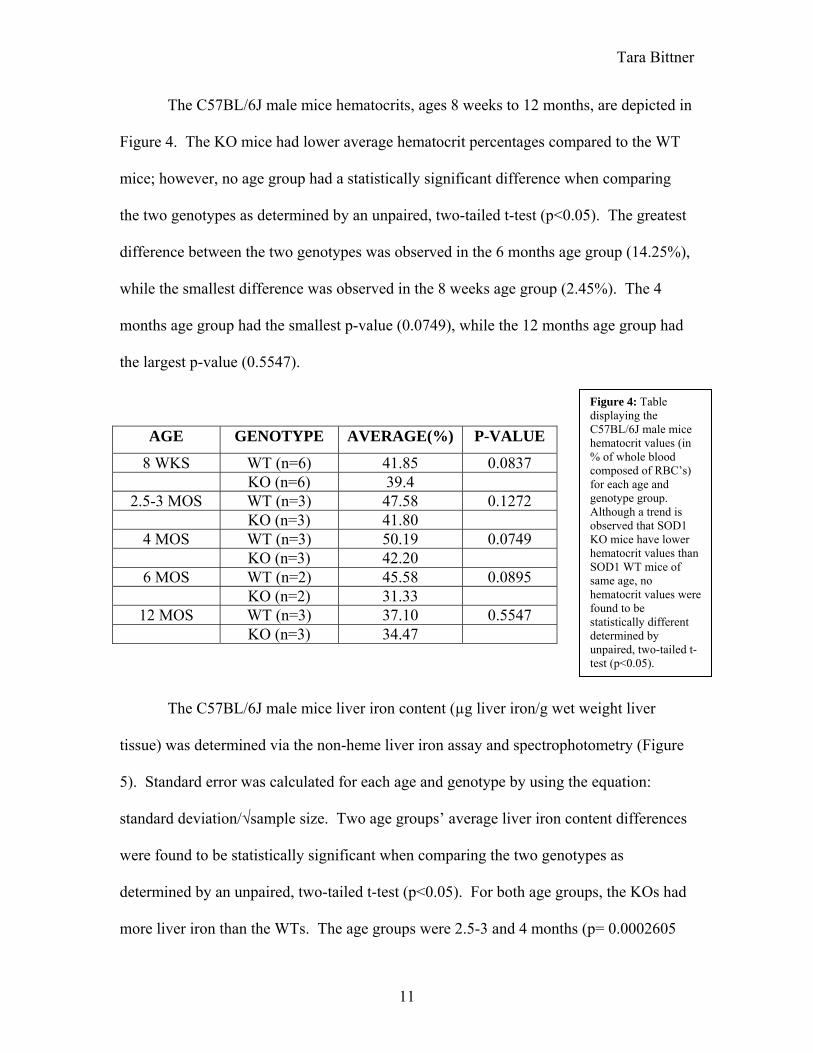
The C57BL/6J male mice hematocrits, ages 8 weeks to 12 months, are depicted in
Figure 4. The KO mice had lower average hematocrit percentages compared to the WT
mice; however, no age group had a statistically significant difference when comparing
the two genotypes as determined by an unpaired, two-tailed t-test (p<0.05). The greatest
difference between the two genotypes was observed in the 6 months age group (14.25%),
while the smallest difference was observed in the 8 weeks age group (2.45%). The 4
months age group had the smallest p-value (0.0749), while the 12 months age group had
the largest p-value (0.5547).
Figure 4: Table displaying the C57BL/6J male mice hematocrit values (in % of whole blood composed of RBC’s) for each age and genotype group. Although a trend is observed that SOD1 KO mice have lower hematocrit values than SOD1 WT mice of same age, no hematocrit values were found to be statistically different determined by unpaired, two-tailed t-test (p<0.05).
AGE GENOTYPE AVERAGE(%) P-VALUE
8 WKS WT (n=6) 41.85 0.0837 KO (n=6) 39.4
2.5-3 MOS WT (n=3) 47.58 0.1272 KO (n=3) 41.80
4 MOS WT (n=3) 50.19 0.0749 KO (n=3) 42.20
6 MOS WT (n=2) 45.58 0.0895 KO (n=2) 31.33
12 MOS WT (n=3) 37.10 0.5547 KO (n=3) 34.47
The C57BL/6J male mice liver iron content (µg liver iron/g wet weight liver
tissue) was determined via the non-heme liver iron assay and spectrophotometry (Figure
5). Standard error was calculated for each age and genotype by using the equation:
standard deviation/√sample size. Two age groups’ average liver iron content differences
were found to be statistically significant when comparing the two genotypes as
determined by an unpaired, two-tailed t-test (p<0.05). For both age groups, the KOs had
more liver iron than the WTs. The age groups were 2.5-3 and 4 months (p= 0.0002605
11

Tara Bittner
and 0.0004298, respectively). The 6 month age group average liver iron content
difference illustrated the same trend as the 2.5-3 and 4 month old mice; however, the p-
value was greater than 0.05 (p= 0.07511). The 8 week and 12 month age group average
liver iron content differences were not determined to be statistically significant when
comparing genotypes (p= 0.3165 and 0.4759, respectively). The average liver iron
contents for each age and genotype were as follows: 91.87, 105.05 (8 week WT, KO);
73.29, 136.36 (2.5-3 month WT, KO); 46.00, 96.64 (4 month WT, KO); 66.10, 113.32 (6
month WT, KO); 75.00, 95.17 (12 month WT, KO).
Age and Genotype versus Liver Fe content
0
20
40
60
80
100
120
140
160
Age and Genotype
Live
r Fe
cont
ent (
mcg
Fe/
g w
et w
eigh
t tis
sue)
2.5-3 MOS 4 MOS 6 MOS 12 MOS8 WKS
WT KO n=6 n=6
WT KO WT KO WT KO WT KOn=3 n=2 n=3 n=3 n=2 n=2 n=3 n=3
Figure 5: Histogram of C57BL/6J male mice grouped by age and genotype versus liver iron content (µg liver iron/g wet weight liver tissue) determined by the non-heme liver iron assay and spectrophotometry. Standard error bars calculated by using the equation: standard deviation/√sample size. Statistical significance between the two genotypes per age group was determined by unpaired, two-tailed t-test (p<0.05). WT versus KO average liver iron content differences were statistically significant for 2.5-3 and 4 month age groups (p= 0.0002605 and 0.0004298, respectively); KOs had more average liver iron than WTs. The 6 month age group average liver iron content difference illustrated the same trend; however, the p-value was greater than 0.05 (p= 0.07511). The 8 week and 12 month age group average liver iron content differences were not determined to be statistically significant when comparing genotypes (p= 0.3165 and 0.4759, respectively).
12
Tara Bittner
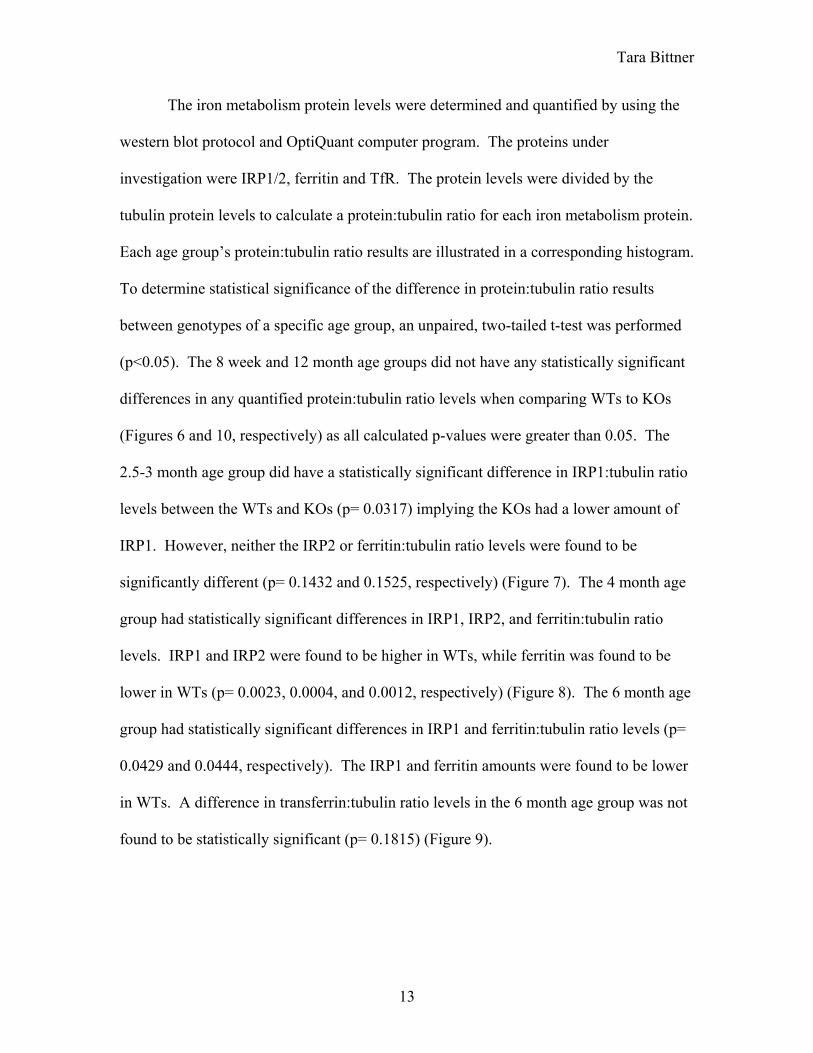
The iron metabolism protein levels were determined and quantified by using the
western blot protocol and OptiQuant computer program. The proteins under
investigation were IRP1/2, ferritin and TfR. The protein levels were divided by the
tubulin protein levels to calculate a protein:tubulin ratio for each iron metabolism protein.
Each age group’s protein:tubulin ratio results are illustrated in a corresponding histogram.
To determine statistical significance of the difference in protein:tubulin ratio results
between genotypes of a specific age group, an unpaired, two-tailed t-test was performed
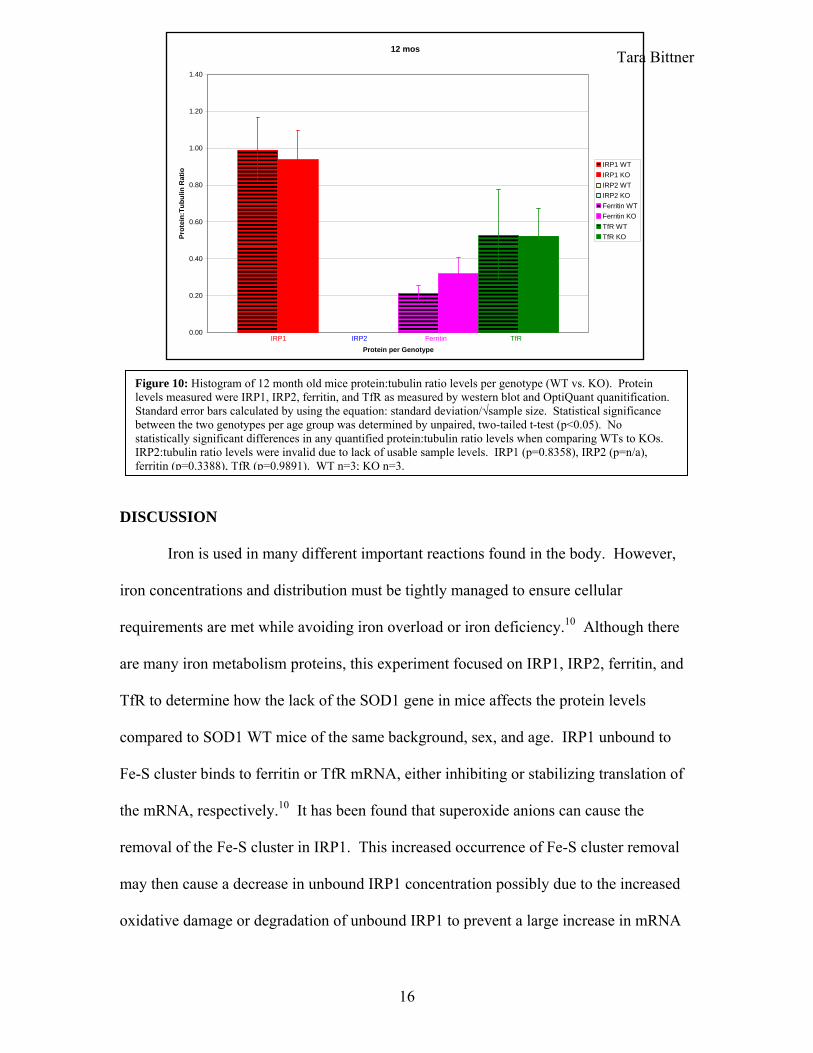
(p<0.05). The 8 week and 12 month age groups did not have any statistically significant
differences in any quantified protein:tubulin ratio levels when comparing WTs to KOs
(Figures 6 and 10, respectively) as all calculated p-values were greater than 0.05. The
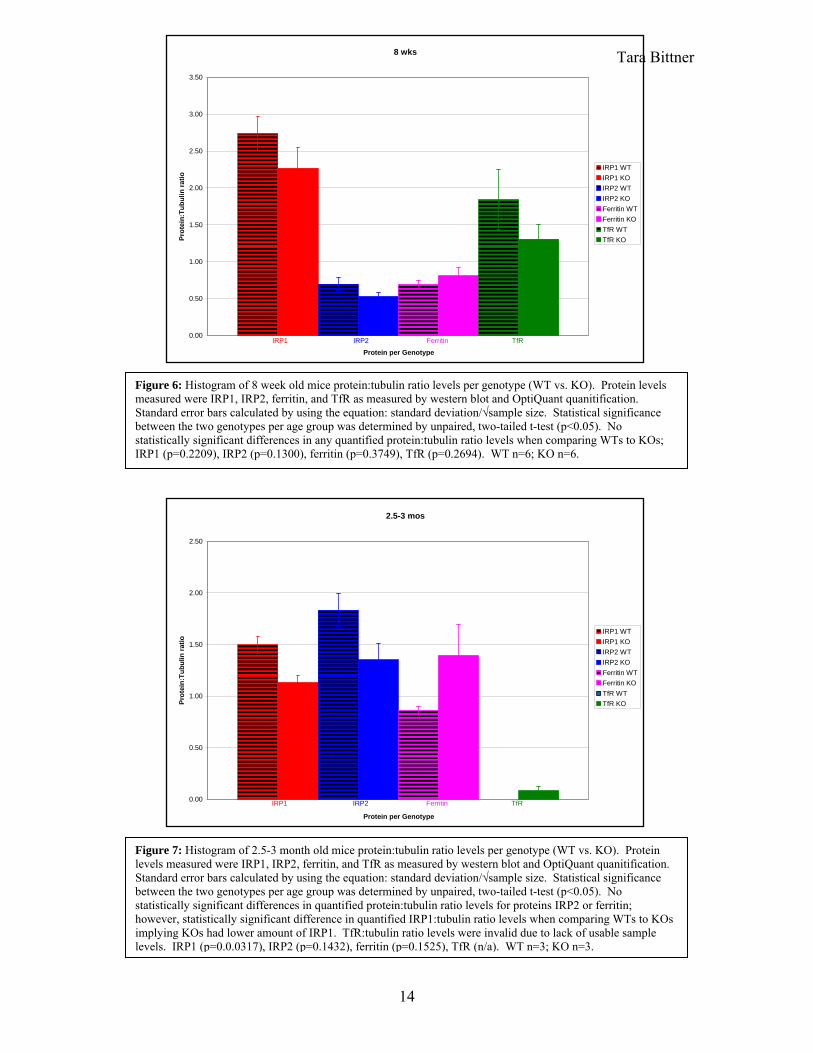
2.5-3 month age group did have a statistically significant difference in IRP1:tubulin ratio
levels between the WTs and KOs (p= 0.0317) implying the KOs had a lower amount of
IRP1. However, neither the IRP2 or ferritin:tubulin ratio levels were found to be
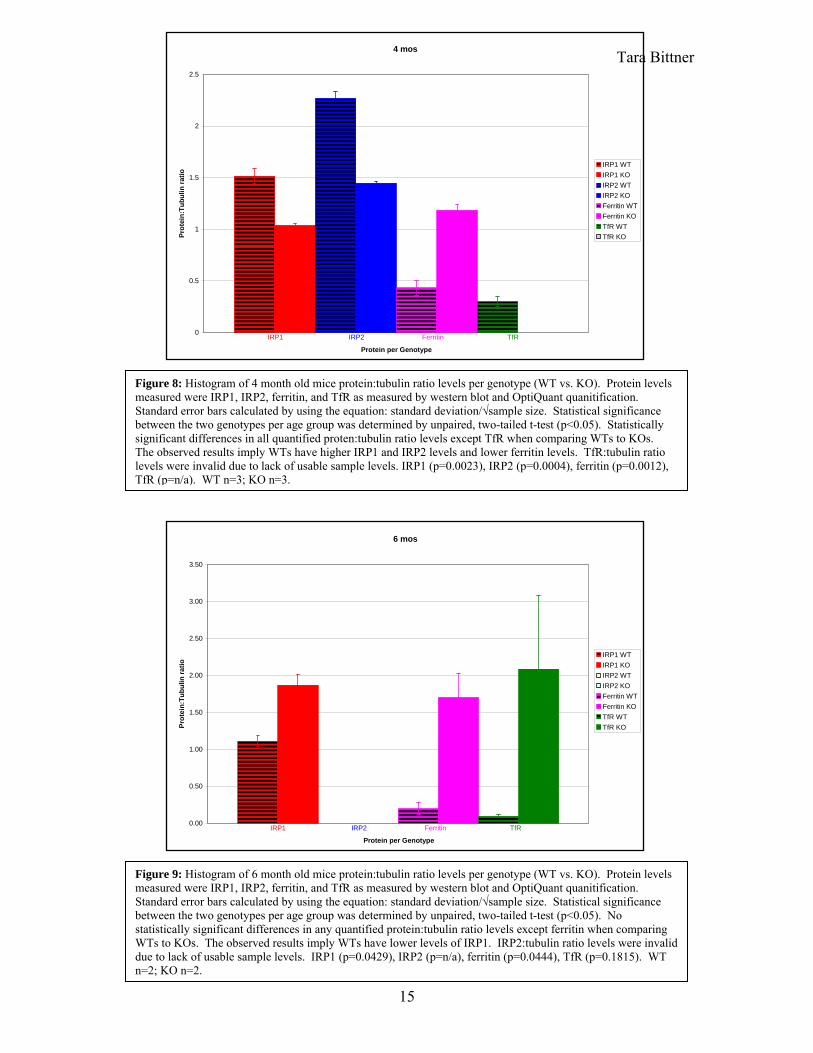
significantly different (p= 0.1432 and 0.1525, respectively) (Figure 7). The 4 month age
group had statistically significant differences in IRP1, IRP2, and ferritin:tubulin ratio
levels. IRP1 and IRP2 were found to be higher in WTs, while ferritin was found to be
lower in WTs (p= 0.0023, 0.0004, and 0.0012, respectively) (Figure 8). The 6 month age
group had statistically significant differences in IRP1 and ferritin:tubulin ratio levels (p=
0.0429 and 0.0444, respectively). The IRP1 and ferritin amounts were found to be lower
in WTs. A difference in transferrin:tubulin ratio levels in the 6 month age group was not
found to be statistically significant (p= 0.1815) (Figure 9).
13
Tara Bittner 8 wks
3.50
0.00
0.50
1.00
1.50
2.00
2.50
3.00
Protein per Genotype
Prot
ein:
Tubu
lin ra
tio
IRP1 WTIRP1 KOIRP2 WTIRP2 KOFerritin WTFerritin KOTfR WTTfR KO
IRP1 IRP2 Ferritin TfR
Figure 6: Histogram of 8 week old mice protein:tubulin ratio levels per genotype (WT vs. KO). Protein levels measured were IRP1, IRP2, ferritin, and TfR as measured by western blot and OptiQuant quanitification. Standard error bars calculated by using the equation: standard deviation/√sample size. Statistical significance between the two genotypes per age group was determined by unpaired, two-tailed t-test (p<0.05). No statistically significant differences in any quantified protein:tubulin ratio levels when comparing WTs to KOs; IRP1 (p=0.2209), IRP2 (p=0.1300), ferritin (p=0.3749), TfR (p=0.2694). WT n=6; KO n=6.
2.5-3 mos
0.00
0.50
1.00
1.50
2.00
2.50
Protein per Genotype
Prot
ein:
Tubu
lin ra
tio
IRP1 WTIRP1 KOIRP2 WTIRP2 KOFerritin WTFerritin KOTfR WTTfR KO
IRP1 IRP2 Ferritin TfR
Figure 7: Histogram of 2.5-3 month old mice protein:tubulin ratio levels per genotype (WT vs. KO). Protein levels measured were IRP1, IRP2, ferritin, and TfR as measured by western blot and OptiQuant quanitification. Standard error bars calculated by using the equation: standard deviation/√sample size. Statistical significance between the two genotypes per age group was determined by unpaired, two-tailed t-test (p<0.05). No statistically significant differences in quantified protein:tubulin ratio levels for proteins IRP2 or ferritin; however, statistically significant difference in quantified IRP1:tubulin ratio levels when comparing WTs to KOs implying KOs had lower amount of IRP1. TfR:tubulin ratio levels were invalid due to lack of usable sample levels. IRP1 (p=0.0.0317), IRP2 (p=0.1432), ferritin (p=0.1525), TfR (n/a). WT n=3; KO n=3.
14
Tara Bittner 4 mos
2.5
0
0.5
1
1.5
2
Figure 9: Histogram of 6 month old mice protein:tubulin ratio levels per genotype (WT vs. KO). Protein levels measured were IRP1, IRP2, ferritin, and TfR as measured by western blot and OptiQuant quanitification. Standard error bars calculated by using the equation: standard deviation/√sample size. Statistical significance between the two genotypes per age group was determined by unpaired, two-tailed t-test (p<0.05). No statistically significant differences in any quantified protein:tubulin ratio levels except ferritin when comparing WTs to KOs. The observed results imply WTs have lower levels of IRP1. IRP2:tubulin ratio levels were invalid due to lack of usable sample levels. IRP1 (p=0.0429), IRP2 (p=n/a), ferritin (p=0.0444), TfR (p=0.1815). WT n=2; KO n=2.
6 mos
0.00
0.50
1.00
1.50
2.00
2.50
3.00
3.50
Protein per Genotype
Prot
ein:
Tubu
lin ra
tio
IRP1 WTIRP1 KOIRP2 WTIRP2 KOFerritin WTFerritin KOTfR WTTfR KO
IRP2 Ferritin TfR IRP1
Figure 8: Histogram of 4 month old mice protein:tubulin ratio levels per genotype (WT vs. KO). Protein levels measured were IRP1, IRP2, ferritin, and TfR as measured by western blot and OptiQuant quanitification. Standard error bars calculated by using the equation: standard deviation/√sample size. Statistical significance between the two genotypes per age group was determined by unpaired, two-tailed t-test (p<0.05). Statistically significant differences in all quantified proten:tubulin ratio levels except TfR when comparing WTs to KOs. The observed results imply WTs have higher IRP1 and IRP2 levels and lower ferritin levels. TfR:tubulin ratio levels were invalid due to lack of usable sample levels. IRP1 (p=0.0023), IRP2 (p=0.0004), ferritin (p=0.0012), TfR (p=n/a). WT n=3; KO n=3.
Protein per Genotype
Prot
ein:
Tubu
lin ra
tio
IRP1 WTIRP1 KOIRP2 WTIRP2 KOFerritin WTFerritin KOTfR WTTfR KO
IRP1 IRP2 Ferritin TfR
15
Tara Bittner 12 mos
1.40
0.00
0.20
0.40
0.60
0.80
1.00
1.20
Protein per Genotype
Prot
ein:
Tubu
lin R
atio
IRP1 WTIRP1 KOIRP2 WTIRP2 KOFerritin WTFerritin KOTfR WTTfR KO
Figure 10: Histogram of 12 month old mice protein:tubulin ratio levels per genotype (WT vs. KO). Protein levels measured were IRP1, IRP2, ferritin, and TfR as measured by western blot and OptiQuant quanitification. Standard error bars calculated by using the equation: standard deviation/√sample size. Statistical significance between the two genotypes per age group was determined by unpaired, two-tailed t-test (p<0.05). No statistically significant differences in any quantified protein:tubulin ratio levels when comparing WTs to KOs. IRP2:tubulin ratio levels were invalid due to lack of usable sample levels. IRP1 (p=0.8358), IRP2 (p=n/a), ferritin (p=0.3388), TfR (p=0.9891). WT n=3; KO n=3.
IRP1 IRP2 Ferritin TfR
DISCUSSION Iron is used in many different important reactions found in the body. However,
iron concentrations and distribution must be tightly managed to ensure cellular
requirements are met while avoiding iron overload or iron deficiency.10 Although there
are many iron metabolism proteins, this experiment focused on IRP1, IRP2, ferritin, and
TfR to determine how the lack of the SOD1 gene in mice affects the protein levels
compared to SOD1 WT mice of the same background, sex, and age. IRP1 unbound to
Fe-S cluster binds to ferritin or TfR mRNA, either inhibiting or stabilizing translation of
the mRNA, respectively.10 It has been found that superoxide anions can cause the
removal of the Fe-S cluster in IRP1. This increased occurrence of Fe-S cluster removal
may then cause a decrease in unbound IRP1 concentration possibly due to the increased
oxidative damage or degradation of unbound IRP1 to prevent a large increase in mRNA
16

Tara Bittner
transcription.5 This decrease in IRP1 levels would result in less ferritin mRNA inhibition
as well as less TfR mRNA stabilization. Since SOD1 KO mice have higher levels of
superoxide anions due to lack of superoxide dismutase presence, I hypothesized SOD1
KO mice would have an increase in non-heme liver iron and ferritin levels due to an
increased need to store the excess iron, a decrease in TfR levels due to decreased TfR
mRNA stability and IRP1 levels due to high levels of IRP1 without Fe-S cluster
increasing IRP1 degradation, and no change in IRP2 levels. After performing the non-
heme liver assay, hematocrit measurements, and western blots, my hypothesis was found
to be supported by my experimental data.
The non-heme liver iron contents in SOD1 KO mice at ages 2.5-3 months and 4
months were statistically higher (p<0.05) when compared to the SOD1 WT mice of the
same ages (Figure 5). This trend was also observed in the 6 month old mice, but possibly
due to the low sample numbers, the difference was not statistically significant. The 8
week and 12 month old mice were not statistically different. It is possible the difference
between the two genotypes at 8 weeks was not seen because the mice were too young to
show iron metabolism differences. At 12 months, it had been previously observed that
SOD1 KO mice develop liver tumors which may have impacted the resulting non-heme
liver iron content.
There was no statistically significant difference (p<0.05) between the SOD1 KO
and SOD1 WT mice hematocrits within the same age group (Figure 4). However, a trend
was observed that the KO mice have lower hematocrit levels than the WT mice. The
lower percentages of red blood cells per whole blood seen in the KO mice may indicate
17

Tara Bittner
iron anemia possibly caused by iron sequestering of the liver as seen by increased levels
of non-heme liver iron.
The IRP1 protein levels were statistically lower in SOD1 KO mice at ages 2.5-3
and 4 months when compared to SOD1 WT mice of the same age (Figures 7, 8). There
was no statistically significant difference found in the 12 month or 8 week old mice;
however, the trend that KO mice have lower IRP1 levels was observed (Figures 6, 9).
Lower levels of IRP1 in SOD1 KO mice were hypothesized due to possible increased
degradation of IRP1 caused by increased levels of ROS removing Fe-S cluster from
IRP1.
The IRP2 protein level differences were not statistically significant in any age
group other than the 4 months. IRP2’s relationship with iron metabolism as affected in
SOD1 KO mice is not fully understood. Due to the observed decrease in IRP2 levels in 4
month SOD1 KOs compared to WTs, further experimentation should be conducted to
fully explain IRP2’s involvement and influence.
The ferritin protein levels were statistically higher in SOD1 KO mice at age 4
months (Figure 8). There was no statistically significant difference in ferritin protein
levels observed in the other age groups; however, the trend that KO mice have higher
ferritin levels was observed (Figures 6, 7, 9). Higher levels of ferritin in SOD1 KO mice
coincide with the lower levels of IRP1 causing less ferritin mRNA translation inhibition
as well as an increased need to store iron due to the increased non-heme liver iron in
KOs.
The TfR protein level differences were not statistically significant in any age
group; however, a trend was observed in each age group that SOD1 KO mice have lower
18
Tara Bittner
levels of liver TfR (Figures 6-9). Although the differences were not significant, the trend
that SOD1 KO mice have lower levels of TfR also coincides with the lower levels of
IRP1 causing less TfR mRNA stability, decreasing translation and TfR protein levels as
well as a lesser need for mobilization of iron due to an iron-sufficient status.
Consequently, the observed decreased levels of IRP1 and TfR support the theory
that a high amount of ROS like superoxide anion causes increased degradation of IRP1,
most likely due to superoxide and Fe-S cluster interaction, and resultantly decreased TfR
mRNA translation stability and protein levels. Also, the observed increased levels of
ferritin and non-heme liver iron content support the theory that when ROS are present,
IRP1 binding to IRE decreases, no longer inhibiting ferritin mRNA translation. This
increases the cells’ ability to store iron in such places as the liver, reflected in the
increased non-heme liver iron content in SOD1 KO mice as compared to SOD1 WT
mice.
The 6 month old data was not used because the sample number was too small, and
the western blot data was unreliable due to samples measured on different blots, greatly
decreasing the validity of the data.
Further experimentation is necessary with a larger number of samples to increase
the statistical difference between the two genotypes and the different age groups,
particularly 6 months. Also, experiments to determine if any other non-heme tissue iron
levels are affected by the absence of SOD1 should be explored, as well as how IRP2 and
TfR are affected by increased levels of superoxide anions over time.
ACKNOWLEDGEMENTS
I would like to thank Rick Eisenstein for the opportunity to be a part of his lab
19

Tara Bittner
research. I would also like to thank Sheila Eisenstein for her extensive guidance, help,
and patience over the past 2 ½ years of my undergraduate education. I am sincerely
grateful for all this lab experience has given me.
REFERENCES 1. Brody, J. R. & Kern, S. K. (2004). Sodium boric acid: a Tris-free, cooler conductive
medium for DNA electrophoresis. BioTechniques, 36, 214-216. 2. Clarke, S. L., Vasanthakumar, A., Anderson, S. A., Pondarre, C., Koh, C. M., Deck,
K. M., Pitula, J. S., Epstein, C. J., Fleming, M. D., & Eisenstein, R. S. (2006). Iron-responsive degradation of iron-regulatory protein 1 does not require the Fe-S cluster. The EMBO Journal, 25, 544-553.
3. Cook, J. D. (1980). Methods in Hematology, Iron, 105-108. 4. Eisenstein, R. S. (2000). Iron regulatory proteins and the molecular control of
mammalian iron metabolism. Annual Review of Nutrition, 20, 627-662. 5. Eisenstein, R. S. & Ross, K. L. (2003). Novel Roles for Iron Regulatory Proteins in
the Adaptive Response to Iron Deficiency. Journal of Nutrition, 133, 1510S- 1516S.
6. Elchuri, S., Oberley, T. D., Qi, W., Eisenstein, R. S., Roberts, L. J., Van Remmen, H., Epstein, C. J., & Huang, T. (2005). CuZnSOD deficiency leads to persistent and widespread oxidative damage and hepatocarcinogenesis later in life. Oncogene, 24, 367-380.
7. Ho, Y. S., Gargano, M., Cao, J., Bronson, R. T., Heimler, I., & Hutz, R. J. (1998). Reduced fertility in female mice lacking copper-zinc superoxide dismutase. The Journal of Biological Chemistry, 273:13, 7765-7769.
8. Sambrook, Fritsch & Maniatis. (1989). Extraction and Purification of RNA. Molecular Cloning: A Laboratory Manual, 7.3-7.5.
9. Starzynski, R. R., Lipinski, P., Drapier, J., Diet, A., Smuda, E., Bartlomiejczyk, T., Gralak, M. A., & Kruszewski, M. (2004). Down-regulation of iron regulatory protein 1 activities and expression in superoxide dismutase 1 knock-out mice is not associated with alterations in iron metabolism. The Journal of Biological Chemistry, 280:6, 4207-4212.
10. Wallander, M. L., Leibold, E. A., & Eisenstein, R. S. (2006). Molecular control of vertebrate iron homeostasis by iron regulatory proteins. Biochimica et Biophysica Acta, 1763, 668-689.
20