Embed Size (px)
Citation preview

This is a repository copy of Comparison of Multi-Criteria Decision-Making Methods for Equipment Selection.
White Rose Research Online URL for this paper:http://eprints.whiterose.ac.uk/91022/
Version: Accepted Version
Article:
Hodgett, RE (2016) Comparison of Multi-Criteria Decision-Making Methods for Equipment Selection. The International Journal of Advanced Manufacturing Technology, 85 (5-8). pp. 1145-1157. ISSN 0268-3768
https://doi.org/10.1007/s00170-015-7993-2
© Springer-Verlag London 2015. This is an author produced version of a paper published in The International Journal of Advanced Manufacturing Technology . The final publication is available at Springer via http://dx.doi.org/10.1007/s00170-015-7993-2. Uploaded in accordance with the publisher's self-archiving policy.
[email protected]://eprints.whiterose.ac.uk/
Reuse
Unless indicated otherwise, fulltext items are protected by copyright with all rights reserved. The copyright exception in section 29 of the Copyright, Designs and Patents Act 1988 allows the making of a single copy solely for the purpose of non-commercial research or private study within the limits of fair dealing. The publisher or other rights-holder may allow further reproduction and re-use of this version - refer to the White Rose Research Online record for this item. Where records identify the publisher as the copyright holder, users can verify any specific terms of use on the publisher’s website.
Takedown
If you consider content in White Rose Research Online to be in breach of UK law, please notify us by emailing [email protected] including the URL of the record and the reason for the withdrawal request.

Comparison of Multi-Criteria Decision-Making Methods for Equipment Selection
Richard Edgar Hodgett
The International Journal of Advanced Manufacturing Technology
The final publication is available at Springer via http://dx.doi.org/10.1007/s00170-015-7993-2
Leeds University Business School,
Maurice Keyworth Building,
The University of Leeds,
Leeds, LS2 9JT
E-mail: [email protected]
Phone: +44 (0) 113 343 0586
Abstract
Equipment selection is a complex task that requires the consideration of multiple criteria with
different measurement units. A number of decision-making methods have been proposed for
analysing equipment selection problems, each having their own distinctive advantages and
limitations. Despite the number of decision-making techniques available, few comparative
studies exist that evaluate two or more methods with a singular problem. This paper evaluates
three multi-attribute decision-making methods for an equipment selection problem in the
early stages of a chemical manufacturing process.
A software framework which incorporates Analytical Hierarchy Process (AHP), Multi-
Attribute Range Evaluations (MARE) and ELimination Et Choix Traduisant la REalité trois
(ELECTRE III) was developed and distributed to a technology manager at Fujifilm Imaging
Colorants Ltd (FFIC). The manager, within a team of nine people examined the same
decision problem using the three decision analysis methods. The results of the study are
examined in respect to assessing each methods ability to provide accurate representations of
the decision-makers’ preferences and the ability to comprehend the uncertainty present. The
decision-makers’ identified MARE as their preferred method, AHP was found to be
comparatively more time-consuming and showed the highest variation of results while
ELECTRE III was unable to provide a conclusive best result.
Keywords: Multi-Criteria Decision-Making, Analytical Hierarchy Process (AHP), Multi-Attribute Range Evaluations (MARE), ELECTRE III, Equipment Selection.

1. Introduction
Equipment selection is an important activity for effecitve product and process development.
Selecting the wrong equipment can be costly with respect to product quality, production time,
production rate and over/under use of resources. Chakraborty and Banik (2006) stated that
“selecting material handling equipment under constrained operating conditions is a
complicated task, due to many feasible alternatives and conflicting objectives”. They suggest
that an “effective and efficient multi-criteria decision making tool” should be used to address
equipment selection problems. However, despite the profiency of Multi-Criteria Decision-
Making (MCDM), there is a paucity of literature demonstrating industrial applications by
comparing different decision-making methods. The few comparitive studies of MCDM that
exist are mostly related to healthcare and housing such as the comparison of Analytical
Hierarchy Process (AHP) and Evidential Reasoning for selecting healthcare infrastructure
locations (Dehe & Bamford, 2015), the comparison of ELECTRE IV and Genetic Algorithms
for diagnosing Alzheimer’s disease (Brasil Filho, et al., 2009) and the comparison of the
weighted sum method, weighted product method, AHP, Technique for Order of Preference
by Similarity to Ideal Solution (TOPSIS) and Complex Proportional Assessment (COPRAS)
for sustainable housing affordability assessment (Mulliner, et al., 2015). The majority of
MCDM related literature on equipment selection focuses on assessing one particular
decision-making method with a singular problem (Safari, et al., 2013; Yilmaz & Dagdeviren,
2011). This is an issue as different methods can yield different results when applied to an
identical problem and thus it is important to examine the compatability of different methods
with a particular type of decision problem (Malczewski & Rinner, 2015).
This paper compares a newly developed multi-attribute evaluation method, Multi-Attribute
Range Evaluations (MARE), with the AHP and ELimination Et Choix Traduisant la REalité
trois (ELECTRE III) by means of a case study conducted by Fujifilm Imaging Colorants Ltd
(FFIC). The aim of the comparison is to evaluate the methods’ ability in terms of providing
meaningful results and in handling uncertainty for an industrial problem. The following
section discusses the salient features of MCDM methods with respect to the challenges of
equipment selection.
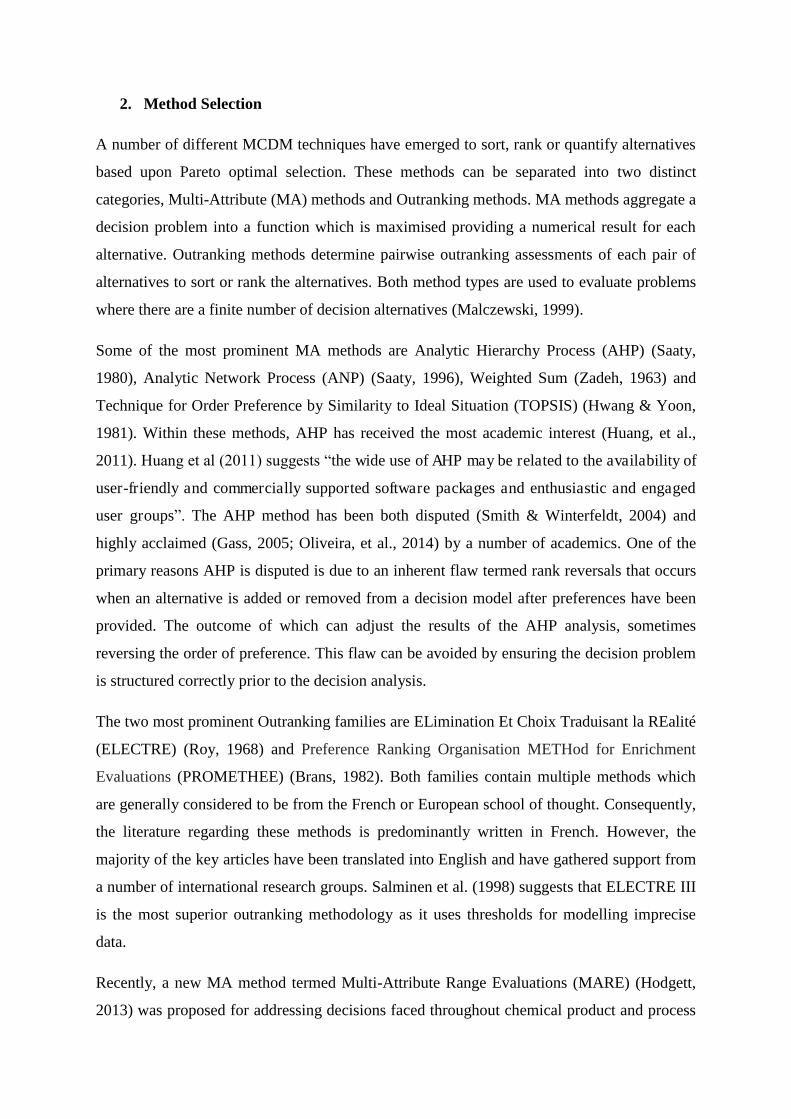
2. Method Selection
A number of different MCDM techniques have emerged to sort, rank or quantify alternatives
based upon Pareto optimal selection. These methods can be separated into two distinct
categories, Multi-Attribute (MA) methods and Outranking methods. MA methods aggregate a
decision problem into a function which is maximised providing a numerical result for each
alternative. Outranking methods determine pairwise outranking assessments of each pair of
alternatives to sort or rank the alternatives. Both method types are used to evaluate problems
where there are a finite number of decision alternatives (Malczewski, 1999).
Some of the most prominent MA methods are Analytic Hierarchy Process (AHP) (Saaty,
1980), Analytic Network Process (ANP) (Saaty, 1996), Weighted Sum (Zadeh, 1963) and
Technique for Order Preference by Similarity to Ideal Situation (TOPSIS) (Hwang & Yoon,
1981). Within these methods, AHP has received the most academic interest (Huang, et al.,
2011). Huang et al (2011) suggests “the wide use of AHP may be related to the availability of
user-friendly and commercially supported software packages and enthusiastic and engaged
user groups”. The AHP method has been both disputed (Smith & Winterfeldt, 2004) and
highly acclaimed (Gass, 2005; Oliveira, et al., 2014) by a number of academics. One of the
primary reasons AHP is disputed is due to an inherent flaw termed rank reversals that occurs
when an alternative is added or removed from a decision model after preferences have been
provided. The outcome of which can adjust the results of the AHP analysis, sometimes
reversing the order of preference. This flaw can be avoided by ensuring the decision problem
is structured correctly prior to the decision analysis.
The two most prominent Outranking families are ELimination Et Choix Traduisant la REalité
(ELECTRE) (Roy, 1968) and Preference Ranking Organisation METHod for Enrichment
Evaluations (PROMETHEE) (Brans, 1982). Both families contain multiple methods which
are generally considered to be from the French or European school of thought. Consequently,
the literature regarding these methods is predominantly written in French. However, the
majority of the key articles have been translated into English and have gathered support from
a number of international research groups. Salminen et al. (1998) suggests that ELECTRE III
is the most superior outranking methodology as it uses thresholds for modelling imprecise
data.
Recently, a new MA method termed Multi-Attribute Range Evaluations (MARE) (Hodgett,
2013) was proposed for addressing decisions faced throughout chemical product and process

development. The method “utilises a global sensitivity analysis to account for uncertian
selections” (Hodgett, 2013) as Stewart (2005) proposed that a sensitivity analysis is a
straightforward technique for addressing uncertainty. He stated that fuzzy based approches,
which are increasingly being used with MCDM methods (Kahraman, et al., 2015; Farsi, et al.,
2012; Khandekar & Chakraborty, 2015), overcomplicate the the already complicated
decision-making process.
Although a case study utilising MARE was discussed by (Hodgett, et al., 2014) no
comparison was made against other prominent MCDM methods. Therefore, AHP and
ELECTRE III were chosen to benchmark the efficiency of each methods’ ability to provide
meaningful results and in handling uncertainty. Recognising and understanding uncertainty is
a major challenge in equipment selection, particularly at the beginning of product
development as there will be an absence of data and knowledge regarding the product and
process. The following section introduces the ChemDecide framework which was used to
evaluate the three MCDM methods.
3. ChemDecide Framework
The ChemDecide framework consists of four software tools, one related to problem
structuring and the other three are associated with the analysis (Figure 1). The problem
structuring tool is termed Decision Setup while the analysis tools are known by their
respective methodological names, AHP, MARE and ELECTRE III. The rationale for
developing an independent problem structuring tool was a consequence of the following:
Problem structuring is often overlooked in a decision-making process (Belton &
Stewart, 2010) and by having a separate tool to guide the user through this phase
forces them to consider their selections in a detailed yet structured manor.
AHP suffers from rank reversals. Prohibiting the user from adding or removing
alternatives and criteria from the decision model ensures rank reversals cannot occur.
Separating the problem structuring phase from the decision-making procedure will
ensure the decision problem remains consistent throughout all three analyses. Hence,
comparative results will be attained from the industrial evaluations and the
conclusions drawn.

Goal
Stakeholders
CriteriaQualitative / QuantitativeMinimising / Maximising
Alternatives
Criteria Weights
Decision Setup
Decision Variables
AHP
MARE
ELECTRE III
Sensitivity Analysis
Decision Model
Decision Report
Figure 1 ChemDecide framework
As shown in Figure 1, the problem structuring tool requires the decision-maker(s) to define a
goal, a set of alternatives and a defined set of criteria (including if each criterion is
qualitative/quantitative and minimising/maximising). Decision Setup compiles this
information into a single file which can be accessed by any of the three analysis tools. The
analysis tools, which calculate a decision result, require the decision-maker(s) to input criteria
weights and decision variables along with the rationale for each selection. These inputs can
be altered to investigate the sensitivity of the results. Once a decision outcome is accepted,
the analysis tools can compile all of the decision information into a single file or generate a
report containing the results.
The goal of Decision Setup is to guide the user through the selection and verification of a
feasible set of alternatives and criteria. The whole process should be sufficiently flexible to
allow for changes as the decision-maker becomes more immersed in the problem. Figure 2
provides a flow diagram of the process utilised in Decision Setup and the iterative procedure
that is built-in to ensure that the decision-maker identifies appropriate criteria and alternative
sets.

Start
Define Problem
1. Identify Decision Goal.2. Identify Team.3. Set Decision Deadline.
Is information available for each
alternative with respect to each criterion?
Brainstorm Objectives
Identify views and objectives of decision-maker(s) and stakeholders.
Set Alternatives
Identify the possible solutions (alternatives) for the decision problem.
Set Criterion
Using the brainstormed objectives, set:1. Criterion Name.2. Quantitative/Qualitative.3. Aim: Min/Max.
Are all Alternatives Identified?
YES
NO
Are all Criteria Identified?
NO
Define Criteria
1. Describe each criterion.2. Identify criterion need.3. Describe criterion source.
YES
YES
Update
Remove unwanted criteria or alternatives.
NO
Create Decision File
Formulate and export data in a single file.
EndIdentify Intuition
Define gut feeling.
Figure 2 Decision Setup Logical Overview
Firstly, the decision-maker must identify the decision goal, record the team membership and
schedule a deadline for the completion of the analysis. The decision-makers can then
brainstorm whist considering external stakeholders to attain a perspective of the views and
objectives of the decision problem. Although this information is not used directly in the
analysis, the procedure focuses the users thought process on the problem and potentially
associated issues. The next stage is to determine the decision alternatives followed by their
related criteria. To aid in the selection of the criteria, the values and objectives discussed
during the brainstorming section can be reviewed. Along with a criterion name, the decision-
maker must identify if it is qualitative or quantitative (criteria source) and whether it is to be
minimising or maximising (aim). The team can then define the criteria in more detail by
recording a description of why each criterion is essential and provide a data source. This
information is useful if the decision-maker wants to return to the decision analysis in the

future or generate an analysis report. This feature of the framework adds value in terms of
explicit reasoning, improved organisational learning and corporate memory for future use.
The final task of Decision Setup, which is critical to the analysis, requires the team to review
the criteria and alternatives to ensure that it is possible to represent each decision variable by
a numerical value or a subjective score. If the team cannot source representation, the
decision-maker can return to a previous part of the procedure to update the criteria and
alternative sets as shown in Figure 2. If the review is successful, the team can identify an
alternative to represent their intuition (gut feeling) and complete the decision structuring
process.
The AHP module guides the decision-maker through the Analytical Hierarchy Process
(Saaty, 1972, 1980). The workflow for this process is given in Figure 3. The decision-maker
uses a file created in Decision Setup which generates the interface for pairwise comparisons
of the criterion. The user’s pairwise preferences are collected into a reciprocal matrix which
is used to calculate the principle eigenvectors that represent the criteria weights. A
consistency check is carried out to ensure the decision-maker has not violated transitivity.
The method for calculating the principle eigenvectors and for checking transitivity was
explained by Saaty (1980).
After the criteria weights are established, the decision-maker needs to pairwise compare each
of the alternatives in respect to each of the criteria. Pairwise comparisons are collected for the
qualitative criteria and numerical scores are provided for the quantitative criteria. The final
scores are calculated and the results are shown along with an analysis chart that presents the
decision variables on a spider diagram. The user can conduct a sensitivity analysis by

Start
Open Decision File
Use decision file to populate the tools interface.
Define Criteria Weights
Complete pairwise comparisons of criteria importance. Provide rationality for selections.
Form Criteria Matrix
Display Pie Chart
Calculate eigenvectors of criteria matrix.Use these values to make a pie chart of criteria weights.
Are the criteria weights accurate?
12 1
12 2
1 2
1
1/ 1
1/ 1/ 1
n
n
n n
w w
w w
w w
Consistency Check
Use:
Define consistency ratio using CR = CI / CV CV values found in Table 4-1
max( ) / ( 1)CI n n where け are the eiganvalues of the
criteria matrix
NO
Define Decision Variables
For Each Criterion:
if Qualitative CriterionComplete pairwise comparisons of alternative importance in respect to criterion.Provide rationality for selections.
if Quantitative CriterionDefine quantitative source and units. For each alternative define a quantitative value.
YES
Normalise Quantitative Variables
Qua
ntita
tive
1
ijij n
jj
qa
q
where qj is the quantitative
value for each alternative for
attribute Cj (j=1,2,…,n).
Form Alternative Matrices
For each qualitative criterion:
12 1
12 2
1 2
1
1/ 1
1/ 1/ 1
m
m
m m
p p
p p
p p
Q
ualit
ativ
e
Where pmm is the qualitative preference of each
alternative against each alternative.
Display Results Chart
Output bar chart showing the calculated scores.
Display Analysis Chart
Output a spider chart showing each of the criterion scores against each alternative.
Generate Report
Save output in the form of a PDF or Word Document.
Create Decision File
Formulate and export data in a single file.
End
Consistency Checks
Use:
Define consistency ratio using: CR = CI / CV CV values found in Table 4-1
max( ) / ( 1)CI n n where け are the eiganvalues of
the criteria matrix
Calculate Scores
Using:
Calculate alternative scores for min, likely and max.
1
n
i j ijj
A w a
Are the decision variables accurate?
NO
YES
Figure 3 AHP Logical Overview

modifying the criteria weights and/or decision variables. On completion, a report can be
generated or a decision file containing all the decision-makers’ preferences can be exported.
Start
Open Decision File
Use decision file to populate the tools interface.
Define Criteria Weights
Define the importance of each criterion using Slider Bars. Provide rationality for selections.
Normalise Weights
1
jj n
jj
bw
b
Where bj are the values from the
slider bars.
Display Pie Chart
Display percentage pie chart of the normalised weights. Are the criteria
weights accurate?
NODefine Decision Variables
For Each Criterion:
if Qualitative CriterionFor each alternative:If certain: Use SliderBar to select most likely value.If uncertain: User SliderRangeBar to select minimum, most likely and maximum.Provide rationality for selections.
if Quantitative CriterionDefine quantitative source and units. For each alternative:1. Define most likely value2. If uncertain: a. Define minimum value. b. Define maximum value.
YES
Normalise Variables
m a x
i ji j
j
aa
a
Calculate Scores
Using:
Calculate alternative scores for min, likely and max.
1
n
i j ijj
A w a
for i = 1,2,…,m.
Display Results Chart
Output chart with minimum, most likely and maximum for each alternative.
Display Analysis Chart
Output a spider chart showing the most likely decision variables.
Generate Report
Save output in the form of a PDF or Word Document.
Create Decision File
Formulate and export data in a single file.
End
Are the decision variables accurate?
NO
YES
Figure 4 MARE Logical Overview
The MARE module guides the decision-maker through Multi-Attribute Range Evaluations
(Hodgett, 2013) as shown in Figure 4. Initially, the decision-maker must define the criteria
weights using a slider bar for each criterion. These weights are normalised and displayed on a
pie chart. The decision-maker must then define the alternative scores in respect to each

Start
Open Decision File
Use decision file to populate the tools interface.
Define Criteria Weights
Define the importance of each criterion using Slider Bars. Provide rationality for selections.
Normalise Weights
1
jj n
jj
bw
b
where bj are the values from the
slider bars.
Display Pie Chart
Display percentage pie chart of the normalised weights.
Are the criteria weights accurate?
NODefine Decision Variables
For Each Criterion:
if Qualitative CriterionDefine threshold values using Threshold Selection Control.For each alternative:1. Define importance of each alternative in respect to the criterion.2. Provide rationality for selections.
if Quantitative CriterionDefine quantitative source and units. Define:Indifference (qj) Preference (pj)Veto (vj) thresholds. For each alternative define a quantitative value.
YES
Build Concordance Index
Build matrix using:
Build Discordance Index
Build matrix using:
1
1( , ) ( , )
n
j jj
C A B w c A Bw
1 ( ) ( )
( ( )) ( ) ( )( , ) { ( ) ( )
( ( )) ( ( ))
0 ( ) ( )
j j j
j j j jj j j j j
j j j j
j j j
if a B a A q
p a A a A a Bc A B if q a B a A p
p a A q a A
if a B a A p
1
1( , ) ( , )
n
j jj
D A B w d A Bw
0 ( ) ( )
( ) ( ( ) )( , ) { ( ) ( )
1 ( ) ( )
j j j
j j jj j j j j
j j
j j j
if a B a A p
a B a A pd A B if p a B a A v
v p
if a B a A v
Build Credibility Index
Build matrix using:( , ) ( , ) ( , )
( , ) { (1 ( , ))( , ) ( , )
(1 ( , ))
C A B if D A B C A B j
S A B D A BC A B j J A B else
C A B
where J(A,B) is the set of criteria for which (ܤ ,ܣ)ܦ > (ܤ ,ܣ)ܥ
Descending Distillation
Repeat until all alternatives have been classified in Z1:
1. Find maximum value of S(A,B):
2. Find そ:
3. For each alternative, find ゜-strength:
4. For each alternative, find ゜-Weakness
5. Determine qualification for each alternative (strength – weakness). 6. If only one alternative is highest:Classify alternative and remove from set.Else: repeat process, using ゜ as ゜max.
Are the decision variables accurate?
NO
Display Credibility
Output colour coded credibility matrix.
Display Ranking
Determine:Output ordinal ranking.
Generate Report
Save output in the form of a PDF or Word Document.
Create Decision File
Formulate and export data in a single file.
End
1 2Z Z Z
max max ( , )S A B
max max(0.3 0.15 )
( , )S A B
(1 (0.3 0.15 ))* ( , ) ( , )S AB S B A
Ascending Distillation
Repeat until all alternatives have been classified in Z2:
1. Find maximum value of S(A,B):
2. Find そ:
3. For each alternative, find ゜-strength:
4. For each alternative, find ゜-Weakness
5. Determine qualification for each alternative (strength – weakness). 6. If only one alternative is lowest:Classify alternative and remove from set.Else: repeat process, using ゜ as ゜max.
max max ( , )S A B
max max(0.3 0.15 )
( , )S A B
(1 (0.3 0.15 ))* ( , ) ( , )S AB S B A
YES
Figure 5 ELECTRE III Logical Overview

criterion. Slider bars with a single slider are used to input scores for certain selections and
slider bars with three sliders are used to input scores for uncertain selections, as demonstrated
by (Hodgett, et al., 2014). For decision variables with respect to quantitative criterion,
numerical values are required, one if certain and three if uncertain (minimum, most likely and
maximum). Final scores are calculated using the Weighted Sum Method (WSM) as shown in
Figure 4 and displayed to the user. At this stage, a sensitivity study can be conducted, a report
can be generated or a file containing the decision information can be saved.
The third analysis module guides the decision-maker through using ELECTRE III (Roy,
1978). The workflow for this is shown in Figure 5. Firstly, the decision-maker must define
the criteria weights. This is accomplished in an identical way to the MARE module by using
slider bars and a normalisation procedure. The decision-maker must then define decision
variables and threshold values. Three threshold values are required for each criterion:
indifference (qj), preference (pj) and veto (vj). Decision variables with respect to qualitative
criteria are input with slider bars and decision variables with respect to quantitative criteria
are input as numerical values. Similarly, threshold values in respect to qualitative criteria are
input with a slider bar with multiple sliders and threshold values in respect to quantitative
criteria are input as numerical values. The procedure explained by Roy (1978) is used to
calculate an ascending, a descending and final ranks. Similarly to AHP and MARE, the
ELECTRE III module allows for a sensitivity study to be conducted and for file/report
generation. A comparison of the three analysis tools is shown in Table 1.
The ChemDecide framework was developed using C# in Microsoft Visual Studio using .NET
Framework. This approach was adopted for the following reasons:
The ChemDecide framework can be installed and executed as a standalone software
without the requirement for external software packages, thereby encouraging
professionals from the chemical-using industries to evaluate the software.
The .NET framework provides a range of libraries for input/output controls and data
visualisation charts which could be incorporated into the ChemDecide graphical user
interface.
There are external libraries available on-line that have free licences for mathematical
and algorithmic support.
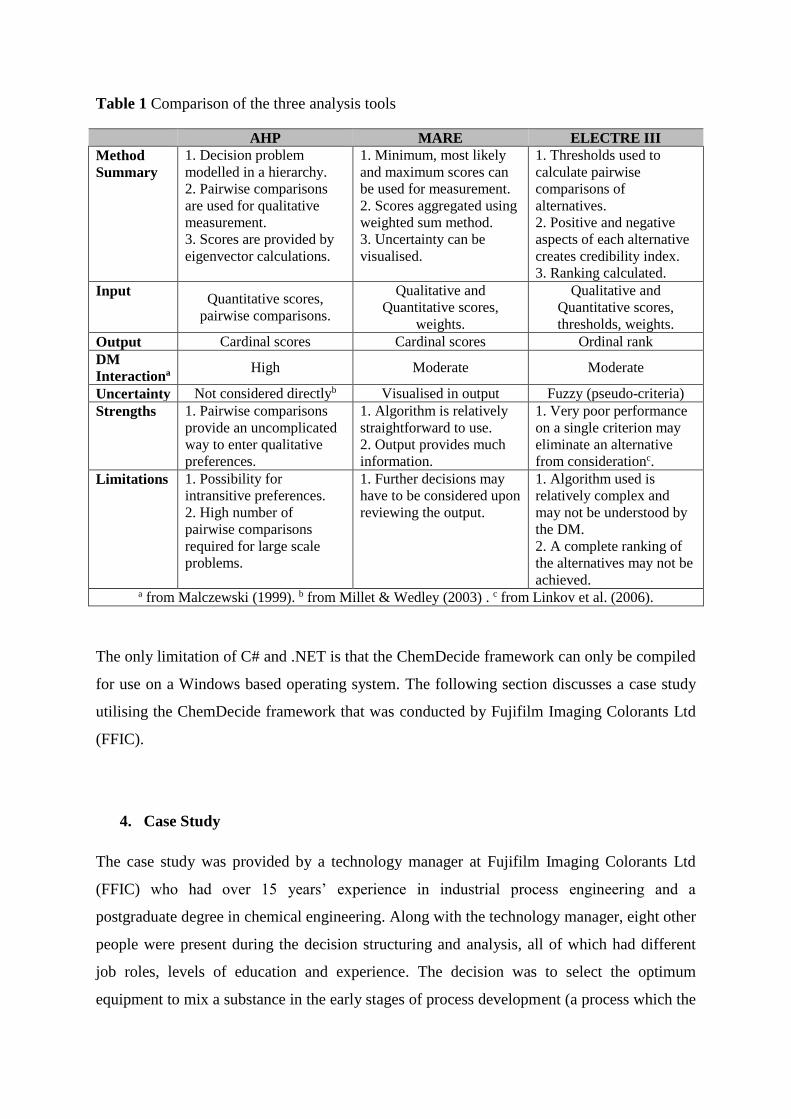
Table 1 Comparison of the three analysis tools
AHP MARE ELECTRE III Method Summary
1. Decision problem modelled in a hierarchy. 2. Pairwise comparisons are used for qualitative measurement. 3. Scores are provided by eigenvector calculations.
1. Minimum, most likely and maximum scores can be used for measurement. 2. Scores aggregated using weighted sum method. 3. Uncertainty can be visualised.
1. Thresholds used to calculate pairwise comparisons of alternatives. 2. Positive and negative aspects of each alternative creates credibility index. 3. Ranking calculated.
Input Quantitative scores, pairwise comparisons.
Qualitative and Quantitative scores,
weights.
Qualitative and Quantitative scores, thresholds, weights.
Output Cardinal scores Cardinal scores Ordinal rank DM Interactiona
High Moderate Moderate
Uncertainty Not considered directlyb Visualised in output Fuzzy (pseudo-criteria) Strengths 1. Pairwise comparisons
provide an uncomplicated way to enter qualitative preferences.
1. Algorithm is relatively straightforward to use. 2. Output provides much information.
1. Very poor performance on a single criterion may eliminate an alternative from considerationc.
Limitations 1. Possibility for intransitive preferences. 2. High number of pairwise comparisons required for large scale problems.
1. Further decisions may have to be considered upon reviewing the output.
1. Algorithm used is relatively complex and may not be understood by the DM. 2. A complete ranking of the alternatives may not be achieved.
a from Malczewski (1999). b from Millet & Wedley (2003) . c from Linkov et al. (2006).
The only limitation of C# and .NET is that the ChemDecide framework can only be compiled
for use on a Windows based operating system. The following section discusses a case study
utilising the ChemDecide framework that was conducted by Fujifilm Imaging Colorants Ltd
(FFIC).
4. Case Study
The case study was provided by a technology manager at Fujifilm Imaging Colorants Ltd
(FFIC) who had over 15 years’ experience in industrial process engineering and a
postgraduate degree in chemical engineering. Along with the technology manager, eight other
people were present during the decision structuring and analysis, all of which had different
job roles, levels of education and experience. The decision was to select the optimum
equipment to mix a substance in the early stages of process development (a process which the

decision-maker refers to as premixing). The product and different equipment options were
not disclosed for confidentiality reasons hence the four alternatives are referred to as method
1, 2, 3 and 4. The decision-maker and team used Decision Setup to identify ten criteria on
which to base their decision (Table 2).
Table 2 Criteria for case study
Source Aim Rationalisation
c1 Capital cost at 50 Quantitative Minimise Capital expenditure is limited.
c2 Capital cost at 100 Quantitative Minimise
c3 Ease of clean down Qualitative Maximise Multi-product plant.
c4 Complexity of solids
feeding required Qualitative Minimise
Different options may place different
demands on solids feeding equipment.
c5 Ease of operation Qualitative Maximise Multiple concurrent operations on plant.
c6 Mechanical reliability Qualitative Maximise Impact of outage significant.
c7 Material losses Qualitative Minimise Material is of high value.
c8 Ease of modelling at
lab scale Qualitative Maximise Lab tests may be required.
c9 Quality of vendor
support Qualitative Maximise Rapid support is necessary.
c10 Power requirements Qualitative Minimise Power needs kept to a minimum.
The overarching aim for FFIC was to select an equipment option which is inexpensive,
straightforward and reliable to operate. Of the ten criteria chosen to model the decision, two
were quantitative and represented by estimated values of capital expenditure for producing
different capacities of product. Criterion c1 (‘capital cost at 50’) referred to the initial design
capacity and c2 (‘capital cost at 100’) is the capacity if future expansion is required. The
eight qualitative criteria were related to the ease and reliability of production and thus, as no
quantitative data was available, they were represented by the decision-makers’ subjective
preferences.
Of the four equipment options, method 4 was the least expensive in terms of running costs.
However, this equipment option was difficult to clean, had poor vendor support, would lose
considerable amounts of valuable material during operation and was challenging to model at
a laboratory scale. Methods 1 and 2 would have the lowest running costs at the current rate of
production but would become more expensive if expansion was required. The running costs
of implementing method 3 would remain constant if expansion was required but this method
would lose the highest amount of valuable material, had the highest power consumption and
would be difficult to clean.
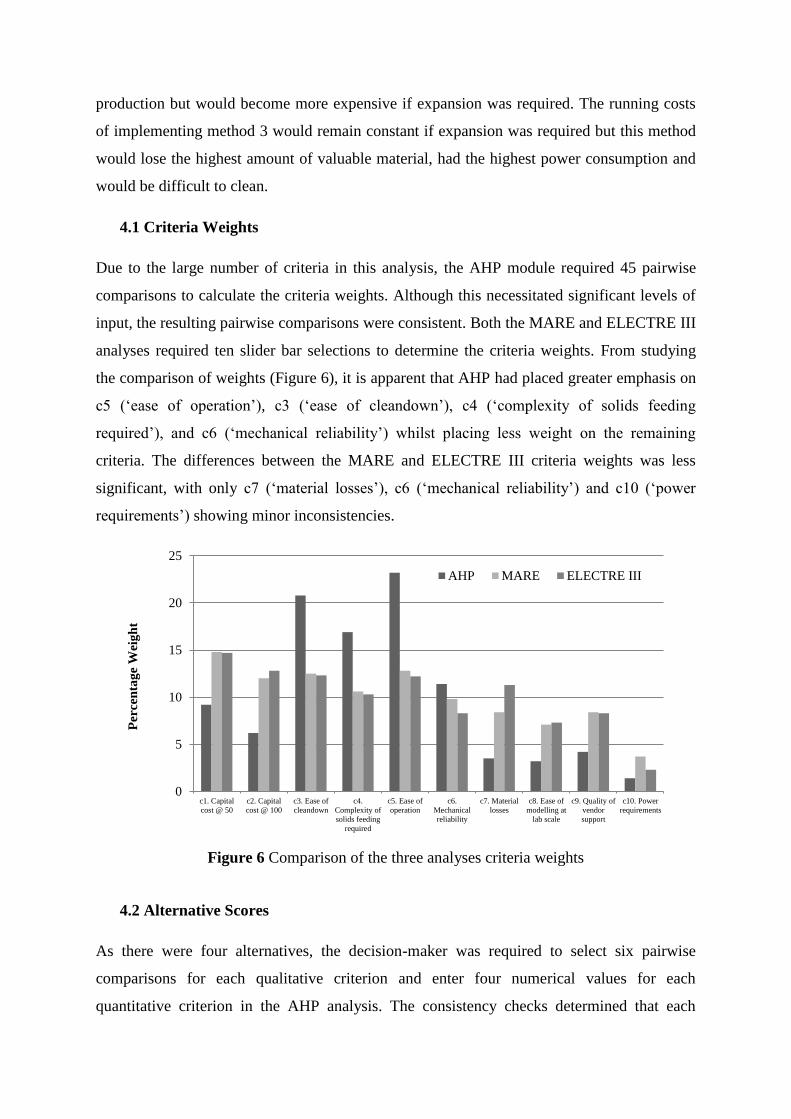
4.1 Criteria Weights
Due to the large number of criteria in this analysis, the AHP module required 45 pairwise
comparisons to calculate the criteria weights. Although this necessitated significant levels of
input, the resulting pairwise comparisons were consistent. Both the MARE and ELECTRE III
analyses required ten slider bar selections to determine the criteria weights. From studying
the comparison of weights (Figure 6), it is apparent that AHP had placed greater emphasis on
c5 (‘ease of operation’), c3 (‘ease of cleandown’), c4 (‘complexity of solids feeding
required’), and c6 (‘mechanical reliability’) whilst placing less weight on the remaining
criteria. The differences between the MARE and ELECTRE III criteria weights was less
significant, with only c7 (‘material losses’), c6 (‘mechanical reliability’) and c10 (‘power
requirements’) showing minor inconsistencies.
Figure 6 Comparison of the three analyses criteria weights
4.2 Alternative Scores
As there were four alternatives, the decision-maker was required to select six pairwise
comparisons for each qualitative criterion and enter four numerical values for each
quantitative criterion in the AHP analysis. The consistency checks determined that each
0
5
10
15
20
25
c1. Capitalcost @ 50
c2. Capitalcost @ 100
c3. Ease ofcleandown
c4.Complexity ofsolids feeding
required
c5. Ease ofoperation
c6.Mechanicalreliability
c7. Materiallosses
c8. Ease ofmodelling at
lab scale
c9. Quality ofvendorsupport
c10. Powerrequirements
Per
cent
age
Wei
ght
AHP MARE ELECTRE III
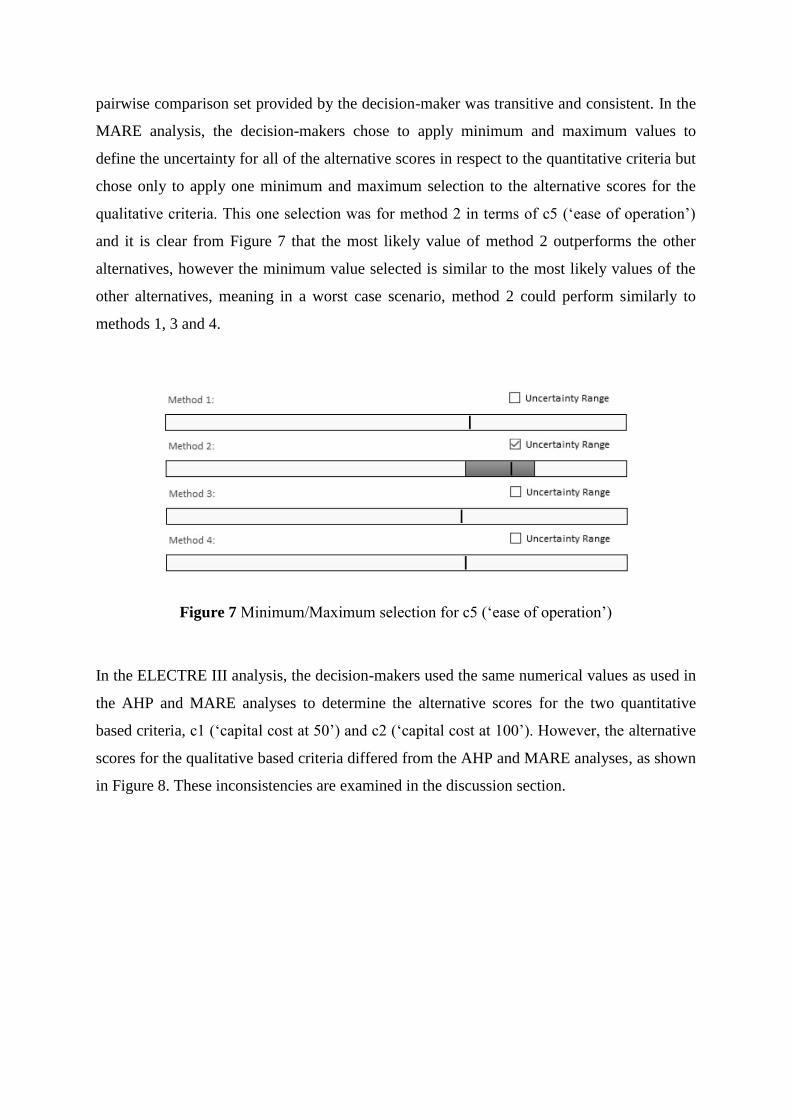
pairwise comparison set provided by the decision-maker was transitive and consistent. In the
MARE analysis, the decision-makers chose to apply minimum and maximum values to
define the uncertainty for all of the alternative scores in respect to the quantitative criteria but
chose only to apply one minimum and maximum selection to the alternative scores for the
qualitative criteria. This one selection was for method 2 in terms of c5 (‘ease of operation’)
and it is clear from Figure 7 that the most likely value of method 2 outperforms the other
alternatives, however the minimum value selected is similar to the most likely values of the
other alternatives, meaning in a worst case scenario, method 2 could perform similarly to
methods 1, 3 and 4.
Figure 7 Minimum/Maximum selection for c5 (‘ease of operation’)
In the ELECTRE III analysis, the decision-makers used the same numerical values as used in
the AHP and MARE analyses to determine the alternative scores for the two quantitative
based criteria, c1 (‘capital cost at 50’) and c2 (‘capital cost at 100’). However, the alternative
scores for the qualitative based criteria differed from the AHP and MARE analyses, as shown
in Figure 8. These inconsistencies are examined in the discussion section.

Figure 8 Comparison of the three analyses alternative scores
4.3 Results
Figures 9, 10 and 11 show the respective results of AHP, MARE and ELECTRE III. All three
analyses recommended methods 1 and 4 over methods 2 and 3. However, table 3 shows that
the orders of the results clearly differ. ELECTRE III was unable to provide a conclusive best
result as the descending rank identified method 1 as the best alternative while the ascending
rank identified method 4 as the best alternative. AHP clearly indicated that method 4 was the
best alternative followed by methods 1 and 3. MARE identified method 1 as the best
alternative but also showed that there was a high amount of uncertainty associated with
method 4. In terms of the most likely value, method 4 was the second best alternative.
However, the uncertainty range of method 4 indicated that it could be, in a worst case
scenario, the lowest performing alternative. Therefore, method 2 may be a preferred second
best alternative as its uncertainty range is much smaller.
Table 3 Comparison of the three analyses
1st 2nd 3rd 4th AHP Method 4 Method 1 Method 3 Method 2
MARE (Most likely value) Method 1 Method 4 Method 2 Method 3
ELECTRE III Method 1, Method 4
Method 2 Method 3
0
0.1
0.2
0.3
0.4
0.5
0.6
Me
thod
1M
eth
od 2
Me
thod
3M
etho
d 4
Me
thod
1M
eth
od 2
Me
thod
3M
eth
od 4
Me
thod
1M
eth
od 2
Me
thod
3M
eth
od 4
Me
thod
1M
eth
od 2
Me
thod
3M
eth
od 4
Me
thod
1M
eth
od 2
Me
thod
3M
eth
od 4
Me
thod
1M
eth
od 2
Me
thod
3M
eth
od 4
Me
thod
1M
eth
od 2
Met
hod
3M
eth
od 4
Me
thod
1M
eth
od 2
Me
thod
3M
eth
od 4
Me
thod
1M
eth
od 2
Me
thod
3M
eth
od 4
Me
thod
1M
eth
od 2
Me
thod
3M
eth
od 4
c1. Capitalcost @ 50
c2. Capitalcost @ 100
c3. Ease ofcleandown
c4.Complexity
of solidsfeedingrequired
c5. Ease ofoperation
c6.Mechanicalreliability
c7. Materiallosses
c8. Ease ofmodelling at
lab scale
c9. Quality ofvendorsupport
c10. Powerrequirements
Normalised Scores AHP MARE ELECTRE III

Figure 9 AHP Results for the FFIC Case Study
Figure 10 MARE Results for the FFIC Case Study
Descending Rank Ascending Rank Final Rank
1st Method 1 Method 4 Method 1 Method 4
2nd Method 4 Method 1 Method 2
3rd Method 2 Method 3 Method 2 Method 3
4th Method 3
Figure 11 ELECTRE III Results for the FFIC Case Study
0 0.05 0.1 0.15 0.2 0.25 0.3 0.35
Method 1
Method 2
Method 3
Method 4
Preference Score
0.6
0.65
0.7
0.75
0.8
0.85
Method 1 Method 2 Method 3 Method 4

4.4 Post analysis interview
Post analyses, the decision-maker reviewed his experiences and discussed the results. On
reflection, the decision-maker preferred the MARE tool for its ability to handle uncertainty,
for the unique way it supports minimum and maximum values in the quantitative input and
for the visualisation of the output. In particular he liked how MARE returned “confidence
intervals” as an output. He explained that “the output represents reality and therefore I think
MARE is good for displaying the real situation”. He also stated that “the catch is [with
MARE that] you might end up with multiple potential decisions still”. This statement refers to
the fact that a choice still needs to be made in terms of which alternative to select as at times
there are overlaps between the uncertainty ranges whilst in comparison, AHP and ELECTRE
III provide a definitive result.
Considering AHP and ELECTRE III, the decision-maker favoured AHP due to “forcing
direct comparisons” in terms of qualitative input. Furthermore, AHP is potentially the tool
that can be implemented most quickly but “for a small number of parameters only”. In terms
of ELECTRE III, the decision-maker said he lacked confidence in the tool as he was “more
nervous of the outputs as AHP and MARE was more clear”.
Reflecting on the inconsistencies in the three analyses, the decision-maker observed how
AHP placed considerable emphasis on a number of criteria weights and qualitative decision
variables. After analysing the input in Figures 6 and 8, the decision-maker stated “MARE and
ELECTRE III are pretty consistent and are probably more representative and accurate”.
From the outputs of the analyses, the decision-maker further evaluated method 4 as it had
been highly ranked even though from the results of MARE, it showed much greater
uncertainty. The work undertaken was unable to reveal how achievable method 4 was so in
the end Fujifilm Imaging Colorants Ltd chose to implement method 1.
5. Discussion
The FFIC case study demonstrated a decision problem with a significant number of criteria
involved in making the decision. The size of the problem necessitated the decision-makers to
consider a number of qualitative preferences which required a significant amount of time and
effort. Figure 8 shows that a number of the inconsistencies in this case study occurred at the

end of the decision-modelling process, i.e. the decision variables in respect to c10 (‘power
requirements’). These inconsistencies could be due to the tiredness and lower mental acuity
of the decision-maker causing a lower level of attention due to the intricacies of the decision
problem itself. Vohs et al. (2005) refers to this condition as decision fatigue.
Vohs et al. (2005) stated that “choice, to the extent that it requires greater decision-making
among options, can become burdensome and ultimately counterproductive”. They argue that
making multiple choices requires effort, exhausts self resources and thus impairs self-
regulation. They also stated that “the most advanced form of [decision-making] involves
weighing information about currently available options to select the option that seems most
promising”. This statement clearly describes the task of using MCDM. Through a series of
experiments with undergraduate students, Vohs et al. (2005) found that “self-regulation was
poorer among those who had made choices than among those who had not”. Therefore it is
plausible that in a larger decision problem (such as the FFIC case study) inconsistencies
could occur at the end of the analysis due to prolonged attention and mental effort causing
decision fatigue.
Another explanation for the high amount of variation associated with the least important
criterion in all three analyses, c10 (‘power requirements’), is that the decision-maker may
perceive the selection to have little impact on the decision itself. However, to gather accurate
recommendations from a structured decision analysis, it is vital that decision-makers select
all their preferences carefully.
Table 4 Scale of the AHP Method (Saaty, 1980)
Scale Verbal Expression Explanation 1 Equal importance Two activities contribute equally to the
objective. 3 Moderate
importance Experience and judgment slightly favour one activity over another.
5 Strong importance Experience and judgment strongly favour one activity over another.
7 Very strong importance
An activity is favoured very strongly over another.
9 Extreme importance The evidence favouring one activity over another is of the highest possible order of affirmation.
The values of 2, 4, 6 and 8 are compromises between the previous definitions.

Nevertheless, it is clear from Figures 6 and 8 that the AHP module exhibited the highest
number of inconsistent selections with the majority of values showing greater or lower
emphasis than the MARE and ELECTRE III analyses. This occurred despite the fact that all
of the decision-makers’ pairwise comparisons were mathematically consistent. This was
confirmed by the consistency ratio being below 0.1 in all of the pairwise comparison sets
(Saaty, 1980). Therefore, either the decision-makers’ knowingly placed emphasis on their
preferences or there are inaccuracies in the 1-9 scale and definitions proposed by Saaty
(1980). Table 4, which shows Saaty’s 1-9 scale, suggests that there is a relationship with
equal dispersion between the scale values. Consequently, the control developed for pairwise
comparison input in the AHP tool was a slider bar with equal distances between each scale
selection. However, Salo and Hämäläinen (1997) identified that there is an uneven dispersion
of values in Saaty’s AHP selection scale. They concluded that the difference in selecting
between the scale of 1 and 2 is 15 times greater than the difference in selecting between the
scale of 8 and 9. This indicates that Saaty’s scale (Saaty, 1980) is accountable for the
overemphasised criteria weights and decision variables in the case study.
One solutuion to correct the slider bar used in ChemDecide would be to modify the spread of
selections to match the actual range of preferences in AHP. Another solution, proposed by
Salo and Hämäläinen (1997), is to use balanced scales, for example the scale values of 1,
1.22, 1.5, 1.86, 2.33, 3, 4, 5.67, 9 provides the balanced values of 1-9. These scales would
ensure an even dispersion of preferences that will subsequently provide uniform selections.
6. Conclusions
Equipment selection is an important activity for manufacturing companies as selecting the
wrong equipment can be costly with respect to product quality, production time, production
rate and resource allocation. It has been suggested that an effective and efficient Multi-
Criteria Decision-Making (MCDM) tool should be used to address equipment selection
problems. However, many different MCDM techniques have emerged which can yield
different results when applied to an identical problem. In this context, this study examines the
compatibility of three different MCDM methods with an equipment selection problem. A
software framework which incorporates Analytical Hierarchy Process (AHP), Multi-Attribute
Range Evaluations (MARE) and ELimination Et Choix Traduisant la REalité trois
(ELECTRE III) was developed and distributed to a technology manager at Fujifilm Imaging

Colorants Ltd (FFIC). The manager, within a team of nine people, examined an equipment
selection problem in the early stages of a chemical manufacturing process. A number of
conclusions can be drawn:
A high number of criteria (10) required 45 pairwise comparisons from the decision-
maker to establish criteria weights using AHP. MARE and ELECTRE III only
required 10 selections to determine the criteria weights meaning the AHP analysis
was comparatively time-consuming and cumbersome.
The normalised weights and scores of the three analyses were inconsistent with AHP
showing the highest variation (Figures 6 and 8). This was most likely attributed to
inaccuracies with AHP’s selection scale, decision fatigue and the decision-makers’
perception that criteria with a low weight have little impact on the decision results.
There were significant differences in the results of the three methods. ELECTRE III
was unable to provide a conclusive result, indicating that methods 1 and 4 were joint
best solutions. AHP indicated that method 4 was the best option while MARE
identified that method 1 was best. However, MARE also identified that there was a
high amount of uncertainty associated with method 4 and in a worst case scenario,
method 4 could be the lowest performing alternative.
The decision-maker preferred the MARE method for its ability to handle uncertainty,
for the unique way it supports minimum and maximum values in the quantitative
input and for the visualisation of the output. He explained that “the output represents
reality and therefore I think MARE is good for displaying the real situation”.
The comparison of the different MCDM methods directly influenced Fujifilm Imaging
Colorants Ltd to make an informed decision to select a piece of equipment to mix a substance
in the early stages of process development. By going through this process the team of
industrial professionals became more knowledgeable about their decision and the uncertainty
associated with each equipment option, directing them to further evaluate one equipment
option before implementing another. The results however clearly show that there is a risk in
following the results of one particular MCDM method. Therefore, if time permits, it is
advisable to address an equipment selection problem using multiple decision-making
methods. However, if time is a constraint then the results indicate that MARE was the most
effective method in providing accurate representations of the decision-maker’s preferences
and comprehending the uncertainty present. These findings should assist manufacturing

companies in selecting a compatible decision-making methodology for equipment selection
problems which will potentially lead to higher product quality, shorter production times and
better resource allocation. The findings of this study should also encourage industrial
professionals from manufacturing companies to explore and compare other MCDM methods
such as ANP, TOPSIS and PROMETHEE, in order to examine the compatibility of a wider
range of MCDM methods with equipment selection decision problems. Hopefully this will
become more feasible in the future with novel tools such as the Multi-Criteria Decision
Aiding package for R (Meyer, et al., 2015) which facilitates the use of multiple MCDM
methods in one software package. Further case studies are required to test and validate the
theories and recommendations presented in this paper as only one equipment selection
problem was evaluated by one team of industrial professionals. A second equipment selection
case study has already been developed in conjunction with GlaxoSmithKline and will be
published in the near future.
Acknowledgements
The author would like to thank Fujifilm Imaging Colorants Ltd for providing the equipment
selection case study. Thanks to the EPSRC for providing the necessary funding to support the
Innovation SatNav2020 research project (EP/F016913/1). Thanks also to Britest Limited
(http://www.britest.co.uk) for their support.
References
Belton V, Stewart T (2010) Chapter 8: problem structuring and multiple criteria decision analysis. In: S Greco, M Ehrgott, JR Figueira, eds. Trends in multiple criteria decision analysis. Springer, pp. 209–239
Brans JP (1982) L’ingénierie de la décision: élaboration d’instruments d’aide à la décision. La méthode PROMETHEE. Presses de l’Université Lava
Brasil Filho AT, Pinheiro PR, Coelho ALV, Costa NC (2009) Comparison of two MCDA classification methods over the diagnosis of Alzheimer’s disease. rough sets and knowledge technology. Springer Berlin Heidelberg, pp. 334–341
Chakraborty S, Banik D (2006) Design of a material handling equipment selection model using analytic hierarchy process. Int J Adv Manuf Technol 28:1237–1245
Dehe B, Bamford D (2015) Development, test and comparison of two multiple criteria decision analysis (MCDA) models: a case of healthcare infrastructure location. Expert Syst Appl 42:6717–6727

Farsi JY, Moradi JS, Jamali B (2012) Which product would be chosen? A fuzzy VIKOR method for evaluation and selection of products in terms of customers’ point of view; case study: Iranian cell phone market. Decis Sci Lett 1:23–32
Gass SI (2005) Model world: the great debate—MAUT versus AHP. Interfaces 35(4):308–312
Hodgett R, Martin E, Montague G, Talford M (2014) Handling uncertain decisions in whole process design. Prod Plan Control 25(12):1028–1038
Hodgett RE (2013) Multi-criteria decision-making in whole process design. PhD Thesis ed. Newcastle University.
Huang IB, Keisler J, Linkov I (2011) Multi-criteria decision analysis in environmental sciences: ten years of applications and trends. Sci Total Environ 409(19):3578–3594
Hwang C-L, Yoon K (1981) Multiple attribute decision making methods and applications. In: a state-of-the-art survey. SpringerVerlag, 181
Kahraman C, Onar SC, Oztaysi B (2015) Fuzzy multicriteria decision-making: a literature review. Int J Comput Intel Syst 8(4):637– 666
Khandekar AV, Chakraborty S (2015) Selection of industrial robot using axiomatic design principles in fuzzy environment. Dec Sci Lett 4:181–192
Linkov I, Satterstrom FK, Kiker G, Batchelor C, Bridges T, Ferguson E (2006) From comparative risk assessment to multicriteria decision analysis and adaptive management: recent developments and applications. Environ Int 32:1072–1093
Malczewski J (1999) GIS and multi-criteria decision analysis. Wiley, New York
Malczewski J, Rinner C (2015) Dealing with uncertainties. In: Multicriteria decision analysis in geographic information science. Springer-Verlag Berlin Heidelberg, 191–221
Meyer P, Bigaret S, Hodgett RE, Olteanu A-L (2015) MCDA: functions to support the multicriteria decision aiding process. http://CRAN.R-project.org/package=MCDA
Millet I, Wedley WC (2003) Modelling risk and uncertainty with the analytic hierarchy process. J Multi-Criteria Decis Anal 11(2): 97–107
Mulliner E, Malys N, Maliene V (2015) Comparative analysis of MCDM methods for the assessment of sustainable housing affordability. Omega, doi:10.1016/j.omega.2015.05.013
Oliveira M, Fontes DBMM, Pereira T (2014) Multicriteria decision making: a case study in the automobile industry. Ann Manag Sci 3(1)
Roy B (1968) Classement et choix en presence de points de vue multiples la methode ELECTRE). La Revue d'Informatique et de Recherche Opérationelle 8:57–75

Roy B (1978) ELECTRE III: Un algorithme de classements fondé sur une représentation floue des préférences en présence de critéres multiples. Cahiers du Centre d’Etudes de Recherche Opérationnelle 20:3–24
Saaty TL (1980) The analytic hierarchy process. McGraw Hill International
Saaty TL (1996) Decision making with dependence and feedback: the analytic network process. RWS Publications, Pittsburgh
Safari H, Faghih A, Fathi MR (2013) Integration of graph theory and matrix approach with fuzzy AHP for equipment selection. J Ind Eng Manag 6(2):477–494
Salminen P, Hokkanen J, Lahdelma R (1998) Comparing multicriteria methods in the context of environmental problems. Eur J Oper Res 104(3):485–496
Salo AA, Hämäläinen RP (1997) On the measurement of preferences in the analytic hierarchy process. J Multi-Criteria Decis Anal 6(6):309–319
Smith JE, Winterfeldt DV (2004) Decision analysis in management science. Manag Sci 50(5):561–574
Stewart TJ (2005) Dealing with uncertainties in MCDA. In: Figueira J, Greco S, Ehrgott M (eds) Multi-criteria decision analysis—state of the art annotated surveys. Springer, New York