Embed Size (px)
Citation preview

Neurology Publish Ahead of PrintDOI: 10.1212/WNL.0000000000012467
Comparison of MRI Lesion Evolution in Different Central Nervous System
Demyelinating Disorders
Elia Sechi, MD,1,5 Karl N. Krecke, MD,2 Steven A. Messina, MD,2 Marina Buciuc, MD,1 Sean J. Pittock, MD,1,3
John J. Chen, MD, PhD,1,4 Brian G. Weinshenker, MD,1 A. Sebastian Lopez-Chiriboga, MD,6
Claudia F. Lucchinetti, MD,1 Nicholas L. Zalewski, MD,1 Jan Mendelt Tillema, MD,1 Amy Kunchok, MD,1
Salvatore Monaco, MD,5 Padraig P. Morris, MD,2 James P. Fryer, MS,3 Adam Nguyen,3 Tammy Greenwood, MS,4
Stephanie B. Syc-Mazurek, MD, PhD,1 B. Mark Keegan, MD,1 and Eoin P. Flanagan, MD.1,3
This is an open access article distributed under the terms of the Creative Commons Attribution-
NonCommercial-NoDerivatives License 4.0 (CC BY-NC-ND), which permits downloading and sharing
the work provided it is properly cited. The work cannot be changed in any way or used commercially
without permission from the journal.
Neurology® Published Ahead of Print articles have been peer reviewed and accepted for publication. This
manuscript will be published in its final form after copyediting, page composition, and review of proofs.
Errors that could affect the content may be corrected during these processes.
Copyright © 2021 The Author(s). Published by Wolters Kluwer Health, Inc. on behalf of the American Academy of Neurology.
Published Ahead of Print on July 14, 2021 as 10.1212/WNL.0000000000012467
1. Department of Neurology, Mayo Clinic, Rochester, MN, USA; 2. Department of Radiology, Mayo Clinic,
Rochester, MN, USA; 3. Department of Laboratory Medicine and Pathology, Mayo Clinic, Rochester, MN, USA; 4.
Department of Ophthalmology, Mayo Clinic, Rochester, MN, USA; 5. Department of Neurosciences, Biomedicine,
and Movement Sciences, University of Verona, Verona, Italy; 6. Department of Neurology, Mayo Clinic,
Jacksonville, FL, USA
Submission Type: Article Title Character count: 95 Number of tables: 3 Number of figures: 4 References: 40/50 Abstract word count: 345/350 Total text word count: 4410/4500
Correspondence to:
Eoin P. Flanagan Email: [email protected]
Statistical Analysis conducted by Elia Sechi, MD, Department of Neurology, Mayo Clinic.
Search Terms: (1) myelin oligodendrocyte glycoprotein; (2) MOG; (3) aquaporin-4; (4) AQP4; (5)
multiple sclerosis
Copyright © 2021 The Author(s). Published by Wolters Kluwer Health, Inc. on behalf of the American Academy of Neurology.

Study Funding: NIH National Institute of Neurological Disorders and Stroke (R01NS113828)
Financial Disclosures:
E. Sechi - Reports no disclosures relevant to the manuscript.
K.N. Krecke - Reports no disclosures relevant to the manuscript.
S. Messina - Reports no disclosures relevant to the manuscript.
M. Buciuc - Reports no disclosures relevant to the manuscript.
S.J. Pittock - Reports grants, personal fees and non-financial support from Alexion Pharmaceuticals, Inc.;
Grifols, Autoimmune Encephalitis Alliance; and MedImmune, Inc.; Dr. Pittock has a patent # 9,891,219
(Application#12-573942) “Methods for Treating Neuromyelitis Optica (NMO) by Administration of
Eculizumab to an individual that is Aquaporin-4 (AQP4)-IgG Autoantibody positive”. He also has patents
pending for the following IgGs as biomarkers of autoimmune neurological disorders (septin-5, Kelch-like
protein 11, GFAP, PDE10A and MAP1B).
J.J. Chen - Reports no disclosures relevant to the manuscript.
B.G. Weinshenker - Reports royalties from RSR Ltd, Oxford University, Hospices Civil de Lyon, and
MVZ Labor PD Dr. Volkmann und Kollegen GbR for a patent of NMO-IgG as a diagnostic test for NMO
and related disorders. He serves as a member of an adjudication committee for clinical trials in NMO
being conducted by VielaBio and Alexion pharmaceutical companies. He is a consultant for Chugai
Pharma and Mitsubishi Tanabe regarding potential clinical trials for NMO.
A.S. Lopez-Chiriboga - Reports no disclosures relevant to the manuscript.
C.F. Lucchinetti - Received grants from Biogen, National Multiple Sclerosis Society, Kingsland
Foundation, and National Institute for Neurological Disorders and Stroke during the conduct of the study.
N.L. Zalewski - Reports no disclosures relevant to the manuscript.
J.M. Tillema - Reports no disclosures relevant to the manuscript.
A. Kunchok - Reports no disclosures relevant to the manuscript.
S. Monaco - Reports no disclosures relevant to the manuscript.
P.P. Morris - Reports no disclosures relevant to the manuscript.
J.P. Fryer - Reports no disclosures relevant to the manuscript.
A. Nguyen - Reports no disclosures relevant to the manuscript.
T. Greenwood - Reports no disclosures relevant to the manuscript.
S.B. Syc-Mazurek - Reports no disclosures relevant to the manuscript.
B.M. Keegan - Reports personal funding by Biogen, and publishing royalties for Common Pitfalls in
Multiple Sclerosis and CNS Demyelinating Diseases. He is an Editorial Board member of Multiple
Sclerosis and Related Disorders.
E.P. Flanagan - Reports research support as a site principal investigator in a randomized placebo-
controlled clinical trial of Inebilizumab (a CD19 inhibitor) in neuromyelitis optica spectrum disorders
funded by MedImmune/Viela Bio.
Copyright © 2021 The Author(s). Published by Wolters Kluwer Health, Inc. on behalf of the American Academy of Neurology.

Abstract
Background and Objective: There are few studies that compare lesion evolution across different CNS
demyelinating diseases, yet knowledge of this may be important for diagnosis and understanding
differences in disease pathogenesis. We sought to compare MRI T2-lesion evolution in myelin-
oligodendrocyte-glycoprotein-IgG-associated disorder (MOGAD), aquaporin-4-IgG-positive
neuromyelitis optica spectrum disorder (AQP4-IgG-NMOSD), and multiple sclerosis (MS).
Methods: In this descriptive study, we retrospectively identified Mayo Clinic patients with MOGAD,
AQP4-IgG-NMOSD, or MS and: 1) brain or myelitis attack; 2) available attack MRI within 6 weeks; and
3) follow-up MRI beyond 6 months without interval relapses in that region. Two neurologists identified
the symptomatic or largest T2-lesion for each patient (index lesion). MRIs were then independently
reviewed by two neuroradiologists blinded to diagnosis to determine resolution of T2-lesions by
consensus. The index T2-lesion area was manually outlined acutely and at follow-up to assess variation in
size.
Results: We included 156 patients (MOGAD, 38; AQP4-IgG-NMOSD, 51; MS, 67) with 172 attacks
(brain, 81; myelitis, 91). The age (median [range]) differed between MOGAD (25 [2-74]), AQP4-IgG-
NMOSD (53 [10-78]) and MS (37 [16-61]) (p<0.01) and female sex predominated in the AQP4-IgG-
NMOSD (41/51 [80%]) and MS (51/67 [76%]) groups but not among those with MOGAD (17/38 [45%]).
Complete resolution of the index T2-lesion was more frequent in MOGAD (brain, 13/18[72%]; spine,
22/28[79%]) than AQP4-IgG-NMOSD (brain, 3/21[14%]; spine, 0/34[0%]) and MS (brain, 7/42[17%];
spine, 0/29[0%]), p<0.001. Resolution of all T2-Lesions occurred most often in MOGAD (brain,
7/18[39%]; spine, 22/28[79%]) than AQP4-IgG-NMOSD (brain, 2/21[10%]; spine, 0/34[0%]), and MS
(brain, 2/42[5%]; spine, 0/29[0%]), p< 0.01. There was a larger median (range) reduction in T2-lesion
area in mm2 on follow-up axial brain MRI with MOGAD (213[55-873]) than AQP4-IgG-NMOSD
(104[0.7-597]) (p=0.02) and MS, 36[0-506]) (p< 0.001) and the reductions in size on sagittal spine MRI
follow-up in MOGAD (262[0-888]) and AQP4-IgG-NMOSD (309[0-1885]) were similar (p=0.4) and
greater than MS (23[0-152]) (p<0.001).
Copyright © 2021 The Author(s). Published by Wolters Kluwer Health, Inc. on behalf of the American Academy of Neurology.

Conclusions: The MRI T2-lesions in MOGAD resolve completely more often than AQP4-IgG-NMOSD
and MS. This has implications for diagnosis, monitoring disease activity, and clinical trial design, while
also providing insight into pathogenesis of central nervous system demyelinating diseases.
Copyright © 2021 The Author(s). Published by Wolters Kluwer Health, Inc. on behalf of the American Academy of Neurology.

Introduction
Myelin-oligodendrocyte-glycoprotein (MOG)-IgG-associated disorders (MOGAD), aquaporin-4-IgG
positive neuromyelitis optica spectrum disorder (AQP4-IgG-NMOSD), and multiple sclerosis (MS) are
distinct inflammatory demyelinating disorders of the central nervous system (CNS).1-4 Despite some
overlapping manifestations, prior studies have highlighted major differences between these disease
entities, especially concerning attack severity and clinical course.5-7 While AQP4-IgG-NMOSD and
MOGAD are characterized by severe attacks that typically result in major acute disability (e.g.,
paraplegia, encephalopathy, blindness) and are frequently accompanied by large MRI T2-lesions in the
brain (>3 cm in maximum diameter) or the spinal cord (≥3 contiguous vertebral body segments), MS
attacks are typically of milder clinical severity and accompanied by smaller lesions on brain/spinal cord
MRI, although tumefactive MS lesions occur in some patients.5, 6, 8-11 In the long-term, however, the
course of these disorders does not generally reflect the severity of the initial attacks: MOGAD patients
frequently have better outcomes than those with AQP4-IgG-NMOSD despite similarly severe attacks at
nadir, while secondary progressive disability is essentially exclusive to MS despite milder disease attacks
in this condition.12-14 The exact reasons for these clinical differences are unclear.
Most MRI studies in these three disorders have focused on attack lesion location and morphology or
global measures of atrophy, while T2-lesion evolution has rarely been assessed.5, 6, 10, 15-17 Studying the
temporal evolution of different demyelinating lesions on MRI after an initial attack might improve our
understanding of differences in disease course, inform diagnosis, and help plan optimal strategies for
monitoring disease activity and treatment. We investigated the temporal evolution of demyelinating
lesions on MRI after a single brain or spinal cord clinical attack in patients with MOGAD, AQP4-IgG-
NMOSD, and MS.
Methods
Standard Protocol Approvals, Registrations, and Patient Consents
Copyright © 2021 The Author(s). Published by Wolters Kluwer Health, Inc. on behalf of the American Academy of Neurology.

The study was approved by the Institutional Review Board of the Mayo Clinic. All patients consented to
the use of their medical records for research purposes.
Identification of disease cohorts
Three cohorts of patients were retrospectively identified: 1) patients with MOGAD consecutively seen at
Mayo Clinic between January 1, 2004 and August 31, 2019; or 2) AQP4-IgG-NMOSD consecutively
seen at Mayo Clinic between January 1, 2000 and August 31, 2019; and 3) patients with MS or clinically
isolated syndrome from both a clinic-based cohort of patients consecutively seen by a neurologist (E.P.F.)
at the Mayo Clinic MS outpatient service from January 1, 2015 to May 30, 2018, and a previously
identified population-based cohort (Olmsted County, MN) of prevalent MS cases on December 31, 2011.8
Only patients with the characteristic MOGAD, AQP4-IgG-NMOSD, or MS clinical-MRI phenotypes
were included as per published international diagnostic criteria.18-20 Nineteen patients were previously
reported.5, 12, 21
Inclusion and exclusion criteria
From these cohorts, our inclusion criteria required all of the following: 1) first brain and/or myelitis
attack; 2) available acute brain/spinal cord MRI obtained within six weeks of the attack nadir; and 3)
available follow-up MRI beyond 6 months after the acute MRI. We excluded those with interval relapses
involving the same region as the initial attack (brain or spine) to avoid overlap of MRI abnormalities that
could bias assessment of single T2-lesion evolution. Interval relapses affecting different CNS regions
were allowed (e.g., optic neuritis after an initial myelitis attack). When multiple acute MRIs were
available, the one showing the most extensive CNS abnormalities was chosen for analysis as this was
considered to be most representative of attack nadir. In cases with multiple follow-up MRIs, the last MRI
before a relapse affecting the same CNS region of the initial attack (if any), or last clinical follow-up was
analyzed. In patients who had concomitant brain and myelitis attack at the same time, these were analyzed
separately. Clinically isolated optic neuritis attacks with or without MRI evidence of brain and/or spinal
cord asymptomatic involvement were not considered brain attacks. Patients presenting with clinically
isolated optic neuritis were not included unless they had a subsequent brain and/or myelitis attack, which
was considered the index attack for analysis.
Copyright © 2021 The Author(s). Published by Wolters Kluwer Health, Inc. on behalf of the American Academy of Neurology.

Autoantibody testing
Serum positivity for AQP4-IgG was determined by live (in-house fluorescence-activated cell sorting
assay) or fixed HEK293 cells transfected with a plasmid encoding AQP4 (n=49), or tissue
immunofluorescence (n=2).22 Serum positivity for MOG-IgG1 was confirmed by a clinically validated
flow cytometry assay utilizing live full-length MOG-transfected HEK293 cells.5 Samples analyzed
included those tested at the time of an acute attack and archived stored samples that were re-analyzed.
Clinical characteristics
Demographic, laboratory, and clinical data were abstracted (E.S., M.B.). Relapses were defined as
neurological disturbances of at least 24 hours duration, and occurring after a period of remission of >1
month. Disability assessment was performed at nadir of the initial attack and the closest clinical follow-up
to the analyzed follow-up MRI using the expanded disability status scale-score (EDSS).
Identification of index demyelinating lesions
After medical records review, an index lesion was defined as an acute lesion that was anatomically
explanatory for the clinical manifestations or, when multiple possible symptomatic acute lesions (e.g.,
multifocal brain T2-hyperintensities in a patient with encephalopathy) were present, the largest was
selected as the index lesion. This index lesion was initially identified for each included attack by two
neurologists (E.S., E.P.F.) by consensus, and the neuroradiologists were advised of its location before
imaging review.
MRI determination of lesion evolution and lesion size
All included acute and follow-up brain and spinal cord MRIs were sorted in random order and each
independently reviewed by two neuroradiologists (S.M., K.N.K.) blinded to the diagnosis and serology
status. Lesion resolution or persistence on follow-up MRI was determined, and consensus was reached
after discussion when disagreement occurred. To assess evolution in T2-lesion size over time, a single
neuroradiologist (K.N.K or S.A.M.) manually measured the largest axial area (mm2) of the index brain
and spinal cord lesions, and largest sagittal area and longest lesion length in contiguous vertebral body
segments (0.5 or more) for the spinal cord lesions only, in the acute and follow-up MRIs (Figure 1).
Copyright © 2021 The Author(s). Published by Wolters Kluwer Health, Inc. on behalf of the American Academy of Neurology.
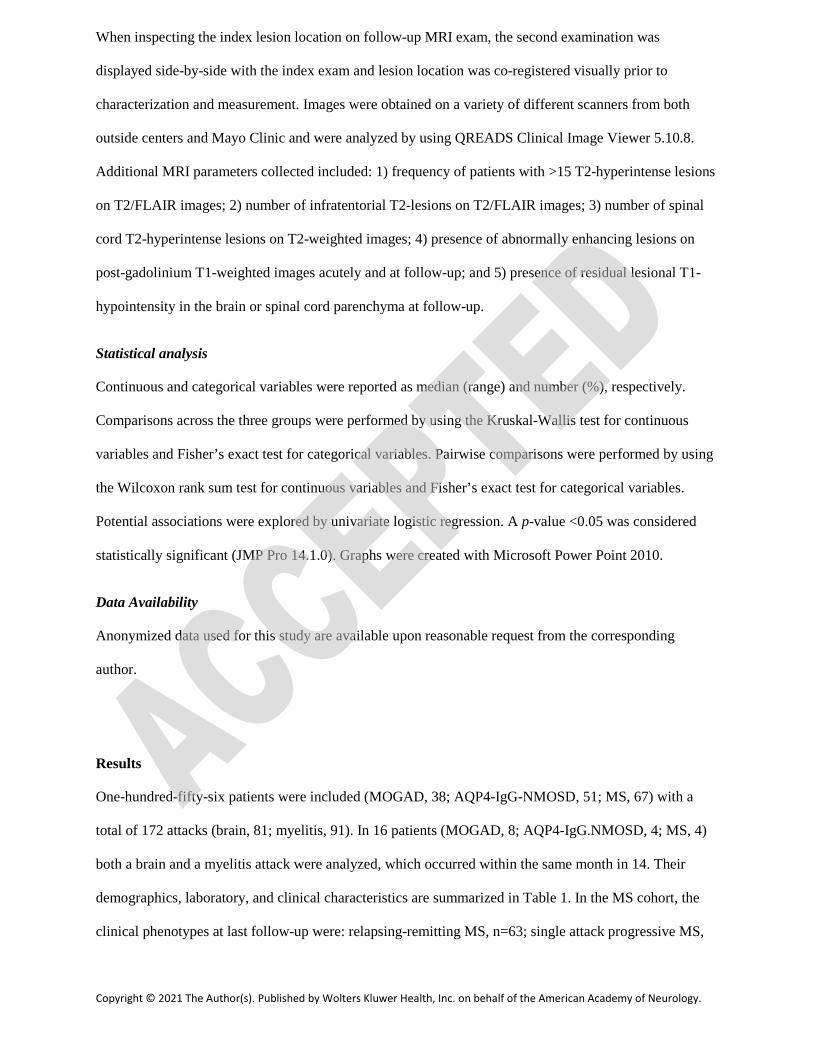
When inspecting the index lesion location on follow-up MRI exam, the second examination was
displayed side-by-side with the index exam and lesion location was co-registered visually prior to
characterization and measurement. Images were obtained on a variety of different scanners from both
outside centers and Mayo Clinic and were analyzed by using QREADS Clinical Image Viewer 5.10.8.
Additional MRI parameters collected included: 1) frequency of patients with >15 T2-hyperintense lesions
on T2/FLAIR images; 2) number of infratentorial T2-lesions on T2/FLAIR images; 3) number of spinal
cord T2-hyperintense lesions on T2-weighted images; 4) presence of abnormally enhancing lesions on
post-gadolinium T1-weighted images acutely and at follow-up; and 5) presence of residual lesional T1-
hypointensity in the brain or spinal cord parenchyma at follow-up.
Statistical analysis
Continuous and categorical variables were reported as median (range) and number (%), respectively.
Comparisons across the three groups were performed by using the Kruskal-Wallis test for continuous
variables and Fisher’s exact test for categorical variables. Pairwise comparisons were performed by using
the Wilcoxon rank sum test for continuous variables and Fisher’s exact test for categorical variables.
Potential associations were explored by univariate logistic regression. A p-value <0.05 was considered
statistically significant (JMP Pro 14.1.0). Graphs were created with Microsoft Power Point 2010.
Data Availability
Anonymized data used for this study are available upon reasonable request from the corresponding
author.
Results
One-hundred-fifty-six patients were included (MOGAD, 38; AQP4-IgG-NMOSD, 51; MS, 67) with a
total of 172 attacks (brain, 81; myelitis, 91). In 16 patients (MOGAD, 8; AQP4-IgG.NMOSD, 4; MS, 4)
both a brain and a myelitis attack were analyzed, which occurred within the same month in 14. Their
demographics, laboratory, and clinical characteristics are summarized in Table 1. In the MS cohort, the
clinical phenotypes at last follow-up were: relapsing-remitting MS, n=63; single attack progressive MS,
Copyright © 2021 The Author(s). Published by Wolters Kluwer Health, Inc. on behalf of the American Academy of Neurology.
n=2; and clinically isolated syndrome, n=2. Among AQP4-IgG-NMOSD and MOGAD patients none had
developed a progressive course at last follow-up.
All MOGAD patients tested negative for AQP4-IgG, while in the AQP4-IgG-NMOSD cohort 38 of 51
(75%) were tested for MOG-IgG, uniformly with negative results. In the MS cohort, 36 (54%) and 31
(46%) of 67 were tested for AQP4-IgG and MOG-IgG, respectively, all of whom were seronegative,
including the two patients with clinically isolated syndrome who tested negative for both antibodies.
Description of the attacks
The brain symptoms accompanying the index lesions were encephalopathy or focal symptoms attributable
to supratentorial brain regions in 12 (MOGAD, 7; AQP4-IgG-NMOSD, 0; MS, 5; p=0.003),
brainstem/cerebellar syndrome in 56 (MOGAD, 10; AQP4-IgG-NMOSD, 18; MS, 28; p=0.1), and
combinations thereof in 13 (MOGAD, 1; AQP4-IgG-NMOSD, 3; MS, 9; p=0.4). In patients with an
initial myelitis attack, spinal cord MRI demonstrated cervical involvement in 31 (MOGAD, 6; AQP4-
IgG-NMOSD, 9; MS, 16; p=0.02), thoracic involvement in 21 (MOGAD, 7; AQP4-IgG-NMOSD, 11;
MS, 3; p=0.1), or involvement of both regions in 39 (MOGAD, 15; AQP4-IgG-NMOSD, 14; MS, 10;
p=0.36). In MOGAD patients, the included attacks occurred as part of an acute disseminated
encephalomyelitis or with MRI evidence of multifocal CNS involvement without encephalopathy in
22/38 (58%), or as isolated brain (4/38 [11%]) or myelitis (12/38 [32%]) attacks with or without
concomitant optic neuritis.
Interval treatment
Acute immunotherapy (within 6 weeks from the index attack nadir) was more commonly a monotherapy
of intravenous and/or oral corticosteroids in the MS cohort (43/46 [93%]) compared to the MOGAD
(23/38 [61%]) and AQP4-IgG-NMOSD (29/46 [63%]) groups (p<0.001), although single-agent
treatments with intravenous immunoglobulins (IVIG; 2 MOGAD patients) or plasma exchange (PLEX, 1;
AQP4-IgG-NMOSD patient) were also administered. In addition to corticosteroids, one or more
adjunctive acute treatments utilized in each disorder included: MS (PLEX, 3); AQP4-IgG-NMOSD
(PLEX, 16; IVIG, 2); and MOGAD (PLEX, 7; IVIG, 6). After the acute phase, most of the patients in the
Copyright © 2021 The Author(s). Published by Wolters Kluwer Health, Inc. on behalf of the American Academy of Neurology.

three groups received different maintenance immuno-modulating and/or immunosuppressive agents as
detailed in Table 1.
Other CNS interval relapses
Relapses in other regions of the nervous system were allowed between the attack MRI and the follow-up
MRI. This included myelitis interval relapses in patients with initial brain attacks in 8/21 (38%) AQP4-
IgG-NMOSD, 9/18 (50%) MOGAD, and 16/42 (38%) MS patients (p=0.83), and interval brain or optic
neuritis relapses in patients with initial myelitis attacks in 10/34 (29%) AQP4-IgG-NMOSD, 13/28 (46%)
MOGAD, and 5/29 (17%) MS patients (p=0.07).
MRI lesion evolution
The acute and follow-up MRI characteristics for the included attacks are summarized and compared in
Table 2 and Table 3, while representative examples of brain and spinal cord MRI lesion evolution are
shown in Figures 1-3. Graphs of the main differences in MRI lesion evolution parameters for the three
disease groups are included in Figure 4. In patients with brain attacks, the median (range) number of total
available follow-up brain MRIs per patient before a brain relapse or last clinical contact was 3 (1-14):
AQP4-IgG-NMOSD, 3 (1-10); MOGAD, 3 (1-13); MS, 3.5 (1-14). In patients with myelitis attacks, the
median (range) number of available follow-up spinal cord MRIs per patient before a myelitis relapse or
last clinical contact was 2 (1-8): AQP4-IgG-NMOSD, 2 (1-7); MOGAD, 3 (1-7); MS, 2 (1-8).
1. Index T2-lesion resolution
Complete resolution of the brain index lesion, with or without normalization of the entire brain MRI, was
observed in 72% of MOGAD, 17% of MS, and 14% of AQP4-IgG-NMOSD patients, p<0.001 (Table 2).
In the AQP4-IgG-NMOSD and MS groups, all index lesions that resolved completely were infra-tentorial
while in the MOGAD group they were both supra-tentorial (n=6) and infra-tentorial (n=7).
Complete resolution of the myelitis index lesion, with or without normalization of the entire spine MRI,
was observed in 79% of MOGAD, 0% of MS, and 0% of AQP4-IgG-NMOSD patients, p<0.001 (Table
3). In patients with a myelitis attack, resolution of the index lesion always coincided with normalization
of the spinal cord MRI at follow-up.
Copyright © 2021 The Author(s). Published by Wolters Kluwer Health, Inc. on behalf of the American Academy of Neurology.

2. MRI normalization of T2-signal abnormalities
A complete resolution of all the specific T2-abnormalities at MRI follow-up was more common with
MOGAD for both brain (MOGAD, 39%; AQP4-IgG-NMOSD, 10%; MS, 5%) and spinal cord (MOGAD,
79%; AQP4-IgG-NMOSD, 0%; MS, 0%) attacks (Table 2 and Table 3). By reviewing all available
follow-up MRIs (including those obtained before 6 months), the median (range) time in months from
acute to first available normal brain MRI in those in whom T2-lesions resolved were: MOGAD, 19 (1-
96); AQP4-IgG-NMOSD, 26 (18-95); MS, 11 (10-13). In MOGAD patients with a myelitis attack, the
median (range) time to first normal follow-up MRI was 9 months (1-96).
3. Determinants of lesion resolution in MOGAD
By using logistic regression to predict T2-lesion resolution in MOGAD patients, no significant
association was found with time interval between acute and follow-up MRI, gender, acute lesion area,
abnormal gadolinium enhancement on acute MRI, interval disease relapses in other CNS regions, cervical
versus thoracic spinal cord location (in patients with myelitis only), MOGAD phenotype
(ADEM/multifocal CNS involvement versus other), monophasic versus relapsing course of the disease,
administration of acute treatment and its type (monotherapy versus multiple agents), or commencement of
long-term immunosuppressive therapy and its types (anti-CD20 versus oral immunosuppressants
[azathioprine or mycophenolate mofetil] versus MS disease-modifying agents). Moreover, there was no
difference between pediatric (age <18 years) and adult MOGAD patients in the frequency of brain index
lesion resolution (7/11 [64%] versus 6/7 [86%]; p=0.6), brain MRI normalization (4/11 [36%] versus 3/7
[43%]; p=1.0), and spinal cord MRI normalization (5/8 [63%] versus 17/20 [85%]; p=0.3). Lastly, for
those in whom repeated MOG-IgG testing was available, the frequency of lesion resolution did not differ
significantly for transient (i.e., testing negative at least six months after the initial MOG-IgG positivity)
versus persistent (≥6 months) antibody positivity and brain (3/4 [75%] versus 8/10 [80%]; p=1.0) or
myelitis (3/6 [50%] versus 10/12 [83%]; p=0.27) attacks, respectively.
4. Clinical characteristics of patients with MRI normalization
In the MOGAD group, the median EDSS at last clinical follow-up was similar in those who showed a
normal MRI (brain, EDSS 1 [range, 0-2]; myelitis, EDSS 1 [0-6.5]) versus those who did not (brain,
Copyright © 2021 The Author(s). Published by Wolters Kluwer Health, Inc. on behalf of the American Academy of Neurology.

EDSS 1 [range, 0-3.5]; myelitis, EDSS 0.5 [range, 0-7]); p≥0.6 for all comparisons. The frequencies of
interval relapses were similar. Three patients with isolated MOGAD myelitis (and no other disease
relapses) had residual symptoms of spinal cord dysfunction at the time of the normal follow-up MRI,
including subjective sensory disturbances (n=3: itching, burning, tingling), bladder dysfunction (n=2:
increased urinary frequency, urinary hesitancy), and mild gait instability (n=1). Also one patient with
clinically isolated syndrome of brainstem demyelination resulting in acute bilateral internuclear
ophthalmoplegia had residual intermittent diplopia and gaze-evoked nystagmus at last follow-up despite
brain MRI normalization. All other patients with normalization of the MRI at follow-up either had no
residual disability at last follow-up or a residual clinical deficit explained by other attacks.
5. Reductions in Size of Index T2-lesions
In patients with brain attacks, the median axial area reduction for the index lesions was higher in
MOGAD (213 mm2 [range, 55-873]) compared to AQP4-IgG-NMOSD (104 mm2 [range, 0.7-597]) and
MS (36 mm2 [range, 0-506]), p<0.001; although no significant difference was observed between patients
with AQP4-IgG-NMOSD and MS in the median relative % reduction from acute MRI (Table 2). In the
spinal cord, the median index lesion area reduction was similar in MOGAD and AQP4-IgG-NMOSD
patients on both sagittal (262 [range, 0-888] versus 309 [range, 0-1885] mm2; p=0.4) and axial (34 [range,
4-100] versus 23 [range, 1-118] mm2; p=0.3) images, although the median relative % reduction in size
compared to the acute MRI was higher in the MOGAD group (Table 3). In the MS group, both the
median axial area reduction in mm2 and the relative % T2-lesion reduction from the acute MRI were
lower compared to the MOGAD and AQP4-IgG-NMOSD groups (p<0.001 for all comparisons; Table 3).
6. Other MRI parameters
None of those with enhancing lesions acutely showed persistent enhancement at follow-up in any of the
three groups (Table 2, Table 3). Residual T1-hypointensity of the index brain lesion and of all brain
lesions was lowest with MOGAD versus AQP4-IgG-NMOSD and MS (Table 2) but was very
infrequently detected in the spine across all groups (Table 3).
Copyright © 2021 The Author(s). Published by Wolters Kluwer Health, Inc. on behalf of the American Academy of Neurology.

Discussion
We identified clear differences in T2-lesion evolution between MOGAD, AQP4-IgG-NMOSD, and MS
that may help define their different disease courses, inform the diagnosis, and help plan future clinical
trials. Demyelinating T2-lesions in MOGAD tend to resolve completely at follow-up despite their large
size acutely and initial accompanying severe clinical impairment, which is in line with the favorable long-
term outcome reported in most patients.12 T2-lesions associated with AQP4-IgG are similar to those
observed in MOGAD in terms of accompanying clinical severity and size but rarely resolve completely
and despite a large reduction in size (generally 60-80% from the acute MRI) small regions of residual T2-
hyperintensity are usually evident. This presumed scarring on MRI, along with the greater associated
spinal cord atrophy compared to MOGAD described in prior studies,23 are consistent with the incomplete
recovery and step-wise attack-related disability accumulation reported in AQP4-IgG-NMOSD.24 MS
lesions are characterized by smaller size and less severe attacks acutely but only show moderate reduction
in size (generally 30-70% from the acute MRI) and rarely resolve completely despite resolution of clinical
features. We speculate that persistence of these T2-lesions, particularly larger lesions in critical locations,
over time may represent a nidus for secondary disability progression and the tendency of some MS
lesions to remain chronically active between relapses (smoldering MS lesions) could support this
hypothesis.25, 26 Moreover, reports of progressive disability attributable to a single persistent large T2-
lesion in an eloquent location (such as the spinal cord lateral columns) that becomes focally atrophic over
time is also consistent with this proposition.27-29
While the persistence of MS lesions over time is well recognized, lesion evolution in MOGAD and
AQP4-IgG-NMOSD is much less well studied and mostly analyzed in subsets of prior studies. In a cohort
of children with demyelinating CNS disorders, normalization of spinal cord MRI after the acute phase
was observed in 6/8 (75%) MOGAD and 0/4 (0%) AQP4-IgG-NMOSD cases with longitudinally
extensive transverse myelitis.30 Complete resolution of brain MRI abnormalities was also reported in
25/42 (60%) children with MOGAD after a median of four years, but only 20/109 (18%) seronegative
patients with pediatric CNS demyelination (with approximately half of the patients having an MS
phenotype, none of which showed lesion resolution).31 We have previously reported MOGAD patients
Copyright © 2021 The Author(s). Published by Wolters Kluwer Health, Inc. on behalf of the American Academy of Neurology.

with long follow-up (median of 14 years) and highly relapsing course with a normal follow-up MRI of the
brain and spinal cord was observed in 18/25 (72%) and 6/6 (100%) patients, respectively.12 Also, a recent
series of MOGAD patients with brainstem or cerebellar attacks from our group showed lesion resolution
at ≥6 months was observed in 6/9 (67%) patients.21 Accepting differences in study design and follow-up
durations, these numbers are in line with our findings and suggest MRI normalization in MOGAD may
occur even after multiple attacks. A prior study specifically analyzed brain lesion evolution on MRI in 63
patients with NMOSD (95% with AQP4-IgG), for a total of 211 acute brain lesions and found complete
resolution in 24% of these.17 The lower frequency of lesion resolution in our study could be related to the
greater predominance of infratentorial lesions in our study as differences in lesion location can impact the
degree of tissue injury but differences in inclusion criteria, MRI scanners or the role of chance are other
possible explanations.
Our findings have relevance for current clinical practice for helping select individuals at a higher risk of
MOGAD. Resolution of most or all lesions and marked reduction in lesion size in a patient with CNS
demyelinating disease and prior attacks will help select those at higher risk for MOGAD and may avoid
testing in low probability situations in which the risk of false positivity increases. Given MOG-IgG has
only become available recently, there are large numbers of patients with MOGAD with serial imaging
available who may have not been tested yet for MOG-IgG and for whom our findings are directly
applicable. Similarly, complete or near complete T2-lesion resolution can be used, in addition to other
parameters when a positive MOG-IgG test is encountered to help distinguish true versus false positive
results, particularly when antibody titer is low and the risk of false positivity is higher (up to a quarter of
positive results may be false positives when the test is performed indiscriminately in a real-life clinical
setting).32
Awareness of the variability in CNS demyelinating lesion evolution across these disorders over time is
important for optimal selection of outcome measures in clinical trials. Development of new or enlarging
T2-lesions on brain MRI is often used as a primary outcome measure in MS as it allows assessment of
inter-attack disease activity, but relies on the tendency of MS lesions to persist over time. A similar
approach for MOGAD would be more problematic given the high frequency of lesion resolution as one or
Copyright © 2021 The Author(s). Published by Wolters Kluwer Health, Inc. on behalf of the American Academy of Neurology.
more transient T2-lesions could appear and disappear between interval MRI scans. This could also
contribute to the low incidence of new asymptomatic T2-lesions reported in children with MOGAD in a
prior study.33 Notably, lesion resolution in this study was not associated with less disability compared to
MOGAD patients in whom lesions persisted, suggesting T2-abnormalities alone do not properly reflect
functional impairment in MOGAD.34 A similar clinical-MRI discrepancy in MOGAD is sometimes seen
during severe attacks accompanied by normal MRI.35 Finally, no patients had persistent gadolinium
enhancement of lesions after 6 months and its presence should be a red flag for alternative non-
demyelinating etiologies as illustrated by a prior study that showed it favored sarcoid myelopathy over
AQP4-IgG-NMOSD myelitis.36
The mechanisms that underlay the tendency of MOGAD lesions to resolve completely are not fully
understood. The timing of lesion resolution in MOGAD patients varied from days to many months and
the lack of predefined intervals of MRI scans limits its assessment as it is difficult to determine at what
timepoint between two MRIs the lesions may have resolved. The frequency of a normal MRI without
residual T2-lesions was greater in the spine than brain and likely reflects the much higher number of brain
than spine lesions with each attack allowing greater number of opportunities to leave a residual scar (e.g.,
Figure 2, panel D). It is also notable that lesion resolution was similar before and after 18 years of age.
Together, these observations suggest that lesion resolution is not just a time or age-dependent process but
other lesion- and/or patient-specific factors are likely involved. Demyelinating lesions in AQP4-IgG-
NMOSD and MOGAD showed a similarly large reduction in size some of which may reflect greater
reduction in edema from large edematous T2-lesions (particularly in the spinal cord) when compared to
MS. However, lesion resolution was common only with MOGAD. Greater remyelination capacity, less
neuronal loss, and/or a predominant functional versus structural damage in MOGAD compared to AQP4-
IgG-NMOSD and MS might account for this difference. Occasionally, severe edema with AQP4-IgG-
NMOSD myelitis lesions in a confined spinal compartment could lead to secondary ischemia and play a
role in lesion persistence, although lesion persistence was similarly observed in brain lesions associated
with AQP4-IgG and other factors such as complement mediated tissue destruction are likely to contribute
to residual scarring.37 This is also in line with the rarer occurrence of residual brain parenchymal T1-
Copyright © 2021 The Author(s). Published by Wolters Kluwer Health, Inc. on behalf of the American Academy of Neurology.
hypointensity after MOGAD which supports better tissue healing and potentially less destructive lesions
leading to more favorable outcomes in MOGAD. Obtaining further insight on lesion evolution from
pathological studies is limited as biopsy/autopsy assessments are generally from acute severe attacks with
only scarce available data on the pathologic characteristics of lesions between attacks.38.39,40
This study is limited by the retrospective nature and lack of standardized MRI assessment of CNS lesions
at a regular time interval on the same MRI scanner. While such studies are needed they may be difficult to
be performed. Acquiring attack MRIs which may be undertaken at various locations (e.g., in the hospital
setting) and obtaining research MRIs in the acute setting can be complicated with ethical issues if general
anesthesia is required (e.g., encephalopathic patients). Moreover, given the rarity of MOGAD and AQP4-
IgG-NMOSD and requirement of no interval attacks involving that same region, prospective MRI studies
with sufficient power will be costly, likely require multiple centers and could take a long time as
illustrated by this retrospective single center study encompassing >15 years. Thus, this study provides
valuable data while such prospective studies are awaited. The use of advanced MRI sequences and/or
higher magnetic field scans could improve the detection of residual abnormalities not appreciable on
conventional sequences but a benefit of our study with conventional MRI is the direct reproducibility to
current clinical practice. Some technical aspects might bias lesion resolution assessment (e.g., we
compared acute and follow-up images on different MRI scans and the variation in axial/sagittal cuts may
miss small residual lesions), but the magnitude of the differences we found between the three groups
could not be explained by these technical issues (Figures 1-4). Moreover, although comparing different
MRI exams over time introduces variability in imaging equipment, software, patient positioning, series
techniques and slice selection, these would be expected to be random variables without systematic bias.
Patients received many different treatments after the initial attack and had variable follow-up durations
that might have contributed to the observed differences in the three groups. However, both acute and
maintenance therapy were very similar in patients with AQP4-IgG-NMOSD and MOGAD (Table1), plus
MOGAD patients had the shorter time interval between acute and follow-up MRI (Table 2, Table 3) and
thus timing did not explain their higher frequency of lesion resolution. The proportion of MS patients
treated with anti-CD20 drugs was relatively low in our study but these drugs might increase the frequency
Copyright © 2021 The Author(s). Published by Wolters Kluwer Health, Inc. on behalf of the American Academy of Neurology.

of MS lesion resolution. Future studies will better clarify the specific impact of different acute and
maintenance immunosuppressive agents (e.g., anti-CD20 versus oral immunosuppressants [azathioprine
or mycophenolate mofetil] versus MS disease-modifying agents) on MRI lesion evolution. Chronic T2-
lesions preceding the initial acute MRI could influence lesion resolution but our study design requiring
the first ever clinical attack attributable to the region of interest reduced the risk of inclusion of such
lesions. Age may affect the capacity for lesion resolution but this did not differ between children and
adults this study, although further studies with larger numbers of pediatric patients are needed. Lastly,
evolution of optic nerve lesions on MRI was not analyzed in this study due to the limited availability of
dedicated orbital sequences and the technical issues can limit the reliability of T2-lesion detection in the
optic nerves.
In conclusion, this comparative study on the temporal evolution of MRI lesions associated to MOGAD,
AQP4-IgG-NMOSD, and MS has relevance for clinical practice and our understanding of the
pathogenesis of these disorders.
Copyright © 2021 The Author(s). Published by Wolters Kluwer Health, Inc. on behalf of the American Academy of Neurology.

Appendix 1 - Authors
Name Location Contribution
Elia Sechi Mayo Clinic,
Rochester, MN;
University of
Verona, Verona,
Italy
Designed and
conceptualized the study;
drafted the manuscript and
figures; analyzed and
interpreted the data.
Karl N. Krecke Mayo Clinic,
Rochester, MN
Interpreted the data; revised
the manuscript for
intellectual content.
Steven Messina Mayo Clinic,
Rochester, MN
Interpreted the data; revised
the manuscript for
intellectual content.
Marina Buciuc Mayo Clinic,
Rochester, MN
Interpreted the data; revised
the manuscript for
intellectual content.
Sean J. Pittock Mayo Clinic,
Rochester, MN
Interpreted the data; revised
the manuscript for
intellectual content.
John J. Chen Mayo Clinic,
Rochester, MN
Interpreted the data; revised
the manuscript for
intellectual content.
Brian G.
Weinshenker
Mayo Clinic,
Rochester, MN
Interpreted the data; revised
the manuscript for
intellectual content.
Copyright © 2021 The Author(s). Published by Wolters Kluwer Health, Inc. on behalf of the American Academy of Neurology.
A. Sebastian Lopez-
Chiriboga
Mayo Clinic,
Jacksonville, FL
Interpreted the data; revised
the manuscript for
intellectual content.
Claudia F.
Lucchinetti
Mayo Clinic,
Rochester, MN
Interpreted the data; revised
the manuscript for
intellectual content.
Nicholas L.
Zalewski
Mayo Clinic,
Rochester, MN
Interpreted the data; revised
the manuscript for
intellectual content.
Jan Mendelt Tillema Mayo Clinic,
Scottsdale, AZ
Interpreted the data; revised
the manuscript for
intellectual content.
Amy Kunchok Mayo Clinic,
Rochester, MN
Interpreted the data; revised
the manuscript for
intellectual content.
Salvatore Monaco University of
Verona, Verona,
Italy
Interpreted the data; revised
the manuscript for
intellectual content.
Padraig P. Morris Mayo Clinic,
Rochester, MN
Interpreted the data; revised
the manuscript for
intellectual content.
James P. Fryer Mayo Clinic,
Rochester, MN
Interpreted the data; revised
the manuscript for
intellectual content.
Adam Nguyen Mayo Clinic,
Rochester, MN
Interpreted the data; revised
the manuscript for
intellectual content.
Copyright © 2021 The Author(s). Published by Wolters Kluwer Health, Inc. on behalf of the American Academy of Neurology.

Tammy Greenwood Mayo Clinic,
Rochester, MN
Interpreted the data; revised
the manuscript for
intellectual content.
Stephanie B. Syc-
Mazurek
Mayo Clinic,
Rochester, MN
Interpreted the data; revised
the manuscript for
intellectual content.
B. Mark Keegan Mayo Clinic,
Rochester, MN
Interpreted the data; revised
the manuscript for
intellectual content.
Eoin P. Flanagan Mayo Clinic,
Rochester, MN
Designed and
conceptualized the study;
analyzed and interpreted
the data; study supervision.
Acknowledgement
This study was supported by the Gianesini Research Grant from UniCredit Foundation and University of
Verona, the Mayo Clinic Center for Multiple Sclerosis and Autoimmune Neurology, and the NIH
National Institute of Neurological Disorders and Stroke (R01NS113828).
Copyright © 2021 The Author(s). Published by Wolters Kluwer Health, Inc. on behalf of the American Academy of Neurology.

References
1. Flanagan EP. Neuromyelitis Optica Spectrum Disorder and Other Non-Multiple Sclerosis Central
Nervous System Inflammatory Diseases. Continuum (Minneap Minn) 2019;25:815-844.
2. Lennon VA, Wingerchuk DM, Kryzer TJ, et al. A serum autoantibody marker of neuromyelitis
optica: distinction from multiple sclerosis. Lancet 2004;364:2106-2112.
3. O'Connor KC, McLaughlin KA, De Jager PL, et al. Self-antigen tetramers discriminate between
myelin autoantibodies to native or denatured protein. Nat Med 2007;13:211-217.
4. Reindl M, Waters P. Myelin oligodendrocyte glycoprotein antibodies in neurological disease. Nat
Rev Neurol 2019;15:89-102.
5. Dubey D, Pittock SJ, Krecke KN, et al. Clinical, Radiologic, and Prognostic Features of Myelitis
Associated With Myelin Oligodendrocyte Glycoprotein Autoantibody. JAMA Neurol 2018.
6. Jurynczyk M, Geraldes R, Probert F, et al. Distinct brain imaging characteristics of autoantibody-
mediated CNS conditions and multiple sclerosis. Brain 2017;140:617-627.
7. Mariano R, Messina S, Kumar K, Kuker W, Leite MI, Palace J. Comparison of Clinical Outcomes of
Transverse Myelitis Among Adults With Myelin Oligodendrocyte Glycoprotein Antibody vs Aquaporin-4
Antibody Disease. JAMA Netw Open 2019;2:e1912732.
8. Asnafi S, Morris PP, Sechi E, et al. The frequency of longitudinally extensive transverse myelitis in
MS: A population-based study. Mult Scler Relat Disord 2020;37:101487.
9. Cobo-Calvo A, Ruiz A, Maillart E, et al. Clinical spectrum and prognostic value of CNS MOG
autoimmunity in adults: The MOGADOR study. Neurology 2018;90:e1858-e1869.
10. Kim HJ, Paul F, Lana-Peixoto MA, et al. MRI characteristics of neuromyelitis optica spectrum
disorder: an international update. Neurology 2015;84:1165-1173.
11. Ramanathan S, Mohammad S, Tantsis E, et al. Clinical course, therapeutic responses and
outcomes in relapsing MOG antibody-associated demyelination. J Neurol Neurosurg Psychiatry
2018;89:127-137.
12. Lopez-Chiriboga S, Sechi E, Buciuc M, et al. Long-term Outcomes in Patients With Myelin
Oligodendrocyte Glycoprotein Immunoglobulin G-Associated Disorder. JAMA Neurol 2020.
13. Wingerchuk DM, Pittock SJ, Lucchinetti CF, Lennon VA, Weinshenker BG. A secondary
progressive clinical course is uncommon in neuromyelitis optica. Neurology 2007;68:603-605.
14. Paolilo RB, Hacohen Y, Yazbeck E, et al. Treatment and outcome of aquaporin-4 antibody-
positive NMOSD: A multinational pediatric study. Neurol Neuroimmunol Neuroinflamm 2020;7.
15. Filippi M, Preziosa P, Banwell BL, et al. Assessment of lesions on magnetic resonance imaging in
multiple sclerosis: practical guidelines. Brain 2019;142:1858-1875.
16. Kitley J, Waters P, Woodhall M, et al. Neuromyelitis optica spectrum disorders with aquaporin-4
and myelin-oligodendrocyte glycoprotein antibodies: a comparative study. JAMA Neurol 2014;71:276-
283.
17. Kim SH, Huh SY, Hyun JW, et al. A longitudinal brain magnetic resonance imaging study of
neuromyelitis optica spectrum disorder. PLoS One 2014;9:e108320.
18. Jarius S, Paul F, Aktas O, et al. MOG encephalomyelitis: international recommendations on
diagnosis and antibody testing. J Neuroinflammation 2018;15:134.
19. Thompson AJ, Banwell BL, Barkhof F, et al. Diagnosis of multiple sclerosis: 2017 revisions of the
McDonald criteria. Lancet Neurol 2018;17:162-173.
20. Wingerchuk DM, Banwell B, Bennett JL, et al. International consensus diagnostic criteria for
neuromyelitis optica spectrum disorders. Neurology 2015;85:177-189.
21. Banks SA, Morris PP, Chen JJ, et al. Brainstem and cerebellar involvement in MOG-IgG-
associated disorder versus aquaporin-4-IgG and MS. J Neurol Neurosurg Psychiatry 2020.
22. Waters PJ, McKeon A, Leite MI, et al. Serologic diagnosis of NMO: a multicenter comparison of
aquaporin-4-IgG assays. Neurology 2012;78:665-671; discussion 669.
23. Mariano R, Messina S, Roca-Fernandez A, Leite MI, Kong Y, Palace JA. Quantitative spinal cord
MRI in MOG-antibody disease, neuromyelitis optica and multiple sclerosis. Brain 2020.
Copyright © 2021 The Author(s). Published by Wolters Kluwer Health, Inc. on behalf of the American Academy of Neurology.
24. Wingerchuk DM, Hogancamp WF, O'Brien PC, Weinshenker BG. The clinical course of
neuromyelitis optica (Devic's syndrome). Neurology 1999;53:1107-1114.
25. Absinta M, Sati P, Masuzzo F, et al. Association of Chronic Active Multiple Sclerosis Lesions With
Disability In Vivo. JAMA Neurol 2019.
26. Lucchinetti CF, Bruck W, Rodriguez M, Lassmann H. Distinct patterns of multiple sclerosis
pathology indicates heterogeneity on pathogenesis. Brain Pathol 1996;6:259-274.
27. Sechi E, Keegan BM, Kaufmann TJ, Kantarci OH, Weinshenker BG, Flanagan EP. Unilateral motor
progression in MS: Association with a critical corticospinal tract lesion. Neurology 2019;93:e628-e634.
28. Sechi E, Messina S, Keegan BM, et al. Critical spinal cord lesions associate with secondary
progressive motor impairment in long-standing MS: A population-based case-control study. Mult Scler
2020:1352458520929192.
29. Keegan BM, Kaufmann TJ, Weinshenker BG, et al. Progressive solitary sclerosis: Gradual motor
impairment from a single CNS demyelinating lesion. Neurology 2016;87:1713-1719.
30. Lechner C, Baumann M, Hennes EM, et al. Antibodies to MOG and AQP4 in children with
neuromyelitis optica and limited forms of the disease. J Neurol Neurosurg Psychiatry 2016;87:897-905.
31. Waters P, Fadda G, Woodhall M, et al. Serial Anti-Myelin Oligodendrocyte Glycoprotein
Antibody Analyses and Outcomes in Children With Demyelinating Syndromes. JAMA Neurol 2019.
32. Sechi EB, M.; Pittock, S.J.; Chen, J.J.; Fryer, J.P.; Jenkins, S.M.; Budhram, A.; Weinshenker, B.G.;
Lopez-Chiriboga, A.S.; Tillema, J.; McKeon, A.; Mills, J.R.; Tobin, W.O.; Flanagan, E.P. Positive Predictive
Value of Myelin Oligodendrocyte Glycoprotein Autoantibody Testing. JAMA Neurol 2021.
33. Fadda G, Banwell B, Waters P, et al. Silent New Brain MRI Lesions in Children with MOG-
Antibody Associated Disease. Ann Neurol 2020.
34. Buciuc M, Sechi E, Flanagan EP, Lopez-Chiriboga AS. Unfavorable outcome in highly relapsing
MOGAD encephalitis. J Neurol Sci 2020;418:117088.
35. Sechi E, Krecke KN, Pittock SJ, et al. Frequency and characteristics of MRI-negative myelitis
associated with MOG autoantibodies. Mult Scler 2020:1352458520907900.
36. Flanagan EP, Kaufmann TJ, Krecke KN, et al. Discriminating long myelitis of neuromyelitis optica
from sarcoidosis. Ann Neurol 2016;79:437-447.
37. Hinson SR, Romero MF, Popescu BF, et al. Molecular outcomes of neuromyelitis optica (NMO)-
IgG binding to aquaporin-4 in astrocytes. Proc Natl Acad Sci U S A 2012;109:1245-1250.
38. Hoftberger R, Guo Y, Flanagan EP, et al. The pathology of central nervous system inflammatory
demyelinating disease accompanying myelin oligodendrocyte glycoprotein autoantibody. Acta
Neuropathol 2020;139:875-892.
39. Lucchinetti CF, Guo Y, Popescu BF, Fujihara K, Itoyama Y, Misu T. The pathology of an
autoimmune astrocytopathy: lessons learned from neuromyelitis optica. Brain Pathol 2014;24:83-97.
40. Takai Y, Misu T, Kaneko K, et al. Myelin oligodendrocyte glycoprotein antibody-associated
disease: an immunopathological study. Brain 2020;143:1431-1446.
Copyright © 2021 The Author(s). Published by Wolters Kluwer Health, Inc. on behalf of the American Academy of Neurology.

Figure 1 – Examples of sagittal and axial area measurements for spinal cord and brain T2-lesions
The left part of the figure shows sagittal (A.a, A.b, B.a) and axial (A.c-4; B.b-3) T2-weighted images of a
longitudinally extensive spinal cord lesion associated with AQP4-IgG-NMOSD acutely (A) and at
follow-up (B). The largest acute axial area of the lesion was manually outlined acutely on sagittal (A.b,
yellow outline) and axial (A.d, yellow outline) images, and at follow-up (B.c) to determine lesion
resolution/reduction. In the center of the figure, an acute brainstem T2-hyperintense lesion associated
with MOGAD is shown on axial FLAIR images (C.a). The largest axial T2-lesion area manually outlined
acutely (C.b, yellow outline) resolves to undetectable at follow-up MRI (D). On the right, an MS myelitis
T2-hyperintense lesion is shown (E.a, E.b) with the largest area of the T2-hyperintense lesion outlined
acutely on both sagittal (E.b, yellow outline) and axial (E.d, yellow outline) images. Despite being smaller
acutely compared to the lesions associated with AQP4-IgG-NMOSD and MOGAD, the MS lesion only
shows moderate reduction in size at follow-up, where it is still clearly visible on both sagittal (F.a, yellow
outline) and axial (F.b, F.c, yellow outline) images.
Copyright © 2021 The Author(s). Published by Wolters Kluwer Health, Inc. on behalf of the American Academy of Neurology.
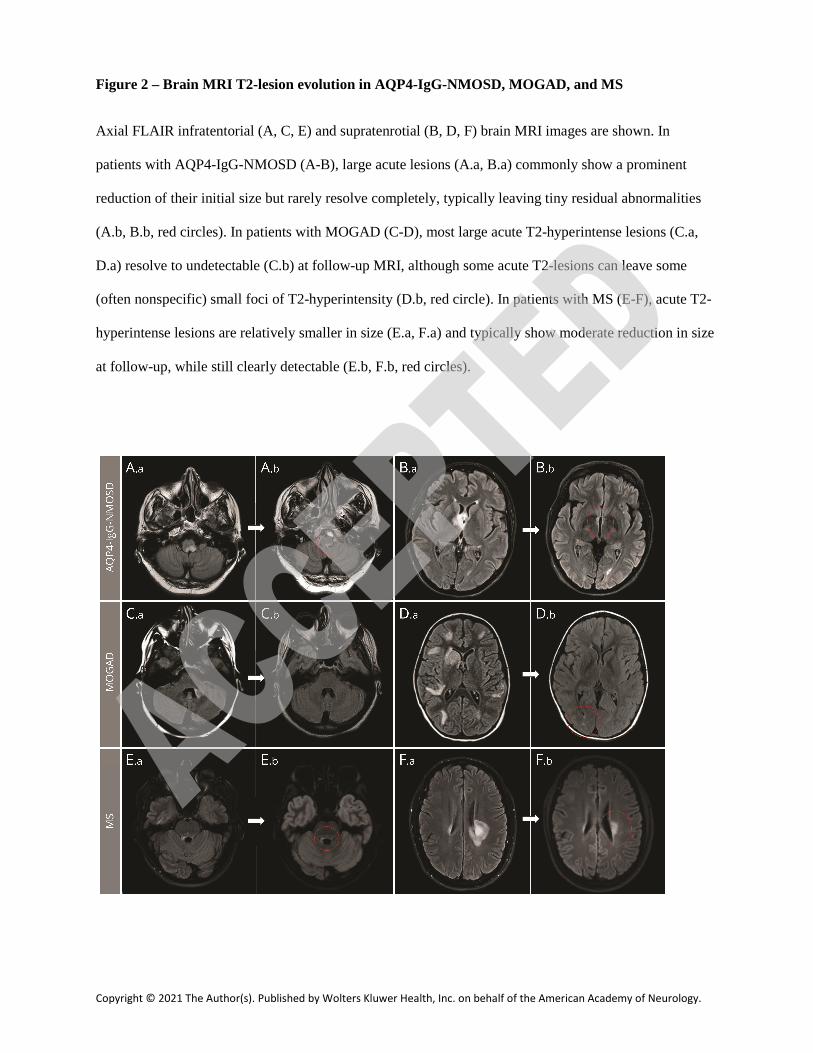
Figure 2 – Brain MRI T2-lesion evolution in AQP4-IgG-NMOSD, MOGAD, and MS
Axial FLAIR infratentorial (A, C, E) and supratenrotial (B, D, F) brain MRI images are shown. In
patients with AQP4-IgG-NMOSD (A-B), large acute lesions (A.a, B.a) commonly show a prominent
reduction of their initial size but rarely resolve completely, typically leaving tiny residual abnormalities
(A.b, B.b, red circles). In patients with MOGAD (C-D), most large acute T2-hyperintense lesions (C.a,
D.a) resolve to undetectable (C.b) at follow-up MRI, although some acute T2-lesions can leave some
(often nonspecific) small foci of T2-hyperintensity (D.b, red circle). In patients with MS (E-F), acute T2-
hyperintense lesions are relatively smaller in size (E.a, F.a) and typically show moderate reduction in size
at follow-up, while still clearly detectable (E.b, F.b, red circles).
Copyright © 2021 The Author(s). Published by Wolters Kluwer Health, Inc. on behalf of the American Academy of Neurology.
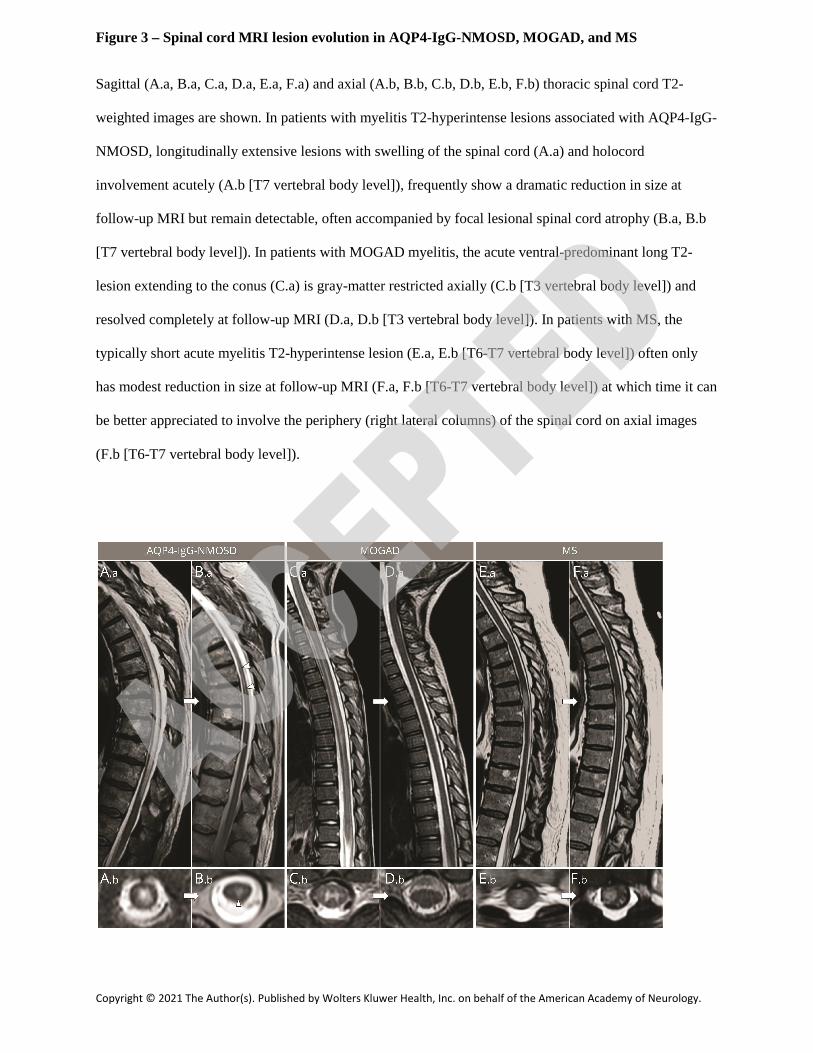
Figure 3 – Spinal cord MRI lesion evolution in AQP4-IgG-NMOSD, MOGAD, and MS
Sagittal (A.a, B.a, C.a, D.a, E.a, F.a) and axial (A.b, B.b, C.b, D.b, E.b, F.b) thoracic spinal cord T2-
weighted images are shown. In patients with myelitis T2-hyperintense lesions associated with AQP4-IgG-
NMOSD, longitudinally extensive lesions with swelling of the spinal cord (A.a) and holocord
involvement acutely (A.b [T7 vertebral body level]), frequently show a dramatic reduction in size at
follow-up MRI but remain detectable, often accompanied by focal lesional spinal cord atrophy (B.a, B.b
[T7 vertebral body level]). In patients with MOGAD myelitis, the acute ventral-predominant long T2-
lesion extending to the conus (C.a) is gray-matter restricted axially (C.b [T3 vertebral body level]) and
resolved completely at follow-up MRI (D.a, D.b [T3 vertebral body level]). In patients with MS, the
typically short acute myelitis T2-hyperintense lesion (E.a, E.b [T6-T7 vertebral body level]) often only
has modest reduction in size at follow-up MRI (F.a, F.b [T6-T7 vertebral body level]) at which time it can
be better appreciated to involve the periphery (right lateral columns) of the spinal cord on axial images
(F.b [T6-T7 vertebral body level]).
Copyright © 2021 The Author(s). Published by Wolters Kluwer Health, Inc. on behalf of the American Academy of Neurology.

Figure 4 – Graphical Comparison of MRI evolution of T2-lesions in the three disease groups
The bar graphs in the top half of the figure (A) show the different frequency of the analyzed parameters in
patients with AQP4-IgG-NMOSD (dark blue bars), MOGAD (light blue bars), and MS (green bars) in the
brain and spinal cord. Despite the largest reduction in size was observed in AQP4-IgG-NMOSD and
MOGAD associated lesions, only the latter show complete resolution of MRI abnormalities at follow-up
in the majority of cases. On the contrary, MS lesions showed the smallest reduction in size at follow-up
and, similarly to AQP4-IgG-NMOSD lesions, were unlikely to resolve completely. Statistically
significant differences between two groups are indicated by the asterisks on the top of the bars (***). The
bottom part of the figure (B) shows the median largest area for brain and spinal cord lesions axially, and
sagittally for the spinal cord only, acutely and at follow-up MRI for the three groups. The exact p-values
for different comparisons are shown in Table 2 and Table 3.
Copyright © 2021 The Author(s). Published by Wolters Kluwer Health, Inc. on behalf of the American Academy of Neurology.

Table 1 – Demographics and clinical characteristics of the 156 included patients
AQP4-IgG-NMOSD
MOGAD MS p-AQP4-IgG-
NMOSD vs
MOGAD
p-MOGAD
vs MS
p-AQP4-IgG-
NMOSD vs MS
Patients 51 38 67 - - -
Median age at initial attack (range)
53 (10-78) 25 (2-74) 37 (16-61) <0.0001 0.002 <0.0001
Pediatric (age <18)
2/51 (4%) 14/38 (37%) 2/67 (3%) 0.0001 <0.0001 1.0
Female sex 41/51 (80%) 17/38 (45%) 51/67 (76%) 0.001 0.002 0.7
CSF OCB (≥2) 4/25 (16%) 3/23 (13%) 31/36 (86%) 1.0 <0.0001 <0.0001
Total number of attacks
55 46 71 - - -
Brain attacks 21 18 42 - - -
Myelitis attacks 34 28 29 - - -
Initial attack as disease presentation*
30/51 (59%) 31/38 (82%) 41/67 (61%) 0.04 0.05 0.9
Median EDSS at attack nadir (range)
6 (2-9.5) 6 (3-9) 3 (0-7) 0.7 <0.0001 <0.0001
Acute treatment 46/50 (92%) 38/38 (100%) 46/67 (69%) 0.3 <0.0001 0.001
Corticosteroids 45 36 46 - - -
PLEX 17 7 3 - - -
IVIG 2 8 0 - - -
Maintenance therapy
47/51 (92%) 30/38 (79%) 51/67 (76%) 0.1 0.8 0.03
Corticosteroids 32 23 9 - - -
MMF, AZA 32 13 1 - - -
Anti-CD20** 21 7 3 - - -
β-IFN, GA 2 4 38 - - -
DMF, FGD, NTZ, TER
1 1 25 - - -
Copyright © 2021 The Author(s). Published by Wolters Kluwer Health, Inc. on behalf of the American Academy of Neurology.
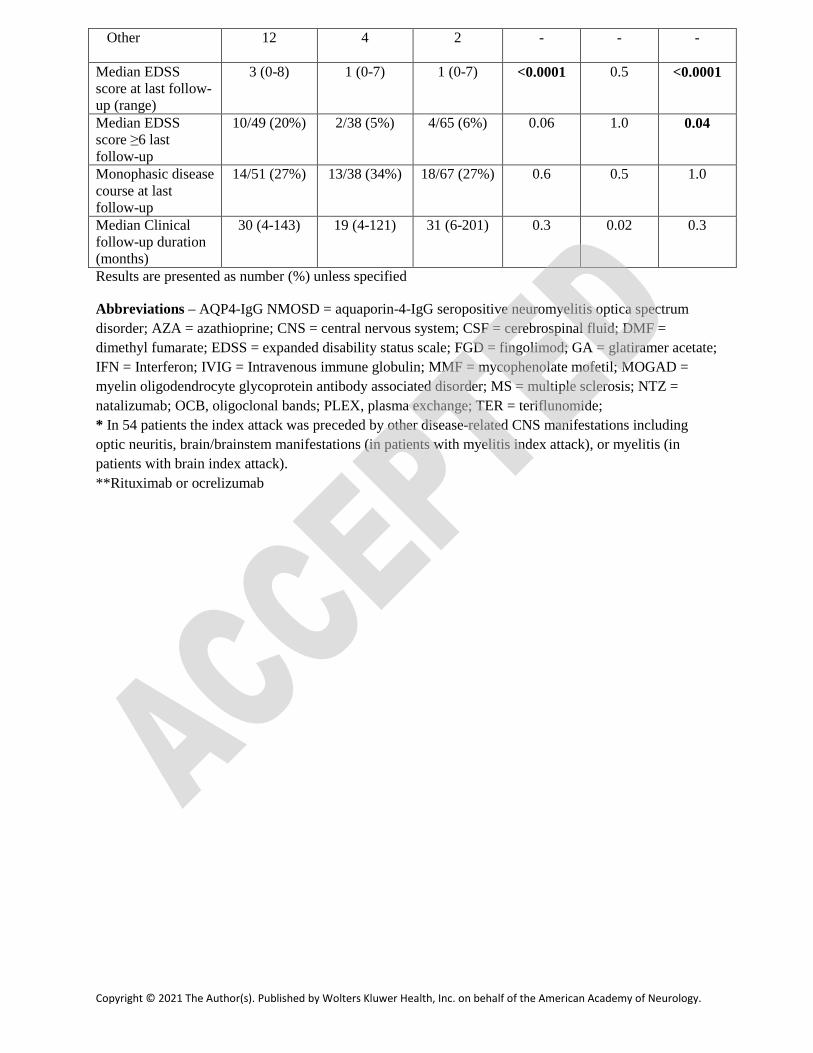
Other 12 4 2 - - -
Median EDSS score at last follow-up (range)
3 (0-8) 1 (0-7) 1 (0-7) <0.0001 0.5 <0.0001
Median EDSS score ≥6 last follow-up
10/49 (20%) 2/38 (5%) 4/65 (6%) 0.06 1.0 0.04
Monophasic disease course at last follow-up
14/51 (27%) 13/38 (34%) 18/67 (27%) 0.6 0.5 1.0
Median Clinical follow-up duration (months)
30 (4-143) 19 (4-121) 31 (6-201) 0.3 0.02 0.3
Results are presented as number (%) unless specified
Abbreviations – AQP4-IgG NMOSD = aquaporin-4-IgG seropositive neuromyelitis optica spectrum disorder; AZA = azathioprine; CNS = central nervous system; CSF = cerebrospinal fluid; DMF = dimethyl fumarate; EDSS = expanded disability status scale; FGD = fingolimod; GA = glatiramer acetate; IFN = Interferon; IVIG = Intravenous immune globulin; MMF = mycophenolate mofetil; MOGAD = myelin oligodendrocyte glycoprotein antibody associated disorder; MS = multiple sclerosis; NTZ = natalizumab; OCB, oligoclonal bands; PLEX, plasma exchange; TER = teriflunomide; * In 54 patients the index attack was preceded by other disease-related CNS manifestations including optic neuritis, brain/brainstem manifestations (in patients with myelitis index attack), or myelitis (in patients with brain index attack). **Rituximab or ocrelizumab
Copyright © 2021 The Author(s). Published by Wolters Kluwer Health, Inc. on behalf of the American Academy of Neurology.

Table 2 – MRI characteristics of brain attacks acutely and at follow-up
AQP4-IgG-NMOSD
MOGAD MS p-AQP4-IgG-
NMOSD vs
MOGAD
p-MOGAD
vs MS
p-AQP4-IgG-
NMOSD vs MS
Brain attacks (N) 21 18 42 - - -
Number of brain MRI T2-lesions >15 on attack MRI
9/21 (43%) 10/18 (56%) 20/42 (48%) 0.5 0.8 0.8
Infratentorial T2-lesions on attack MRI
19/21 (90%) 14/18 (78%) 36/42 (86%) 0.4 0.5 0.7
Axial area of the index T2-lesion in mm2 on attack MRI
167 (14-635) 213 (66-873) 58 (8-754) 0.1 <0.001 0.01
Gadolinium enhancement on attack MRI
13/20 (65%) 8/18 (44%) 29/39 (74%) 0.3 0.03 0.4
Resolution of the index T2-lesion at follow-up
3/21 (14%) 13/18 (72%) 7/42 (17%) <0.001 <0.001 1.0
Normal brain MRI at follow-up
2/21 (10%) 7/18 (39%) 2/42 (5%) 0.05 0.002 0.6
Residual axial area of the index T2-lesion in mm2 on follow-up MRI
26 (0-247) 0 (0-114) 13 (0-248) 0.002 0.01 0.1
Delta axial area reduction of the index T2-lesion in mm2 from acute MRI*
104 (0.7-597) 213 (55-873) 36 (0-506) 0.02 <0.001 0.01
% axial area reduction of the index T2-lesion from acute MRI**
78 (4-100) 100 (63-100) 75 (0-100) <0.001 <0.001 0.8
Persistent enhancement on follow-up MRI
0/13 (0%) 0/8 (0%) 0/29 (0%) - - -
Residual T1-hypointensity for the index lesion
9/21 (43%) 0/18 (0%) 20/42 (48%) 0.002 <0.001 0.8
Any residual brain T1-hypointensity at follow-up MRI
12/21 (57%) 3/18 (17%) 35/42 (83%) 0.02 <0.001 0.03
Time interval from acute to follow up MRI in months
43 (6-143) 21 (10-109) 37 (7-192) 0.9 0.3 0.5
Results are presented as median (range) or N. (%), as appropriate
Copyright © 2021 The Author(s). Published by Wolters Kluwer Health, Inc. on behalf of the American Academy of Neurology.

Abbreviations – AQP4-IgG NMOSD = aquaporin-4-IgG seropositive neuromyelitis optica spectrum disorder; MOGAD = myelin oligodendrocyte glycoprotein antibody associated disorder; MS = multiple sclerosis. *Delta area reductions were calculated for each patient as (acute area - follow-up area) **% area reductions were calculated as (acute area - follow-up area)/acute area
Copyright © 2021 The Author(s). Published by Wolters Kluwer Health, Inc. on behalf of the American Academy of Neurology.

Table 3 – MRI characteristics of myelitis attacks acutely and at last follow-up
AQP4-IgG-NMOSD
MOGAD MS p-AQP4-IgG-
NMOSD vs
MOGAD
p-MOGAD
vs MS
p-AQP4-IgG-
NMOSD vs MS
Spinal cord attacks (N)
34 28 29 - - -
Number of spinal cord T2-lesions on attack MRI
1 (1-5) 1 (1-4) 2 (1-6) 0.046 0.2 0.001
Sagittal length of the index T2-lesion in VBS on attack MRI
6.25 (1-19) 4.5 (0.5-19) 1 (0.5-2) 0.2 <0.001 <0.001
Sagittal area of the index T2-lesion in mm2 on attack MRI
437 (46-2120)
279 (17-888) 64 (19-229) 0.05 <0.001 <0.001
Axial area of the index T2-lesion in mm2 on attack MRI
39 (9-118) 45 (4-100) 21 (9-62) 0.8 0.005 <0.001
Gadolinium enhancement on attack MRI
32/34 (94%) 15/28 (54%) 25/28 (89%) <0.001 0.01 0.7
Resolution of the index T2-lesion on follow-up MRI
0/34 (0%) 22/28 (79%) 0/29 (0%) <0.001 <0.001 -
Normal spinal cord MRI at follow-up
0/34 (0%) 22/28 (79%) 0/29 (0%) <0.001 <0.001 -
Residual sagittal length of the index T2-lesion in VBS on follow-up MRI
2.5 (0-7) 0 (0-7) 0.5 (0-2) <0.001 <0.001 <0.001
Residual sagittal area of the index T2-lesion in mm2 on follow-up MRI
87 (0-513) 0 (0-237) 34 (5-229) <0.001 0.001 <0.001
Delta sagittal area reduction of the index T2-lesion in mm2 from acute MRI*
309 (0-1885) 262 (0-888) 23 (0-152) 0.4 <0.001 <0.001
% sagittal area reduction of the index T2-lesion from acute MRI**
74 (0-100) 100 (0-100) 39 (0-94) <0.001 <0.001 <0.001
Residual axial area of the index T2-lesion in mm2 on follow-up MRI
9 (0-30) 0 (0-60) 10 (0-32) <0.001 <0.001 0.6
Delta axial area reduction of the index T2-lesion in
23 (1-118) 34 (4-100) 10 (0-48) 0.3 <0.001 <0.001
Copyright © 2021 The Author(s). Published by Wolters Kluwer Health, Inc. on behalf of the American Academy of Neurology.

mm2 from acute MRI* % axial area reduction of the index T2-lesion from acute MRI**
71 (0-100) 100 (33-100) 53 (0-100) <0.001 <0.001 0.001
Persistent enhancement on follow-up MRI
0/32 (0%) 0/15 (0%) 0/25 (0%) - - -
Residual T1-hypointensity for the index lesion
3/34 (9%) 0/28 (0%) 1/29 (3%) 0.2 1.0 0.6
Any residual spinal cord T1-hypointensity at follow-up MRI
3/34 (9%) 0/28 (0%) 1/29 (3%) 0.2 1.0 0.6
Time interval from acute to follow up MRI in months
31 (6-138) 15 (7-104) 26 (6-201) 0.1 0.04 0.6
Results are presented as median (range) or N. (%), as appropriate
Abbreviations: AQP4-IgG NMOSD = aquaporin-4-IgG seropositive neuromyelitis optica spectrum disorder; MOGAD = myelin oligodendrocyte glycoprotein antibody associated disorder; MS = multiple sclerosis; VBS = vertebral body segments. *Delta area reductions were calculated for each patient as (acute area - follow-up area) **% area reductions were calculated as (acute area - follow-up area)/acute area
Copyright © 2021 The Author(s). Published by Wolters Kluwer Health, Inc. on behalf of the American Academy of Neurology.
DOI 10.1212/WNL.0000000000012467 published online July 14, 2021Neurology
Elia Sechi, Karl N. Krecke, Steven A. Messina, et al. Demyelinating Disorders
Comparison of MRI Lesion Evolution in Different Central Nervous System
This information is current as of July 14, 2021
ServicesUpdated Information &
ullhttp://n.neurology.org/content/early/2021/07/14/WNL.0000000000012467.fincluding high resolution figures, can be found at:
Permissions & Licensing
http://www.neurology.org/about/about_the_journal#permissionsentirety can be found online at:Information about reproducing this article in parts (figures,tables) or in its
Reprints
http://n.neurology.org/subscribers/advertiseInformation about ordering reprints can be found online:
0028-3878. Online ISSN: 1526-632X.Kluwer Health, Inc. on behalf of the American Academy of Neurology.. All rights reserved. Print ISSN:is now a weekly with 48 issues per year. Copyright Copyright © 2021 The Author(s). Published by Wolters
® is the official journal of the American Academy of Neurology. Published continuously since 1951, itNeurology