Embed Size (px)
Citation preview
COMPARISON OF MICROWAVE AND CONVENTIONAL FRYING ON QUALITY ATTRIBUTES AND FAT UPTAKE IN POTATOES
BY
ARCHANA HARSHAD PARIKH
THESIS
Submitted in partial fulfillment of the requirements for the degree of Master of Science in Food Science and Human Nutrition
with a concentration in Food Science in the Graduate College of the
University of Illinois at Urbana-Champaign, 2016
Urbana, Illinois
Adviser:
Associate Professor Pawan S. Takhar

ii
ABSTRACT
Oil content is an important quality attribute in fried products. Oil uptake is influenced by
several interdependent factors that define the final oil content in a fried product. In this
study microwave frying was investigated for its potential in reducing fat content of fried
foods. A comparative analysis of moisture, fat, color and texture was done for
conventional and microwave fried French fries. Experiments were performed in triplicate
for both frying operations at temperatures of 177°C, 185°C and 193°C for time
duration’s of 60, 90 and 120 seconds. Decrease in moisture content was observed with
frying time, but moisture did not significantly differ between the two frying operations.
Fat reduced by 0.08 g/g solids at 185°C and by 0.07 g/g/ solids at 193°C for 120 sec
microwave frying compared to conventional frying. The lightness parameter (L*)
decreased to a lesser extent in microwave frying than conventional frying. The real-time
pressure and temperature profiles indicated that during microwave frying, gage
pressure had greater magnitudes and the temperature increased to boiling point at a
faster rate for microwave frying compared to conventional frying. Negative gage
pressures had higher magnitudes and lasted longer during conventional frying than
microwave frying. Higher magnitude of positive gage pressure for longer frying duration
and lower magnitude of negative pressure in microwave frying than conventional frying
is expected to have caused lower fat uptake with the former frying method than the
latter. For conventional frying, there were no significant differences in the elastic
modulus for all frying temperatures and frying times. Whereas for microwave frying,
significantly lower magnitudes of G(t) were observed at 177°C for 90 secs frying time
compared to 60 secs and 120 secs at the same temperature. Significantly lower
magintudes of G(t) values for MF were also observed at 185°C for 120 secs frying time
compared to 60 and 90 secs at the same temperature. Consumer test confirmed that
reduced fat uptake during microwave frying did not compromise with desirable attributes
of French fries.

iii
ACKNOWLEDGEMENTS
I am extremely grateful to my advisor Dr Pawan Takhar for the opportunity of an
invaluable graduate school experience. Dr Takhar generously and optimistically offered
his guidance and insight on conducting research and also in writing a technical paper.
I am thankful to Dr Nicki Engseth for always making the time to speak with me on
matters big and small. I would also like to thank Dr Hao Feng for providing me with
laboratory resources and equipment for conducting experiments.
I would like to thank Brian Jacobson for his advice and support in conducting frying
experiments at the Food Science and Human Nutrition Pilot Plant. Thanks are extended
to Dr. Youngsoo Lee for advice on using the universal testing machine and Prof. Soo-
Yeun Lee for providing guidance with the sensory testing. I would also like to thank my
lab mate and friend, Ying Zhao for help with the X-Ray imaging and image analysis.
My research project with Jaspreet served as an inspiration to pursue my thesis topic on
microwave frying. Thanks to my lab mates, Jaspreet, Harkirat, Tanjila, Ying and Oguz
for your encouragement during my research. I share happy memories and have had the
joy to work and also learn from each of you.
I am blessed to have very supportive family and friends who have always encouraged
me to have a spirit to pursue my ambitions without hesitation.

iv
TABLE OF CONTENTS
INTRODUCTION………………………………………………………………………………..1
LITERATURE REVIEW………………………………………………………………………...2
MATERIALS AND METHODS……………………………………………….........................9
RESULTS AND DISCUSSIONS……………………………………………………………..15
CONCLUSIONS……………………………………………………………………………….67
REFERENCES…………………………………………………………………………………68
APPENDIX A: NORMALITY TEST AND HISTOGRAMS FOR CONVENTIONAL
FRYING AND MICROWAVE FRYING MOISTURE DATA…………………………….....71
APPENDIX B: NORMALITY TEST AND HISTOGRAMS FOR CONVENTIONAL
FRYING AND MICROWAVE FRYING FAT DATA………………………………………...79
APPENDIX C: NORMALITY TEST AND HISTOGRAMS FOR CONVENTIONAL
FRYING AND MICROWAVE FRYING COLOR DATA…………………………………….87
APPENDIX D: NORMALITY TEST AND HISTOGRAMS FOR CONVENTIONAL
FRYING AND MICROWAVE FRYING STRESS RELAXATION DATA………….........121
APPENDIX E: NORMALITY TEST AND HISTOGRAMS FOR CONVENTIONAL
FRYING AND MICROWAVE FRYING CONSUMER TEST DATA……………….........133
APPENDIX F: IRB APPROVAL LETTER…………………………….………….………..137
APPENDIX G: QUESTIONNAIRE FOR CONSUMER TEST…………………………...139

1
INTRODUCTION
Frying has been employed at home and on an industrial scale since antiquity to produce
foods of unique organoleptic characteristics such as flavor, texture and visual appeal. It
is a complex unit operation involving the immersion of food into hot oil or fat heated to
temperatures above the boiling point of water (Pedreschi 2012). The oil content in fried
products affects their quality characteristics such as flavor and texture. However, the
final oil content in fried foods has also raised health concerns. Frying technology has
been continuously evolving to accommodate these concerns without compromising the
product quality and sensory appeal.
During conventional frying, a negative pressure is formed within the product that
potentially causes oil uptake. The hypothesis of this study was to test whether
microwave frying can create a positive pressure that will help in the reduction of oil
uptake. Hence the primary objective was to analyze comparatively, the quality attributes
(moisture, fat, color and mechanical properties) of conventionally fried and microwave
fried French fries. The second objective was to measure real-time pressure and
temperature during these two frying operations and relate them to fat uptake. The third
objective was to conduct a consumer test to determine the consumer’s liking of
microwave fried French fries in comparison to conventional frying.

2
LITERATURE REVIEW
Frying Mechanisms
An understanding of the mechanisms involved in frying is needed to obtain reduced fat
French fries. The complex processes of the oil uptake mechanisms have been theorized
but not fully understood. There is simultaneous heat and mass transfer that takes place
during frying; heat transfers from the oil to the product, water evaporates from inside of
the product and oil penetrates the product (Krokida and others 2000). Although oil
uptake and moisture removal are closely associated, they are not concurrent events,
but occur sequentially (Bouchon and Pyle 2005). Oil absorption depends on several
factors - initial moisture content, processing (method, duration, and temperature), pre-
treatment of the food (blanching, dehydration, and surface treatments), physiochemical
nature of the food and that of the frying medium (Oztop and others 2007). It was
observed that longer frying time and lower frying temperatures lead to higher oil content
(Dana and Saguy 2006). Oil distribution is also affected by the surface treatments on
the food, initial interfacial tension, and thickness of the crust layer (Saguy and Pinthus
1995). Gamble and Rice (1987) observed that a pre-frying microwave drying treatment
caused swelling and gelatinization of starch in potato slices. This process modified the
moisture distribution due to which oil uptake during frying was restricted to regions of
high moisture content. It was also noted that oil penetration occurs by capillary force
after the fries are removed from the oil and not during the frying process. Hence,
conditions like the temperature at which the potato is removed from the fryer will affect
the total oil uptake in the finished product (Ziaiifar and others 2010). Tortilla chips were
observed to absorb 64% of total oil during the post-frying cooling stages (Moreira and
others 1997).
During the frying of foods, the water present on the surface starts evaporating, and this
leads to the formation of an exterior crust. The moisture in the food is converted into
vapor, giving rise to a positive pressure gradient that stops the oil from entering the
food. (Krokida and others 2000). The moisture escapes by diffusing through the
crevices present in the food, and this movement creates channels for oil uptake (Dana
and Saguy 2006). Saguy and Dana (2003) explained that oil uptake occurs by two

3
mechanisms - continuous replacement of moisture with oil and post frying oil
absorption. During post frying stages, the reduction in temperature aids in the
condensation of vapors, which creates a negative pressure that pulls the oil inside the
product. Therefore, it is important to measure temperature and pressure distributions in
products undergoing frying.
Temperature and Pressure in Fried Foods
Real time temperature measurement at different locations on the product have been
measured using sensors like thermocouples or fiber optic probes. Temperature at the
center of potato samples has been noted to increase linearly with time until the boiling
point of water is attained. Depending on the frying process, the rate of temperature
change varies. Air frying of French fries showed a significantly slower rate of
temperature increase compared to deep fat frying (Teruel and others 2015). Final
moisture content of a fried product is an important quality parameter that affects taste.
High heat transfer rates during frying help to achieve desirable moisture levels ranging
between 38% to 45% on a wet weight basis (Gökmen and others 2006). At higher frying
temperature, moisture removal occurs at a faster rate due to high heat transfer rates.
Sandhu and others (2013) observed that during the initial stages of frying, the rapid
temperature increase is accompanied by an increase in internal pressure. The pressure
maintains these elevated values for as long as evaporation is occurring. There is a
steep drop in pressure during the final stages of frying, and negative gage pressure
values are observed. The gage pressure remains negative even during the post-frying
cooling stages. In the presence of microwaves, there is volumetric heating of the
product which creates a vapor pressure gradient between its center and the outer
surface (Chandrasekaran and others 2013). This high internal vapor pressure allows for
an outward movement of vapor from the inner parts of the product.
Microwave Technology and Examples of its Applications
The growth of industrial microwave processing is owed to Percy Spencer of Raytheon
Corporation, who discovered the principle of using microwaves to heat foods in 1945.
Microwaves are energy containing electromagnetic waves that have an electrical and a

4
magnetic component. Microwaves are recognized by their frequency (f) and wavelength
(λ), and are characterized by having longer wavelength and lower frequencies than
infrared and ordinary light. They are non-ionizing, unlike other regions of the
electromagnetic spectrum such as X-rays, Ultraviolet and Gamma rays. Microwaves
vary from 300 MHz to 300GHz with the corresponding wavelengths of 1m to 1 mm
(Ohlsson and Bengtsson 2001). The microwave heating frequencies that are allowed for
industrial heating purposes vary based on government regulations. In the USA these
are referred to as microwave frequencies for Industrial, Scientific and Medical purposes
(I.S.M). For industrial heating and microwave ovens the frequencies allowed are 915+/-
13 (MHz) with a wavelength of 33.0 (cm) and 2450+/- 50 (MHz) with a wavelength of
12.2 (cm). Microwave ovens for home use usually operate at 2450+/- 50 (MHz).
Foods are heated due to the absorption of microwave energy by the rotating dipolar
water molecules that try to align themselves in the direction of the electric field and also
by interactions of the electric field with the ions present in the food. Due to change in
direction of the electric field, the dipolar molecules randomly collide with surrounding
molecules while trying to orient themselves. This gives rise to thermal agitation or the
rise in temperature of the food. Charged ions also experience forces in the alternating
electric field, which leads to collisions with surrounding particles that cause a heating
effect.
Some applications of microwave heating are in sterilization, tempering, pasteurization,
blanching, drying and in various food processes like baking and thawing to name a few.
Compared to conventional techniques they take less processing times and heat is
generated from within the product.
Commercial success in donut frying has been seen in using microwaves for the first half
of the frying duration (Doona and others 2010). Conventional frying resulted in a dense
and chewy ‘core’ region that had a tendency to stale. As the donuts expand in the hot oil
due to CO2 generated during leavening process, they become better thermal insulators
but this does not stop the microwave heating of the donut interior. This resulted in

5
donuts that had better quality parameters; less fat content, longer shelf life and larger
sizes than those from conventional frying.
The hurdles of conventional drying can be overcome with the use of microwaves to
increases the drying rate and achieve better sensory qualities in some products
(Chandrasekaran and others 2013). Diffusion is the rate limiting factor during the falling
rate period of drying. To overcome this microwave drying can be used during which,
drying of vapors generated inside the product, creates a pressure gradient that drive the
water outside of the product. Due to the volumetric heating, product shrinkage is also
avoided.
Microwave heating combined with other stresses like pH and heat have been used to
pasteurize juices and milk (Kozempel and others 1998). The exact mechanism is not
known but micro-organisms are destroyed at sub lethal temperatures due to selective
heating, electroporation, cell membrane rupture and magnetic field coupling.
Blanching is carried out before the further processing of several foods to firstly
inactivate enzymes that cause unfavorable flavor, color and textural changes and also
to reduce microbial load of foods (Califano and Calvelo, 1987). Blanching the potatoes
prior to frying has been found to reduce oil uptake in some cases due to the
gelatinization of the starch and it also serves to improve qualitative characteristics like
texture and color. Microwave energy can be used in combination with steam or hot
water to hasten the blanching process, reduce costs, carry out internal blanching of the
product and prevent product from shrinking (Smith and Williams 1971).
The processing variables that can be altered during deep fat frying are—frying time,
temperature, potato variety, pretreatment conditions and frying-processing method.
Different approaches such as vacuum frying have been employed to reduce oil content
in fried potatoes while achieving desirable flavor and texture attributes (Garayo and
Moreira 2002). Microwave usage during vacuum frying of potato chips helped retain
natural product color than frying at a lower temperature for longer time (Su and others
6
2016). Microwave assisted frying of chicken breast can shorten processing times, with
higher heat transfer coefficient and moisture removal rates (Sensoy and others 2013).
The difficulties in using and applying novel processing methods are; the food industry’s
low budget for the research and development and a need for robust design and
mechanical engineering inputs. Optimal conditions of temperature, microwave power
and dielectric properties of the foods have to be determined to efficiently employ this
technology (Doona and others 2010). There are also instances of uneven heating and
thermal runway. To overcome issues with process development and scale up,
computational modeling gives a valuable insight into temperature and electromagnetic
wave distribution inside the food (Knoerzer and others 2008).
Quality Attributes During Frying
Rheology is the science that deals with deformation and flow of solid and fluids.
Deformation refers to the changes in the position of particles under the influence of an
external force. Foods are neither entirely elastic nor purely viscous but have properties
associated with both forms (Essex 1969). During stress relaxation an instantaneous
deformation is applied to a sample surface that is usually cylindrical in shape and the
stress needed to maintain this deformation is recorded as a function of time. The force
is applied using a constant strain in a shear, compression or extension modes (Tabilo-
Munizaga and Barbosa-Cánovas 2005). Ideal elastic materials do not relax, viscous
materials relax instantaneously and viscoelastic materials relax gradually to reach an
equilibrium stress called the asymptotic value that is greater than zero (Del Nobile and
others 2007). If the texture of a fried food can be predicted then the frying processes
can be manipulated, automated and controlled to produce desirable product
characteristics. Mechanical models such as Kelvin-Voigt model, Zener model
Nussinovitch, Peleg model and the Maxwell models have been used to describe the
viscoelastic nature (related to textural attributes) of foods (Del Nobile and others 2007).
The viscoelastic materials are often represented using models that are comprised of
springs (account for elastic properties) and dashpots (account for viscous properties).
Stress relaxation data, provide fundamental material property information that is related

7
to product quality attributes like staling and fruit ripening (Limanond and others 2002).
For foods, there is a linear relationship between stress and strain for only small strain
percentages. During the compression testing of a fried restructured potato product,
linearity was observed for up to 10% compression (Rubnov and Saguy 1997). Nonlinear
regression can be used to fit the Maxwell model (Hookean Spring and Newtonian
Dashpot) with empirical data. High regression coefficient of 0.98 showed how well the
model described the viscoelastic nature of the fried potato crust. The model had two
Maxwell elements and a parallel spring, expressed as; 𝐺(𝑡) = 𝐺1𝑒−𝑡
𝜏1 + 𝐺1𝑒−𝑡
𝜏2 + 𝐺0.
Where, G(t) is the force or stress at the time t, G1 and G2 are the spring constants, and
G0 is the residual stress. The τ1 and τ2 terms are the individual relaxation times in the
first and second exponential terms, respectively. The stress relaxation function is
affected by processing variables such as the oil and water content, starch gelatinization
and biological changes that affect plant cellular structures- cell wall composition, middle
lamella as ll as turgor pressure (Scanlon and others 1996).
Color and texture are two of the most important factors that determine consumer
acceptance of fried potato product (Scanlon and others 1994). The French fry color
results from non-enzymatic browning referred to as the Maillard reaction that involves a
reaction between non-reducing sugars and amino acids. The Maillard reaction depends
on reducing sugar content, the frying temperature, and time (Marquez and Anon 1986).
One of the ways to record color is using CIE L*a*b* values measured using
colorimeters. The L* (luminosity) values correspond to the vertical coordinate that runs
from 0 (black) through grey to L*=100 (the lightest/ white). The a* is a horizontal
coordinate that runs from –a* (green) through gray values and then towards +a* (red).
The second horizontal coordinate refers to the b* values, where –b* (blue) values are
followed by grey and then +b* values (yellow). L* values are expected to decrease with
an increase in frying time, while a* and b* values show an increase (Nourian and
Ramaswamy 2003). As frying time increases, the crust formation is more pronounced,
and oil is taken up, leading to an increase in yellowness. Blanching temperature and
duration affect color formation due to the leaching of sugars and amino acids that affect
the Maillard reaction (Kaymak and Kincal 1994). The final success of the application of
8
novel food processing methods depends on consumer acceptance or even preference.
Sensory analysis using trained or untrained panelist has been used to determine the
overall acceptability or consumer preference of French fries produced by different
processing techniques. Questions presented during such a test refer to overall
acceptance of appearance to more specific questions on flavor, texture, mouthfeel,
aroma and color. The most commonly used rating scale is the 9 point hedonic scale,
where 1 = dislike very much to 9 = like very much and 5= neither like nor dislike or the
neutral point Juyun (2011). The means of the ratings are tested for statistical
significance using ANOVA.

9
MATERIALS AND METHODS
Sample Preparation and Frying Experiments
All experiments were carried out in the laboratories of the Agricultural Engineering
Sciences Building at the University of Illinois, Urbana-Champaign. Frying and
microwave frying experiments were performed using Russet variety of potatoes
purchased from a local grocery store in Champaign, IL. Potatoes were stored at room
temperature at the Food Science and Human Nutrition Pilot Plant and used for
experiments within three days of purchase. The temperature for the storage of potatoes
was around 26°C with a relative humidity of 46.5%. The potatoes were washed, and cut
into cylinders of 7 cm length and 7 mm diameter using stainless steel cutters. Thirty
uniform cylinders were prepared and then washed in tap water to remove surface
starch. All potato cylinders were blanched in 800 mL of boiling water for 120 secs,
followed by immediate immersion with cold water to arrest further cooking. The
excessive surface moisture was removed by patting the potato cylinders dry with paper
towels followed by experimental use.
Frying Experiments
Simply-Fry brand (Gordon Food Services, Cedar Rapids, USA) vegetable oil blend was
used for frying experiments. The microwave fryer (M346385, Highlight Technology
Systems Corporation, Taiwan, Republic of China) was filled with 36 liters of oil and
allowed to attain uniform temperature for about 30 min. The microwave fryer had two
magnetrons each with power of 750 W working at a frequency of 2.45 GHz. The fryer
has the ability to perform conventional frying by turning off the microwaves and using
heat from a thermal coil or combining the thermal heating with microwaves based
heating. The microwaves could be turned on or off when required. Each experimental
run was carried out using 30 cut and blanched potato samples. For temperature and
pressure experiments, three replications were performed for conventional frying (CF) at
177°C, 185°C and 193°C for a frying time of 90 sec. Three replications for pressure and
temperature experiments were also carried out for microwave frying (MF) at 177°C,
185°C and 193°C for the time duration of 90 sec.

10
Pressure Measurement
The real-time experimental pressure values were measured inside the French fries
using a fiber optic pressure sensor (FOP-MH-NS-556A, FISO, Quebec, Canada). The
FTI-10 Fiber Optic Conditioner (FISO) acquired and stored the pressure data. With the
help of the FISO commander software, data was downloaded and further analyzed
using Microsoft Excel. A cavity was made into a cooled, blanched potato cylinder (about
7mm diameter) using a stainless steel needle of 1.5 mm diameter. The sensor (1.7mm
diameter) was placed into the cavity such that pressure readings could be obtained at
the geometric center of the potato cylinder. The probe was secured to the fryer lid using
tape to ensure that pressure readings were recorded at a consistent depth in the fryer
oil. The pressure was also recorded during the post-frying cooling until a constant trend
was obtained.
Temperature profiles
Real time temperature readings were acquired during the frying operations using a fiber
optic temperature sensor, (Model FOT-L-NS-967A, FISO, Quebec, Canada) carefully
placed in the geometric center of one cylindrical sample per experiment. The sensor
was connected to the FTI-10 Fiber Optic Conditioner (FISO) for data acquisition and
storage.
Moisture Analysis
The moisture data were obtained by taking three samples from each experiment and
performing three replications per experiment. This method was followed for
conventional frying and microwave frying operating temperatures of 177°C, 185°C and
193°C and frying times of 60, 90 and 120 secs. French fries cut into small pieces were
cooled in liquid nitrogen and ground into a fine powder using a coffee grinder. The
moisture meter was calibrated against the official AOAC method 934.01 (AOAC 1995).
About 0.5 g of powdered sample was put in an aluminum pan and then placed into the
moisture meter (MB35, OHAUS, Ohaus, Switzerland). The samples were heated to a
set temperature of 105°C until moisture attained constant values. The moisture content
measured using moisture meter were converted to their equivalent oven-based moisture
11
values (based on AOAC method no. 934.01) using the calibration curve. The moisture
data were analyzed using Microsoft Excel and OriginPro 2015.
Fat Analysis
Total oil content was determined using SOXTEC equipment (SOXTEC 1043 HT6,
FOSS Tecator, Hoganas, Sweden) based on the AOAC method 991.36 (AOAC 2000).
Five French fries from each experiment were selected at random and dried in a
convection oven set at 105°C for 16-18 hour to remove internal moisture. After drying,
they were ground into a fine powder using a coffee grinder. About 1 g of powdered
sample was weighed and added into each of the two cellulose thimbles. The thimbles
were then inserted into the extraction unit. The initial weight of the aluminum buckets
was noted. Petroleum ether solvent was used to extract fat by measuring 40 mL into the
aluminum buckets. The thimbles were allowed to boil for 30 min while immersed in the
solvent buckets. A 50 min rinsing step was then performed to remove residual fat from
the thimbles and extract it into the buckets. The solvent was evaporated at 105 ± 2 °C,
for at least 20 min in a convection oven. The weight of the buckets were noted after
solvent evaporation. Fat analysis was performed in three replicates for CF and MF at
177°C, 185°C and 193°C with frying time durations of 60, 90 and 120 secs. Two
replicates of fat analysis were performed per experiment.
Colorimetric Analysis
Color readings of French fries were obtained using the colorimeter (LabScan XE,
Hunter Lab, Reston, Virginia, USA) having a spectral performance in the range of 400 to
700 nm. The Colorimetric analysis was performed in three replicates for CF and MF at
177°C, 185°C and 193°C with frying time durations of 60, 90 and 120 secs. Final CIE
L*a* b* values were obtained by taking the average of 12 readings. Twelve samples of
French fries were chosen and placed uniformly and compactly on a 150mm ×15mm
optically clear Petri dish. Care was taken to cover the area of illumination of the
colorimeter (44mm) with samples. The instrument was standardized with black and
white calibration tiles before each use. The Petri dish was rotated twice by about 45°
and readings were taken twice in each orientation. The samples were then turned over,

12
and six more readings were taken. The color data were analyzed using Microsoft Excel
and OriginPro 2016.
Stress Relaxation Tests
Compression tests were performed using the universal testing machine (TA.XT2i,
Texture Technologies Corporation, Hamilton, Massachusetts, USA) to obtain force
versus time data. Samples were prepared by cutting one disc of about 6mm length from
the center of each cylindrical French fry. Stress relaxation data were obtained for CF
and MF operations. Three replicates of data were collected at each frying temperature
(177°C, 185°C and 193°C) and time (60, 90 and 120 secs). For the third replicate,
another testing machine (TA.HD Plus, Texture Technologies Corporation, Hamilton,
Massachusetts, USA) was used to perform the stress relaxation tests, due to a failure in
the first machine. Ten samples of French fry were tested for each experiment. The initial
radius of each disc was noted using a Vernier caliper before starting the compression
test. Tests were performed at 6% compression mode with a pre-test speed of 2.0
mm/sec, a sensitivity of 0.1 g, the test speed of 2.80 mm/secs, the post-test speed of
5.0 mm/secs, and held for time duration of 145 secs. The compression tests yielded a
linear relationship between stress and strain and hence tests were performed in the
elastic region. The stress values were obtained by dividing the force by the top surface
area of each disc. Stress relaxation modulus was calculated for each sample by dividing
the stress by the initial strain of 0.06 and the average values were used for further
analysis.
Consumer Study
The consumer study was conducted at the University of Illinois Urbana-Champaign’s
Agriculture Engineering Sciences Building. French fries were prepared at the Food
Science and Human Nutrition Pilot Plant located on the first floor of the same building.
Consumer testing was carried out on two days. The Russet variety of potatoes were
purchased from a local grocery store. Potatoes were cut to 7 cm length and 7 mm
diameter on the morning of the day of the consumer test. They were blanched for 120
secs in boiling water and patted dry with paper towels. Batches of 40 blanched samples

13
were placed in a double zipper storage bag with a paper towel and kept in a 3°C
refrigerated room. Fat analysis showed MF French fries had significantly lower fat
content (0.33 g/g solids) at 193°C for 120 secs of frying, compared to CF samples (0.40
g/g solids) at same frying conditions. Hence, the frying temperature and time used for
preparing the fries for consumer testing was 193°C and 120 secs using CF and MF
methods. The blanched potatoes were removed from the refrigerator and allowed to
warm to room temperature before frying. French fries were produced in batches of 40
samples for each frying operation. The mode of frying was alternated between CF and
MF to remove any bias associated with freshness and texture. Fryer baskets were
shaken to remove excess oil after frying. Fries were laid out on paper towels, and pre-
weighed quantities of salt (180 mg/100 g sample) were sprinkled over them. Fries were
immediately transferred into aluminum containers and taken to the testing room.
Heating lamps kept samples warm for consumption within 15 mins, after which fresh
batches of each type of fries were prepared.
The consumer panel comprised of 101 students and faculty, all above the age of 18 and
who had no known food allergies. They were recruited through advertising with flyers,
emails, and digital displays. Participants were seated at tables with food trays that had
one ballot (Appendix G), four cups for rinsing, forks, and tissues. CF French fries were
placed in dishes labeled 101 and MF in 201. The rinsing procedure involved the use of
carbonated water, warm water followed by room temperature water. Rinsing was done
before tasting the first sample and between samples. Panelists were encouraged to
read and sign the Informed Consent Forms for Sensory Evaluation that explained what
the study comprised of and how the information was to be used.

14
X-ray micro Computed Tomography (micro CT)
A batch of 30 French fries were prepared for each frying operation (CF and MF) at a
frying temperature of 193°C for a frying duration of 120 secs. As mentioned above these
conditions produced French fries with a significantly reduced fat content in MF as
compared to CF. The fries were gently patted with paper towels to remove excess
surface oil. One French fry sample was chosen from each frying operation. An
approximately 1.5 cm long cylindrical section was cut from the middle of each French fry
sample. These two sections were then freeze dried for 24 hrs (FreeZone 6, Labconco
Co., Kansas City, Missouri, U.S.A) to prevent the shrinkage of the product during the
scanning. The CT imaging was carried out in the Microscopy Suite of Beckman Institute
at the University of Illinois Urbana-Champaign. The high resolution 3D micro-CT
scanner (MicroXCT-400, Concord, California, U.S.A) was used for acquiring the images
of freeze dried samples. The magnification was set to 1X and the source power was 8
W at 50 kV and 160 μA. The image acquisition angle was from 0 to 180° with an
exposure time of three secs. This gave a total of 721 images with a voxel size of
16.07×16.07×16.07 μm. After the scanning was complete, 2D images were obtained
using the XMReconstructor and the XMController software (Xradia software, Xradia
Incorporated, Pleasanton, California, U.S.A). Avizo 9 (FEI Visualization Science Group,
Hillsboro, Oregon, U.S.A) was used to render 2D image slices to 3D structures and get
a basic understanding of the microstructure of conventionally fried and microwave fried
French fries.
15
RESULTS AND DISCUSSIONS
Pressure Profiles
The pressure values recorded by the sensor upon insertion into the cylindrical fry before
frying were subtracted from the pressure values obtained during frying as a function of
time. The gage pressure (frying pressure - initial pressure in a French fry) values were
plotted against the frying time (Figure 1, 2 and 3). At the lowest frying temperature of
177°C, the pressures at the core of the French fry remained mostly negative during the
entire stages of CF as well as post frying (Figure 1). However, at the same temperature,
an increase in gage pressure was observed with MF and it stayed positive for an
average duration of 36 seconds. At frying temperature of 185°C, the CF gage pressure
increased and remained positive for time periods comparable to MF but its peak positive
value was lower than that of MF (Figure 2). The conventional frying and microwave
frying pressure profile trends are listed in Table 1. The average negative pressure
observed at 185°C for CF was -8963.19 Pa, which is considerably less than -3907.03
Pa, for MF. The longest duration of positive pressures was observed for MF at 193°C
(Figure 3). It was consistently found at every temperature that the microwave frying
gage pressures are higher than those for conventional frying at the same temperature.
The higher magnitudes of gage pressure are expected to be due to the volumetric
heating effect of microwaves, which gives rise to the outward movement of vapors and
serves to inhibit fat uptake. The synergistic effect of higher frying temperatures, frying
time and higher gage pressure helped to reduce fat content significantly at 185°C MF
and 193°C MF for 120 sec as discussed below in more detail (Figure 14 and 15).

16
Figure 1: Pressure profiles versus frying time for conventional frying and microwave
frying at 177°C. Standard error bars for each curve were calculated based on three
pressure replicates. (n=3).
-30000
-25000
-20000
-15000
-10000
-5000
0
5000
10000
15000
20000
25000
30000
0 20 40 60 80 100 120 140 160
Gage P
ressure
(P
a)
Frying Time (sec)
177°C Average Gage Pressure Vs. Time
Average Conventional Frying Gage Pressure Average Microwave Frying Gage Pressure

17
Figure 2: Pressure profiles versus frying time for conventional frying and microwave
frying at 185°C. Standard error bars for each curve were calculated based on three
pressure replicates. (n=3).
-20000
-15000
-10000
-5000
0
5000
10000
15000
20000
0 20 40 60 80 100 120 140 160
Gage P
ressure
(P
a)
Frying Time (sec)
185°C Average Gage Pressure Vs. Time
Average Conventional Frying Gage Pressure Average Microwave Frying Gage Pressure

18
Figure 3: Pressure profiles versus frying time for conventional frying and microwave
frying at 193°C. Standard error bars for each curve were calculated based on three
pressure replicates. (n=3).
-20000
-15000
-10000
-5000
0
5000
10000
15000
20000
0 20 40 60 80 100 120 140 160
Gage P
ressure
(P
a)
Frying Time (sec)
193°C Average Gage Pressure Vs. Time
Average Conventional Frying Gage Pressure Average Microwave Frying Gage Pressure

19
Table 1: Conventional frying versus microwave frying, pressure profile trends. Maximum
and minimum (Pa) are average values of three replicates. (n=3).
Frying Method Maximum (Pa) Minimum (Pa) Time duration
of Positive
Pressure (sec)
Conventional
Frying T (°C):
177 All values 0
and below
-15168.5
0
185 9422.84 -8963.19 45
193 5285.98 -12410.57 25
Microwave
Frying T (°C)
177 17696.55
-10801.79 36
185 11031.61 -3907.03 35
193 8733.36 -8503.54 60
20
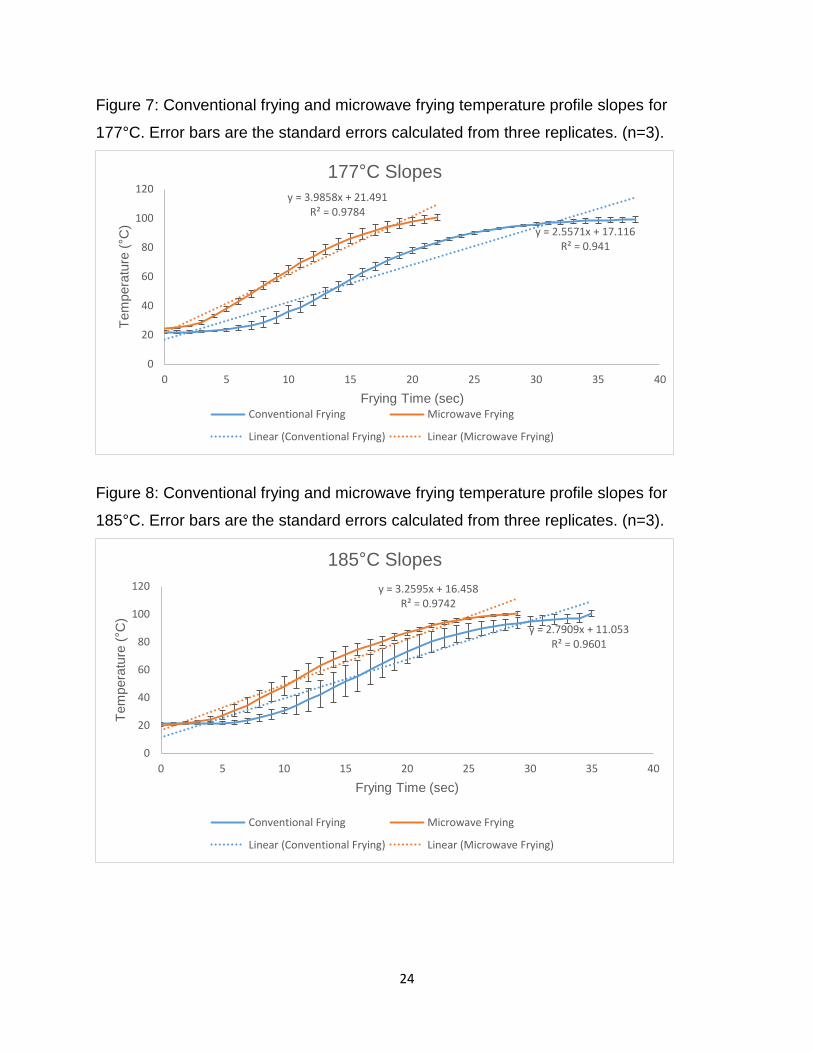
Temperature Profiles
The final temperature profiles were the average of the three replicates at each frying
temperature for both CF and MF (Figures 4, 5 and 6). The errors in temperature profiles
represent standard errors. The standard errors increased at higher frying temperatures
of 185°C and 193°C. This could be due to an increase in turbulence in the frying oil
caused by rapidly escaping vapors at higher frying temperatures. The temperature
values for CF and MF increased linearly with time until they reached the 100°C boiling
point of water (Figures 7, 8 and 9). After achieving 100°C, temperature values increased
within the range of 100°C to 103°C for a short period and then fluctuated around 100°C
for the remainder of the frying period. During CF, the time taken to reach the boiling
temperature was longer as compared to that during MF (Table 2). The higher rate of
change of temperature during MF is expected to have been caused by the internal
heating effects of microwaves. Temperature distributions are affected by the shape and
size of the product. Cylindrical samples of potatoes undergoing microwave heating were
found to have hot spots at their center (Vilayannur and others 1998). Even though
microwaves have a volumetric heating effect, non-uniform temperature distributions are
common. The uniformity of microwave heating of a product is affected by the
penetration depth, duration of heating and also the microwave flux (Chandrasekaran
and others 2013). The faster rate of temperature change helped to significantly
decrease the moisture content of MF (compared to CF) at frying durations of 60 and
120 sec at 185°C (Figure 11).

21
Figure 4: Temperature profiles versus frying time for conventional frying and microwave
frying at 177°C. Error bars are the standard errors calculated from three replicates.
(n=3).
0
20
40
60
80
100
120
0 10 20 30 40 50 60 70 80 90 100
Tem
pera
ture
(°C
)
Frying Time (sec)
177°C Temperature Profiles Vs. Time
Conventional Frying Microwave Frying
22
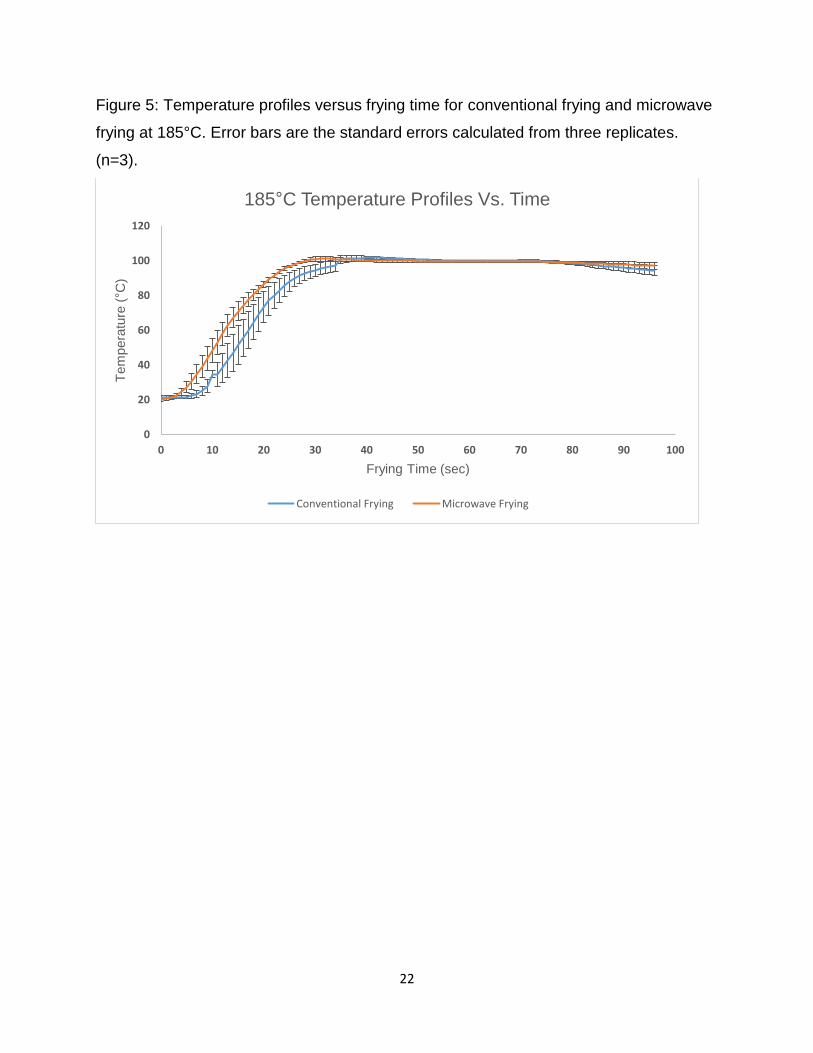
Figure 5: Temperature profiles versus frying time for conventional frying and microwave
frying at 185°C. Error bars are the standard errors calculated from three replicates.
(n=3).
0
20
40
60
80
100
120
0 10 20 30 40 50 60 70 80 90 100
Tem
pera
ture
(°C
)
Frying Time (sec)
185°C Temperature Profiles Vs. Time
Conventional Frying Microwave Frying
23
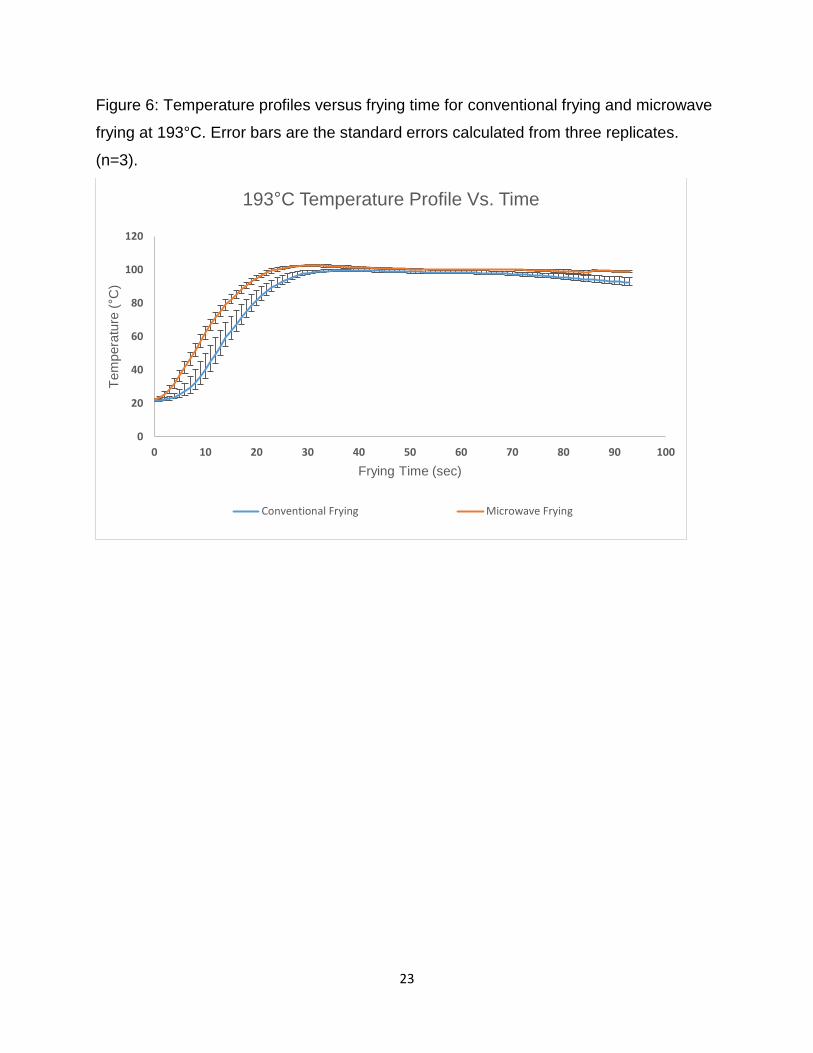
Figure 6: Temperature profiles versus frying time for conventional frying and microwave
frying at 193°C. Error bars are the standard errors calculated from three replicates.
(n=3).
0
20
40
60
80
100
120
0 10 20 30 40 50 60 70 80 90 100
Tem
pera
ture
(°C
)
Frying Time (sec)
193°C Temperature Profile Vs. Time
Conventional Frying Microwave Frying
24
Figure 7: Conventional frying and microwave frying temperature profile slopes for
177°C. Error bars are the standard errors calculated from three replicates. (n=3).
Figure 8: Conventional frying and microwave frying temperature profile slopes for
185°C. Error bars are the standard errors calculated from three replicates. (n=3).
y = 2.5571x + 17.116R² = 0.941
y = 3.9858x + 21.491R² = 0.9784
0
20
40
60
80
100
120
0 5 10 15 20 25 30 35 40
Tem
pera
ture
(°C
)
Frying Time (sec)
177°C Slopes
Conventional Frying Microwave Frying
Linear (Conventional Frying) Linear (Microwave Frying)
y = 2.7909x + 11.053R² = 0.9601
y = 3.2595x + 16.458R² = 0.9742
0
20
40
60
80
100
120
0 5 10 15 20 25 30 35 40
Tem
pera
ture
(°C
)
Frying Time (sec)
185°C Slopes
Conventional Frying Microwave Frying
Linear (Conventional Frying) Linear (Microwave Frying)

25
Figure 9: Conventional frying and microwave frying temperature profile slopes for
193°C. Error bars are the standard errors calculated from three replicates. (n=3).
Table 2: Conventional frying and microwave frying temperature profile trends.
Frying Method Time taken to reach 100°C
(sec)
Slope of linear region
Conventional Frying T
(°C):
177 39 2.56
185 35 2.79
193 33 2.89
Microwave Frying T (°C):
177 22 3.99
185 29 3.26
193 24 3.67
y = 2.8926x + 16.205R² = 0.961
y = 3.671x + 21.841R² = 0.9742
0
20
40
60
80
100
120
140
0 5 10 15 20 25 30 35
Tem
pera
ture
(°C
)
Frying Time (sec)
193°C Slopes
Conventional Frying Microwave Frying
Linear (Conventional Frying) Linear (Microwave Frying)

26
Moisture Analysis
Average moisture content values were measured at 0, 60, 90 and 120 sec for
conventional frying (CF) and microwave frying (MF) at frying temperatures of 177°C,
185°C and 193°C. The moisture content of blanched cylindrical potatoes was taken as
the initial (t = 0sec) moisture content (5.04 g/g solids). Standard deviations of the
samples were calculated from the three replicates at each time point. The error bars
indicate, the standard errors of the means that were calculated using the standard
deviation of 9 samples from the three replicates for each frying temperature and frying
time. The CF and MF moisture data were tested for normality (Table 14 and 15).
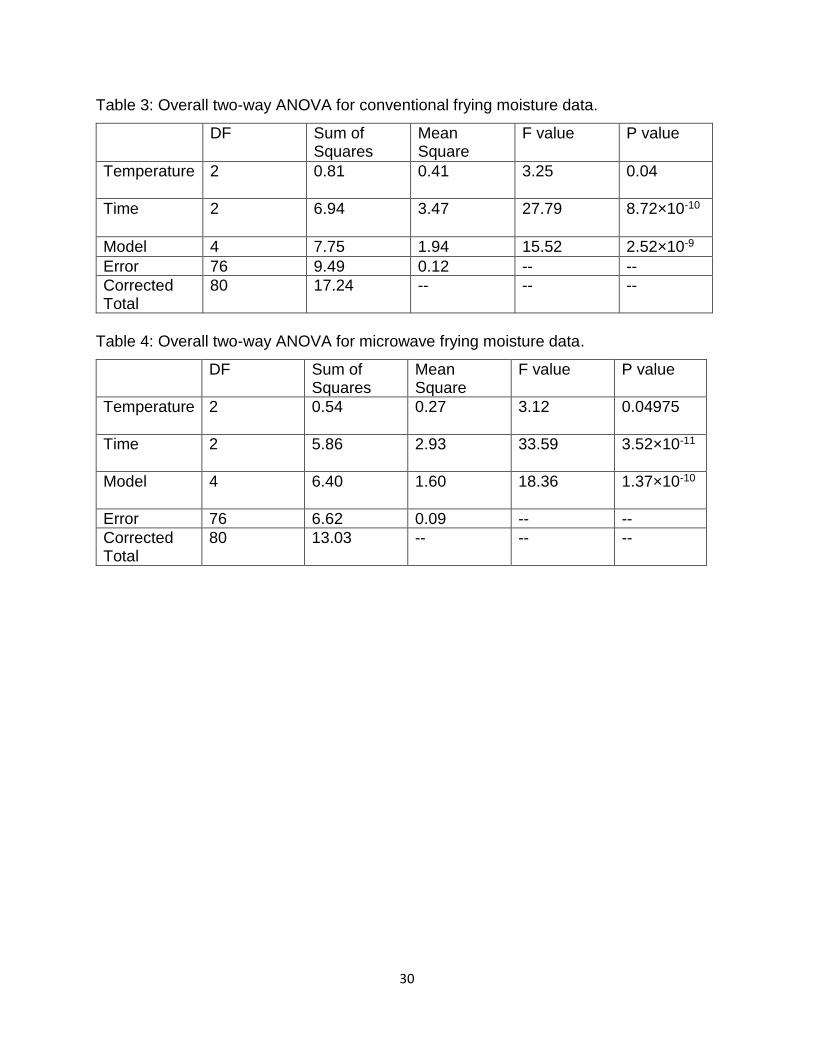
A two-way ANOVA was performed on CF moisture data to verify if it significantly varied
with temperature and time (Table 3). It was found that CF moisture content varied
significantly with temperature and decreased with an increase in temperature (p=0.04).
Longer frying times also had a significant effect on moisture values (p=8.72×10⁻¹⁰). For
MF (Table 4), moisture data varied significantly with frying temperatures (p=0.04975)
and frying times (p=3.52×10⁻¹¹).
At 177°C and 193°C, there was no significant difference in moisture content between
CF and MF (Figure 10 and 12). However at 185°C, MF had significantly lower moisture
contents for 60 sec and 120 sec frying times compared to CF at the same conditions
(Figure 11). Temperature and moisture are interdependent, they are also affected by
the variability in moisture content found between and within the same biological
samples like potatoes. Uneven cooking and moisture distribution can affect the product
texture and consequentially consumer liking.

27
Figure 10: Average moisture content versus frying time for conventional frying and
microwave frying at 177°C. Error bars are the standard errors. (n=9).
0
1
2
3
4
5
6
7
0 20 40 60 80 100 120 140
DB
Mois
ture
Conte
nt
(g/g
solid
)
Frying Time (sec)
177°C CF Vs MF Average DB Moisture Content
177°C Conventional Frying 177°C Microwave Frying

28
Figure 11: Average moisture content versus frying time for conventional frying and
microwave frying at 185°C. Error bars are the standard errors. (n=9).
0
1
2
3
4
5
6
7
0 20 40 60 80 100 120 140
DB
Mois
ture
Conte
nt
(g/g
solid
s)
Frying Time (sec)
185°C CF Vs MF Average DB Moisture Content
185°C Conventional Frying 185°C Microwave Frying

29
Figure 12: Average moisture content versus frying time for conventional frying and
microwave frying at 193°C. Error bars are the standard errors. (n=9).
0
1
2
3
4
5
6
7
0 20 40 60 80 100 120 140
DB
Mois
ture
Conte
nt
(g/g
solid
)
Frying Time (sec)
193°C CF Vs MF Average DB Moisture Content
193°C Conventional Frying 193°C Microwave Frying
30
Table 3: Overall two-way ANOVA for conventional frying moisture data.
DF Sum of Squares
Mean Square
F value P value
Temperature 2 0.81
0.41 3.25
0.04
Time 2 6.94 3.47 27.79 8.72×10⁻¹⁰
Model 4 7.75 1.94 15.52 2.52×10⁻⁹
Error 76 9.49 0.12 -- --
Corrected Total
80 17.24 -- -- --
Table 4: Overall two-way ANOVA for microwave frying moisture data.
DF Sum of Squares
Mean Square
F value P value
Temperature 2 0.54
0.27 3.12 0.04975
Time 2 5.86 2.93 33.59 3.52×10⁻¹¹
Model 4 6.40 1.60 18.36 1.37×10⁻¹⁰
Error 76 6.62 0.09 -- --
Corrected Total
80 13.03 -- -- --

31
Fat Analysis
The difference in weight of aluminum buckets before and after the fat extraction gave
the wet basis fat content (g/g total). The wet basis values were converted to dry basis
fat content (g/g solids). The dry basis fat content of the blanched cylindrical potatoes
was calculated as a measure of experimental error. The average fat content at each
temperature were plotted against their frying times. Standard deviations of the samples
were calculated from the two replicates at each time point. The error bars indicate, the
standard error of the mean. It was calculated using the standard deviation of six
samples from the two replicates of each frying temperature and frying time. The CF and
MF fat data were tested for normality (Table 16 and 17).
There was no significant difference between CF and MF French fry fat content at the
lowest frying temperature of 177°C for all frying times (Figure 13). The fat content in CF
(at 177°C) increased from 0.33 g/g solids at 60 sec frying time to 0.43 g/g solids for 120
sec frying time. For MF at 177°C, fat content increased from 0.37 g/g solids at 60 sec to
0.43 g/g solids at 90 sec followed by a decrease to 0.41 g/g solids at 120 sec frying
time.
For frying at 185°C (Figure 14), there was a significant reduction in MF fat (0.41 g/g
solids) at 120 sec frying time compared to CF (0.49 g/g solids) The fat profile for CF
varied between 0.37 to 0.35 g/g solids between 60 sec and 90 sec followed by an
increase at 120 sec to 0.49 g/g solids. Whereas, MF fat increased from 0.34 g/g solids
to 0.43 g/g solids at 90 sec and decreased slightly at 120 sec frying time to 0.41 g/g
solids.
There was a significant decrease in MF fat (0.33 g/g solids) at 193°C for 120 sec frying
time compared to CF fat (0.40 g/g solids) at the same frying time (Figure 15). CF fat
profile did not show a prominent trend and had fat values of 0.41, 0.39, and 0.40 g/g
solids for frying times of 60, 90, and 120 sec, respectively. The employment of MF for
fat reduction was observed to be more efficient at higher temperatures and a greater
reduction in fat was observed at the longest frying duration of 120 sec.

32
Figure 13: Average fat content versus frying time for conventional frying and microwave
frying at 177°C. Error bars are the standard errors. (n=6).
-0.1
0
0.1
0.2
0.3
0.4
0.5
0.6
0 20 40 60 80 100 120 140
DB
Fat
Conte
nt
(g/g
solid
s)
Frying Time (sec)
177°C CF Vs MF Average DB Fat Content
177°C Conventional Frying Fat 177°C Microwave Frying Fat

33
Figure 14: Average fat content versus frying time for conventional frying and microwave
frying at 185°C. Error bars are the standard errors. (n=6).
-0.1
0
0.1
0.2
0.3
0.4
0.5
0.6
0 20 40 60 80 100 120 140
DB
Fat C
onte
nt
(g/g
solid
s)
Frying Time (sec)
185°C CF Vs MF Average DB Fat Content
185°C Conventional Frying Fat 185°C Microwave Frying Fat

34
Figure 15: Average fat content versus frying time for conventional frying and microwave
frying at 193°C. Error bars are the standard errors. (n=6).
-0.1
0
0.1
0.2
0.3
0.4
0.5
0 20 40 60 80 100 120 140
DB
Fat C
onte
nt
(g/g
solid
s)
Frying Time (sec)
193°C CF Vs MF Average DB Fat Content
193°C Conventional Frying Fat 193°C Microwave Frying Fat

35
Colorimetric Analysis
The L*, a*, and b* color values of blanched samples were taken as the control (L*=
67.47, a*= -3.60 and b*= 9.87). Average L*, a*, and b* values were plotted at 60, 90 and
120 sec (Figures 16, 17 and 18). The procedure was carried out for CF and MF at
temperatures of 177°C, 185°C and 193°C with frying time durations of 60, 90 and 120
sec. Standard deviations of the sample were calculated for the three replicates at each
time point. The error bars indicate the standard error of the mean that was calculated
using the standard deviation of 36 samples from the three replicates for each frying
temperature and frying time. The colorimetric analysis data for CF and MF (L*, a* and
b*) were tested for normality (Table 18, 19, 20, 21, 22 and 23).
The L* values were found to decrease with increasing frying durations and frying
temperature. The decrease in L* values was observed for both CF and MF (Figure 16).
The darkening of French fries is driven by Maillard reaction that is affected by
temperature, leading to more browning at higher processing temperatures and frying
times (Troncoso and others 2009). This decrease in L* values was consistent with color
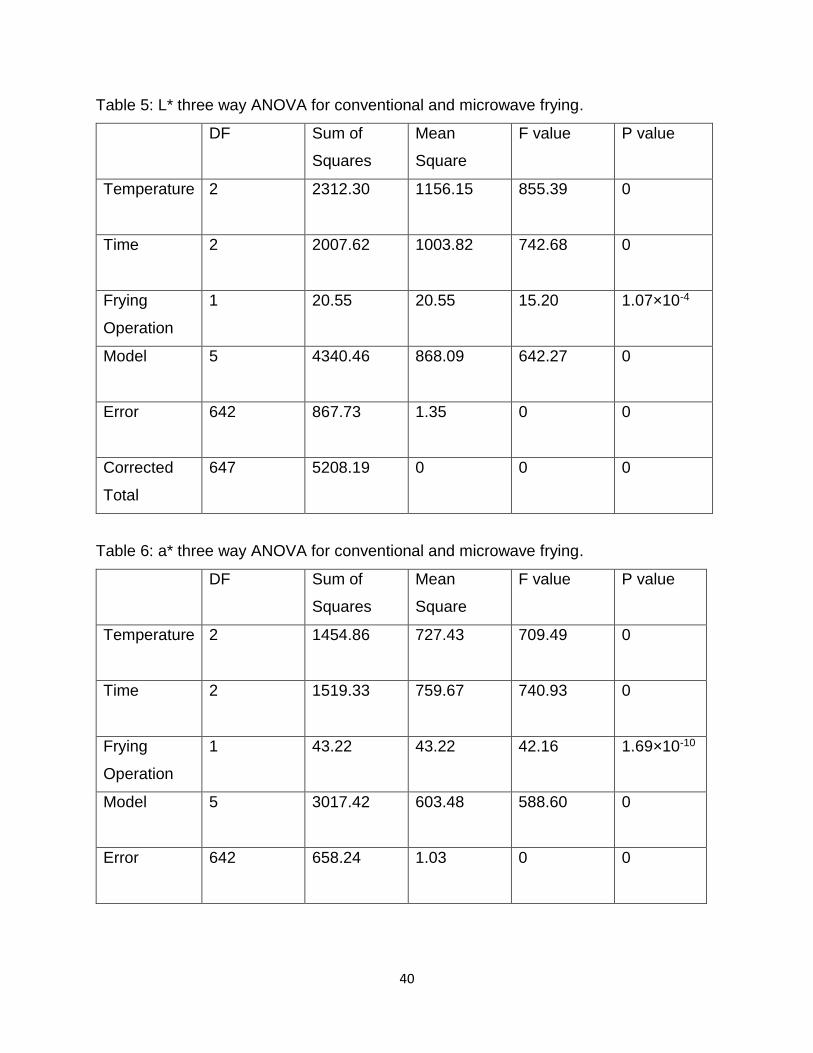
changes in fried potatoes (Nourian and Ramaswamy 2003). Three-way ANOVA
analysis (Table 5) showed a significant decline (P<0.05) in L* values with time and
temperature for both frying operations. Compared to CF, lighter fries were produced
during MF at temperatures of 193°C for frying durations of 60 and 90 sec.
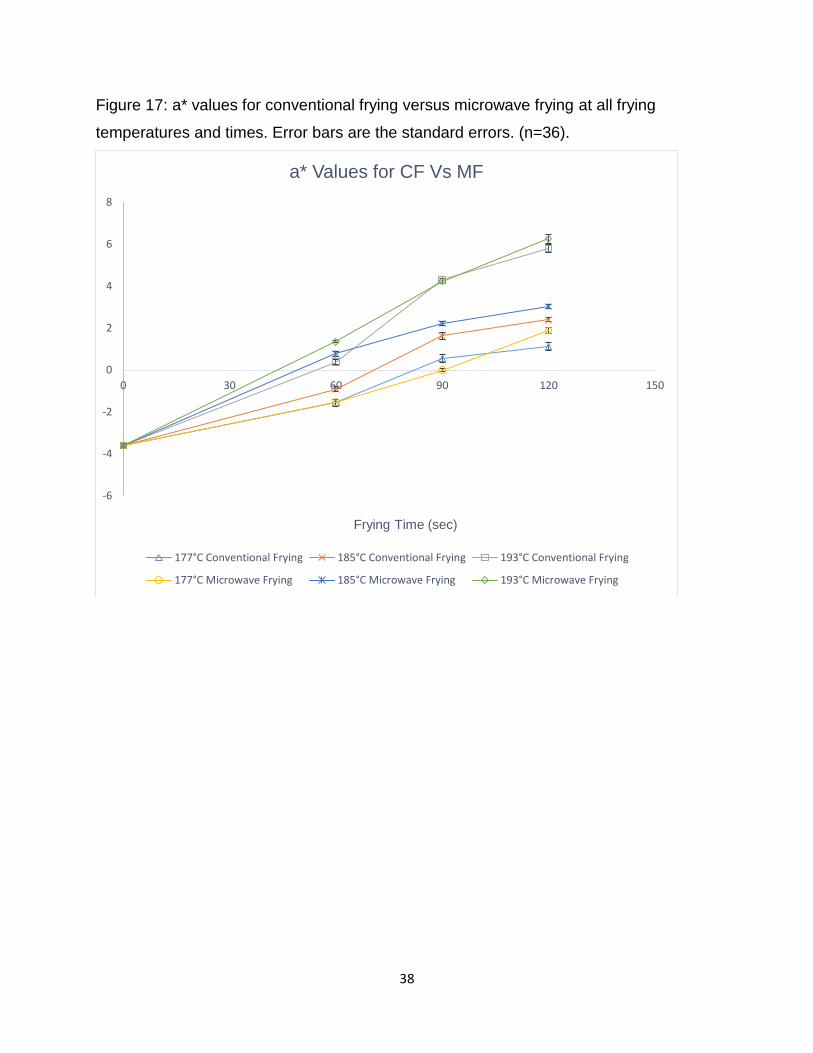
As frying duration and temperature increased, the a* values also increase (Figure 17).
This was consistent for both CF and MF. Increasing a* values indicated a red color.
Negative a* corresponded to more green color, as observed in the blanched control
(a*=-3.6). Three-way ANOVA analysis (Table 6) showed a significant increase (P<0.05)
in a* parameter with increasing time and temperature for both frying operations.
At higher frying temperature and longer frying time, b* values followed an increasing
trend for CF and MF operations (Figure 18). Three-way ANOVA results (Table 7)
indicated a significant increase (P<0.05) in b* values with increasing frying temperature
and time for both CF and MF. The ANOVA results also showed that b* values in MF at

36
177°C and 185°C for all frying times (60, 90 and 120 sec) were significantly larger
(P<0.05) than those at CF for same conditions of temperature and time. This indicated
that MF resulted in yellower fries in comparison to CF which are desirable from a
qualitative perspective.

37
Figure 16: L* values for conventional frying versus microwave frying at all frying
temperatures and times. Error bars are the standard errors. (n=36).
58
60
62
64
66
68
70
0 30 60 90 120 150
L*
Frying Time (sec)
L* values for CF Vs MF
177°C Conventional Frying 177°C Microwave Frying 185°C Conventional Frying
185°C Microwave Frying 193°C Conventional Frying 193°C Microwave Frying
38
Figure 17: a* values for conventional frying versus microwave frying at all frying
temperatures and times. Error bars are the standard errors. (n=36).
-6
-4
-2
0
2
4
6
8
0 30 60 90 120 150
Frying Time (sec)
a* Values for CF Vs MF
177°C Conventional Frying 185°C Conventional Frying 193°C Conventional Frying
177°C Microwave Frying 185°C Microwave Frying 193°C Microwave Frying

39
Figure 18: b* values for conventional frying versus microwave frying at all frying temperatures and times. Error bars are the standard errors. (n=36).
0
5
10
15
20
25
30
35
0 30 60 90 120 150
b*
Frying Time (sec)
b* Values for CF Vs MF
177°C Conventional Frying 185°C Conventional Frying 193°C Conventional Frying
177°C Microwave Frying 185°C Microwave Frying 193°C Microwave Frying
40
Table 5: L* three way ANOVA for conventional and microwave frying.
DF Sum of
Squares
Mean
Square
F value P value
Temperature 2 2312.30 1156.15
855.39
0
Time 2 2007.62 1003.82
742.68
0
Frying
Operation
1 20.55 20.55
15.20
1.07×10⁻⁴
Model 5 4340.46
868.09
642.27
0
Error 642 867.73 1.35
0 0
Corrected
Total
647 5208.19 0 0 0
Table 6: a* three way ANOVA for conventional and microwave frying.
DF Sum of
Squares
Mean
Square
F value P value
Temperature 2 1454.86
727.43
709.49
0
Time 2 1519.33
759.67
740.93
0
Frying
Operation
1 43.22
43.22
42.16
1.69×10⁻¹⁰
Model 5 3017.42
603.48
588.60
0
Error 642 658.24
1.03
0 0

41
Table 6 (cont.): a* three way ANOVA for conventional and microwave frying.
Corrected
Total
647 3675.65 0 0 0
Table 7: b* three way ANOVA for conventional and microwave frying.
DF Sum of
Squares
Mean
Square
F value P value
Temperature 2 2633.69
1316.85
370.62
0
Time 2 3680.76
1840.38
517.96
0
Frying
Operation
1 823.94
823.94
231.89
0
Model 5 7138.39
1427.68
401.81 0
Error 642 2281.11
3.55
0 0
Corrected
Total
647 9419.50 0 0 0

42
Stress Relaxation Analysis
The viscoelastic behavior of the fried potato material was observed from their stress
relaxation data. The stress values increased during the initial stage and reach their
maximum value when the desired constant strain value was achieved. The stress
decayed exponentially from the maximum value and then gradually reduced in
magnitude to reach the asymptotic value close to the end of the test. The stress
relaxation modulus was calculated from the uniaxial stress and the constant strain using
the equation 𝐺(𝑡) =𝜎𝑡
𝜖0 . It described how the elastic modulus of the potato fries varied as
a function of time.
To determine the constant strain percentage at which there is a linear relationship
between stress and strain, compression tests were done at strain levels of; 2%, 4%,
6%, 8% and 10%. The resulting stress and strain were plotted (Figure 19). The 6 %
strain was within the elastic region and was chosen to perform the stress relaxation
tests. The 6% stress-strain data showed a linear relationship with a goodness of fit (R2)
value of 0.97.
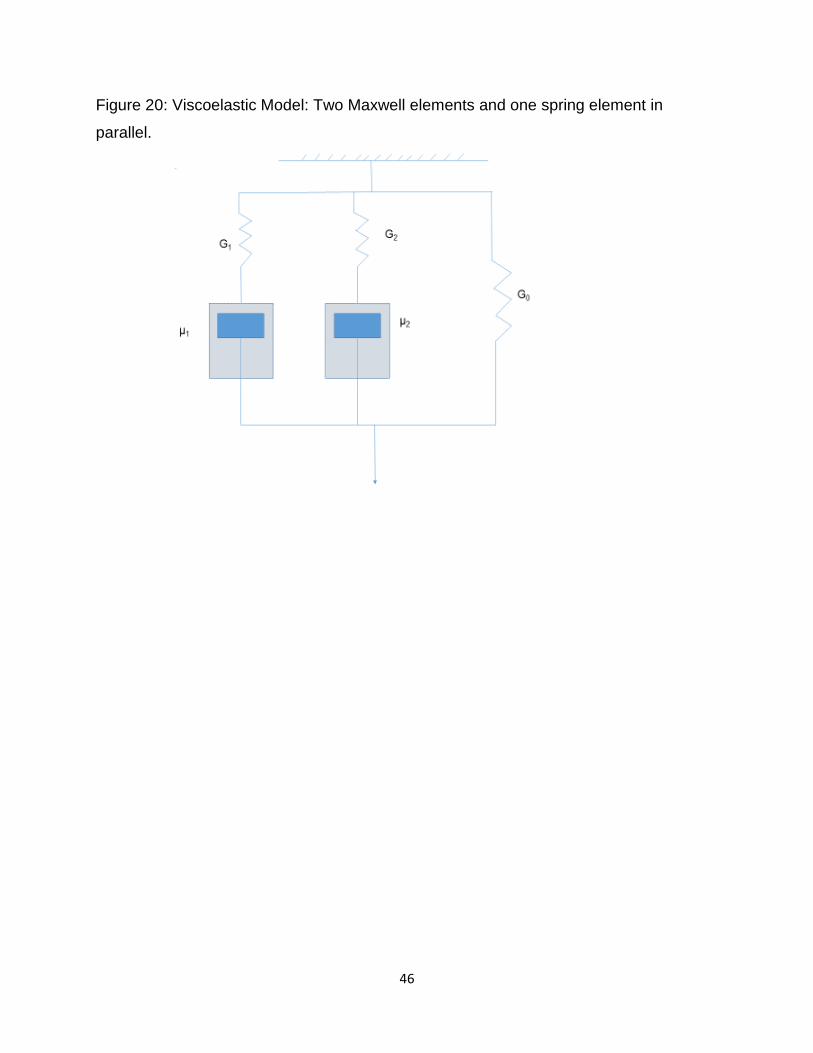
The stress relaxation data can be described using a two element generalized Maxwell
model (Figure 20) with a parallel spring to take into account the residual stress. The
spring is an ideal elastic element that is consistent with Hooke’s law, represented as
𝜎 = 𝐺𝜖, where ϵ is the strain and σ is the stress value. While the dashpot is an ideal
viscous element represented by Newton’s law, given by 𝜎 = 𝜇𝜖 , where ϵ̇ is the rate of
strain. The model is denoted by the equation: 𝐺(𝑡) = 𝐺𝑒−𝑡
𝜏1 + 𝐺𝑒−𝑡
𝜏2 + 𝐺0. Where, G(t) is
the force or stress at the time t, G1 and G2 are the spring constants and G0 is the
residual stress. The τ1 and τ2 are the individual relaxation times for two Maxwell
elements. Non-linear curve fitting tool on OriginPro 2016 was used to fit the two element
Maxwell model to averaged experimental stress relaxation data (Table 8 and 9). Deep
frying produces textural traits that are desirable but rapidly change within a few minutes
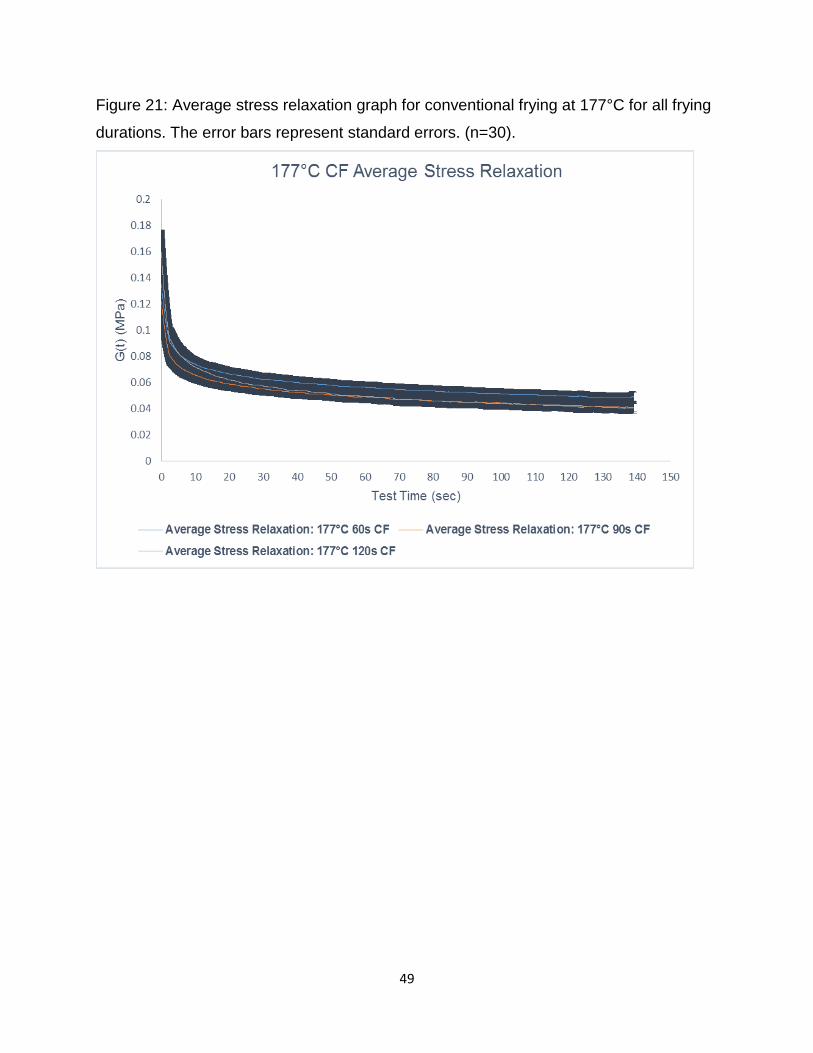
of post processing. The average stress relaxation modulus at 177°C for CF (Figure 21)
indicated highest residual stress for 60 sec of frying (G0 = 4.69×10⁻² MPa) compared to
43
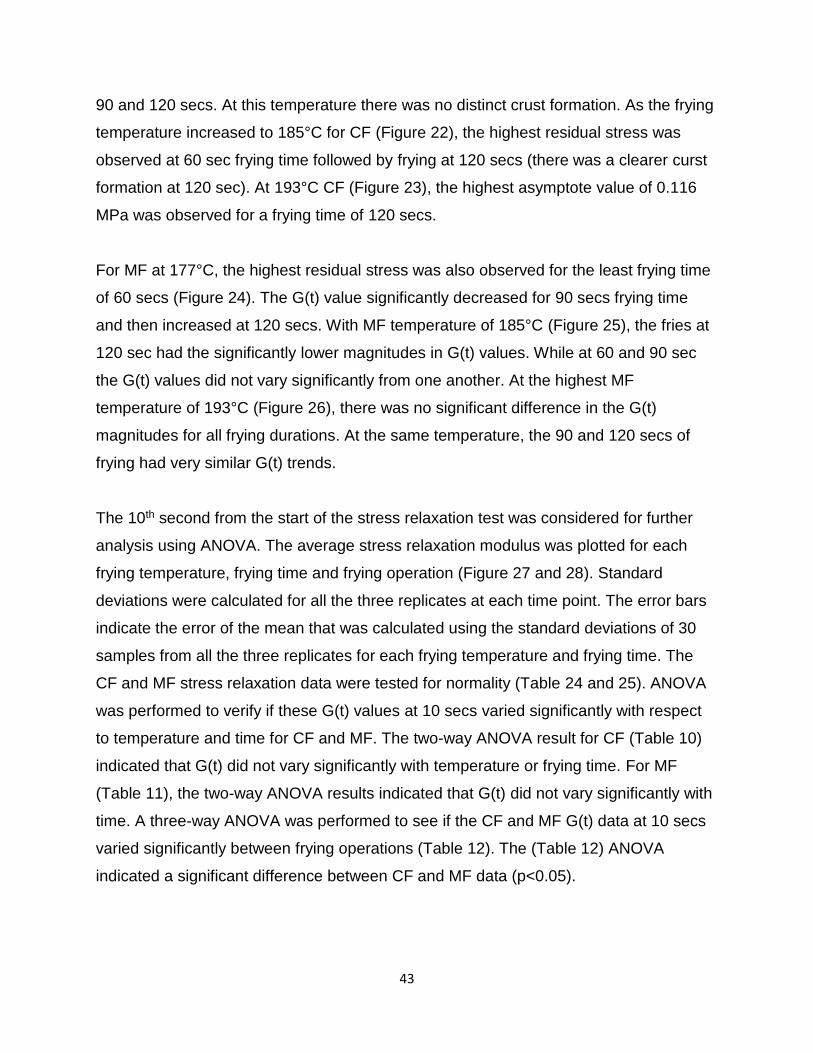
90 and 120 secs. At this temperature there was no distinct crust formation. As the frying
temperature increased to 185°C for CF (Figure 22), the highest residual stress was
observed at 60 sec frying time followed by frying at 120 secs (there was a clearer curst
formation at 120 sec). At 193°C CF (Figure 23), the highest asymptote value of 0.116
MPa was observed for a frying time of 120 secs.
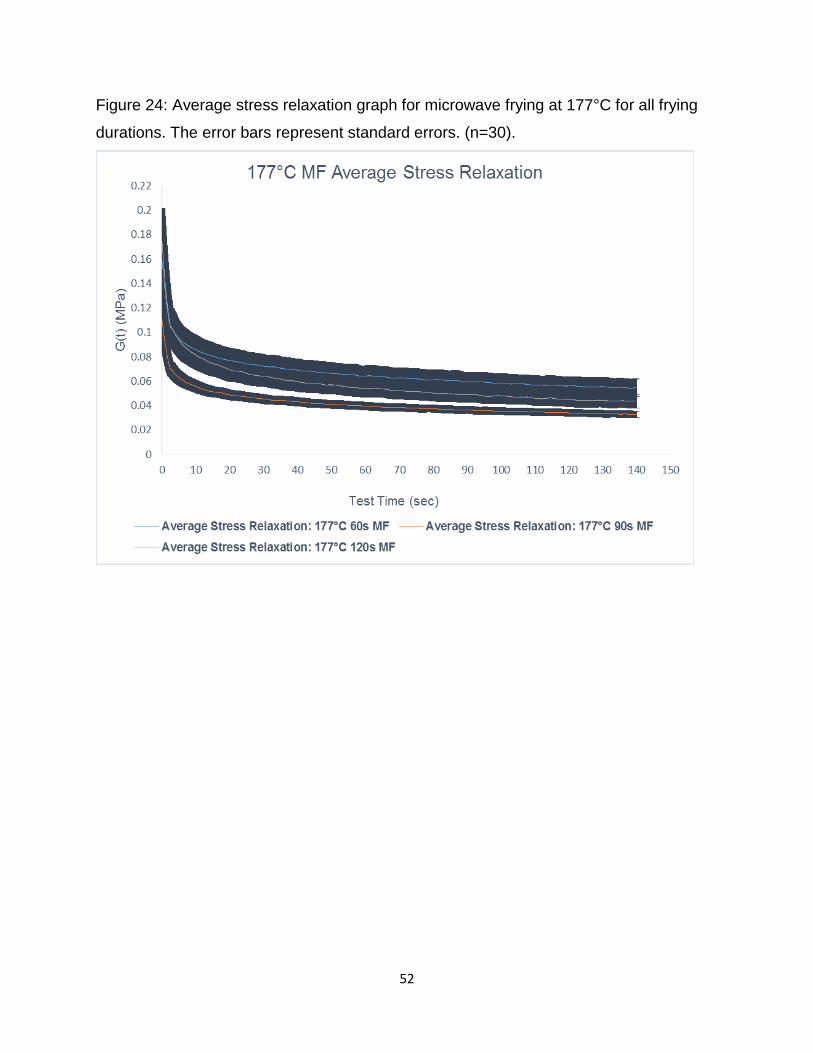
For MF at 177°C, the highest residual stress was also observed for the least frying time
of 60 secs (Figure 24). The G(t) value significantly decreased for 90 secs frying time
and then increased at 120 secs. With MF temperature of 185°C (Figure 25), the fries at
120 sec had the significantly lower magnitudes in G(t) values. While at 60 and 90 sec
the G(t) values did not vary significantly from one another. At the highest MF
temperature of 193°C (Figure 26), there was no significant difference in the G(t)
magnitudes for all frying durations. At the same temperature, the 90 and 120 secs of
frying had very similar G(t) trends.
The 10th second from the start of the stress relaxation test was considered for further
analysis using ANOVA. The average stress relaxation modulus was plotted for each
frying temperature, frying time and frying operation (Figure 27 and 28). Standard
deviations were calculated for all the three replicates at each time point. The error bars
indicate the error of the mean that was calculated using the standard deviations of 30
samples from all the three replicates for each frying temperature and frying time. The
CF and MF stress relaxation data were tested for normality (Table 24 and 25). ANOVA
was performed to verify if these G(t) values at 10 secs varied significantly with respect
to temperature and time for CF and MF. The two-way ANOVA result for CF (Table 10)
indicated that G(t) did not vary significantly with temperature or frying time. For MF
(Table 11), the two-way ANOVA results indicated that G(t) did not vary significantly with
time. A three-way ANOVA was performed to see if the CF and MF G(t) data at 10 secs
varied significantly between frying operations (Table 12). The (Table 12) ANOVA
indicated a significant difference between CF and MF data (p<0.05).

44
The modulus of elasticity gives an indication of how stiff a French fry was based upon
its processing conditions. Due to variability in the starch content within and between
potatoes samples, they are considered as anisotropic materials. The starch content
impacts the final textural qualities of French fries (Miranda and Aguilera 2006). This
variability and variations in the frying operation for different replications is expected to
reflect in the standard error bars, which were more pronounced in CF at 193°C for 120
secs frying time.

45
Figure 19: Stress versus varying strain percentages.
R² = 0.9712
0
0.005
0.01
0.015
0.02
0.025
0.03
0.035
0.04
0 2 4 6 8 10 12
Str
ess (
N/m
m2)
Strain %
Stress Vs Varying Strain
Stress at 2% Strain Stress at 4% Strain
Stress at 6% Strain Stress at 8% Strain
Stress at 10% Strain Linear (Stress at 6% Strain)
46
Figure 20: Viscoelastic Model: Two Maxwell elements and one spring element in
parallel.

47
Table 8: Constants for relaxation modulus during conventional frying. Curves were fitted
to the average stress relaxation.
T(°C) Time(s) G1 1/τ1 G2 1/τ2 G0 R2
177 60 6.21×10⁻² 51.67×10⁻² 3.16×10⁻² 2.10×10⁻² 4.69×10⁻² 0.97
177 90 5.94×10⁻² 60.74×10⁻² 3.06×10⁻² 2.32×10⁻² 4.08×10⁻² 0.98
177 120 9.69×10⁻² 80.66×10⁻² 4.14×10⁻² 3×10⁻² 4.15×10⁻² 0.97
185 60 11.5×10⁻² 56×10-2 6×10⁻² 2.19×10⁻² 8.36×10⁻² 0.98
185 90 9.77×10⁻² 69.71×10⁻² 4.82×10⁻² 2.55×10⁻² 5.15×10⁻² 0.98
185 120 15.99×10⁻² 76.93×10⁻² 7.43×10⁻² 2.79×10⁻² 6.52×10⁻² 0.98
193 60 9.35×10⁻² 63.56×10⁻² 4.31×10⁻² 2.37×10⁻² 5.98×10⁻² 0.98
193 90 8.67×10⁻² 58.39×10⁻² 4.58×10⁻² 2.36×10⁻² 5.27×10⁻² 0.97
193 120 23.64×10⁻² 62.32×10⁻² 12.00×10⁻² 1.97×10⁻² 11.60×10⁻² 0.97

48
Table 9: Constants for relaxation modulus during microwave frying.
T(°C) Time(s) G1 1/τ1 G2 1/τ2 G0 R2
177 60 7.87×10⁻² 65.49×10⁻² 3.9×10⁻² 2.32×10⁻² 5.40×10⁻² 9.97
177 90 5.84×10⁻² 59.54×10⁻² 2.85×10⁻² 2.37×10⁻² 3.23×10⁻² 0.97
177 120 10.28×10⁻² 70.75×10⁻² 4.9×10⁻² 2.81×10⁻² 4.41×10⁻² 0.98
185 60 9.06×10⁻² 67.57×10⁻² 4.05×10⁻² 2.4×10⁻² 4.67×10⁻² 0.97
185 90 8.63×10⁻² 63.76×10⁻² 4.18×10⁻² 2.43×10⁻² 4.94×10⁻² 0.96
185 120 7.09×10⁻² 82.82×10⁻² 3.06×10⁻² 2.93×10⁻² 2.53×10⁻² 0.97
193 60 9.45×10⁻² 66.50×10⁻² 4.35×10⁻² 2.62×10⁻² 5.66×10⁻² 0.98
193 90 8.82×10⁻² 70.67×10⁻² 4.38×10⁻² 2.67×10⁻² 4.77×10⁻² 0.98
193 120 12.7×10⁻² 82.37×10⁻² 5.46×10⁻² 3.11×10⁻² 4.47×10⁻² 0.98
49
Figure 21: Average stress relaxation graph for conventional frying at 177°C for all frying
durations. The error bars represent standard errors. (n=30).

50
Figure 22: Average stress relaxation graph for conventional frying at 185°C for all frying
durations. The error bars represent standard errors. (n=30).

51
Figure 23: Average stress relaxation graph for conventional frying at 193°C for all frying
durations. The error bars represent standard errors. (n=30).
52
Figure 24: Average stress relaxation graph for microwave frying at 177°C for all frying
durations. The error bars represent standard errors. (n=30).

53
Figure 25: Average stress relaxation graph for microwave frying at 185°C for all frying
durations. The error bars represent standard errors. (n=30).

54
Figure 26: Average stress relaxation graph for microwave frying at 193°C for all frying
durations. The error bars represent standard errors. (n=30).

55
Figure 27: Elastic modulus at 10s for CF (n=30).
Figure 28: Elastic modulus at 10s for MF (n=30).
0
0.05
0.1
0.15
0.2
0.25
0.3
0.35
0.4
0 30 60 90 120
G(t
) (M
Pa)
Frying Time (sec)
Elastic Modulus for CF
177°C CF 185°C CF 193°C CF
0
0.02
0.04
0.06
0.08
0.1
0.12
0 30 60 90 120 150
G(t
) (M
Pa)
Frying Time (sec)
Elastic Modulus for MF
177°C MF 185°C MF 193°C MF

56
Table 10: Overall two way ANOVA for conventional frying elastic modulus at 10 secs.
DF Sum of
Squares
Mean
Square
F value P value
Temperature 2 0.19
0.1
1.66 0.19
Time 2 0.14 0.07 1.23 0.29
Model 4 0.33 0.08 1.44 0.22
Error 265 15.19 0.06
Corrected
Total
269 15.52
Table 11: Overall two way ANOVA for microwave elastic modulus at 10 secs.
DF Sum of
Squares
Mean
Square
F value P value
Temperature 2 0.01 0.00
1.86 0.16
Time 2 0.01 0.01 1.93
0.15
Model 4 0.06 0.01 2.31
0.04
Error 265 0.86 0.00 2.11
Corrected
Total
269 0.92

57
Table 12: Overall three way ANOVA for conventional frying and microwave frying elastic
modulus at 10 secs.
DF Sum of
Squares
Mean
Square
F value P value
Temperature 2 0.13 0.06 2.12 0.12
Time 2 0.06 0.03 1.03 0.36
Frying
Operation
1 0.12 0.12 3.88 0.0494
Model 5 0.31 0.06 2.03 0.07
Error 534 16.25 0.03 0 0
Corrected
Total
539 16.56 0 0 0

58
Consumer Study of French Fries
A total of 101 candidates completed the study with 60 on the first day and 40 on the
second day. The objective of the consumer study was to determine how the MF French
fries compared with the CF French fries regarding overall liking and specific attributes of
flavor and texture. Each response was expressed on a 9 point hedonic scale, where 1=
“Dislike Extremely”, 5= “Neither Like nor Dislike” and 9=”Like Extremely”. Data was
analyzed using OriginPro 2016.
The responses for overall liking, liking of flavor and texture of MF and CF fries were
tested for normality (Table 26). It was found that at the 0.05 level, the data were not
drawn significantly from a normally distributed population. The mean scores for overall
liking, liking of flavor and texture for CF and MF fries are shown in Table 13. The mean
scores for overall Liking of CF and MF fries were 5.23 and 5.62 respectively, ANOVA
results showed that at 0.05 level the population means were not significantly different.
The mean score for liking of flavor for CF and MF fries were 5.61 and 5.80, respectively.
There was no significant difference between the likings of flavor means. The mean
score for liking of texture for CF and MF fries were 4.41 and 5.14 respectively. ANOVA
results at level 0.05 indicated a significantly higher score was received for the texture of
MF French fries compared to CF fries. The reduced fat content in the MF fries did not
affect the overall liking or flavor of the French fries. The consumer study suggested that
MF frying had similar overall liking, liking of flavor and texture as CF.

59
Table 13: Mean scores for overall liking, liking of flavor, liking of texture for CF and MF
French fries.
CF French Fries MF French Fries Prob > F
Overall Liking 5.23a ± 0.17
5.62a ± 0.18 0.11
Liking of Flavor 5.61b ± 0.21
5.80b ± 0.17 0.48
Liking of Texture 4.41d ± 0.2 5.14e ± 0.19 0.01
Means with same letters in a row are not significantly different.
60
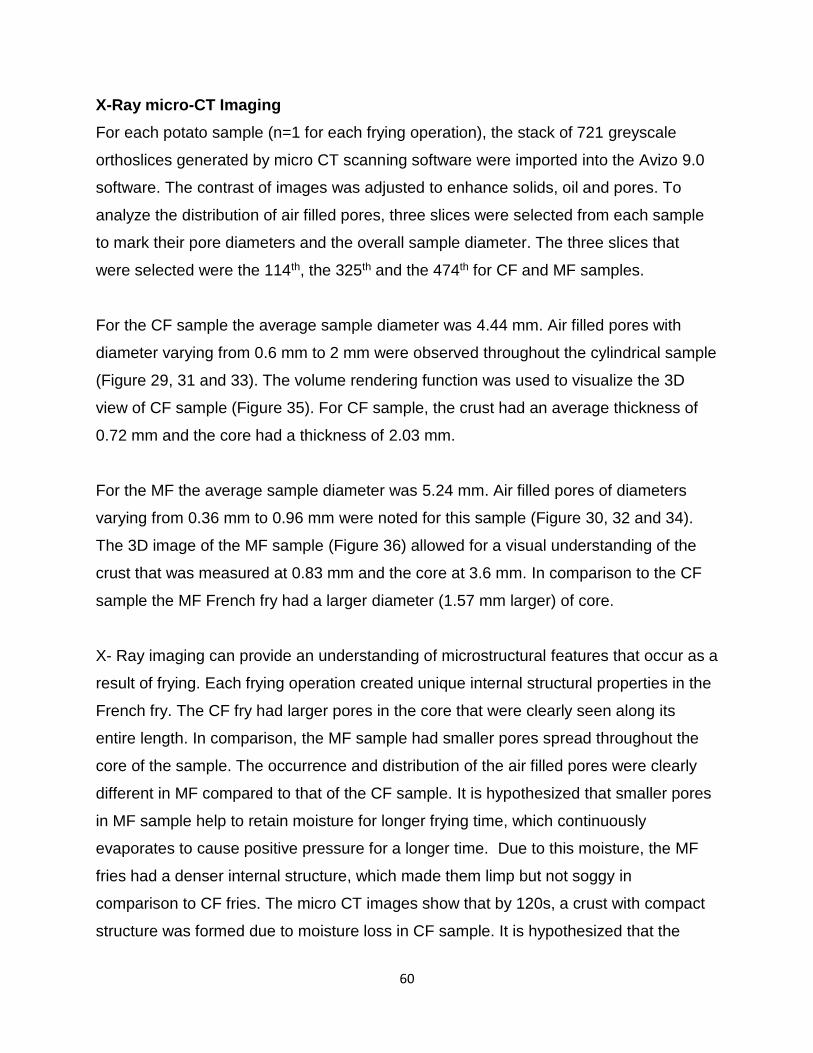
X-Ray micro-CT Imaging
For each potato sample (n=1 for each frying operation), the stack of 721 greyscale
orthoslices generated by micro CT scanning software were imported into the Avizo 9.0
software. The contrast of images was adjusted to enhance solids, oil and pores. To
analyze the distribution of air filled pores, three slices were selected from each sample
to mark their pore diameters and the overall sample diameter. The three slices that
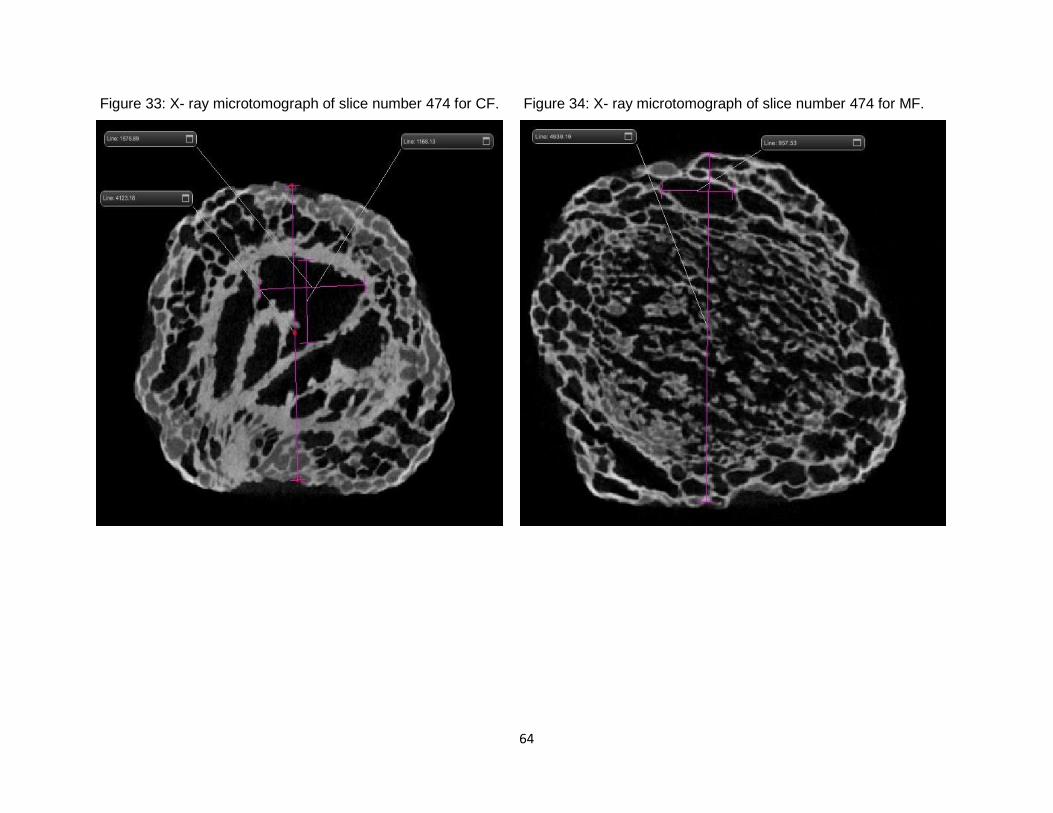
were selected were the 114th, the 325th and the 474th for CF and MF samples.
For the CF sample the average sample diameter was 4.44 mm. Air filled pores with
diameter varying from 0.6 mm to 2 mm were observed throughout the cylindrical sample
(Figure 29, 31 and 33). The volume rendering function was used to visualize the 3D
view of CF sample (Figure 35). For CF sample, the crust had an average thickness of
0.72 mm and the core had a thickness of 2.03 mm.
For the MF the average sample diameter was 5.24 mm. Air filled pores of diameters
varying from 0.36 mm to 0.96 mm were noted for this sample (Figure 30, 32 and 34).
The 3D image of the MF sample (Figure 36) allowed for a visual understanding of the
crust that was measured at 0.83 mm and the core at 3.6 mm. In comparison to the CF
sample the MF French fry had a larger diameter (1.57 mm larger) of core.
X- Ray imaging can provide an understanding of microstructural features that occur as a
result of frying. Each frying operation created unique internal structural properties in the
French fry. The CF fry had larger pores in the core that were clearly seen along its
entire length. In comparison, the MF sample had smaller pores spread throughout the
core of the sample. The occurrence and distribution of the air filled pores were clearly
different in MF compared to that of the CF sample. It is hypothesized that smaller pores
in MF sample help to retain moisture for longer frying time, which continuously
evaporates to cause positive pressure for a longer time. Due to this moisture, the MF
fries had a denser internal structure, which made them limp but not soggy in
comparison to CF fries. The micro CT images show that by 120s, a crust with compact
structure was formed due to moisture loss in CF sample. It is hypothesized that the
61
crust is expected to resist the escape of moisture and expansion of vapors in the core of
a fry. The expanding vapors in the core caused merger of smaller pores by rupturing the
solid walls surrounding them. The rupture of solid walls caused larger pores in the core
of the French fry.
In comparison, for MF since the moisture evaporation was uniform throughout the
French fry, the crust was less compact than the CF sample, which is expected to have
caused easier escape of moisture and vapors. The lesser resistance posed by the crust
is expected to have caused less merger of smaller pores in core as shown in the micro-
CT figures.

62
Figure 29: X- ray microtomograph of slice number 114 for CF. Figure 30: X- ray microtomograph of slice number 114 for MF.

63
Figure 31: X- ray microtomograph of slice number 325 for CF. Figure 32: X- ray microtomograph of slice number 325 for MF.
64
Figure 33: X- ray microtomograph of slice number 474 for CF. Figure 34: X- ray microtomograph of slice number 474 for MF.

65
Figure 35: 3D view of CF sample in yz axis orientation.

66
Figure 36: 3D view of MF sample in yz axis orientation.

67
CONCLUSIONS
Higher gage pressure values were observed during MF for all frying temperatures
compared to CF. The rate of change of temperature during MF showed the temperature
profiles only in the geometric center where hot spots have been observed for cylindrical
shaped potatoes undergoing microwave heating. The temperature and pressure jointly
contribute to a reduced fat uptake in MF at 185°C and 193°C for 120 secs of frying time.
However, significant differences in moisture content were not observed at all frying
conditions. The color values for MF French fries were lighter and yellower at higher
temperatures compared to the CF fries, which is advantageous from a sensory
perspective. For conventional frying, there were no significant differences in the elastic
modulus for all frying temperatures and frying times. Whereas for microwave frying,
significantly lower trend in G(t) were observed at 177°C for 90 secs frying time
compared to 60 and 120 secs at the same temperature. Significantly lower trend in G(t)
values for MF were also observed at 185°C for 120 secs frying time compared to 60 and
90 secs at the same temperature.
This work establishes that reduced fat French fries can be produced using microwave
frying technology. The fat content was significantly less in MF (0.33 g/g solids)
compared to CF (0.40 g/g solids) at 193°C for 120 sec of frying. The French fry
consumer test revealed that there was no significant difference in the overall liking or
liking of flavor between the MF or CF fries. The mean liking of the texture of MF (5.14)
was significantly higher (α= 0.05) than those of CF (4.41). Micro CT scanning was used
to visualize the basic microstructural differences between CF and MF samples. The CF
sample had larger pores (0.6 mm to 2 mm) compared to MF (0.36 mm to 0.96 mm) and
the core diameter in CF sample (2.03 mm) was smaller than that of MF (3.6 mm)
sample. Future research on post-frying conditions can help prevent or moderate a loss
in crispiness of MF French fries.

68
REFERENCES
AOAC I. 1995. Official Methods of analysis of AOAC International. Official method 934.01
AOAC I. 2000. Official methods of analysis of AOAC International. Official method
991.36
Bouchon P, Pyle DL. 2005. Modelling oil absorption during post-frying cooling II: Solution of the mathematical model, model testing and simulations. Food and Bioproducts Processing 83(4 C):261-72.
Chandrasekaran S, Ramanathan S, Basak T. 2013. Microwave food processing—A
review. Food Research International 52(1):243-61. Dana D, Saguy IS. 2006. Review: Mechanism of oil uptake during deep-fat frying and
the surfactant effect-theory and myth. Advances in Colloid and Interface Science 128–130:267-72.
Del Nobile MA, Chillo S, Mentana A, Baiano A. 2007. Use of the generalized Maxwell
model for describing the stress relaxation behavior of solid-like foods. Journal of Food Engineering 78(3):978-83.
Doona CJ, Kustin K, Feeherry FE. 2010. Case studies in novel food processing
technologies: innovations in processing, packaging, and predictive modelling. Cambridge, UK: Woodhead Publishing Ltd.
Essex E. 1969. OBJECTIVE MEASUREMENTS FOR TEXTURE IN FOODS. Journal of
Texture Studies 1(1):19-37. Gamble MH, Rice P. 1987. Effect of pre-fry drying of oil uptake and distribution in potato
crisp manufacture. International Journal of Food Science & Technology 22(5):535-48.
Garayo J, Moreira R. 2002. Vacuum frying of potato chips. Journal of Food Engineering
55(2):181-91. Gökmen V, Palazoğlu TK, Şenyuva HZ. 2006. Relation between the acrylamide
formation and time–temperature history of surface and core regions of French fries. Journal of Food Engineering 77(4):972-6.
Juyun L. 2011. Hedonic scaling: A review of methods and theory. Food Quality and
Preference 22(8):733-47. Kaymak F, Kincal NS. 1994. Apparent diffusivities of reducing sugars in potato strips
blanched in water. International Journal of Food Science & Technology 29(1):63-70.

69
Knoerzer K, Regier M, Schubert H. 2008. A computational model for calculating
temperature distributions in microwave food applications. Innovative Food Science & Emerging Technologies 9(3):374-84.
Kozempel MF, Annous BA, Cook RD, Scullen OJ, Whiting RC. 1998. Inactivation of
microorganisms with microwaves at reduced temperatures. Journal of Food Protection 61(5):582-5.
Krokida MK, Oreopoulou V, Maroulis ZB. 2000. Water loss and oil uptake as a function
of frying time. Journal of Food Engineering 44(1):39-46. Limanond B, Castell-Perez ME, Moreira RG. 2002. Modeling the kinetics of corn tortilla
staling using stress relaxation data. Journal of Food Engineering 53(3):237-47. Marquez G, Anon MC. 1986. Influence of sugars and amino acids in the color
development of fried potatoes. Journal of Food Science 51(1):157.
Miranda ML, Aguilera JM. 2006. Structure and Texture Properties of Fried Potato Products. Food Reviews International 22(2):173-201.
Moreira RG, Sun X, Chen Y. 1997. Factors affecting oil uptake in tortilla chips in deep-
fat frying. Journal of Food Engineering 31(4):485-98.
Nourian F, Ramaswamy HS. 2003. KINETICS of QUALITY CHANGE DURING COOKING and FRYING of POTATOES: PART II. COLOR. Journal of Food Process Engineering 26(4):395-411.
Ohlsson T, Bengtsson N. 2001. Microwave technology and foods. Advances in Food
and Nutrition Research: Academic Press. p. 65-140.
Oztop MH, Sahin S, Sumnu G. 2007. Optimization of microwave frying of potato slices by using Taguchi technique. Journal of Food Engineering 79(1):83-91.
Pedreschi F. 2012. Frying of Potatoes: Physical, Chemical, and Microstructural
Changes. Drying Technology 30(7):707-25.
Rubnov M, Saguy IS. 1997. Fractal analysis and crust water diffusivity of a restructured potato product during deep-fat. Journal of Food Science 62(1):135.
Saguy, Pinthus. 1995. Oil uptake during deep-fat frying; factors and mechanism. Food
Technology 49(4).
Saguy IS, Dana D. 2003. Integrated approach to deep fat frying: engineering, nutrition, health and consumer aspects. Journal of Food Engineering 56(2–3):143-52.

70
Sandhu J, Bansal H, Takhar PS. 2013. Experimental measurement of physical pressure in foods during frying. Journal of Food Engineering 115(2):272-7.
Scanlon MG, Pang CH, Biliaderis CG. 1996. The effect of osmotic adjustment on the
mechanical properties of potato parenchyma. Food Research International 29(5-6):481-8.
Scanlon MG, Roller R, Mazza G, Pritchard MK. 1994. Computerized video image
analysis to quantify color of potato chips. American Potato Journal 71(11):717-33.
Sensoy I, Sahin S, Sumnu G. 2013. Microwave Frying Compared with Conventional
Frying via Numerical Simulation. Food & Bioprocess Technology 6(6):1414-9.
Smith FJ, Williams LG. 1971. Microwave blanching. Google Patents.
Su Y, Zhang M, Zhang W. 2016. Effect of low temperature on the microwave-assisted vacuum frying of potato chips. Drying Technology 34(2):227-34.
Tabilo-Munizaga G, Barbosa-Cánovas GV. 2005. Rheology for the food industry.
Journal of Food Engineering 67(1–2):147-56.
Teruel MdR, Gordon M, Linares MB, Garrido MD, Ahromrit A, Niranjan K. 2015. A Comparative Study of the Characteristics of French Fries Produced by Deep Fat Frying and Air Frying. Journal of Food Science 80(2):E349-E58.
Troncoso E, Pedreschi F, Zúñiga RN. 2009. Comparative study of physical and sensory
properties of pre-treated potato slices during vacuum and atmospheric frying. LWT - Food Science and Technology 42(1):187-95.
Vilayannur RS, Puri VM, Anantheswaran RC. 1998. Size and shape effect on
nonuniformity of temperature and moisture distributions in microwave heated food materials: Part I simulation. Journal of Food Process Engineering 21(3):209-33.
Ziaiifar AM, Courtois F, Trystram G. 2010. POROSITY DEVELOPMENT AND ITS
EFFECT ON OIL UPTAKE DURING FRYING PROCESS. Journal of Food Process Engineering 33(2):191-212.

71
APPENDIX A: NORMALITY TEST AND HISTOGRAMS FOR CONVENTIONAL
FRYING AND MICROWAVE FRYING MOISTURE DATA
Table 14: Kolmogorov-Smirnov test for normality of conventional frying moisture data.
DF Statistic p-value Decision at
level (5%)
Moisture177°CCF60s
9 0.34072 0.19574 Can’t reject
normality
Moisture177°CCF90s
9 0.19298 0.90985 Can’t reject
normality
Moisture177°CCF120s
9 0.15132 1 Can’t reject
normality
Moisture185°CCF60s
9 0.24425 0.588141 Can’t reject
normality
Moisture185°CCF90s
9 0.16299 1 Can’t reject
normality
Moisture185°CCF120s
9 0.29964 0.32662 Can’t reject
normality
Moisture193°CCF60s
9 0.27939 0.41098 Can’t reject
normality
Moisture193°CCF90s
9 0.1788 1 Can’t reject
normality
Moisture193°CCF120s
9 0.22 0.72957 Can’t reject
normality

72
APPENDIX A (cont.)
Table 15: Kolmogorov-Smirnov test for normality of microwave frying moisture data.
DF Statistic p-value Decision at
level (5%)
Moisture177°CMF60s
9 0.19334 0.90735 Can’t reject
normality
Moisture177°CMF90s
9 0.2008 0.85536 Can’t reject
normality
Moisture177°CMF120s
9 0.20386 0.83449 Can’t reject
normality
Moisture185°CMF60s
9 0.24248 0.59799 Can’t reject
normality
Moisture185°CMF90s
9 0.15964 1 Can’t reject
normality
Moisture185°CMF120s
9 0.21999 0.72965 Can’t reject
normality
Moisture193°CMF60s
9 0.21556 0.75739 Can’t reject
normality
Moisture193°CMF90s
9 0.16549 1 Can’t reject
normality
Moisture193°CMF120s
9 0.20053 0.85723 Can’t reject
normality
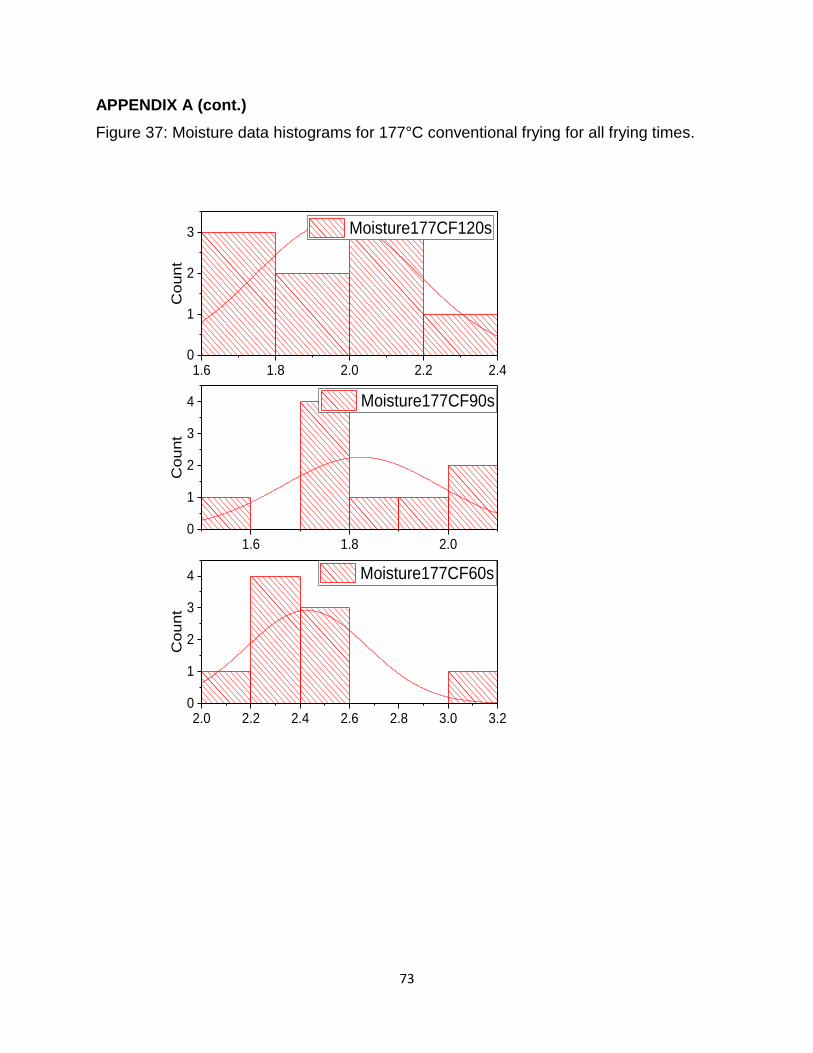
73
APPENDIX A (cont.)
Figure 37: Moisture data histograms for 177°C conventional frying for all frying times.
2.0 2.2 2.4 2.6 2.8 3.0 3.20
1
2
3
4
Co
unt
Moisture177CF60s
1.6 1.8 2.00
1
2
3
4
Co
unt
Moisture177CF90s
1.6 1.8 2.0 2.2 2.40
1
2
3
C
ou
nt
Moisture177CF120s

74
APPENDIX A (cont.) Figure 38: Moisture data histograms for 185°C conventional frying for all frying times.
2.6 2.7 2.80.0
0.5
1.0
1.5
2.0
Count
Moisture185CF60s
1.2 1.4 1.6 1.8 2.0 2.2 2.4 2.6 2.8 3.0 3.20
1
2
3
Count
Moisture185CF90s
0.8 1.0 1.2 1.4 1.6 1.8 2.0 2.2 2.4 2.6 2.8 3.0 3.20
2
4
6
8
C
ount
Moisture185CF120s
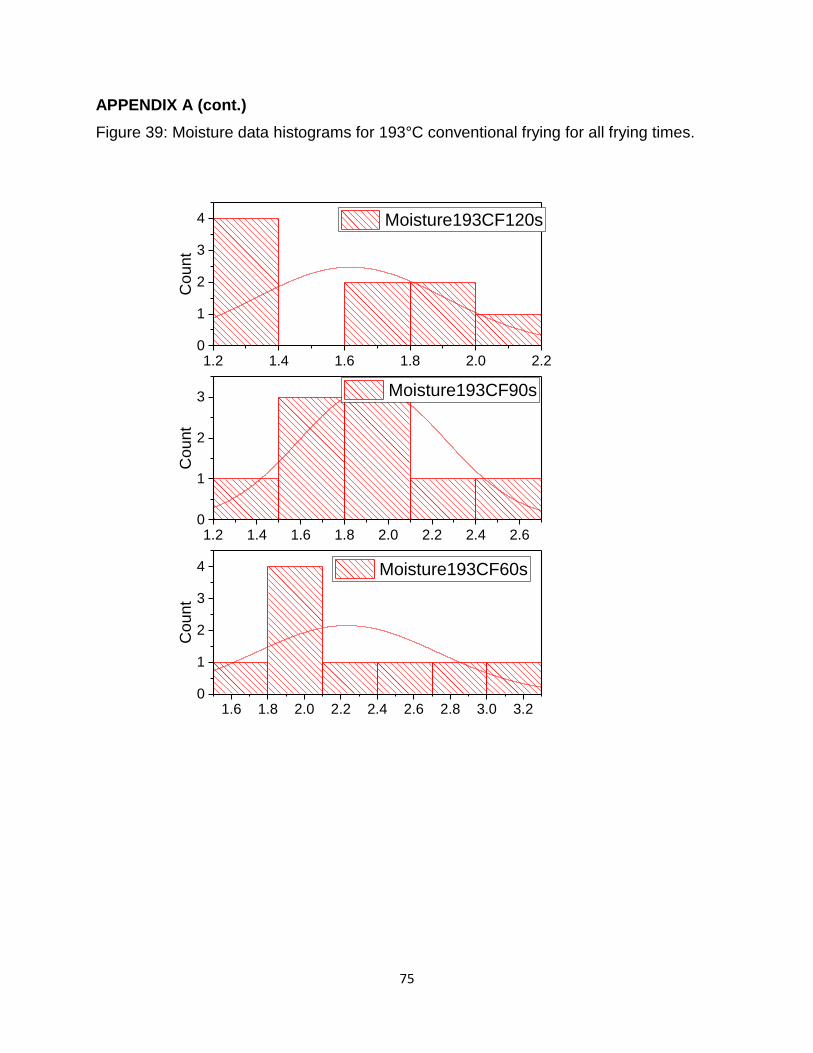
75
APPENDIX A (cont.)
Figure 39: Moisture data histograms for 193°C conventional frying for all frying times.
1.6 1.8 2.0 2.2 2.4 2.6 2.8 3.0 3.20
1
2
3
4
Count
Moisture193CF60s
1.2 1.4 1.6 1.8 2.0 2.2 2.4 2.60
1
2
3
Count
Moisture193CF90s
1.2 1.4 1.6 1.8 2.0 2.20
1
2
3
4
C
ount
Moisture193CF120s
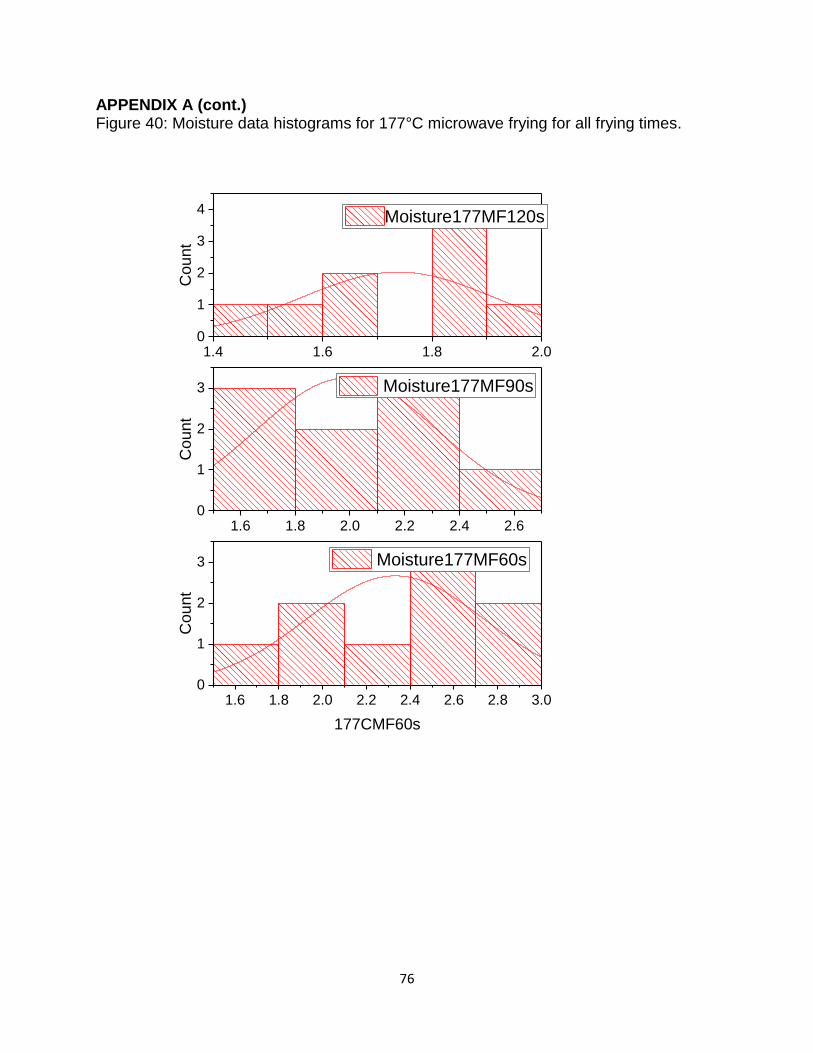
76
APPENDIX A (cont.) Figure 40: Moisture data histograms for 177°C microwave frying for all frying times.
1.6 1.8 2.0 2.2 2.4 2.6 2.8 3.00
1
2
3
Count
177CMF60s
Moisture177MF60s
1.6 1.8 2.0 2.2 2.4 2.60
1
2
3
Count
Moisture177MF90s
1.4 1.6 1.8 2.00
1
2
3
4
C
ount
Moisture177MF120s

77
APPENDIX A (cont.) Figure 41: Moisture data histograms for 185°C microwave frying for all frying times.
1.6 1.8 2.0 2.2 2.4 2.6 2.80
1
2
3
Count
185CMF60s
Moisture185MF60s
1.4 1.6 1.8 2.0 2.2 2.4 2.60
1
2
3
Count
Moisture185MF90s
1.2 1.4 1.6 1.80
1
2
3
C
ount
Moisture185MF120s
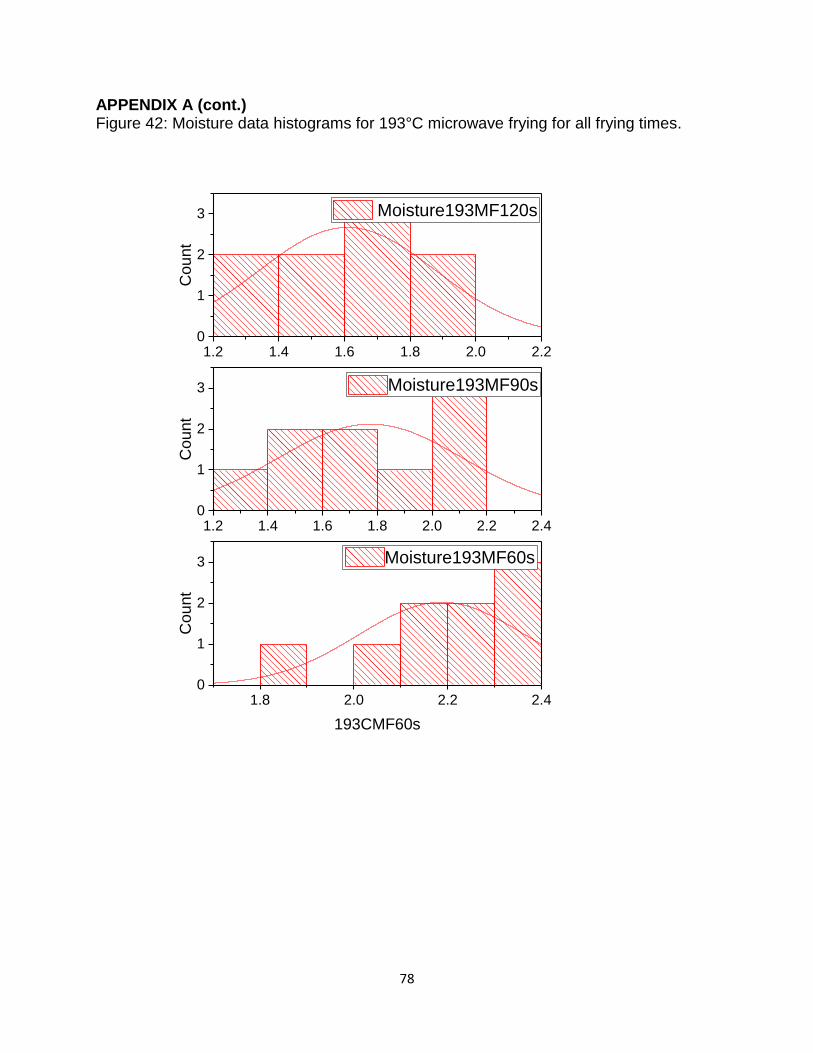
78
APPENDIX A (cont.) Figure 42: Moisture data histograms for 193°C microwave frying for all frying times.
1.8 2.0 2.2 2.40
1
2
3
Count
193CMF60s
Moisture193MF60s
1.2 1.4 1.6 1.8 2.0 2.2 2.40
1
2
3
Count
Moisture193MF90s
1.2 1.4 1.6 1.8 2.0 2.20
1
2
3
C
ount
Moisture193MF120s

79
APPENDIX B: NORMALITY TEST AND HISTOGRAMS FOR CONVENTIONAL
FRYING AND MICROWAVE FRYING FAT DATA
Table 16: Shapiro-Wilk test for normality of conventional frying fat data.
DF Statistic p-value Decision at
level (5%)
Fat177°CCF60s 6 0.94 0.67753 Can't reject
normality
Fat177°CCF90s 6 0.89 0.32459 Can't reject
normality
Fat177°CCF120s 6 0.95 0.72213 Can't reject
normality
Fat185°CCF60s 6 0.94 0.67753 Can't reject
normality
Fat185°CCF90s 6 0.89 0.32459 Can't reject
normality
Fat185°CCF120s 6 0.95 0.72213 Can't reject
normality
Fat193°CCF60s 6 0.89 0.32854 Can't reject
normality
Fat193°CCF90s 6 0.92 0.54 Can't reject
normality
Fat193°CCF120s 6 0.93 0.57501 Can't reject
normality

80
APPENDIX B (cont.) Table 17: Kolmogorov-Smirnov test for normality of microwave frying fat data.
DF Statistic p-value Decision at
level (5%)
Fat177°CMF60s 6 0.36053 0.33387 Can't reject
normality
Fat177°CMF90s 6 0.21492 1 Can't reject
normality
Fat177°CMF120s 6 0.24423 0.84994 Can't reject
normality
Fat185°CMF60s 6 0.24919 0.82286 Can't reject
normality
Fat185°CMF90s 6 0.18547 1 Can't reject
normality
Fat185°CMF120s 6 0.16567 1 Can't reject
normality
Fat193°CMF60s 6 0.25378 0.79804 Can't reject
normality
Fat193°CMF90s 6 0.2315 0.92011 Can't reject
normality
Fat193°CMF120s 6 0.31092 0.51519 Can't reject
normality
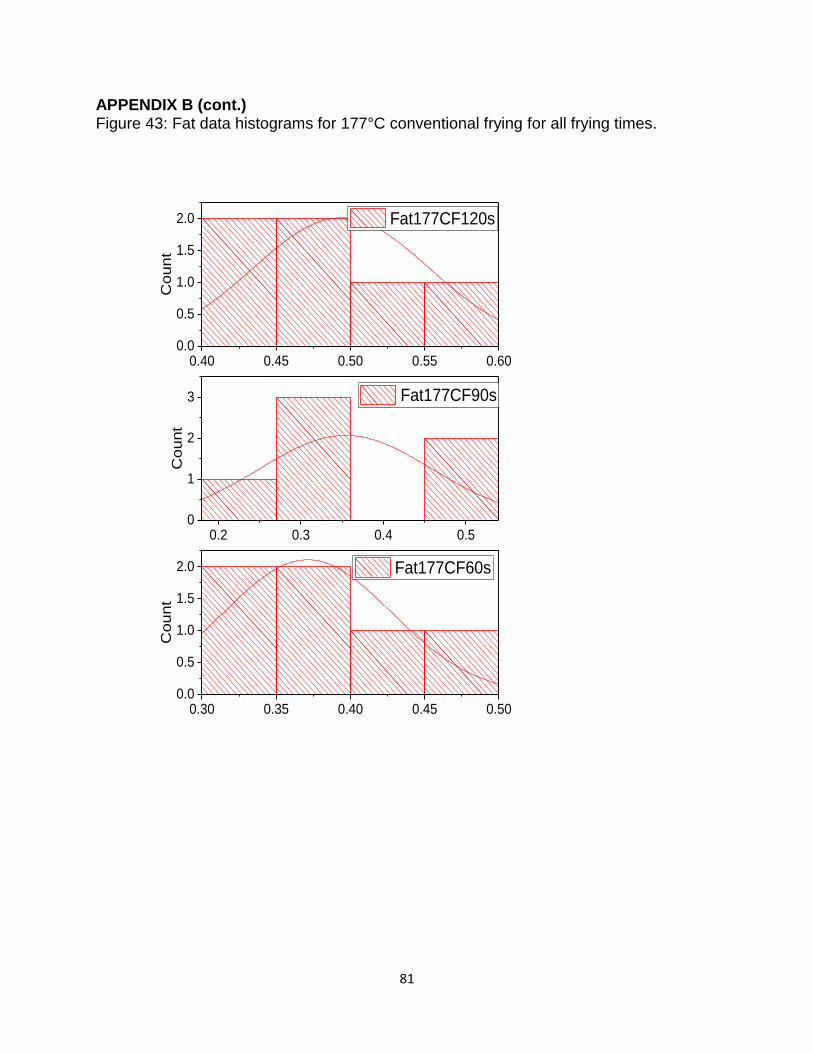
81
APPENDIX B (cont.) Figure 43: Fat data histograms for 177°C conventional frying for all frying times.
0.30 0.35 0.40 0.45 0.500.0
0.5
1.0
1.5
2.0
Co
unt
Fat177CF60s
0.2 0.3 0.4 0.50
1
2
3
Co
unt
Fat177CF90s
0.40 0.45 0.50 0.55 0.600.0
0.5
1.0
1.5
2.0 Fat177CF120s
C
ou
nt

82
APPENDIX B (cont.) Figure 44: Fat data histograms for 185°C conventional frying for all frying times.
0.30 0.35 0.40 0.45 0.500.0
0.5
1.0
1.5
2.0
Co
unt
Fat185CF60s
0.2 0.3 0.4 0.50
1
2
3
Co
unt
Fat185CF90s
0.40 0.45 0.50 0.55 0.600.0
0.5
1.0
1.5
2.0
Co
unt
Fat185CF120s

83
APPENDIX B (cont.) Figure 45: Fat data histograms for 193°C conventional frying for all frying times.
0.3 0.4 0.50.0
0.5
1.0
1.5
2.0
Co
unt
Fat193CF60s
0.36 0.38 0.40 0.420
1
2
3
Co
unt
Fat193CF90s
0.3 0.4 0.50.0
0.5
1.0
1.5
2.0
C
ou
nt
Fat193CF120s

84
APPENDIX B (cont.) Figure 46: Fat data histograms for 177°C microwave frying for all frying times.
0.3 0.40
1
2
3
Count
Fat177MF60s
Fat177MF60s
0.40 0.45 0.500.0
0.5
1.0
1.5
2.0
Count
Fat177MF90s
0.3 0.4 0.50.0
0.5
1.0
1.5
2.0
C
ount
Fat177MF120s

85
APPENDIX B (cont.) Figure 47: Fat data histograms for 185°C microwave frying for all frying times.
0.32 0.33 0.34 0.35 0.360
1
2
3
Count
Fat185MF60s
Fat185MF60s
0.3 0.4 0.50.0
0.5
1.0
1.5
2.0
Count
Fat185MF90s
0.35 0.40 0.45 0.500.0
0.5
1.0
1.5
2.0
C
ount
Fat185MF120s
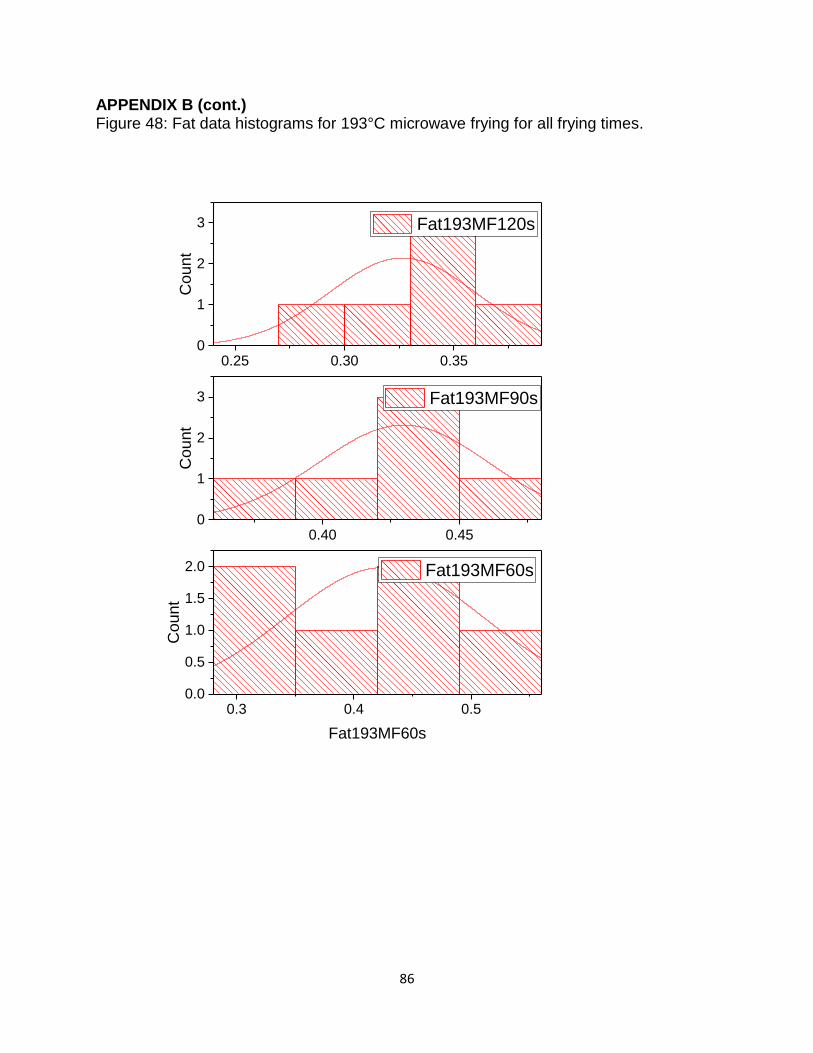
86
APPENDIX B (cont.) Figure 48: Fat data histograms for 193°C microwave frying for all frying times.
0.3 0.4 0.50.0
0.5
1.0
1.5
2.0
Count
Fat193MF60s
Fat193MF60s
0.40 0.450
1
2
3
Count
Fat193MF90s
0.25 0.30 0.350
1
2
3
C
ount
Fat193MF120s

87
APPENDIX C: NORMALITY TEST AND HISTOGRAMS FOR CONVENTIONAL
FRYING AND MICROWAVE FRYING COLOR DATA
Table 18: Normality test for conventional frying L* data.
DF Statistic p-value Decision at
level (5%)
L*177°CCF60s 36 0.18 0.19 Kolmogorov-
Smirnov:
Can't reject
normality
L*177°CCF900s 36 0.97 0.35 Shapiro-Wilk:
Can't reject
normality
L*177°CCF120s 36 0.97 0.51
Shapiro-Wilk:
Can't reject
normality
L*185°CCF60s 36 0.95 0.11
Shapiro-Wilk:
Can't reject
normality
L*185°CCF90s 36 0.13 0.58
Kolmogorov-
Smirnov:
Can't reject
normality
L*185°CCF120s 36 0.95 0.09
Shapiro-Wilk:
Can't reject
normality

88
APPENDIX C (cont.) Table 18 (cont.): Normality test for conventional frying L* data.
DF Statistic p-value Decision at
level (5%)
L*193°CCF60s 36 0.97 0.36
Shapiro-
Wilk: Can't
reject
normality
L*193°CCF90s 36 0.1 0.2 Kolmogoro
v-Smirnov:
Can't
reject
normality
L*193°CCF120s 36 0.2 6.25×10⁻⁴ Kolmogoro
v-Smirnov:
Can't
reject
normality

89
APPENDIX C (cont.) Table 19: Kolmogorov-Smirnov normality test for conventional frying a* data.
DF Statistic p-value Decision
at level
(5%)
a*177°CCF60s 36 0.23 0.04 Reject
normality
a*177°CCF90s 36 0.28 0.01 Reject
normality
a*177°CCF120s 36 0.15 0.36 Can't
reject
normality
a*185°CCF60s 36 0.38 3.6×10⁻⁵ Reject
normality
a*185°CCF90s 36 0.17 0.21 Can't
reject
normality
a*185°CCF120s 36 0.13 0.57 Can't
reject
normality
a*193°CCF60s 36 0.25 0.02 Reject
normality
a*193°CCF90s 36 0.16 0.32 Can't
reject
normality
a*193°CCF120s 36 0.28 0.01 Reject
normality

90
APPENDIX C (cont.) Table 20: Kolmogorov-Smirnov normality test for conventional frying b* data.
DF Statistic p-value Decision at
level (5%)
b*177°CCF60s 36 0.21 0.07
Can't reject
normality
b*177°CCF90s 36 0.08 1 Can't reject
normality
b*177°CCF120s 36 0.26 0.01 Reject
normality
b*185°CCF60s 36 0.19 0.15 Can't reject
normality
b*185°CCF90s 36 0.19 0.15 Can't reject
normality
b*185°CCF120s 36 0.13 0.50378
Can't reject
normality
b*193°CCF60s 36 0.17 0.23 Can't reject
normality
b*193°CCF90s 36 0.34 3.01×10⁻⁴ Reject
normality
b*193°CCF120s 36 0.17 0.21 Can't reject
normality

91
APPENDIX C (cont.) Table 21: Kolmogorov-Smirnov normality test for microwave frying L* data.
DF Statistic p-value Decision at
level (5%)
L*177°CMF60s 36 0.13 0.52 Can't reject
normality
L*177°CMF900s 36 0.09 1 Can't reject
normality
L*177°CMF120s 36 0.25 0.02 Reject
normality
L*185°CMF60s 36 0.11 0.75 Can't reject
normality
L*185°CMF90s 36 0.12 0.66 Can't reject
normality
L*185°CMF120s 36 0.19 0.14 Can't reject
normality
L*193°CMF60s 36 0.21 0.08 Can't reject
normality
L*193°CMF90s 36 0.17 0.23 Can't reject
normality
L*193°CMF120s 36 0.27 0.01 Reject
normality

92
APPENDIX C (cont.) Table 22: Kolmogorov-Smirnov normality test for microwave frying a* data.
DF Statistic p-value Decision at
level (5%)
a*177°CCF60s 36 0.28 0 Reject
normality
a*177°CCF90s 36 0.15 0.33 Can't reject
normality
a*177°CCF120s 36 0.26 0.01 Reject
normality
a*185°CCF60s 36 0.35 2.18×10⁻⁴ Reject
normality
a*185°CCF90s 36 0.12 0.7 Can't reject
normality
a*185°CCF120s 36 0.13 0.58 Can't reject
normality
a*193°CCF60s 36 0.16 0.29 Can't reject
normality
a*193°CCF90s 36 0.2 0.11
Can't reject
normality
a*193°CCF120s 36 0.17 0.23 Can't reject
normality

93
APPENDIX C (cont.) Table 23: Kolmogorov-Smirnov normality test for microwave frying b* data.
DF Statistic p-value Decision at
level (5%)
b*177°CMF60s 36 0.12371 0.61372 Can't reject
normality
b*177°CMF90s 36 0.07 1 Can't reject
normality
b*177°CMF120s 36 0.15 0.36 Can't reject
normality
b*185°CMF60s 36 0.16 0.30 Can't reject
normality
b*185°CMF90s 36 0.19 0.13 Can't reject
normality
b*185°CMF120s 36 0.2 0.11 Can't reject
normality
b*193°CMF60s 36 0.16 0.31 Can't reject
normality
b*193°CMF90s 36 0.27 0.01 Reject
normality
b*193°CMF120s 36 0.18 0.19 Can't reject
normality

94
APPENDIX C (cont.) Figure 49: L* histograms for 177°C conventional frying and 60 sec frying time.
65.8 66.0 66.2 66.4 66.6 66.8 67.0 67.2 67.4 67.6 67.80
2
4
6
8
10
12
14
Co
un
t
L*CF17760s
Figure 50: L* histograms for 177°C conventional frying and 90 sec frying time.
63.5 64.0 64.5 65.0 65.5 66.0 66.5 67.00
2
4
6
8
10
12
14
Co
un
t
L*CF17790s

95
APPENDIX C (cont.) Figure 51: L* histograms for 177°C conventional frying and 120 sec frying time.
63.0 63.5 64.0 64.5 65.0 65.5 66.00
2
4
6
8
10
12
14
16
18
Co
un
t
L*CF177120s
Figure 52: L* histograms for 185°C conventional frying and 60 sec frying time.
62 63 64 65 66 67 680
2
4
6
8
10
12
14
16
18
Co
un
t
L*CF18560s

96
APPENDIX C (cont.) Figure 53: L* histograms for 185°C conventional frying and 90 sec frying time.
62 63 64 65 660
2
4
6
8
10
12
Count
L*CF18590s
Figure 54: L* histograms for 185°C conventional frying and 120 sec frying time.
58 59 60 61 62 630
2
4
6
8
10
Co
un
t
L*CF185120s

97
APPENDIX C (cont.) Figure 55: L* histograms for 193°C conventional frying and 60 sec frying time.
61.0 61.5 62.0 62.5 63.0 63.5 64.00
2
4
6
8
10
12
Co
un
t
L*CF19360s
Figure 56: L* histograms for 193°C conventional frying and 90 sec frying time.
57.5 58.0 58.5 59.0 59.5 60.0 60.5 61.0 61.50
2
4
6
8
10
Count
L*CF19390s

98
APPENDIX C (cont.) Figure 57: L* histograms for 193°C conventional frying and 120 sec frying time.
57.5 58.0 58.5 59.0 59.5 60.0 60.5 61.00
2
4
6
8
10
12
14
16
18
20
Co
un
t
L*CF193120s
Figure 58: a* histograms for 177°C conventional frying and 60 sec frying time.
-3.0 -2.5 -2.0 -1.5 -1.0 -0.5 0.00
2
4
6
8
10
12
Co
un
t
a*177CF60s

99
APPENDIX C (cont.) Figure 59: a* histograms for 177°C conventional frying and 90 sec frying time.
-1.5 -1.0 -0.5 0.0 0.5 1.0 1.5 2.00
2
4
6
8
10
12
Co
un
t
a*177CF90s
Figure 60: a* histograms for 177°C conventional frying and 120 sec frying time.
-1 0 1 2 30
2
4
6
8
10
Co
un
t
a*177CF120s

100
APPENDIX C (cont.) Figure 61: a* histograms for 185°C conventional frying and 60 sec frying time.
-1.6 -1.4 -1.2 -1.0 -0.8 -0.6 -0.4 -0.2 0.0 0.2 0.40
5
10
15
20
25
Co
un
t
a*185CF60s
Figure 62: a* histograms for 185°C conventional frying and 90 sec frying time.
0.0 0.5 1.0 1.5 2.0 2.5 3.0 3.50
2
4
6
8
10
12
Co
un
t
a*185CF90s

101
APPENDIX C (cont.) Figure 63: a* histograms for 185°C conventional frying and 120 sec frying time.
1.5 2.0 2.5 3.0 3.5 4.00
2
4
6
8
10
12
Co
un
t
a*185CF120s
Figure 64: a* histograms for 193°C conventional frying and 60 sec frying time.
-1.0 -0.5 0.0 0.5 1.0 1.5 2.0 2.50
2
4
6
8
10
12
14
16
18
Co
un
t
a*193CF60s
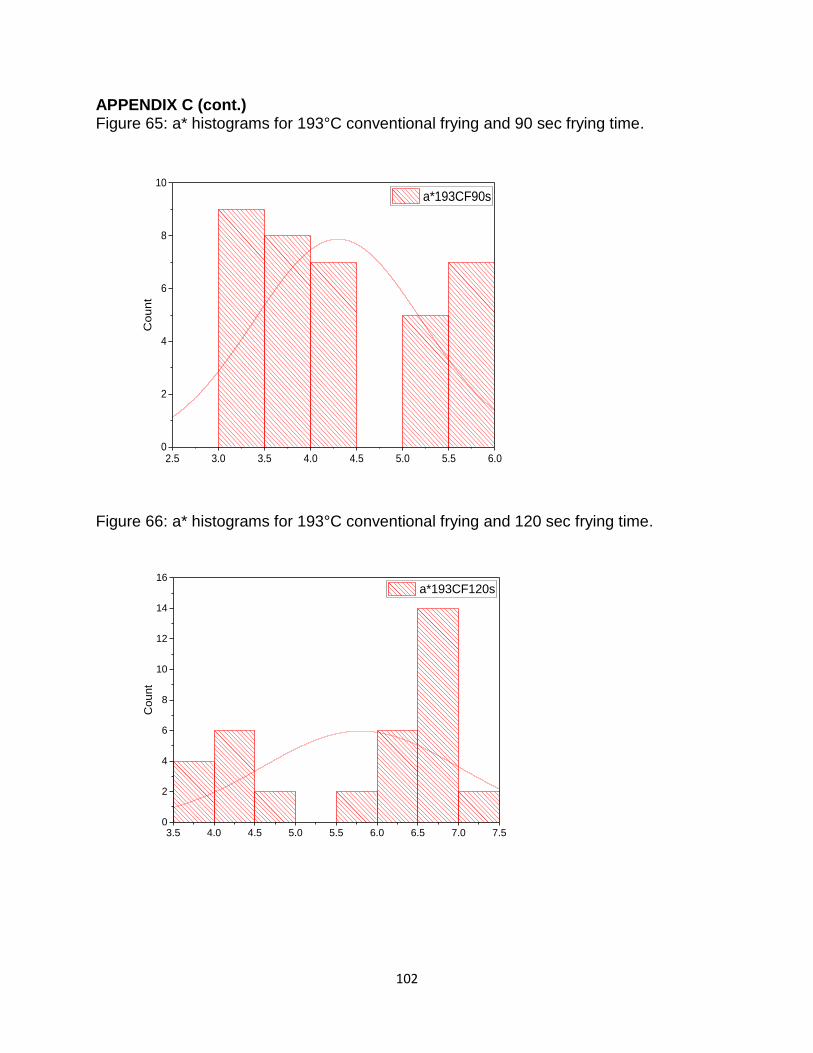
102
APPENDIX C (cont.) Figure 65: a* histograms for 193°C conventional frying and 90 sec frying time.
2.5 3.0 3.5 4.0 4.5 5.0 5.5 6.00
2
4
6
8
10
Co
un
t
a*193CF90s
Figure 66: a* histograms for 193°C conventional frying and 120 sec frying time.
3.5 4.0 4.5 5.0 5.5 6.0 6.5 7.0 7.50
2
4
6
8
10
12
14
16
Count
a*193CF120s

103
APPENDIX C (cont.) Figure 67: b* histograms for 177°C conventional frying and 60 sec frying time.
18 19 20 21 22 23 24 250
2
4
6
8
10
12
Co
un
t
b*177CF60s
Figure 68: b* histograms for 177°C conventional frying and 90 sec frying time.
21.0 21.5 22.0 22.5 23.0 23.5 24.0 24.5 25.00
2
4
6
8
10
Co
un
t
b*177CF90s

104
APPENDIX C (cont.) Figure 69: b* histograms for 177°C conventional frying and 120 sec frying time.
20 21 22 23 24 25 26 270
2
4
6
8
10
12
Co
un
t
b*177CF120s
Figure 70: b* histograms for 185°C conventional frying and 60 sec frying time.
20.5 21.0 21.5 22.0 22.5 23.0 23.5 24.00
2
4
6
8
10
12
Co
un
t
b*185CF60s

105
APPENDIX C (cont.) Figure 71: b* histograms for 185°C conventional frying and 60 sec frying time.
20.5 21.0 21.5 22.0 22.5 23.0 23.5 24.00
2
4
6
8
10
12
Co
un
t
b*185CF60s
Figure 72: b* histograms for 185°C conventional frying and 120 sec frying time.
26.5 27.0 27.5 28.0 28.5 29.0 29.5 30.00
2
4
6
8
10
12
14
16
18
Count
b*185CF120s
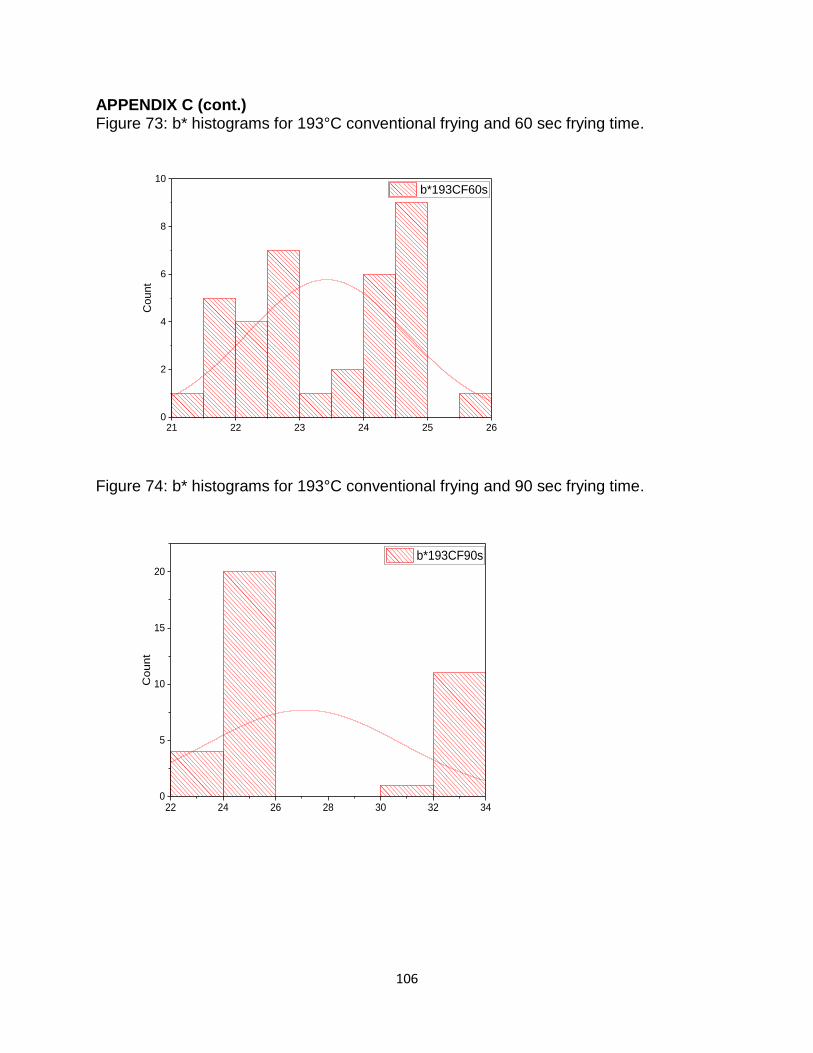
106
APPENDIX C (cont.) Figure 73: b* histograms for 193°C conventional frying and 60 sec frying time.
21 22 23 24 25 260
2
4
6
8
10
Co
un
t
b*193CF60s
Figure 74: b* histograms for 193°C conventional frying and 90 sec frying time.
22 24 26 28 30 32 340
5
10
15
20
Co
un
t
b*193CF90s
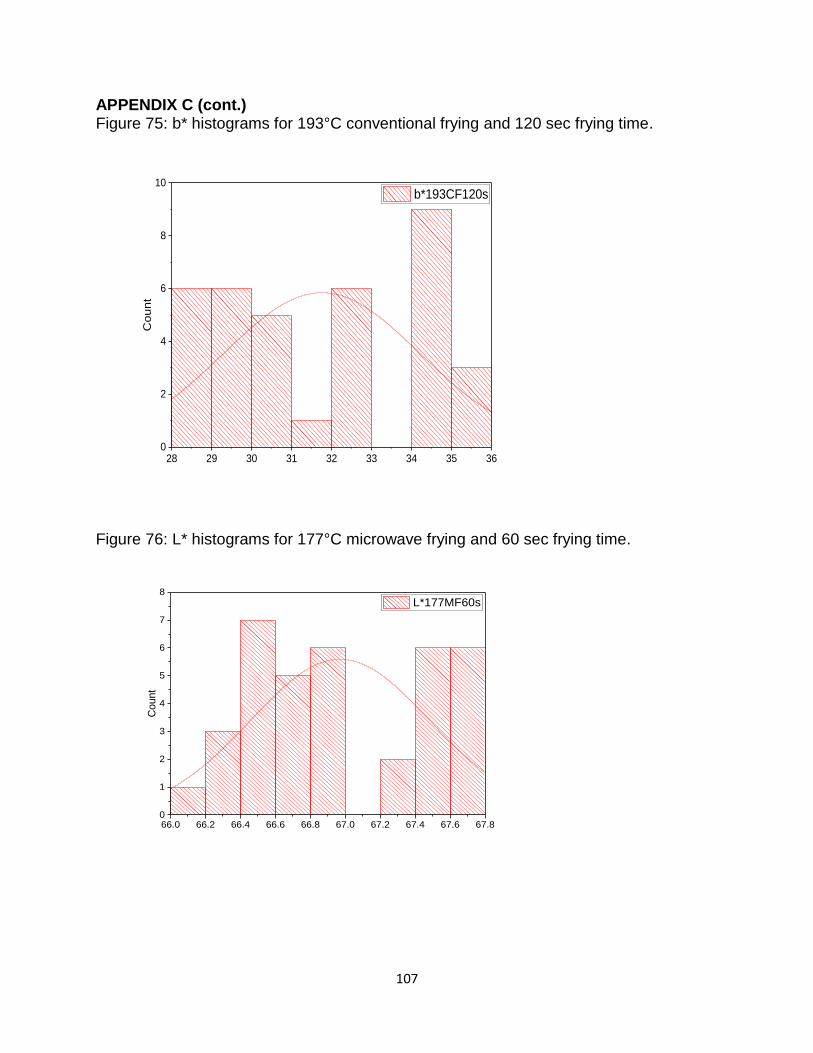
107
APPENDIX C (cont.) Figure 75: b* histograms for 193°C conventional frying and 120 sec frying time.
28 29 30 31 32 33 34 35 360
2
4
6
8
10
Co
un
t
b*193CF120s
Figure 76: L* histograms for 177°C microwave frying and 60 sec frying time.
66.0 66.2 66.4 66.6 66.8 67.0 67.2 67.4 67.6 67.80
1
2
3
4
5
6
7
8
Count
L*177MF60s

108
APPENDIX C (cont.) Figure 77: L* histograms for 177°C microwave frying and 90 sec frying time.
65.0 65.2 65.4 65.6 65.8 66.0 66.2 66.4 66.60
2
4
6
8
10
Count
L*177MF90s
Figure 78: L* histograms for 177°C microwave frying and 120 sec frying time.
61.5 62.0 62.5 63.0 63.5 64.0 64.5 65.0 65.50
2
4
6
8
10
12
14
16
18
20
Count
L*177MF120s
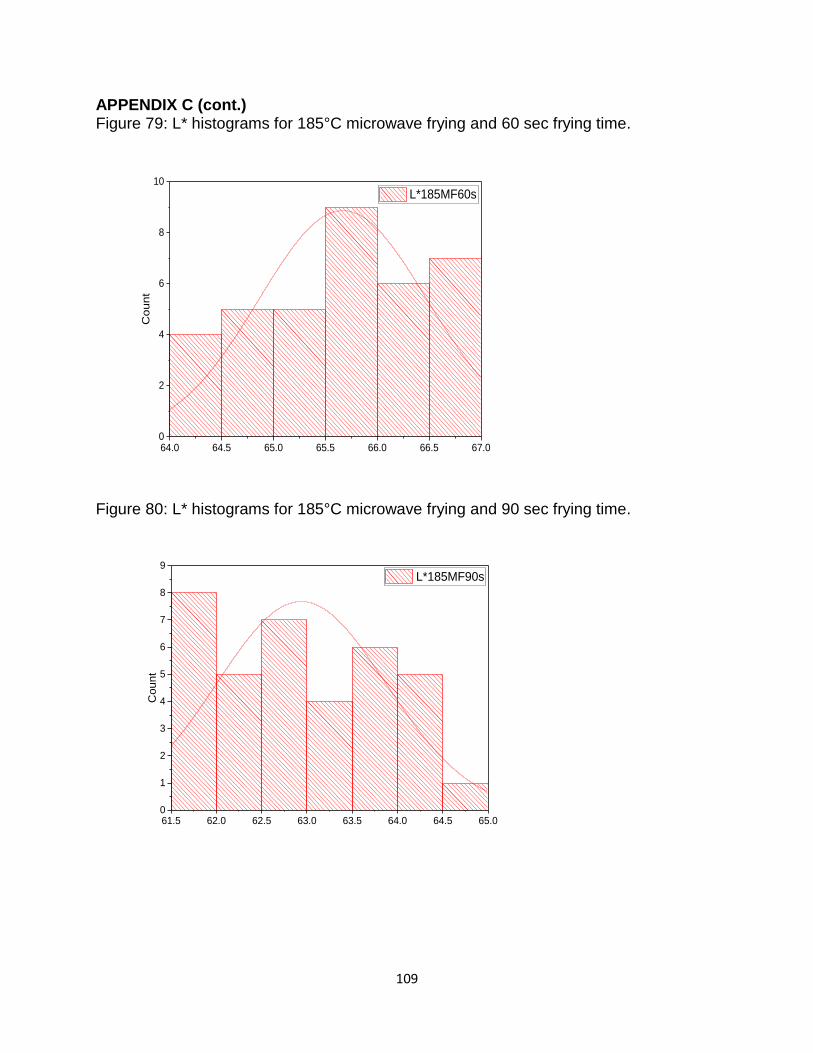
109
APPENDIX C (cont.) Figure 79: L* histograms for 185°C microwave frying and 60 sec frying time.
64.0 64.5 65.0 65.5 66.0 66.5 67.00
2
4
6
8
10
Count
L*185MF60s
Figure 80: L* histograms for 185°C microwave frying and 90 sec frying time.
61.5 62.0 62.5 63.0 63.5 64.0 64.5 65.00
1
2
3
4
5
6
7
8
9
Count
L*185MF90s
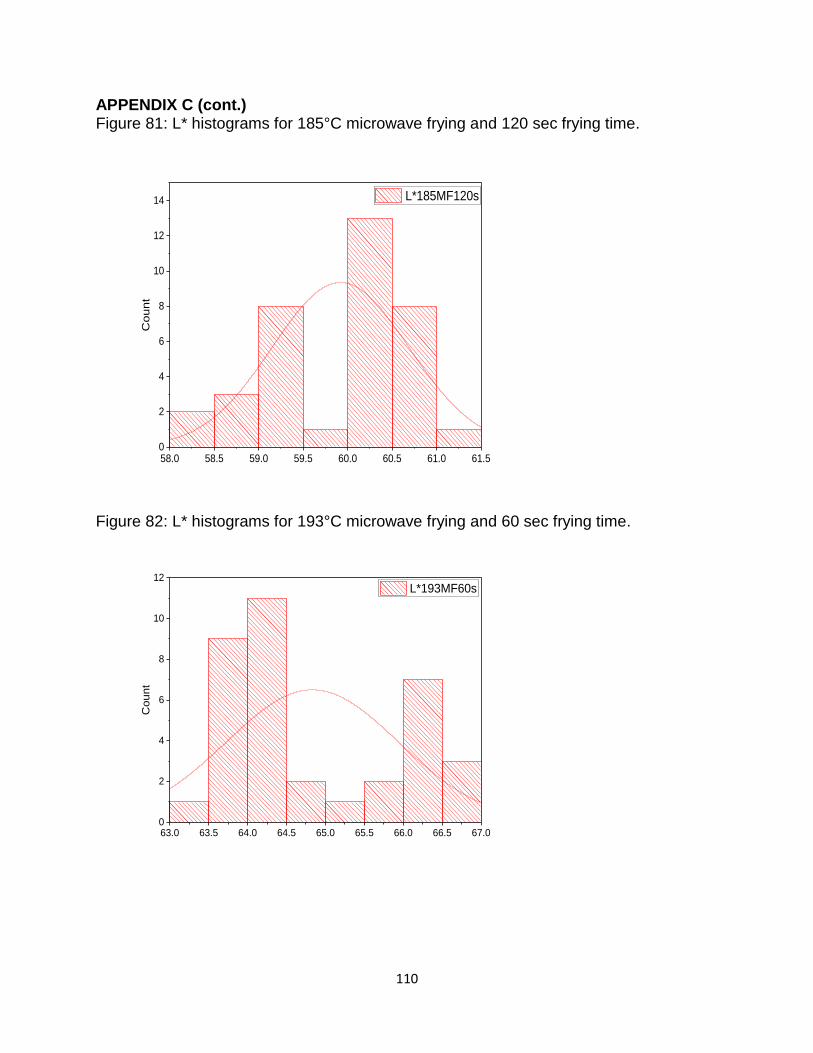
110
APPENDIX C (cont.) Figure 81: L* histograms for 185°C microwave frying and 120 sec frying time.
58.0 58.5 59.0 59.5 60.0 60.5 61.0 61.50
2
4
6
8
10
12
14
Co
un
t
L*185MF120s
Figure 82: L* histograms for 193°C microwave frying and 60 sec frying time.
63.0 63.5 64.0 64.5 65.0 65.5 66.0 66.5 67.00
2
4
6
8
10
12
Count
L*193MF60s

111
APPENDIX C (cont.) Figure 83: L* histograms for 193°C microwave frying and 90 sec frying time.
59.0 59.5 60.0 60.5 61.0 61.5 62.0 62.5 63.00
2
4
6
8
10
12
14
Co
un
t
L*193MF90s
Figure 84: L* histograms for 193°C microwave frying and 120 sec frying time.
56 57 58 59 60 61 62 63 640
5
10
15
20
25
30
Count
L*193MF120s

112
APPENDIX C (cont.) Figure 85: a* histograms for 177°C microwave frying and 60 sec frying time.
-3.0 -2.5 -2.0 -1.5 -1.0 -0.5 0.00
2
4
6
8
10
12
14
Count
a*177MF60s
Figure 86: a* histograms for 177°C microwave frying and 90 sec frying time.
-0.8 -0.6 -0.4 -0.2 0.0 0.2 0.4 0.6 0.80
1
2
3
4
5
6
7
8
9
Count
a*177MF90s
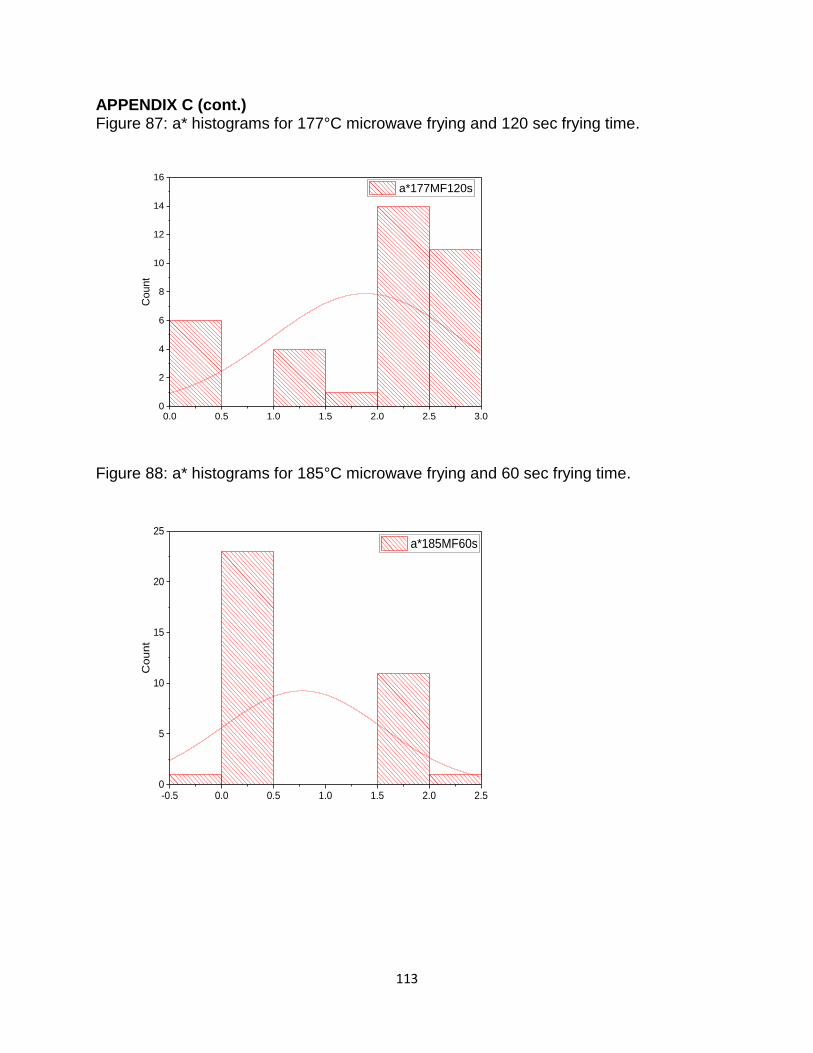
113
APPENDIX C (cont.) Figure 87: a* histograms for 177°C microwave frying and 120 sec frying time.
0.0 0.5 1.0 1.5 2.0 2.5 3.00
2
4
6
8
10
12
14
16
Co
un
t
a*177MF120s
Figure 88: a* histograms for 185°C microwave frying and 60 sec frying time.
-0.5 0.0 0.5 1.0 1.5 2.0 2.50
5
10
15
20
25
Count
a*185MF60s
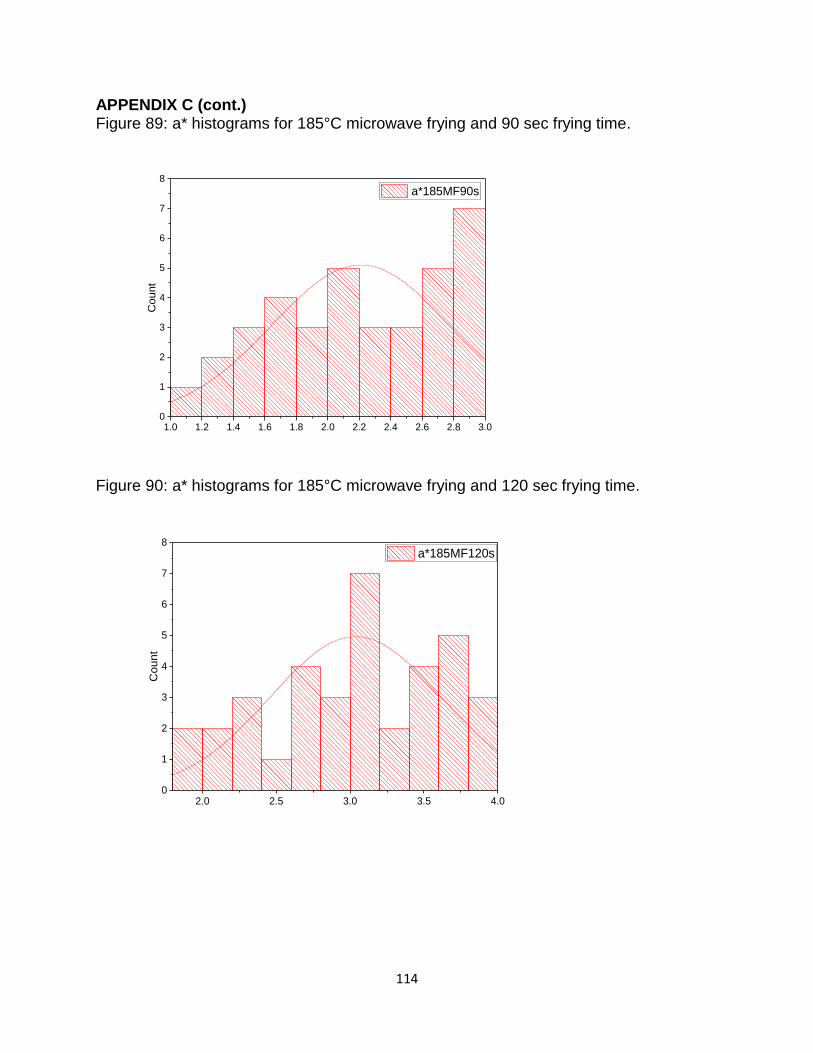
114
APPENDIX C (cont.) Figure 89: a* histograms for 185°C microwave frying and 90 sec frying time.
1.0 1.2 1.4 1.6 1.8 2.0 2.2 2.4 2.6 2.8 3.00
1
2
3
4
5
6
7
8
Count
a*185MF90s
Figure 90: a* histograms for 185°C microwave frying and 120 sec frying time.
2.0 2.5 3.0 3.5 4.00
1
2
3
4
5
6
7
8
Count
a*185MF120s

115
APPENDIX C (cont.) Figure 91: a* histograms for 193°C microwave frying and 60 sec frying time.
0.0 0.5 1.0 1.5 2.00
2
4
6
8
10
12
Co
un
t
a*193MF60s
Figure 92: a* histograms for 193°C microwave frying and 90 sec frying time.
2.5 3.0 3.5 4.0 4.5 5.0 5.50
2
4
6
8
10
12
14
16
18
Co
un
t
a*193MF90s

116
APPENDIX C (cont.) Figure 93: a* histograms for 193°C microwave frying and 120 sec frying time.
4 5 6 7 80
1
2
3
4
5
6
7
8
Count
a*193MF120s
Figure 94: b* histograms for 177°C microwave frying and 60 sec frying time.
21.0 21.5 22.0 22.5 23.0 23.5 24.00
2
4
6
8
10
12
Count
b*177MF60s
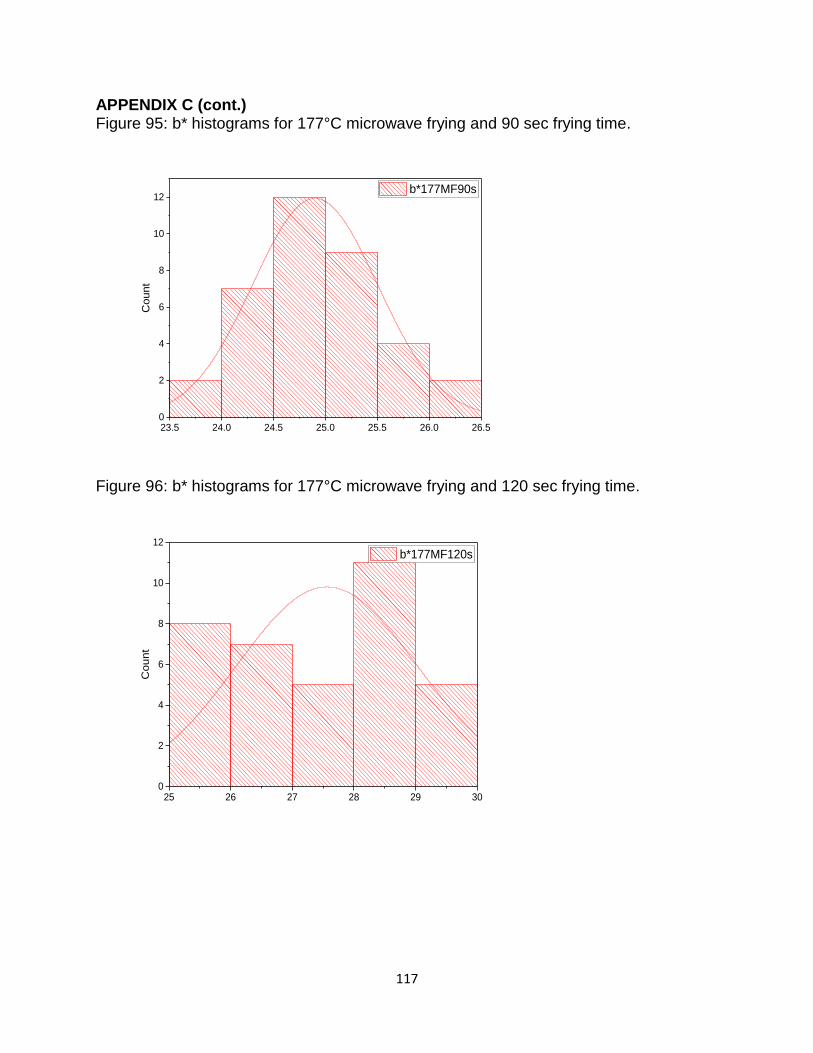
117
APPENDIX C (cont.) Figure 95: b* histograms for 177°C microwave frying and 90 sec frying time.
23.5 24.0 24.5 25.0 25.5 26.0 26.50
2
4
6
8
10
12
Co
un
t
b*177MF90s
Figure 96: b* histograms for 177°C microwave frying and 120 sec frying time.
25 26 27 28 29 300
2
4
6
8
10
12
Co
un
t
b*177MF120s

118
APPENDIX C (cont.) Figure 97: b* histograms for 185°C microwave frying and 60 sec frying time.
22.5 23.0 23.5 24.0 24.5 25.0 25.5 26.00
2
4
6
8
10
12
14
Co
un
t
b*185MF60s
Figure 98: b* histograms for 185°C microwave frying and 90 sec frying time.
24 25 26 27 28 29 30 31 320
2
4
6
8
10
Count
b*185MF90s

119
APPENDIX C (cont.) Figure 99: b* histograms for 185°C microwave frying and 120 sec frying time.
27 28 29 30 31 32 33 340
2
4
6
8
10
12
Count
b*185MF120s
Figure 100: b* histograms for 193°C microwave frying and 60 sec frying time.
25.0 25.5 26.0 26.5 27.0 27.5 28.00
2
4
6
8
10
12
Co
un
t
b*193MF60s
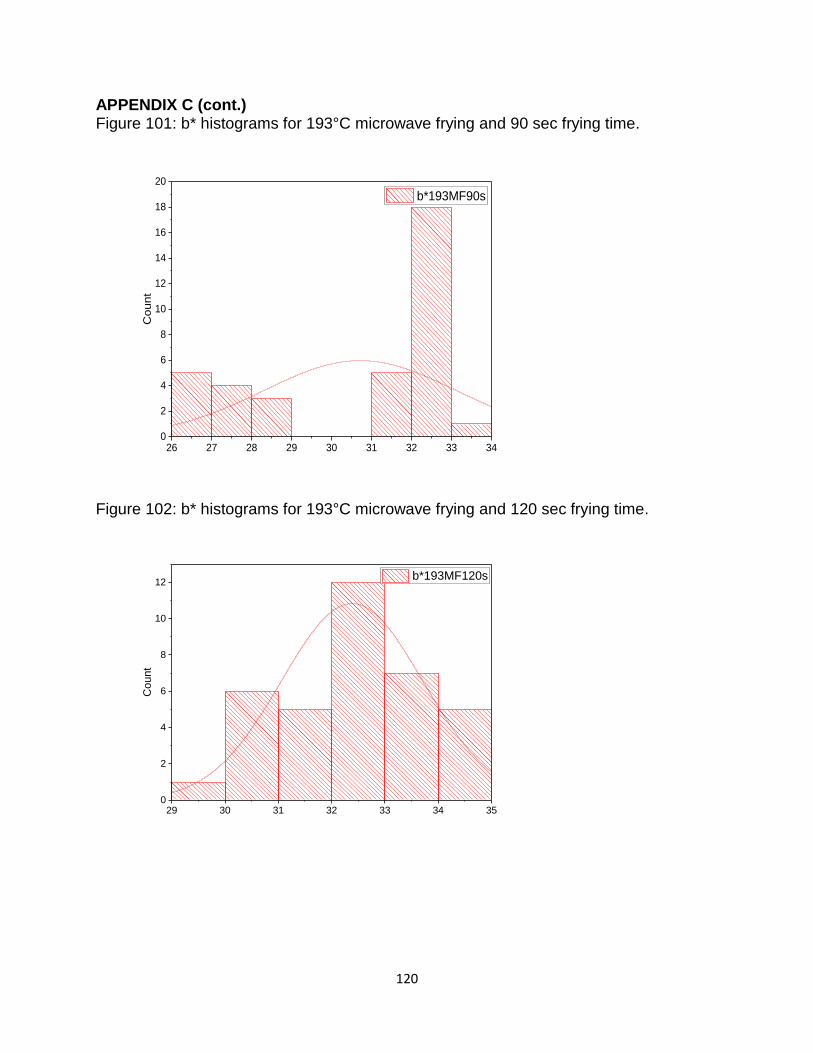
120
APPENDIX C (cont.) Figure 101: b* histograms for 193°C microwave frying and 90 sec frying time.
26 27 28 29 30 31 32 33 340
2
4
6
8
10
12
14
16
18
20
Count
b*193MF90s
Figure 102: b* histograms for 193°C microwave frying and 120 sec frying time.
29 30 31 32 33 34 350
2
4
6
8
10
12
Count
b*193MF120s

121
APPENDIX D: NORMALITY TEST AND HISTOGRAMS FOR CONVENTIONAL
FRYING AND MICROWAVE FRYING STRESS RELAXATION DATA
Table 24: Normality test for conventional frying stress relaxation data.
DF Statistic p-value Decision at
level (5%)
177°CCF60s 30 0.96
0.35 Shapiro-
Wilk: Can't
reject
normality
177°CCF90s 30 0.93 0.06 Shapiro-
Wilk: Can't
reject
normality
177°CCF120s 30 0.18 0.26 Kolmogoro
v-Smirnov:
Can't reject
normality
185°CCF60s 30 0.23 0.07 Kolmogoro
v-Smirnov:
Can't reject
normality
185°CCF90s 30 0.23 0.07 Kolmogoro
v-Smirnov:
Can't reject
normality

122
APPENDIX D (cont.) Table 24 (cont.): Normality test for conventional frying stress relaxation data.
185°CCF120s 30 0.23 0.07 Kolmogoro
v-Smirnov:
Can't reject
normality
193°CCF60s 30 0.24
0.06
Kolmogoro
v-Smirnov:
Can't reject
normality
193°CCF90s 30 0.17
0.30
Kolmogoro
v-Smirnov:
Can't reject
normality
193°CCF120s 30 0.43 1.84×10⁻⁵ Kolmogoro
v-Smirnov:
Reject
normality

123
APPENDIX D (cont.) Table 25: Kolmogorov-Smirnov normality test for microwave frying stress relaxation
data.
DF Statistic p-value Decision at
level (5%)
177C°MF60s 30 0.19 0.19 Can't reject
normality
177C°MF90s 30 0.11 0.89 Can't reject
normality
177C°MF120s 30 0.24 0.06 Can't reject
normality
185C°MF60s 30 0.18 0.24 Can't reject
normality
185C°MF90s 30 0.21 0.11 Can't reject
normality
185C°MF120s 30 0.18 0.25 Can't reject
normality
193C°MF60s 30 0.29 0.01 Reject
normality
193C°MF90s 30 0.25 0.04 Reject
normality
193C°MF120s 30 0.25 0.04 Reject
normality
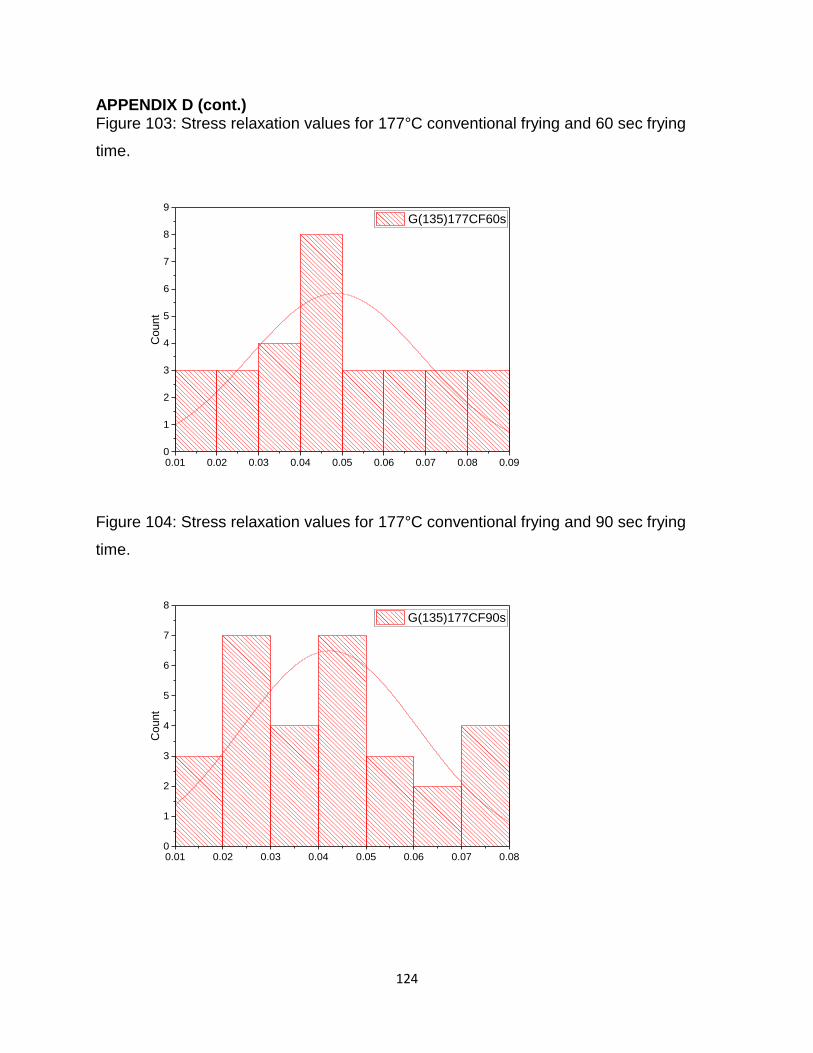
124
APPENDIX D (cont.) Figure 103: Stress relaxation values for 177°C conventional frying and 60 sec frying
time.
0.01 0.02 0.03 0.04 0.05 0.06 0.07 0.08 0.090
1
2
3
4
5
6
7
8
9
Count
G(135)177CF60s
Figure 104: Stress relaxation values for 177°C conventional frying and 90 sec frying
time.
0.01 0.02 0.03 0.04 0.05 0.06 0.07 0.080
1
2
3
4
5
6
7
8
Co
un
t
G(135)177CF90s

125
APPENDIX D (cont.) Figure 104: Stress relaxation values for 177°C conventional frying and 120 sec frying
time.
0.00 0.02 0.04 0.06 0.080
1
2
3
4
5
6
7
8
9
Coun
t
G(135)177CF120s
Figure 105: Stress relaxation values for 185°C conventional frying and 60 sec frying
time.
0.00 0.05 0.10 0.15 0.20 0.25 0.300
2
4
6
8
10
12
Co
un
t
G(135)185CF60s

126
APPENDIX D (cont.) Figure 106: Stress relaxation values for 185°C conventional frying and 90 sec frying
time.
0.00 0.05 0.10 0.15 0.200
2
4
6
8
10
12
Count
G(135)185CF90s
Figure 107: Stress relaxation values for 185°C conventional frying and 90 sec frying
time.
0.00 0.02 0.04 0.06 0.08 0.10 0.12 0.14 0.16 0.180
2
4
6
8
10
12
14
Cou
nt
G(135)185CF120s

127
APPENDIX D (cont.) Figure 108: Stress relaxation values for 193°C conventional frying and 60 sec frying
time.
0.00 0.02 0.04 0.06 0.08 0.10 0.12 0.14 0.16 0.180
2
4
6
8
10
12
Coun
t
G(135)193CF60s
Figure 109: Stress relaxation values for 193°C conventional frying and 90 sec frying
time.
0.00 0.02 0.04 0.06 0.08 0.10 0.12 0.14 0.16 0.18 0.200
1
2
3
4
5
6
7
8
9
Count
G(135)193CF90s

128
APPENDIX D (cont.) Figure 110: Stress relaxation values for 193°C conventional frying and 120 sec frying
time.
-0.5 0.0 0.5 1.0 1.5 2.0 2.5 3.00
5
10
15
20
25
30
Coun
t
G(135)193CF120s
Figure 111: Stress relaxation values for 177°C microwave frying and 60 sec frying time.
0.00 0.02 0.04 0.06 0.08 0.10 0.12 0.14 0.16 0.180
2
4
6
8
10
12
14
16
Co
un
t
G(130)177MF60s

129
APPENDIX D (cont.) Figure 112: Stress relaxation values for 177°C microwave frying and 90 sec frying time.
0.00 0.01 0.02 0.03 0.04 0.05 0.06 0.070
2
4
6
8
10
Co
un
t
G(130)177MF90s
Figure 113: Stress relaxation values for 177°C microwave frying and 120 sec frying
time.
0.00 0.02 0.04 0.06 0.08 0.10 0.12 0.140
2
4
6
8
10
Co
un
t
G(130)177MF120s

130
APPENDIX D (cont.) Figure 114: Stress relaxation values for 185°C microwave frying and 60 sec frying time.
0.00 0.02 0.04 0.06 0.08 0.10 0.12 0.14 0.16 0.180
2
4
6
8
10
12
Co
un
t
G(125)185MF60s
Figure 115: Stress relaxation values for 185°C microwave frying and 90 sec frying time.
0.00 0.02 0.04 0.06 0.08 0.10 0.12 0.14 0.16 0.180
2
4
6
8
10
12
Co
un
t
G(125)185MF90s

131
APPENDIX D (cont.) Figure 116: Stress relaxation values for 185°C microwave frying and 120 sec frying
time.
0.00 0.01 0.02 0.03 0.04 0.05 0.06 0.07 0.080
2
4
6
8
10
12
14
Coun
t
G(125)185MF120s
Figure 117: Stress relaxation values for 193°C microwave frying and 60 sec frying time.
0.00 0.02 0.04 0.06 0.08 0.10 0.12 0.14 0.160
2
4
6
8
10
12
Co
un
t
G(130)193MF60s

132
APPENDIX D (cont.) Figure 118: Stress relaxation values for 193°C microwave frying and 90 sec frying time.
0.00 0.05 0.10 0.15 0.200
2
4
6
8
10
Co
un
t
G(130)193MF90s
Figure 119: Stress relaxation values for 193°C microwave frying and 90 sec frying time.
0.00 0.02 0.04 0.06 0.08 0.10 0.12 0.140
2
4
6
8
10
12
14
Count
G(130)193MF120s

133
APPENDIX E: NORMALITY TEST AND HISTOGRAMS FOR CONVENTIONAL
FRYING AND MICROWAVE FRYING CONSUMER TEST DATA
Table 26: Shapiro-Wilk test for normality of consumer data.
DF Statistic p-value Decision at
level (5%)
Overall Liking
CF
101 0.94
1.73×10⁻⁴ Reject
normality
Overall Liking
MF
101 0.91
5.55×10⁻⁶ Reject
normality
Flavor CF
101 0.92 1.86×10⁻⁵ Reject
normality
Texture CF
101 0.96 0.00 Reject
normality
Flavor MF
101 0.95 5.90×10⁻⁴ Reject
normality
Texture MF
101 0.96 0.00 Reject
normality

134
APPENDIX E (cont.) Figure 120: Overall liking of conventionally fried French fries.
0 2 4 6 80
5
10
15
20
25
30
Count
Overall Liking CF
Figure 121: Liking of flavor of conventionally fried French fries.
0 2 4 6 8 100
5
10
15
20
25
30
Co
un
t
Flavor CF

135
APPENDIX E (cont.) Figure 122: Liking of texture of conventionally fried French fries.
0 2 4 6 8 100
5
10
15
20
Co
un
t
Texture CF
Figure 123: Overall liking of microwave fried French fries.
0 2 4 6 8 100
5
10
15
20
25
30
Co
un
t
Overall Liking MF
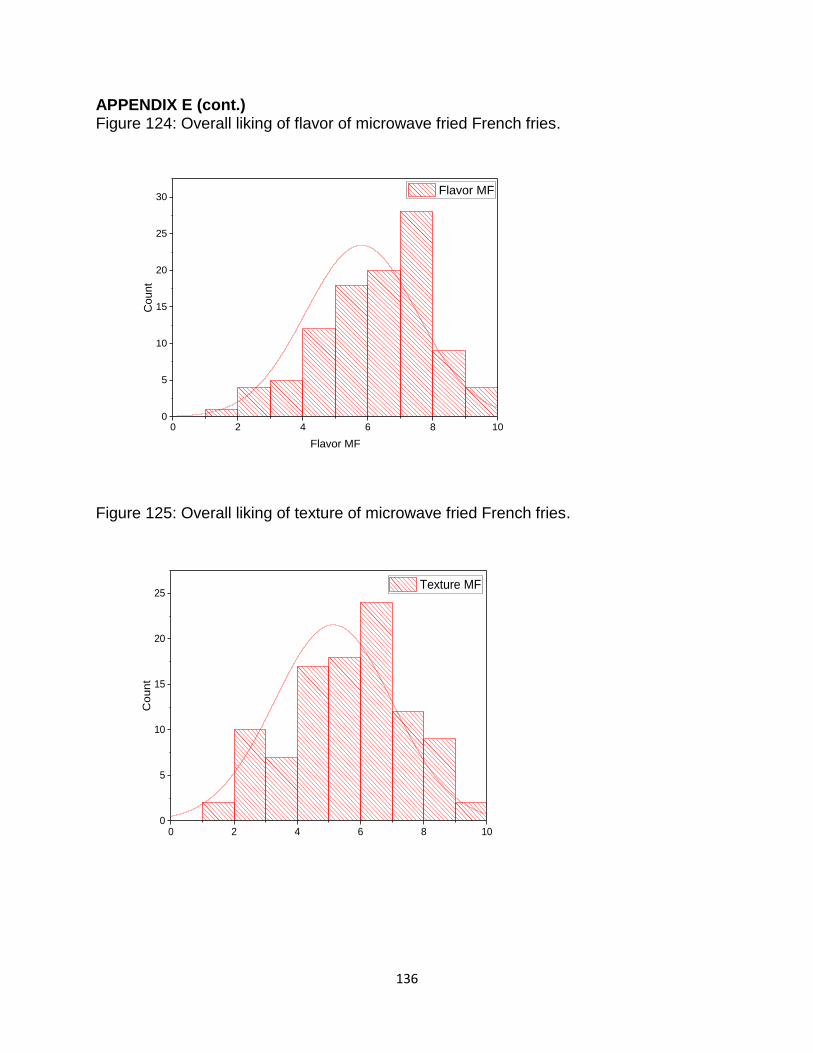
136
APPENDIX E (cont.) Figure 124: Overall liking of flavor of microwave fried French fries.
0 2 4 6 8 100
5
10
15
20
25
30
Count
Flavor MF
Flavor MF
Figure 125: Overall liking of texture of microwave fried French fries.
0 2 4 6 8 100
5
10
15
20
25
Co
un
t
Texture MF

137
APPENDIX F: IRB APPROVAL LETTER

138

139
APPENDIX G: QUESTIONNAIRE FOR CONSUMER TEST

140
OVERALL ACCEPTANCE OF FRENCH FRIES
Instructions: 1. Please follow the rinsing instructions before testing each sample:
Rinse your mouth with carbonated water
Rinse your mouth with warm water
Rinse with room temperature water
2. Before answering each question check to make sure the sample number labeled on the
dish is the same as that in the questions below.
3. After rating overall acceptance, save some sample to answer more questions.
4. Please repeat the rinse procedure before proceeding to next sample.
Sample Number: 101 How much do you like the sample OVERALL?
1 2 3 4 5 6 7 8 9
Dislike
extremely
Neither
like nor
dislike
Like
extremely
Please rinse before proceeding: Rinse first with carbonated water, warm water and then with
room temperature water.
Sample Number: 201 How much do you like the sample OVERALL?
1 2 3 4 5 6 7 8 9
Dislike
extremely
Neither
like nor
dislike
Like
extremely
Please rinse before proceeding: Rinse first with carbonated water, warm water and then with
room temperature water.
You have completed the first section of the test. Please do not change
your response. You can now proceed with the next section.

141
SPECIFIC ATTRIBUTE TEST OF FRENCH FRIES–FLAVOR &
TEXTURE
Instructions: 1. Please follow the rinsing instructions before testing each sample:
Rinse your mouth with carbonated water
Rinse your mouth with warm water
Rinse with room temperature water
2. Before answering each question check to make sure the sample number labeled on the
plate is the same as that in the questions below.
3. Rate the sample for the specific attribute asked below.
Sample Number: 101 How much do you like the FLAVOR of the sample?
1 2 3 4 5 6 7 8 9
Dislike
extremely
Neither
like nor
dislike
Like
extremely
Sample Number: 101 How much do you like the TEXTURE of the sample?
1 2 3 4 5 6 7 8 9
Dislike
extremely
Neither
like nor
dislike
Like
extremely
What do you like/ dislike about the sample:

142
SPECIFIC ATTRIBUTE TEST OF FRENCH FRIES–FLAVOR &
TEXTURE
Instructions: 4. Please follow the rinsing instructions before testing each sample:
Rinse your mouth with carbonated water
Rinse your mouth with warm water
Rinse with room temperature water
5. Before answering each question check to make sure the sample number labeled on the
dish is the same as that in the questions below.
6. Rate the sample for the specific attribute asked below.
Sample Number: 201 How much do you like the FLAVOR of the sample?
1 2 3 4 5 6 7 8 9
Dislike
extremely
Neither
like nor
dislike
Like
extremely
Sample Number: 201 How much do you like the TEXTURE of the sample?
1 2 3 4 5 6 7 8 9
Dislike
extremely
Neither
like nor
dislike
Like
extremely
What do you like/ dislike about the sample:
You have now completed the test. Thank you for your time.