Embed Size (px)
Citation preview

TRANSPORTATION RESEARCH RECOIW 1284 23
Comparison of Mechanical Properties of High-Strength Concrete Made with Different Raw Materials
MICHAEL L. LEMING
Properties of high-strength concrete can vary significantly depending on the specific raw materials used and the strength levels attained. Data on these characteristics are needed by agencies such as departments of transportation that must consider construction alternatives with various materials and develop plans on the basis of economics as well as engineering properties. Results are presented of a study to determine the properties of high-strength concrete produced with several sets of materials. These materials represent those used in structures built under North Carolina Department of Transportation control. Data obtained included compressive strength, creep, shrinkage, elastic modulus, modulus of rupture, and splitting tensile strength of high-strength concrete produced from a variety of sources and types of materials. Rudimentary cost comparisons were also made .
Practical use of high-strength concrete-concrete with a compressive strength in excess of 6,000 pounds per square inch (psi)-was rare until the 1960s. The compressive strength of commercially available concrete has increased over time (1,2), however, and high-strength concrete is now reasonably available in many locations.
The ultimate strength level, related mechanical properties , and cost-effectiveness of high-strength concrete are strongly influenced by the raw materials used. Data on characteristics, ranges, and typical properties of such concretes are required for informed planning by agencies such as departments of transportation, which must design, build, and maintain concrete structures produced from many different materials, particularly aggregates. Considerations must include economic factors as well as engineering properties.
PURPOSE
Other studies (3) have investigated the effects on concrete performance in Texas of different cements, fly ashes, and aggregate characteristics, primarily using dense limestone. This study was conducted to determine the mechanical properties of high-strength concrete using materials that are commonly available and are representative of many materials used in structures built under the control of the North Carolina Department of Transportation (NCDOT).
Results are presented for compressive strength, modulus of rupture, splitting tensile strength, elastic modulus, creep,
Department of Civil Engineering, Campus Box 7908, North Carolina State University, Raleigh, N.C. 27695-7908.
and drying shrinkage of concretes produced from various sources and with various types of materials. Simple cost comparisons are also given.
OVERVIEW OF INVESTIGATION
Initially a series of small laboratory batches was produced to determine proportions of specific raw materials for further study. The mixes selected were labeled the "B" series.
Ten B-series mixes were investigated. Aggregate combinations from the coastal, piedmont, and mountain regions were selected. Three mineral admixtures were chosen that are reasonably available to concrete producers in North Carolina: a fly ash, a granulated blast furnace slag, and a silica fume slurry product.
A high-absorbency, crushed-shell limestone and a manufactured limestone sand were chosen from the coastal region near Wilmington , North Carolina (Castle Hayne). A crushed granite with gneiss, schist, and traces of mica with a natural silica sand was selected from the piedmont area near Raleigh, North Carolina. A partially crushed gravel was selected from the Asheville, North Carolina (Swannanoa), area in the mountains and combined with a natural silica sand.
A fourth coarse aggregate was selected for its potential to produce high-strength concrete . This was a diabase and came from the Durham, North Carolina (piedmont), area. It was used in combination with silica sand from nearby Raleigh .
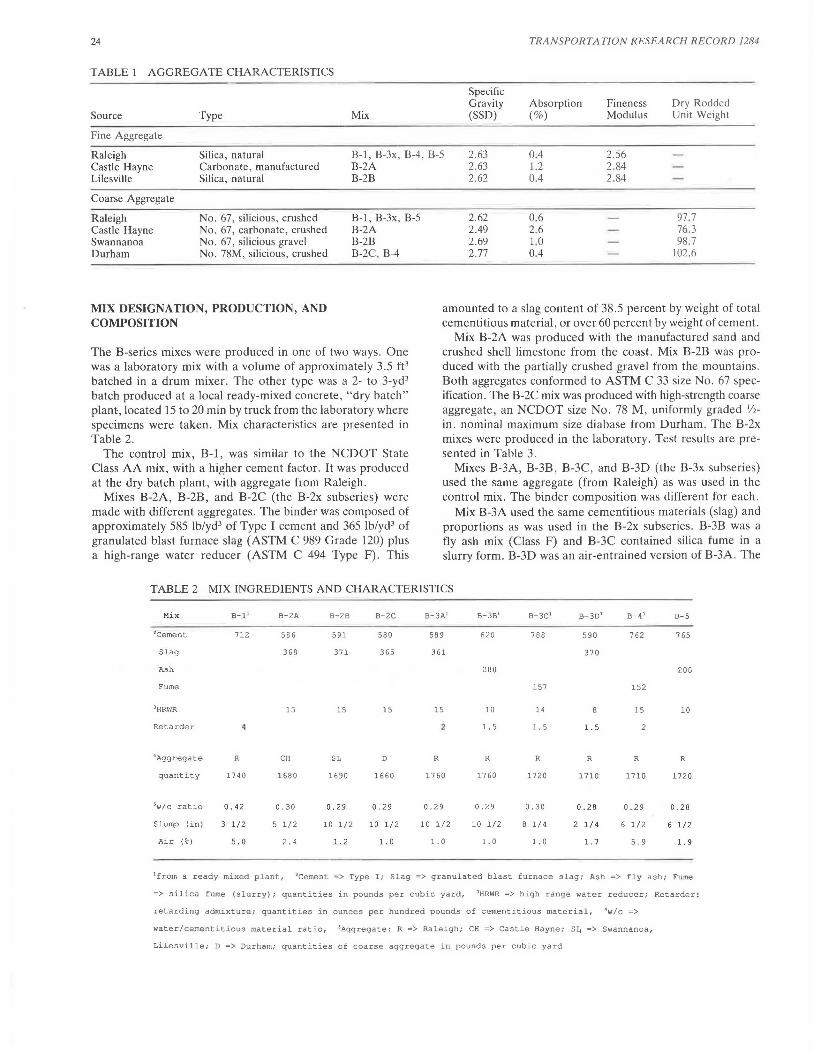
Sands selected were reasonable to use with the coarse aggregates selected. All aggregates complied with NCDOT specifications. (See Table 1.)
Type I portland cement was used in this phase, because it is standard for most work in North Carolina. Although differences in brands of portland cement were found in earlier work, these were not critical. Therefore, only one brand of cement was used.
Chemical admixtures (retarders and high-range water reducers) were limited to one brand. Small variations in the dosage of these admixtures were not found to be critical, compared with differences caused by aggregates or cementitious materials. Therefore, selection of a specific combination and dosage of chemical admixtures was done on a caseby-case basis, according to the quantities, sources, and types of other raw materials; desired plastic concrete properties; and environmental conditions .
24
TABLE 1 AGGREGATE CHARACTERISTICS
Source Type Mix
Fine Aggregate
Specific Gravity (SSD)
TRANSPORTATION RESEARCH RECORD 1284
Absorption (%)
Fineness Modulus
Dry Rodded Unit Weight
Raleigh Castle Hayne Lilesville
Silica , natural Carbonate , manufactured Silica, natural
B-1, B-3x, B-4, B-5 B-2A
2. 63 2.63 2.62
0.4 1.2 0.4
2.56 2.84 2.84
Coarse Aggregate
Raleigh Castle Hayne Swannanoa Durham
No. 67, silicious, crushed No . 67, carbonate , crushed No. 67 , silicious gravel No . 78M, silicious, crushed
MIX DESIGNATION, PRODUCTION, AND COMPOSITION
B-2B
B-1, B-3x , B-5 B-2A B-2B B-2C. B-4
The B-series mixes were produced in one of two ways. One was a laboratory mix with a volume of approximately 3.5 ft 3
batched in a drum mixer. The other type was a 2- to 3-yd3
batch produced at a local ready-mixed concrete, "dry batch " plan~, located 15 to 20 min by truck from the laboratory where specimens were taken. Mix characteristics are presented in Table 2.
The control mix, B-1, was similar to the NCDOT State Class AA mix, with a higher cement factor. It was produced at the dry batch plant, with aggregate from Raleigh.
Mixes B-2A, B-2B, and B-2C (the B-2x subseries) were made with different aggregates. The binder was composed of approximately 585 lb/yd3 of Type I cement and 365 lb/yd3 of granulated blast furnace slag (ASTM C 989 Grade 120) plus a high-range water reducer (ASTM C 494 Type F) . This
2.62 2.49 2.69 2.77
0.6 2.6 LO 0.4
97.7 76.3 98 .7
102.6
amounted to a slag content of 38.5 percent by weight of total cementitious material, or over 60 percent by weight of cement.
Mix B-2A was produced with the manufactured sand and crushed shell limestone from the coast. Mix B-2B was produced with the partially crushed gravel from the mountains. Both aggregates conformed to ASTM C 33 size No . 67 specification. The B-2C mix was produced with high-strength coarse aggregate, an NCDOT size No. 78 M , uniformly graded 1/2-
in. nominal maximum size diabase from Durham. The B-2x mixes were produced in the laboratory. Test results are presented in Table 3.
Mixes B-3A, B-3B, B-3C, and B-3D (the B-3x subseries) used the same aggregate (from Raleigh) as was used in the control mix. The binder composition was different for each .
Mix B-3A used the same cementitious materials (slag) and proportions as was used in the B-2x subseries. B-3B was a fly ash mix (Class F) and B-3C contained silica fume in a slurry form . B-3D was an air-entrained version of B-3A . The
TABLE 2 MIX INGREDIENTS AND CHARACTERISTICS
Mix B-1 1 B-2A B-2B B-2C B-3A1 B-3B' B-3C 1 8-3D' B-4 1 B-5
2Cernent 712 586 591 580 58 9 620 788 590 7 62 765
Slag 3 68 371 365 361 370
A-'h .200 .200
Fume 157 152
1 HRWR 15 15 15 15 10 14 15 10
Retarder 2 1. 5 1. 5 1. 5 2
4Aggregate R CH SL D R R R R R R
quantity 17 40 1680 1690 1660 17 60 1760 1720 1710 1710 1720
5w/c ratio 0.4 2 0.30 0.29 0. 2 9 0 .29 0.29 0.30 0 . 26 0. 2 9 0.28
Slump (in) 3 1/2 5 1/2 10 1/2 10 1 /2 10 1/2 10 1/2 8 1/4 2 1/ 4 6 1/2 6 1/2
Air (%) 5.0 2.4 1. 2 1. 0 1. 0 1. 0 1. 0 1. 7 5 . 9 1. 9
1frorn a ready mixed plant, 2Cement => Type I; Slag => granulated blast furnace slag; Ash => fly ash; Fume
=>silica fume (slurry); quantities in pounds per cubic yard, JHRWR =>high range water reducer; Retarder :
retarding admixture; quantities in ounces per hundred pounds of cementitious material, ~w / c =>
water/cementitious material ratio, 5Aggregate: R •> Raleigh; CH => Castle Hayne; S~ ~> Swannanoa,
Lilesville; D => Durham; quantities of coarse aggregate in pounds per cubic yard

Leming 25
TABLE 3 SUMMARY DATA: AGGREGATE EFFECTS
Mix B- 1 2 B-2 A B-2B B-2C B-3A 2
Aggregate R CH SL D R
Cement 712 586 591 580 5!t9
Slag 368 371 365 361
w/c ratio 0.42 0.30 0.29 0. 29 0.29
Air.(%) 5 . 0 2. 4 1.2 1.0 1.0
Compressive Strength (psi) ( 4" x 8 11, stee l molds, except B-1 with both sizes)
4x8 6x12
7 days 6380 7350 5890 87 80 9590
2 8 days 7710 6930 9420 7350 10' 92 0 11,570
1 year 9160 8720 10,220 9680 13, 030 13, 170
Modulus of Rupture (psi) ( 6" x 6" x 18 11 beams, third point loading)
2 8 days 680 10 60 llOO 1580 1345
1 year 775 1155 ll45 1675 1380
Splitting Tensile (psi) ( 6" x 12")
28 days 415 425 430 550 485
1 year 485 645 490 615 645
Elastic Modulus {million psi) ( 6" x 12")
28 days 4.07 4 .98 4.03 6.52 4.97
1 year 4.40 5. 72 4.50 6.59 5.66
Specific Creep (millionths/psi) (6" x 12'', except B-1 with both sizes)
0.34 0.28 0.16 0 .19 0.16 0 .13
Shrinkage (microstrain)
526 439 454 375 343
1 see Table 2 for more details ' ready mixed, R => Raleigh; CH => Castle
Hayne; SL => Swannanoa, Lilesville; D => Durham;
B-3x mixes were produced at the concrete batch plant. (See Table 4.)
Mix B-4 had the highest compressive strength. The coarse aggregate used in this mix was the No. 78 M diabase from Durham , North Carolina. The fine aggregate was the same as that used in the B-3x subseries. Silica fume in slurry form was used. This mix was produced in the laboratory. (See Table 5.)
B-5 was another fly ash mix used to examine additional curing effects. B-5 was produced in the laboratory.
The weights of silica fume are weights of the slurry, which contains approximately 50 percent solids (by weight). Percentages of mineral admixtures used are percents by weight of total cementitious material. A high-range water reducer was used in all mixes (except B-1) to obtain the desired workability . A retarding admixture was successfully used to control slump loss in the B-1 and B-3x mixes that had been produced in the summer at the ready-mixed concrete batch plant .
A minimum water content of 260 to 280 lb/yd3 was found to reduce excessive stickiness of these high-strength concretes , where W/C ratio is water to cementitious material.
Standard procedures for sampling, curing, and testing concrete were followed except where noted. Test results for compressive strength were the average of three specimens each.
Modulus of rupture , splitting tensile strength , and elastic modulus values were the average of two specimens each.
Compressive strengths were obtained from 4- by 8-in. specimens cast in steel molds, except B-1, which gives results for both sizes of cylinders . Elastic modulus and splitting tensile strength were determined from 6- by 12-in. cylinders. Modulus of rupture was determined from 6- by 6- by 30-in. prisms.
Creep was determined on the basis of 4- by 8-in. cylinder specimens rather than 6- by 12-in . specimens, except the Bl mix, which used both. Drying shrinkage values were determined from 4- by 4- by 11-in. prisms.
Comparisons of mechanical properties are presented in Tables 6 and 7 .
OBSERVATIONS AND DISCUSSION
Slump Control
Slump loss of the plant-batched mixes using a high-range water reducer was successfully controlled by also using a retarding and water-reducing admixture (ASTM C 494 Type D). The concrete was redosed with high-range water reducer as needed. No excessive retardation was noticed .
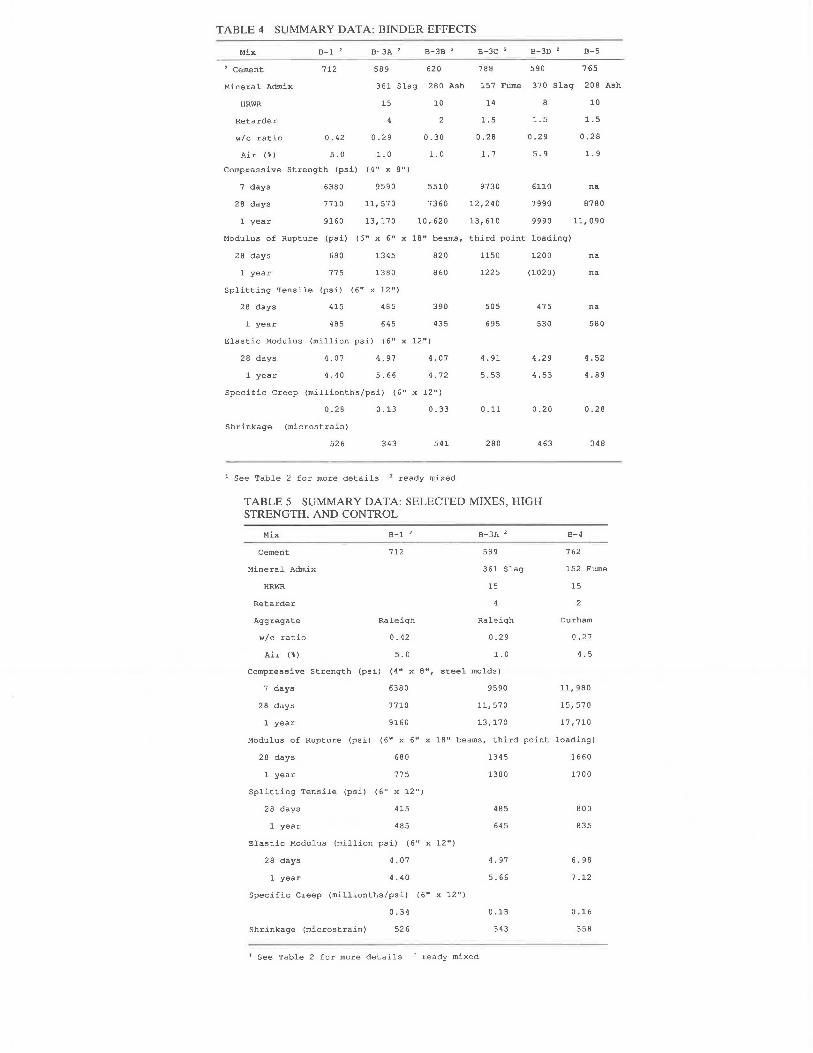
TABLE 4 SUMMARY DATA: BINDER EFFECTS
Mix B-1 2 8-3A 2 8-38 ' 8-3C 2 8-30 2 8-5
2 Cement 712 589 620 788 590 765
Mineral Admix 361 Slag 280 Ash 157 Furne 370 Slag 208 Ash
HRWR 15
Retarder
w/c ratio 0. 42 0.29
Air (%) 5.0 1. 0
Compressive Strength (psi) (4" x 8 11)
days 6380 9590
28 days 7710 11, 570
year 9160 13,170
10
0.30
1. 0
5510
7360
10' 620
14
1. 5
0.28
1. 7
9730
12,240
13,610
10
1. 5 1.5
0. 2 9 0.28
5.9 1. 9
6110 na
7 990 8780
9990 11, 090
Modulu.5 of Rupture (psi) ( 611 x 6 11 x 18 11 beams, third point loading)
28 days 680 1345 820 1150 1200
year 775 1380 8 60 1225 (1020)
Splitting Tensile (psi) (6'' x 12 11)
28 days 415 485 390 505 47 5
year 485 645 435 695 530
Elastic Modulus (million psi) (6" x 12")
28 days 4.07 4. 97 4.07 4.91 4. 2 9
year 4.40 5.66 4. 72 5.53 4.53
Specific Creep (millionths/psi) (6" x 12")
0.28 0.13 0.33 0 .11 0.20
Shrinkage (microstrain)
526 343 541 280 463
1 See Table 2 for more details 2 ready mixed
TABLE 5 SUMMARY DATA: SELECTED MIXES, HIGH STRENGTH, AND CONTROL
Mix B-1 2 8-3A 2
Cement 712 589
Mineral Admix 361 Slag
HRWR 15
Retarder
Aggregate Raleigh Raleigh
w/c ratio 0.42 0.29
Air (%) 5.0 1. 0
Compressive Strength (psi) (4 11 x 8 11, steel molds)
days 6380 9590
28 c.lay~ 7710 11,~70
year 9160 13,170
na
na
na
580
4.52
4.89
0.28
348
8-4
762
152 Furne
15
2
Durham
0.27
4.5
11, 980
1~,~70
17,710
Modulus of Rupture (psi) (6" x 6" x 18 11 beams, third point loading)
28 days 680
year 775
Splitting Tensile (psi) (6" x 12")
28 days 415
year 485
Elastic Modulus (million psi) (6" x 12")
28 days 4.07
year 4.40
Specific Creep (millionths/psi) (6" x 12 11)
Shrinkage (microstrain)
0.34
526
1 See Table 2 for more details 2 ready mixed
1345 1660
1380 1700
485 800
645 835
4. 97 6.98
5.66 7.12
0.13 0.16
343 358
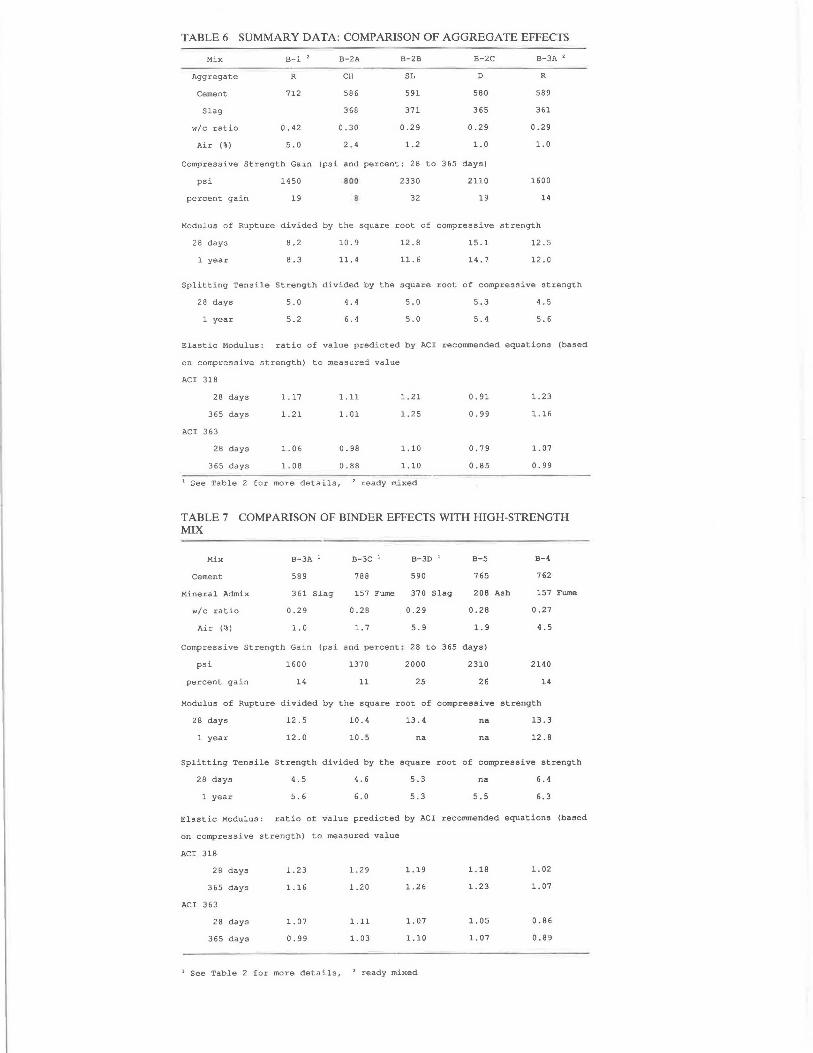
TABLE 6 SUMMARY DATA: COMPARISON OF AGGREGATE EFFECTS
Mix
Aggregate
Cement
Slag
w/c ratio
Air (%)
B-1 2
R
712
0.42
5.0
B-2A
CH
586
368
0.30
2.4
B-2B
SL
591
371
0.29
1.2
B-2C
D
580
365
0.29
1.0
Compressive Strength Gain (psi and percent: 28 to 365 days)
psi 1450
percent gain 19
800 2330
32
2110
19
B-3A '
R
589
361
0.29
1.0
1600
14
Modulus of Rupture divided by the square root of compressive strength
28 days
year
8.2
8.3
10.9 12.8
11.4 11. 6
15.l 12 . 5
14.7 12.0
Splitting Tensile Strength divided by the square root of compressive strength
28 days
year
5.0
5.2
4.4
6.4
5.0
5.0
5.3
5.4
4.5
5.6
Elastic Modulus: ratio of value predicted by ACI recommended equations (based
on compressive strength) to measured value
ACI 318
28 days
365 days
ACI 363
28 days
365 days
1.17
1. 21
1. 06
1. 08
1.11
1. 01
0.98
0.88
1. 21
1.25
1.10
1.10
1 See Table 2 for more details, 2 ready mixed
0. 91
0.99
0.79
0.85
1. 23
1.16
1. 07
0.99
TABLE 7 COMPARISON OF BINDER EFFECTS WITH HIGH-STRENGTH MIX
Mix
Cement
Mineral Admix
w/c ratio
Air (%)
B-3A 1
589
361 Slag
0.29
1.0
B-3C 1 B-3D 1
788 590
157 Fume 370 Slag
0.28 0.29
1.7 5.9
B-5
765
208 Aoh
0.28
1. 9
Compressive Strength Gain (psi and percent: 28 to 365 days)
psi 1600
percent gain 14
1370
11
2000
25
2310
26
B-4
762
157 Fume
0.27
4.5
2140
14
Modulus of Rupture divided by the square root of compressive strength
28 days 12. 5 10.4
year 12.0 10.5
13.4
na
na
na
13.3
12.8
Splitting Tensile Strength divided by the equare root of compressive strength
28 days
year
4.5
5.6
4.6
6.0
5.3
5.3
na
5.5
6.4
6.3
Elastic Modulus: ratio of value predicted by AC! recorrunended equations (based
on compressive strength) to measured value
ACI 318
28 days
365 days
ACI 363
28 days
365 days
1. 23
1.16
1. 07
0.99
1.29
1.20
1.11
1. 03
1.19
1. 26
1. 07
1.10
1 See Table 2 for more details, 2 ready mixed
1.18
1.23
1. 05
1. 07
1. 02
1. 07
0.86
o. 0 9
28
Compressive Strength
Aggregate had a profound influence on compressive strength. Compressive strengths at 28 days with the same binder but different aggregates ranged from just over 7 ,000 psi to well over 11,000 psi.
Differences in compressive strength due to mineral admix: ture type. and quantity were eq1rnlly significant. Compressive strength at 28 days with the same good quality aggregate ranged from over 7,000 to over 12,000 psi.
Increasing the total air content from 1 percent to almost 6 percent resulted in about 5 percent compressive strength loss for each percent increase in air content (see Mixes B-3A and B-3D, Table 4).
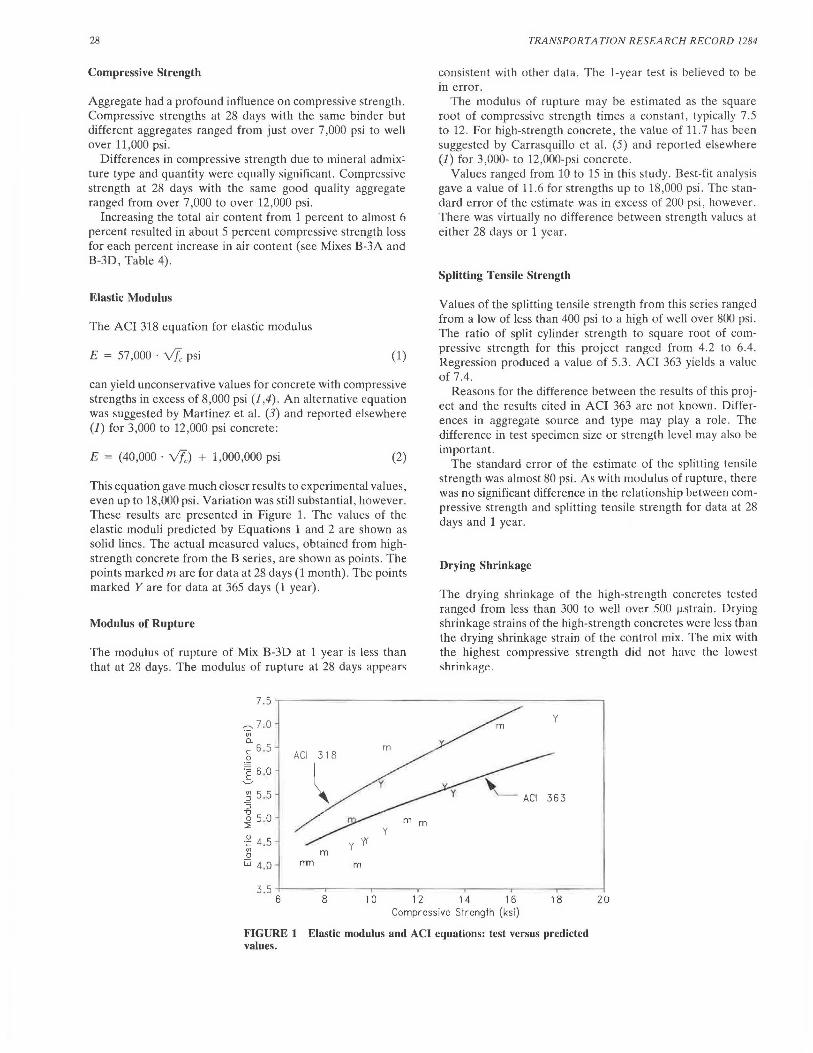
Elastic Modulus
The ACI 318 equation for elastic modulus
E = 57 ,000 · Vfc psi (1)
can yield unconservative values for concrete with compressive strengths in excess of 8,000 psi (1,4). An alternative equation was suggested by Martinez et al. (3) and reported elsewhere (1) for 3,000 to 12,000 psi concrete:
E = (40,000 · Vfc) + 1,000,000 psi (2)
This equation gave much closer results to experimental values, even up to 18,000 psi . Variation was still substantial, however. These results are presented in Figure 1. The values of the elastic moduli predicted by Equations 1 and 2 are shown as solid lines . The actual measured values, obtained from highstrength concrete from the B series, are shown as points. The points marked mare for data at 28 days (1 month). The points marked Y are for data at 365 days (1 year) .
Modulus of Rupture
The modulus of rupture of Mix B-3D at 1 year is less than that at 28 day~ . The modulus of rupture at 28 days appP.M~
~7 .0 'iii Cl <: 6 .5 0
~ 5.5 :> 'O ~ 5.0
,g 4.5 VJ 0
w 4.0
m
m nm m
TRANSPORTATION RESEARCH RECORD 1284
consistent with other data. The 1-year test is believed to be in error.
The modulus of rupture may be estimated as the square root of compressive strength times a constant, typically 7 .5 to 12. For high-strength concrete, the value of 11. 7 has been suggested by Carrasquillo et al. (5) and reported elsewhere (1) for 3,000- to 12,000-psi concrete.
Values ranged from 10 to 15 in this study. Best-fit analysis gave a value of 11.6 for strengths up to 18 ,000 psi . The standard error of the estimate was in excess of 200 psi, however. There was virtually no difference between strength values at either 28 days or 1 year.
Splitting Tensile Strength
Values of the splitting tensile strength from this series ranged from a low of less than 400 psi to a high of well over 800 psi. The ratio of split cylinder strength to square root of compressive strength for this project ranged from 4.2 to 6.4. Regression produced a value of 5.3 . ACI 363 yields a value of 7.4.
Reasons for the difference between the results of this project and the results cited in ACI 363 are not known. Differences in aggregate source and type may play a role. The difference in test specimen size or strength level may also be important.
The standard error of the estimate of the splitting tensile strength was almost 80 psi. As with mutlulus of rupture, there was no significant difference in the relationship between compressive strength and splitting tensile strength for data at 28 days and 1 year.
Drying Shrinkage
The drying shrinkage of the high-strength concretes tested ranged from Jess than 300 to well over .'iOO µstrain. Drying shrinkage strains of the high-strength concretes were less than the drying shrinkage strain of the control mix. The mix with the highest compressive strength did not have the lowest shrinbef:.
y
3.5 +-~~~~~~~~~~~~~~~~~~~~~~~-i
6 8 10 12 14 16 18 20 Compressive Strength (ksi)
FIGURE 1 Elastic modulus and ACI equations: test versus predicted values.
Leming
Comparing concrete made with the same aggregate, but different paste composition (slag and silica fume, B-3A and B-3C, Table 4) , the difference in shrinkage was about 60 µstrain . Comparing concrete made with different aggregates (see B-3C and B-4, Table 7), the difference in shrinkage was similar, about 80 µstrain.
Multiple linear regression of paste volume and the inverse of compressive strength versus drying shrinkage proved interesting. Except for the mixes containing fly ash , drying shrinkage (in microstrain with a standard error of 45 µstrain) could be estimated from
E,h = 321 . Vp + . 0 000 - 2 690 . Vp - 3 130 (3)
fc ' fc '
where Vp is the volume of paste (in cubic feet per cubic yard) and fc is the compressive strength at 28 days (in kips per square inch).
Nasser and Al-Manaseer (6) conclude that shrinkage of plain concrete is nearly the same as concrete with fly ash and superplasticizers. Although the absolute values found are similar to theirs, differences were found that were linked to the mineral admixture used. The fly ash mixes had a higher drying shrinkage than that predicted by this formula.
Because differences in percent mineral admixture were tied directly to the type of mineral admixture used, the effect of changes in percent mineral admixture on the shrinkage strain was indistinguishable from the effect of the mineral admixture itself.
Creep
The specific creep of the control mix was almost 20 percent higher for the 6- by 12-in. specimens than for the 4- by 8-in. specimens (B-1, Table 3).
As with drying shrinkage, variation in specific creep depended on paste composition, strength levels, and aggregate source. The effect of the aggregate source was pronounced.
For mixes made with the same aggregate (Raleigh), but different paste composition [slag (B-3A) and silica fume (B-3C), Table 4], the difference in specific creep was only 0.02 millionths per psi. Both mixes had similar strength levels. Comparing two other mixes [slag (B-2C) and silica fume (B-4), Tables 5 and 6] made with the same aggregate (Durham), there was no measured difference in specific creep, even with a difference in compressive strength over 5 ,000 psi.
Comparing the difference between mixes made with the same paste composition but different aggregates (B-3C and B-4, Table 7), the difference in shrinkage was 0.05 millionths per psi. In this case the stronger mix (by over 3,000 psi) , with smaller aggregate, had the higher creep.
A model to predict specific creep was developed using multiple regression. As with shrinkage, the fly ash mixes did not fit the model.
The following model provided the best fit of the data :
. . 6.06 4.05 39.7 ( ) Specific creep = 0. 770 - ----;-- - - + 4
1c E (Jc· £)
Specific creep is in millionths of an inch per inch per psi , fc is compressive strength in kips per square inch, and Eis the
29
elastic modulus in million pounds per square inch. The standard error in the forecast is about 10 percent, excluding the fly ash mix data.
The mixes containing only portland cement, or those with slag or silica fume, conform to the model, whereas mixes with fly ash were significantly different from the model predictions.
Curing conditions for B-5 were altered to adjust for differences in rate of strength gain of fly ash mixes. Moist curing was extended for B-5 for a total of 42 days. Storage in 50 percent relative humidity before loading was maintained according to ASTM standards. The creep of this mix was also significantly different from that predicted by the model, however.
As with drying shrinkage, the values obtained in this study, including the fly ash mixes, are within typical expected ranges (7). The fly ash mixes are simply different.
Drying shrinkage and specific creep were highly correlated for all mixes.
COST CONSIDERATIONS
Comparison of concrete mixes in terms of cost per cubic yard is not meaningful when 4,000- or 5,000-psi concrete is compared with 10,000- or 12,000-psi concrete, because of substantial differences in design criteria or life-cycle costs. For concretes with significantly different compressive strengths, dollars per 1,000 psi are somewhat better for comparison.
Raw material costs cannot, by themselves, provide a realistic basis for estimating the price of high-strength concrete. Although operating costs and delivery costs may change only slightly, both profit margins and risk assessments will generally increase.
Profit margins may increase as competitors drop out of bidding on high-strength concrete work. Accurate contingency factors will be largely unknown until more historical data have been developed on high-strength concrete, so estimates will tend to be high . Rigorous quality control and quality assurance programs will be required.
An accurate estimate of high-strength concrete cost is therefore possible at best only for a well-defined set of conditions. If these limits are recognized, however, estimates are still useful and available for comparison.
Costs of several representative mixes were calculated using the following assumptions (for mineral admixtures in the quantities used):
• $10/ton-aggregates; • $60/ton-portland cement; • $8/gal-high-range water reducers; • $30/yd3-silica fume (slurry); and • $6/yd3- granulated blast furnace slag.
Normal operating and delivery costs are assumed to be $15/yd3
although this depends heavily on distance to the job . Additional quality control and a more sophisticated quality assurance program by the supplier could be estimated to cost from $10 to $20/yd3 on a moderately sized job. Additional charges for profit and contingency are assumed to be 10 percent for commodity-grade concrete and 20 percent for high-strength concrete. These figures were derived on the basis of estimates from previous experience made by the author.
30
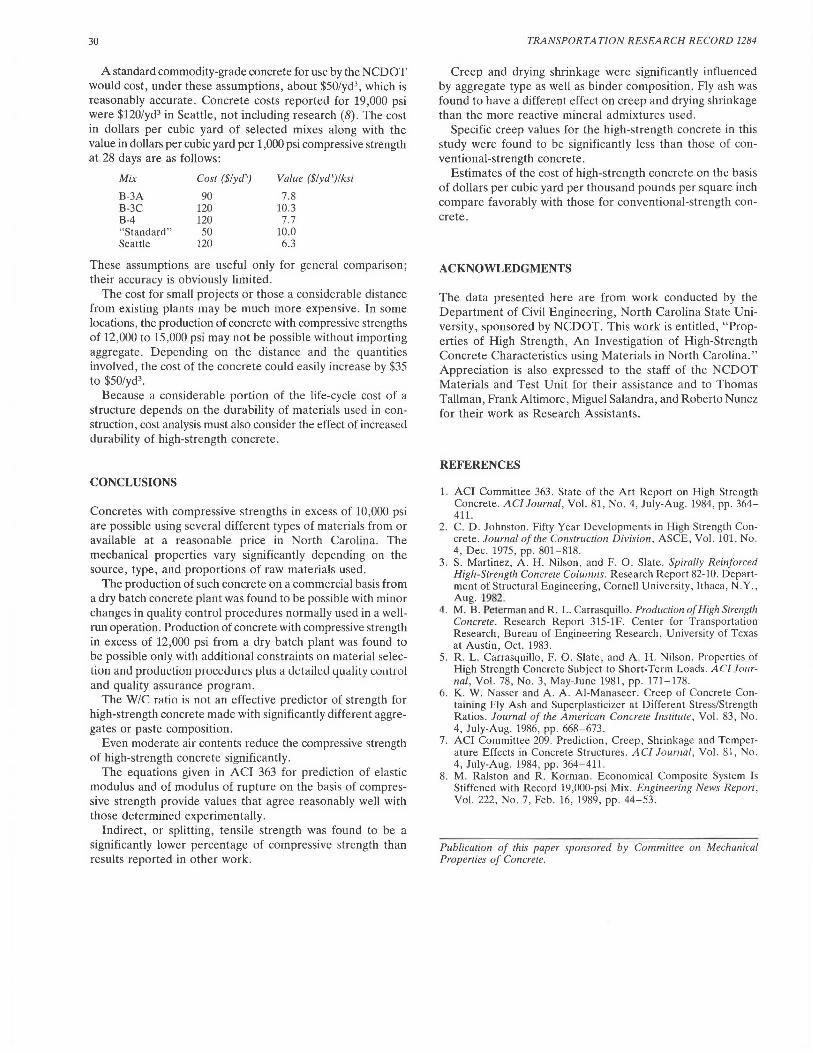
A standard commodity-grade concrete for use by the NCDOT would cost, under these assumptions, about $50/yd3 , which is reasonably accurate. Concrete costs reported for 19,000 psi were $120/yd3 in Seattle, not including research (8) . The cost in dollars per cubic yard of selected mixes along with the value in dollars per cubic yard per 1,000 psi compressive strength at 28 days are as follows:
Mix Cost ($/yd')
B-3A 90 B-3C 120 B-4 120 "Standard" 50 Seattle 120
Value ($/yd')lksi
7.8 10.3 7.7
10.0 6.3
These assumptions are useful only for general comparison; their accuracy is obviously limited .
The cost for small projects or those a considerable distance from existing plants may be much more expensive . In some locations, the production of concrete with compressive strengths of 12,000 to 15,000 psi may not be possible without importing aggregate . Depending on the distance and the quantities involved, the cost of the concrete could easily increase by $35 to $50/yd3
•
Because a considerable portion of the life-cycle cost of a structure depends on the durability of materials used in construction, cost analysis must also consider the effect of increased durability of high-strength concrete.
CONCLUSIONS
Concretes with compressive strengths in excess of 10,000 psi are possible using several different types of materials from or available at a reasonable price in North Carolina. The mechanical properties vary significantly depending on the source, type, and proportions of raw materials used.
The production of such concrete on a commercial basis from a dry batch concrete plant was found to be possible with minor changes in quality control procedures normally used in a wellrun operation. Production of concrete with compressive strength in excess of 12,000 psi from a dry batch plant was found to be possible only with additional constraints on material selecliuu am! pruUUl:liUll j.JIUl:t:UUJt:S µ!us a uelaileu 4ualily 1,;onl10) and quality assurance program.
The WI\. rntio is not an effective predictor of strength for high-strength concrete made with significantly different aggregates or paste composition.
Even moderate air contents reduce the compressive strength of high-strength concrete significantly.
The equations given in ACI 363 for prediction of elastic modulus and of modulus of rupture on the basis of compressive strength provide values that agree reasonably well with those determined experimentally.
Indirect, or splitting, tensile strength was found to be a significantly lower percentage of compressive strength than results reported in other work.
TRANSPORTATION RESEARCH RECORD 1284
Creep and drying shrinkage were significantly influenced by aggregate type as well as binder composition . Fly ash was found to have a different effect on creep and drying shrinkage than the more reactive mineral admixtures used .
Specific creep values for the high-strength concrete in this study were found to be significantly less than those of conventional-strength concrete.
Estimates of the cost of high-strength concrete on the basis of dollars per cubic yard per thousand pounds per square inch compare favorably with those for conventional-strength concrete.
ACKNOWLEDGMENTS
The data presented here are from work conducted by the Department of Civil Engineering, North Carolina State University, sponsored by NCDOT. This work is entitled, "Properties of High Strength, An Investigation of High-Strength Concrete Characteristics using Materials in North Carolina." Appreciation is also expressed to the staff of the NCDOT Materials and Test Unit for their assistance and to Thomas Tallman, Frank Altimore, Miguel Salandra, and Roberto Nunez for their work as Research Assistants.
REFERENCES
1. ACI Committee 363. State of the Art Report on High Strength Concrete. AC/ Journal, Vol. 81, No. 4, July-Aug. 1984, pp. 364-411.
2. C. D. Johnston . Fifty Year Developments in High Strength Concrete. Journal of the Construction Division , ASCE , Vol. 101 , No . 4, Dec. 1975, pp . 801-818.
3. S. Martinez, A. H. Nilson, and F. 0. Slate. Spirally Reinforced High-Strength Concrete Columns. Research Report 82-10. Department of Structural Engineering, Cornell University, Ithaca, N.Y., Aug. 1982.
4. M. B. Peterman and R . L. Carrasquillo. Production of High Strength Concrete. Research Report 315-lF. Center for Transportation Research, Bureau of Engineering Research, University of Texas at Austin, Oct. 1983.
5. R. L. Carrasquillo, F. 0. Slate, and A. H. Nilson. Properties of High Strength Concrete Subject to Short-Term Loads. AC/ .Ta1irnal, Vol. 78, No . 3, May-June 1981, pp. 171-178.
6. K. W. Nasser and A. A. Al-Manaseer. Creep of Concrete Containing Fly Ash and Supcrplasticizcr at Different Stress/Strength Ratios. Journal of the American Concrete Institwe, Vol. 83, No. 4, July-Aug. 1986, pp. 668-673.
7. ACI Committee 209. Prediction , Creep, Shrinkage and Temperature Effects in Concrete Structures . AC/ Jownal , Vol. 81, No. 4, July-Aug. 1984, pp. 364-411.
8. M. Ralston and R. Korman . Economical Composite System Is Stiffened with Record 19,000-psi Mix. Engineering News Report , Vol. 222, No. 7, Feb. 16, 1989, pp . 44-53.
Publication of this paper sponsored by Committee on Mechanical Properties of Concrete.