Embed Size (px)
Citation preview

UNIVERSITI PUTRA MALAYSIA 35Alam Cipta Vol 12 (Special Issue 1) Sept 2019: Energising Green Building
COMPARISON OF MEASURED AND MODELLED MEAN RADIANT TEMPERATURE IN THE TROPICAL URBAN ENVIRONMENT
Naser G.A. Khrit1*, Kamaruzzaman Sopian1, Mohammad Alghoul2, Lim Chin Haw1, Nik Lukman Nik Ibrahim1 and Abdelnaser Muftah A. Elbreki1
1Solar Energy Research Institute, Universiti Kebangsaan Malaysia, 43600 Bangi, Selangor, Malaysia.2Center of Research Excellence in Renewable Energy (CoRERE), King Fahd University of Petroleum
and Minerals (KFUPM), Dhahran 31261, Saudi Arabia..
* Corresponding author:[email protected]
ABSTRACT
RayMan is the most popular software package for thermal comfort research and urban planning. RayMan simulates the mean radiant temperature (Tmrt) and provides assessment of the human-biometeorology for urban areas. In this study Tmrt simulated by RayMan (version 1.2) has been validated with results from the six-directional radiation measurements in tropical urban settings in Malaysia. In addition, a validation of the physiologically equivalent temperature (PET) simulated by RayMan is conducted for the first time in the tropical context. Tmrt values from RayMan1.2 show some agreement with the measured values during middle of the validated days; however there was high fluctuation over that time due to rapid changes in radiation by cloud appearing. The results also show that RayMan1.2 considerably underestimated Tmrt during morning and evening. The simulated PET values followed the same pattern of the simulated Tmrt. However the simulated PET had a closer estimation to the experimentally obtained PET. The study also noted that RayMan1.2 accuracy seems to be site-related. Its simplification to the 3-D radiation environment led to variations in simulation accuracy depending on urban morphology. Therefore improvements of the RayMan software for simple and complex urban settings and tropical climates are required.
Keywords: : mean radiant temperature; six-directional radiation method; RayMan1.2 software; tropical urban environment.
1. INTRODUCTION
Consideration of human-biometeorology and thermal comfort for the assessment of urban areas has increased in recent years in response to different issues (Lee and Mayer, 2016, 2018a, 2018b; Lee, Mayer, and Chen, 2016; Lee, Mayer, and Schindler, 2014). First, the rates of world population living in cities are growing. In addition, urbanization has imposed significant changes to the natural ecosystem and landscape through the creation of largely impervious urban surfaces (Arnfield, 2003). Such changes to urban landscape have caused alteration in the local climate. The most obvious indicator of the alteration in urban climate is the increase in urban air and surface temperatures, a well known effect of Urban Heat Island (UHI) (Arnfield, 2003). Alteration in urban climate and the increase in urban air and surface temperatures are directly affecting outdoor comfort conditions, which can be worsened by climate change events (Changnon, Kunkel, and Reinke, 1996; You et al., 2017). The lack of effective urban planning and design can further exacerbate this situation (Ali-Toudert and Mayer, 2007; Johansson and Emmanuel, 2006; Thani, Mohamad, & Jamaludin, 2013). Hence, human-biometeorological methods for the quantification of urban climatic impacts as well as to assess the effectiveness of adaptation and mitigation measures in improving outdoor conditions have become increasingly important (Ketterer and Matzarakis, 2014; Kuttler, 2011; Lee and Mayer, 2018a, 2018b; Lee et al., 2016; Wamsler, Brink, and Rivera, 2013).

Alam Cipta Vol 12 (Special Issue 1) Sept 2019: Energising Green BuildingUNIVERSITI PUTRA MALAYSIA 36
For assessment of urban human-biometeorology and thermal comfort, detailed information of different parameters and processes governing micrometeorological conditions are required. These parameters and processes are often difficult to quantify in complex urban environments. Hence the use of numerical modelling has an advantage in which the involved parameters and processes are supplemented and enhanced with numerical calculations and simulations. A further advantage of numerical modelling is the ability to assess urban human-biometeorological and human thermal comfort conditions in relations to urban design and planning scenarios (Huang, Cedeño-Laurent, and Spengler, 2014; Lee and Mayer, 2018a, 2018b; Lee et al., 2016). However, modelling of microclimate often emerges with simplifications and limitations necessary to deal with the complexity of the urban environment (Ali-Toudert and Mayer, 2006; Thorsson, Lindberg, Eliasson, and Holmer, 2007).
The main feature for the modelling of microclimate is the determination of the 3D radiation fluxes for human beings and the calculation of the mean radiant temperature (Tmrt), one of the important parameters for the assessment of outdoor thermal comfort. Tmrt is the parameterization of the combined effect of short-and long-wave radiation fluxes absorbed by the human body. It is the basis of several human thermal indices, e.g., physiologically equivalent temperature (PET) (Höppe, 1999; H. Mayer and Höppe, 1987) and standard effective temperature (SET*) (Gagge, Fobelets, and Berglund, 1986). It is also considered the most spatially variable parameter compared to other parameters influencing thermal comfort. However, the issue of modelling the 3D radiation fluxes and the Tmrt is that the calculation procedures are based on simplified methods and formulas (Lee and Mayer, 2016; Naboni, Meloni, Coccolo, Kaempf, & Scartezzini, 2017). Thus, the modelling is not evident particularly in complex urban environments (Ali-Toudert and Mayer, 2006; Thorsson et al., 2007).
2. RAYMAN 1.2
RayMan1.2 is a spot-related software package used for the assessment of human bioclimate and outdoor thermal comfort (Matzarakis, Rutz, and Mayer, 2007, 2010). The inputs of the RayMan1.2 are meteorological data of air temperature, wind speed, water vapour pressure (relative humidity), global radiation and cloud cover, as well as inputs refer to urban morphology and others refer to features representative of a person. Furthermore, factors such as albedo, the Bowen ratio of the ground surface and turbidity of air can be adjusted in the RayMan1.2 software. Outputs of RayMan1.2 consist of the results of thermal indices for human-biometeorological conditions, as well as results of radiation fluxes and Tmrt. Also, with inputs of the geographical location and the temporal parameters, the RayMan1.2 software provides
possibilities to simulate sun paths in fish-eye view, as well as shadow patterns presented in grid-layout at period of the day.
The simulation tool of RayMan1.2 software is implemented with several features. For example Tmrt can be treated as part of the inputs when available. In addition, the RayMan1.2 can handle the simulation based on approximated input, such as input of Sky View Factor (SVF) in a form of fish-eye photo. As the RayMan1.2 takes vegetation and building morphology into account, the ability to evaluate human-biometeorological situation and further the assessment of applying adaptation and mitigation measures, such as urban re-planning, street design, or different types of vegetation, is the main advantage of the software (Matzarakis et al., 2007). The RayMan 1.2 software is easy to use and has fast running time and free. These advantages are reflected in the increased popularity of the software in urban microclimate and outdoor thermal comfort research e.g. (Holst and Mayer, 2011; R. L. Hwang, Lin, and Matzarakis, 2011; Krüger, Minella, and Rasia, 2011; Ndetto and Matzarakis, 2017; Niu et al., 2015).
Several researchers validated the performance of RayMan by performing the validation of Tmrt based on field measurements (Andrade and Alcoforado, 2008; Chen, Lin, and Matzarakis, 2014; R.-L. Hwang, Lin, and Matzarakis, 2011; Krüger, Minella, & Matzarakis, 2014; Lee & Mayer, 2016; Lin, 2009; Matzarakis et al., 2007, 2010; Thorsson et al., 2007). The validations showed discrepancies in the validation results, where in some studies the RayMan simulation was found consistently underestimates Tmrt and in other studies the RayMan simulation tends to overestimate Tmrt. In general, RayMan showed a good performance particularly under relatively simple urban settings. Increasing complexity of urban settings and the modelling of conditions where the sun elevation is low would reduce the accuracy of RayMan.
Most of these validation studies however have been conducted in moderate to high latitude locations. This study therefore aims to examine RayMan1.2 in estimating the Tmrt in tropical urban settings of Malaysia when compared with the six-directional radiation method. The validation of the comfort index PET simulated by RayMan1.2 is also performed.
3. MEASURING SITES
Measurement were performed at the University campus in the National University of Malaysia, in Bangi, Malaysia (2o.54’N, 101o.47’E). Two different sites were selected for the measurements. The first site is a closed inner courtyard located near seven-story building and a parking lot with SVF value of 0.38 (Figure 1-a). The second site is a semi-open space with horizon limitations and SVF value of 0.79 (Figure 1-b).

UNIVERSITI PUTRA MALAYSIA 37Alam Cipta Vol 12 (Special Issue 1) Sept 2019: Energising Green Building
Figure 1 (a, b): Photographs of the measurement sites (left) and fisheye images (right) generated by RayMan1.2.
3.1 Measurements and Methods
Micrometeorological station and Measurements
The micrometeorological station shown in Figure 1(a, b) was equipped with instruments as defined in Table 1. This includes sensors to measure air temperature, relative humidity, and wind speed. Three net-radiometers, each consists of two pyranometers and two pyrgeometers, were set up on the station to measure the six-directional short and long-wave radiation fluxes. All instruments were fixed at a height of 1.1m a.g.l representing the height of the weighting center of a standing person (Thorsson et al., 2007). The recording interval was set to 1-min.
Table 1: Measured parameters and instruments
A total of three days of measurements were carried out at the sites: on 14 February 2017 at the site 1 and on 20 August 2017 and 25 February 2018 at the site 2. The measurements were recorded on each day from 8:00 to 21:00. The weather during the days brought hot, humid conditions with intense solar radiation and occasional cloudy skies. The average air temperature at the measured days was between 29.6 and 31.4oC and the average RH was between 55 and 60%. The average wind speed was < 1.8m/s. The average global radiation was between 450 and 550 W/m2 and the highest recorded global radiation was 1160 W/m2. These conditions are representative of the local tropical climate in Malaysia where there is no distinct seasons.
The six-directional method to calculate Tmrt and PET
An accurate determination of Tmrt is very difficult and mostly impossible in complex urban settings because this requires measurements of all short-and long-wave fluxes along with angle factors between a person and the surrounding. An alternative way to Tmrt is by limiting the measurements of radiation fluxes to only the six perpendicular directions surrounding a person, i.e., from four lateral directions, upwards and downwards (Holst and Mayer, 2011; Kántor, Kovács, and Lin, 2015; Lee, Holst, and Mayer, 2013; Helmut Mayer, Holst, Dostal, Imbery, & Schindler, 2008; Thorsson et al., 2007). To
80
70
60
50
40
30
20
10
N
W
S
E
© 2000 Ray Man 1.2
8910111213141516171819
(a) Site 1, SVF = 0.38
80
70
60
50
40
30
20
10
N
W
S
E
© 2000 Ray Man 1.2
89101112131415161718
19
(b) Site 2, SVF = 0.79
Quantity
Instrument Accuracy & range
Air temperature, Ta Skye inst. rht+ PT100 sensor
0.15°C - 0.35°C (-40 to +80°C)
Relative humidity, RH
Better than +2% RH (0-100 %)
Wind speed, Va Delta OHM: AP3203 omnidirectional hot-
wire
± 0.05 m/s (0.05-1 m/s) ± 0.15 m/s (1-5 m/s)
Short- and long-wave radiation
fluxes, K, L
Delta OHM: LP NET 14
2 pyranometers, 2 pyrgeometers
temperature sensor (NTC), and thermopiles
Pyranometers: 0-2000 W/m2 Spectral range: 335 nm ÷ 2200 nm
(95%) Pyrgeometers: -300 - +300 W/m2 Spectral range: 5.5 µm ÷ 45 µm
Working temperature: -40 °C - 80 °C
Alam Cipta Vol 12 (Special Issue 1) Sept 2019: Energising Green BuildingUNIVERSITI PUTRA MALAYSIA 38
date this method is the most reliable measuring method to determine Tmrt (Kántor et al., 2015; Kántor, Lin, & Matzarakis, 2014; Lee et al., 2016). The six individual measurements of short-wave radiation fluxes Ki and long-wave radiation fluxes Li multiplied by the angle factors Fi between a person and the surrounding (i=1-6) are used to calculate the Tmrt following the Stefan–Boltzmann law in equation [1] (Thorsson et al., 2007):
[1]
Where σ is the Stefan–Boltzmann constant (5.67×10⁻⁸ Wm−2 K−4), αk, αl are the absorption coefficients for short-wave fluxes (standard values is 0.7) and long-wave fluxes (standard values is 0.97). To calculate Tmrt for a standing person, Fi is set to 0.22 for radiation fluxes from the lateral directions and 0.06 for upwards and downwards radiation fluxes (Thorsson et al., 2007).
The results of Tmrt by the six-directional method (Tmrt (rad.)) along with the meteorological data of air temperature, wind speed and water vapour pressure were used to determine the experimentally obtained PET.
Application of RayMan1.2 to simulate Tmrt and PET
The meteorological data of air temperature, wind speed, water vapour pressure (relative humidity), global radiation and cloud cover were used as inputs in RayMan1.2 to simulate Tmrt and PET. The default values of the albedo, Bowen ratio and the ratio of diffuse and global radiation have been used. An input of the urban structures of the sites has been considered in RayMan1.2. The simulation results of Tmrt and PET were validated by comparison with the experimentally obtained results.
4. RESULTS AND DISCUSSION
Validation of the simulated Tmrt by RayMan1.2
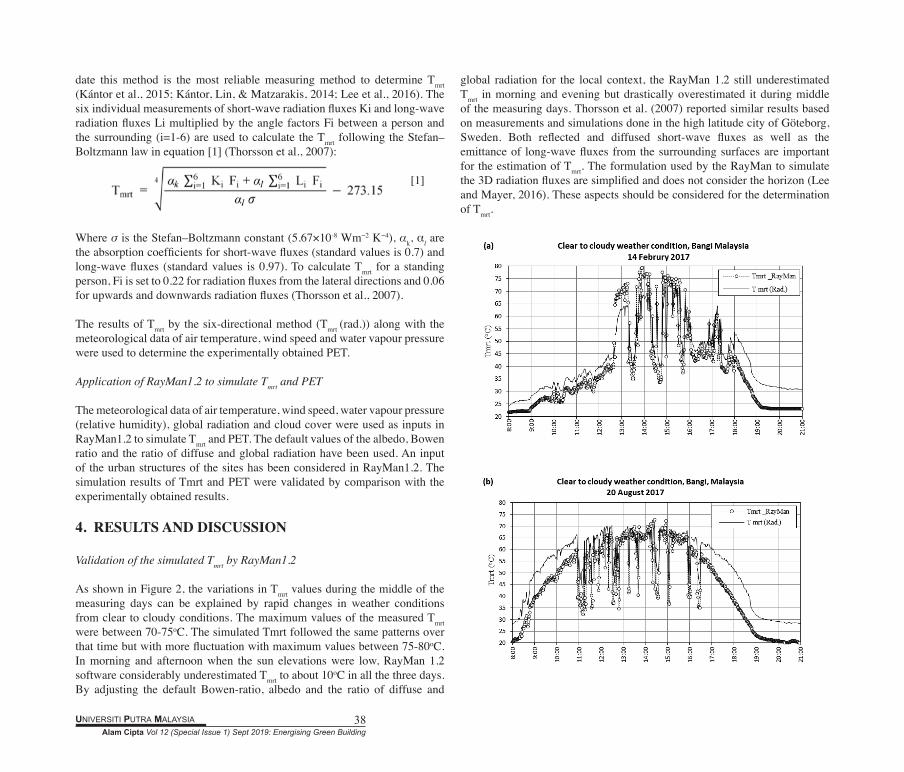
As shown in Figure 2, the variations in Tmrt values during the middle of the measuring days can be explained by rapid changes in weather conditions from clear to cloudy conditions. The maximum values of the measured Tmrt were between 70-75oC. The simulated Tmrt followed the same patterns over that time but with more fluctuation with maximum values between 75-80oC. In morning and afternoon when the sun elevations were low, RayMan 1.2 software considerably underestimated Tmrt to about 10oC in all the three days. By adjusting the default Bowen-ratio, albedo and the ratio of diffuse and
global radiation for the local context, the RayMan 1.2 still underestimated Tmrt in morning and evening but drastically overestimated it during middle of the measuring days. Thorsson et al. (2007) reported similar results based on measurements and simulations done in the high latitude city of Göteborg, Sweden. Both reflected and diffused short-wave fluxes as well as the emittance of long-wave fluxes from the surrounding surfaces are important for the estimation of Tmrt. The formulation used by the RayMan to simulate the 3D radiation fluxes are simplified and does not consider the horizon (Lee and Mayer, 2016). These aspects should be considered for the determination of Tmrt.
UNIVERSITI PUTRA MALAYSIA 39Alam Cipta Vol 12 (Special Issue 1) Sept 2019: Energising Green Building
Figure 2 (a-c): Tmrt as calculated by six directional radiation method and the simulated Tmrt by RayMan1.2: (a) at the site 1; (b, c) at the site 2.
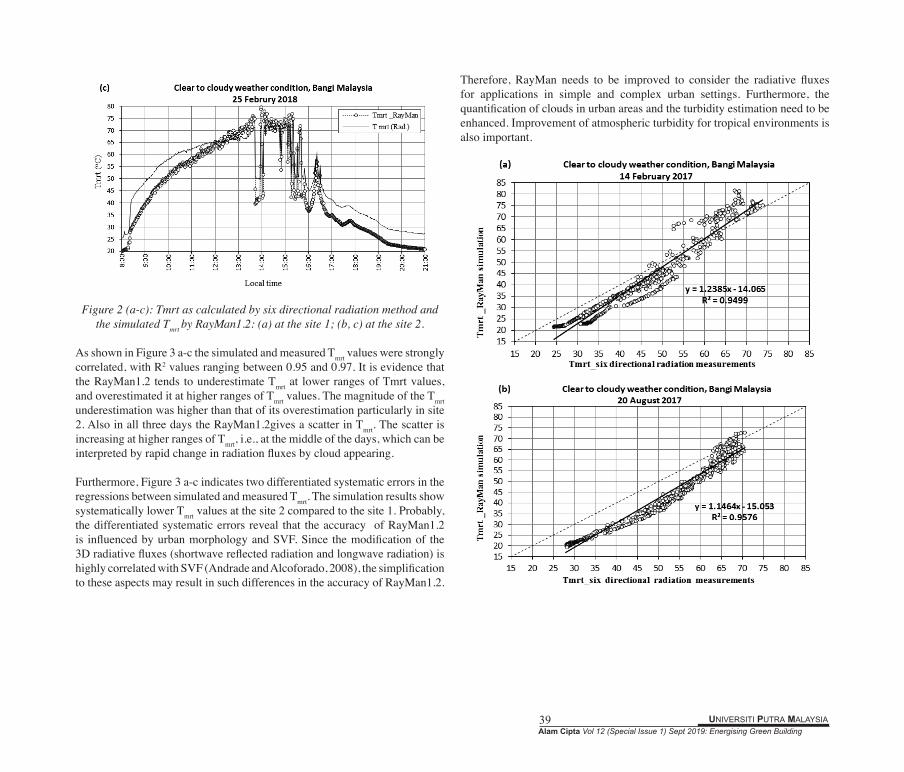
As shown in Figure 3 a-c the simulated and measured Tmrt values were strongly correlated, with R2 values ranging between 0.95 and 0.97. It is evidence that the RayMan1.2 tends to underestimate Tmrt at lower ranges of Tmrt values, and overestimated it at higher ranges of Tmrt values. The magnitude of the Tmrt underestimation was higher than that of its overestimation particularly in site 2. Also in all three days the RayMan1.2gives a scatter in Tmrt. The scatter is increasing at higher ranges of Tmrt, i.e., at the middle of the days, which can be interpreted by rapid change in radiation fluxes by cloud appearing.
Furthermore, Figure 3 a-c indicates two differentiated systematic errors in the regressions between simulated and measured Tmrt. The simulation results show systematically lower Tmrt values at the site 2 compared to the site 1. Probably, the differentiated systematic errors reveal that the accuracy of RayMan1.2 is influenced by urban morphology and SVF. Since the modification of the 3D radiative fluxes (shortwave reflected radiation and longwave radiation) is highly correlated with SVF (Andrade and Alcoforado, 2008), the simplification to these aspects may result in such differences in the accuracy of RayMan1.2.
Therefore, RayMan needs to be improved to consider the radiative fluxes for applications in simple and complex urban settings. Furthermore, the quantification of clouds in urban areas and the turbidity estimation need to be enhanced. Improvement of atmospheric turbidity for tropical environments is also important.

Alam Cipta Vol 12 (Special Issue 1) Sept 2019: Energising Green BuildingUNIVERSITI PUTRA MALAYSIA 40
Figure 3 (a-c) : Tmrt as calculated by six directional radiation measurements vs. simulated by RayMan1.2: (a) at the site 1; (b, c) at the site 2.
Investigation of the effect of simulated Tmrt on thermo-physiological assessment.
The simulated results of PET by RayMan1.2 were validated by comparison with those obtained by experimental procedures. As shown in Figure 4, the scatter and systematic error in the regressions between simulated and measured PET followed the same pattern as the Tmrt. This was expected because Tmrt is the main factor affecting PET in outdoor environments. Nevertheless the simulated PET by RayMan1.2 is less affected by inaccuracy of the simulated Tmrt. The R2 values ranging between 0.96 and 0.98 indicate stronger correlations between simulated and experimentally obtained PET. Also the simulated PET values have closer approximations to the experimentally obtained PET values particularly when high ranges of Tmrt values occurred. The modification in the radiative fluxes has less effect on PET because the thermo-physiological index is also depending on other thermal comfort factors; namely, air temperature, water vapour pressure, air speed, human clothing and activity. Increasing the accuracy of the simulation of PET index requires accurate estimates of all these factors including Tmrt.
Figure 4 (a-c): PET as calculated by experimental data vs. simulated by RayMan 1.2: (a) at the site 1; (b, c) at the site 2.
UNIVERSITI PUTRA MALAYSIA 41Alam Cipta Vol 12 (Special Issue 1) Sept 2019: Energising Green Building
5. CONCLUSION
In this study the RayMan1.2 software was validated by comparison with field measurements for the tropical outdoor urban environment. As the Tmrt can be determined by field measurements and modelling, the consistency between measured and simulated Tmrt was utilized as a criterion for the validation of the RayMan1.2 software. The simulated Tmrt results by the RayMan1.2 software were compared with the six-directional radiation method as a reference method. The results are for three day at two different sites in a tropical urban environment.
The study shows that RayMan1.2 software gives reasonable results during the middle of the day. However, in morning and late afternoon the RayMan1.2 drastically underestimates Tmrt data. The study also shows that the software simulation of different urban settings leads to different systematic errors depending on the urban morphology and SVF. The reflected and diffused short-wave fluxes as well as the long-wave fluxes from the surrounding surfaces, which are highly correlated with urban morphology, are simplified by RayMan1.2 (Lee and Mayer, 2016 ; Naboni et al., 2017). The results suggest that the accuracy of RayMan1.2 may be dependent on SVF, i.e., the simulation for spaces with different SVFs may achieve different levels of accuracy.
The effect of the simulated Tmrt on the thermo-physiological index PET is also analyzed. The index has been chosen for validation because it has been employed in several studies of outdoor thermal comfort. The simulated PET values from RayMan1.2 software followed the same pattern of the simulated Tmrt. Nevertheless the simulated PET values have a closer estimation to the experimentally obtained PET. In addition, the RayMan1.2 gives slightly less scatter in PET in comparison to Tmrt.
Therefore, based on the results of the validation, improvements to the RayMan1.2 simulation for the short- and long-wave radiant flux densities from the surrounding 3D environment is required. Moreover, there are some other parameters whose assessments have to be improved; e.g. the quantification of the clouds and atmospheric turbidity.
REFERENCES
Ali-Toudert, F., & Mayer, H. (2006). Numerical study on the effects of aspect ratio and orientation of an urban street canyon on outdoor thermal comfort in hot and dry climate. Building and Environment, 41(2), 94–108. https://
doi.org/10.1016/j.buildenv.2005.01.013Ali-Toudert, F., & Mayer, H. (2007). Thermal comfort in an east–west oriented
street canyon in Freiburg (Germany) under hot summer conditions. Theoretical and Applied Climatology, 87(1–4), 223–237.
Andrade, H., & Alcoforado, M.-J. (2008). Microclimatic variation of thermal comfort in a district of Lisbon (Telheiras) at night. Theoretical and Applied Climatology, 92(3–4), 225–237.
Arnfield, A. J. (2003). Two decades of urban climate research: A review of turbulence, exchanges of energy and water, and the urban heat island. International Journal of Climatology, 23(1), 1–26. https://doi.org/10.1002/joc.859
Changnon, S. A., Kunkel, K. E., & Reinke, B. C. (1996). Impacts and responses to the 1995 heat wave: a call to action. Bulletin of the American Meteorological Society, 77(7), 1497–1506.
Chen, Y.-C., Lin, T.-P., & Matzarakis, A. (2014). Comparison of mean radiant temperature from field experiment and modelling: a case study in Freiburg, Germany. Theoretical and Applied Climatology, 118(3), 535–551.
Gagge, A. P., Fobelets, A. P., & Berglund, L. (1986). A standard predictive index of human response to the thermal environment. ASHRAE Trans.;(United States), 92(CONF-8606125-).
Holst, J., & Mayer, H. (2011). Impacts of street design parameters on human-biometeorological variables. Meteorologische Zeitschrift, 20(5), 541–552.
Höppe, P. (1999). The physiological equivalent temperature–a universal index for the biometeorological assessment of the thermal environment. International Journal of Biometeorology, 43(2), 71–75.
Huang, J., Cedeño-Laurent, J. G., & Spengler, J. D. (2014). CityComfort+: A simulation-based method for predicting mean radiant temperature in dense urban areas. Building and Environment, 80, 84–95. https://doi.org/10.1016/j.buildenv.2014.05.019
Hwang, R.-L., Lin, T.-P., & Matzarakis, A. (2011). Seasonal effects of urban street shading on long-term outdoor thermal comfort. Building and Environment, 46(4), 863–870.
Hwang, R. L., Lin, T. P., & Matzarakis, A. (2011). Seasonal effects of urban street shading on long-term outdoor thermal comfort. Building and Environment, 46(4), 863–870. https://doi.org/10.1016/j.buildenv.2010.10.017
Johansson, E., & Emmanuel, R. (2006). The influence of urban design on outdoor thermal comfort in the hot, humid city of Colombo, Sri Lanka. International Journal of Biometeorology, 51(2), 119–133.
Kántor, N., Kovács, A., & Lin, T. P. (2015). Looking for simple correction functions between the mean radiant temperature from the “standard black globe” and the “six-directional” techniques in Taiwan. Theoretical and Applied Climatology, 121(1–2), 99–111. https://doi.org/10.1007/s00704-

Alam Cipta Vol 12 (Special Issue 1) Sept 2019: Energising Green BuildingUNIVERSITI PUTRA MALAYSIA 42
014-1211-2Kántor, N., Lin, T. P., & Matzarakis, A. (2014). Daytime relapse of the
mean radiant temperature based on the six-directional method under unobstructed solar radiation. International Journal of Biometeorology, 58(7), 1615–1625. https://doi.org/10.1007/s00484-013-0765-5
Ketterer, C., & Matzarakis, A. (2014). Human-biometeorological assessment of adaptation and mitigation measures for replanning in Stuttgart, Germany. Landscape and Urban Planning, 112, 78–88.
Krüger, E. L., Minella, F. O., & Matzarakis, A. (2014). Comparison of different methods of estimating the mean radiant temperature in outdoor thermal comfort studies. International Journal of Biometeorology, 58(8), 1727–1737. https://doi.org/10.1007/s00484-013-0777-1
Krüger, E. L., Minella, F. O., & Rasia, F. (2011). Impact of urban geometry on outdoor thermal comfort and air quality from field measurements in Curitiba, Brazil. Building and Environment, 46(3), 621–634. https://doi.org/10.1016/j.buildenv.2010.09.006
Kuttler, W. (2011). Climate change in urban areas. Part 2, Measures. Environmental Sciences Europe, 23(1), 21.
Lee, H., Holst, J., & Mayer, H. (2013). Modification of human-biometeorologically significant radiant flux densities by shading as local method to mitigate heat stress in summer within urban street canyons. Advances in Meteorology, 2013. https://doi.org/10.1155/2013/312572
Lee, H., & Mayer, H. (2016). Validation of the mean radiant temperature simulated by the RayMan software in urban environments. International Journal of Biometeorology, 60(11), 1775–1785. https://doi.org/10.1007/s00484-016-1166-3
Lee, H., & Mayer, H. (2018a). Maximum extent of human heat stress reduction on building areas due to urban greening. Urban Forestry and Urban Greening, 32, 154–167. https://doi.org/10.1016/j.ufug.2018.04.010
Lee, H., & Mayer, H. (2018b). Thermal comfort of pedestrians in an urban street canyon is affected by increasing albedo of building walls. International Journal of Biometeorology, 62(7), 1199–1209. https://doi.org/10.1007/s00484-018-1523-5
Lee, H., Mayer, H., & Chen, L. (2016). Contribution of trees and grasslands to the mitigation of human heat stress in a residential district of Freiburg, Southwest Germany. Landscape and Urban Planning, 148, 37–50. https://doi.org/10.1016/j.landurbplan.2015.12.004
Lee, H., Mayer, H., & Schindler, D. (2014). Importance of 3-D radiant flux densities for outdoor human thermal comfort on clear-sky summer days in Freiburg, Southwest Germany. Meteorologische Zeitschrift, 23(3), 315–330. https://doi.org/10.1127/0941-2948/2014/0536
Lin, T.-P. (2009). Thermal perception, adaptation and attendance in a public square in hot and humid regions. Building and Environment, 44(10),
2017–2026.Matzarakis, A., Rutz, F., & Mayer, H. (2007). Modelling radiation fluxes in
simple and complex environments—application of the RayMan model. International Journal of Biometeorology, 51(4), 323–334.
Matzarakis, A., Rutz, F., & Mayer, H. (2010). Modelling radiation fluxes in simple and complex environments: Basics of the RayMan model. International Journal of Biometeorology, 54(2), 131–139. https://doi.org/10.1007/s00484-009-0261-0
Mayer, H., Holst, J., Dostal, P., Imbery, F., & Schindler, D. (2008). Human thermal comfort in summer within an urban street canyon in Central Europe. Meteorologische Zeitschrift, 17(3), 241–250.
Mayer, H., & Höppe, P. (1987). Thermal comfort of man in different urban environments. Theoretical and Applied Climatology, 38(1), 43–49. https://doi.org/10.1007/BF00866252
Naboni, E., Meloni, M., Coccolo, S., Kaempf, J., & Scartezzini, J.-L. (2017). An overview of simulation tools for predicting the mean radiant temperature in an outdoor space. Energy Procedia, 122, 1111–1116.
Ndetto, E. L., & Matzarakis, A. (2017). Assessment of human thermal perception in the hot-humid climate of Dar es Salaam, Tanzania. International Journal of Biometeorology, 61(1), 69–85. https://doi.org/10.1007/s00484-016-1192-1
Niu, J., Liu, J., Lee, T. cheung, Lin, Z., Mak, C., Tse, K. T., … Kwok, K. C. S. (2015). A new method to assess spatial variations of outdoor thermal comfort: Onsite monitoring results and implications for precinct planning. Building and Environment, 91, 263–270. https://doi.org/10.1016/j.buildenv.2015.02.017
Thani, S. K. S. O., Mohamad, N. H. N., & Jamaludin, S. N. (2013). Outdoor thermal comfort: the effects of urban landscape morphology on microclimatic conditions in a hot-humid city. WIT Transactions on Ecology and the Environment, 179, 651–662.
Thorsson, S., Lindberg, F., Eliasson, I., & Holmer, B. (2007). Different methods for estimating the mean radiant temperature in an outdoor urban setting. International Journal of Climatology, 27(14), 1983–1993.
Wamsler, C., Brink, E., & Rivera, C. (2013). Planning for climate change in urban areas: from theory to practice. Journal of Cleaner Production, 50, 68–81.
You, Q., Jiang, Z., Kong, L., Wu, Z., Bao, Y., Kang, S., & Pepin, N. (2017). A comparison of heat wave climatologies and trends in China based on multiple definitions. Climate Dynamics, 48(11–12), 3975–3989.