Embed Size (px)
Citation preview

COMPARISON OF INSTRUMENTED PILE LOAD TEST
RESULTS WITH FINITE ELEMENT SIMULATION
Galhenage Harshani Iromi Diyes
(168954V)
Thesis submitted in partial fulfillment of the requirements for the
degree of Master of Engineering in Foundation Engineering and
Earth Retaining Systems
Supervised by
Prof. SamanThilakasiri
Dr. L.I.N. De Silva
Department of Civil Engineering
University of Moratuwa
Sri Lanka
September 2020

i
DECLARATION
I declare that this is my own work and this thesis does not incorporate without
acknowledgement any material previously submitted for a Degree or Diploma in any
other University or institute of higher learning and to best of my knowledge and
belief it does not contain any material previously published or written by another
person except where the acknowledgement is made in the text.
Also, I hereby grant to University of Moratuwa the non-exclusive right to reproduce
and distribute my thesis, in whole or in part in print, electronic or other medium. I
retain the right to use this content in whole or part in future works (such as articles or
books.)
……………………………… …………………………….
G. H. Iromi Diyes Date
Department of Civil Engineering
University of Moratuwa
The above candidate has carried out research for the Masters dissertation under my
supervision.
…………………………… …………………………..
Prof. H. S. Thilakasiri Date
Dean, Faculty of Engineering,
SLIIT, Malabe.
……………………….. …………………………
Dr. L.I. N. de Silva Date
Senior Lecturer,
Department of Civil Engineering,
University of Moratuwa,
Date :……………………….

ii
ACKNOWLEDGEMENT
At the outset, I would like to express my sincere and heartfelt gratitude to my
research supervisors, Professor Saman Thilakasiri and Dr. L.I.N. De Silva for the
continuous support to my study with guidance, motivation and immense knowledge.
Without their dedicated supervision and continual guidance, this thesis would not be
successfully completed within the time frame. Their dynamism, vision, sincerity and
motivation have deeply inspired me. They have taught me the methodology to carry
out the research and to present the research works as clearly as possible. It was a
great privilege and honor to work and study under their guidance. I am extremely
grateful for what they have offered me. During this period, they basically allowed
this research to be my own work while steering me towards the right direction
whenever they thought that I needed.
My sincere thank also goes to Dr. Evert Hoek, who has given access to me to more
than 50 of his most significant publications, together with a 16 chapter eBook
entitled practical rock engineering and 6 professionally made videos on rock
engineering, after requesting through a small message via research gate.
It is my duty to pay gratitude to Dr. Janaka Liyanagama, the Dean of the Faculty of
Engineering and Technology, CINEC Campus Malabe for providing me the
unconditional support by releasing me whenever I asked and motivating me all the
time to complete this task.
In addition, I would like to declare my sincere thankfulness to all teachers served in
or visited to Geotechnical Engineering Unit, department of Civil Engineering
including Professor U. G. A. Puswewala, Professor S.A.S. Kulathilake, Professor H.
Saman Thilakasiri, Dr. Udeni P. Nawagamuwa, Dr. L.I.N. De Silva, Dr. Nadeej
Priyankara, Dr. J. S. M. Fowze etc, for not only their contribution to improve my
knowledge, but also for their guidance on my carrier development.
Moreover, I would like to pay my gratitude to University of Moratuwa for providing
me an opportunity to follow this Master degree and to the management of CINEC
including Prof. N. Rajkumar and Prof. Nalaka Jayakody for relieving me to attend
lectures on Fridays. Further, I extend my sincere gratitude to all my friends who
given me assistance and encouragement for completion of this thesis.

iii
I am extremely grateful to my loving mother and father for their dedications,
encouragement and blessing for not only this work but also for my whole life to
make me who I am today. Further, my gratitude goes to my loving son Setheesha for
bearing all the stress I had while work on this thesis and to my loving husband
Maduranga for giving me his fullest support and all the encouragement and
motivation to complete this study.
Finally, my thanks go to all those who have supported me to complete the
research work directly or indirectly.

iv
CASE STUDY: COMPARISON OF INSTRUMENTED PILE LOAD TEST
RESULTS WITH FINITE ELEMENT SIMULATION
ABSTRACT
Bored and cast in situ bored piles are used to support the heavy super structure loads,
while transferring them the hard rock layers. Because of that, in order to design
single piles or group piles, it is very important to know the carrying capacity
characteristics of the pile. To determine the settlement characteristics of the pile head
with the load, static pile load tests are playing a significant role. It is really important
to know about the skin friction distribution along the pile shaft and the deviation of
the applied load in to the friction through the shaft. Such information can be obtained
by using the instrumented pile load tests, where strain gauges are installed along the
pile length. However the instrumented pile load test is expensive and not always
carried out in all pile construction sites, in Sri Lanka. Further, since it is affected by
many factors and the processes, the outcome from the instrumented pile load tests is
not easy to interpret.
To find out the carrying capacity of the piles, empirical formulae and factors
available can be used. However, use of software packages based on finite element
analysis to find out the carrying capacity of the pile may provide an excellent
opportunity to obtain results easily and quickly, if the accuracy of the results can be
established. Because of that, this study was aimed to find out the carrying capacity of
cast in situ bored single piles using commonly used finite element software PLAXIS
2D and compare the results with the instrumented pile load test results obtained in
the field. Further, the differences and the difficulties of the interpretation of results
with their potential reasons were discussed within the study.
Results for two borehole tests and instrumented pile load tests were obtained and
compared the real world data with the numerical simulation of such test with same
conditions. Input parameters for the Finite element software used were Young‘s
modulus of the soil and rock, poission‘s ratio and the shear strength parameters of the
soil. Young‘s modulus for the soil layers were calculated from the energy correction
method and for rock layers it was calculated using the Hong Kong geo guide lines
(Geo,2006) and rock mass rating values. Shear strength parameters for the soil layers

v
were calculated using the borehole data and the method proposed by Bowels. For
rock layers it was used the Hoek-Brown formulae, proposed by Hoek and Brown.
The best match results with the field data for weathered rocks were given when used
twice the Young‘s modulus for rock layers. For the bored piles socketed in to fresh
rock, the best match results with instrumented pile load test results were given when
used half the value of the Young‘s modulus of rock which was found using the Hong
Kong geo guide lines (Geo,2006).
Key words;
Bored and Cast in Situ Piles, Instrumented Pile Load Test, PLAXIS 2D, Young‘s
Modulus, Poisson‘s Ratio, Socketed, Bed Rock, Finite Element Simulation

vi
TABLE OF CONTENTS
Declaration of the candidate & Supervisor i
Acknowledgement ii
Abstract iv
Table of content vi
List of figures ix
List of Tables xiii
List of Abbreviations xvii
A1. APPENDIX I: BORE HOLE LOG RECORDS I ....................................... VIII
A2. APPENDIX II : UNI AXIAL COMPRESSIVE STRENGTH RESULTS ..................... V
VIII
1 INTRODUCTION .............................................................................................. 1
2 LITERATURE REVIEW .................................................................................. 6
2.1 ROCKS OF SRI LANKA ....................................................................................... 6
2.2 FOUNDATIONS ................................................................................................... 9
2.2.1 Selecting the type of Foundation............................................................ 10
2.2.2 Pile Foundations ..................................................................................... 11
2.2.3 Bored and Cast - In - Situ Piles .............................................................. 12
2.2.3.1 Termination Criteria for Bored Piles.............................................. 16
2.2.3.1.1 Case study .................................................................................. 17
2.3 TESTING OF PILES ........................................................................................... 21
2.3.1 Load Testing of Piles ............................................................................. 25
2.3.1.1 Static Load Test on Instrumented Piles .......................................... 26
2.3.2 Advantages and Disadvantages of Different Methods of Load Testing 27
2.4 OBTAINING STRENGTH PROPERTIES OF SOIL AND ROCK ................................... 29
2.4.1 Energy correction method for SPT N value ........................................... 29
2.4.1.1 Overburden correction ................................................................... 29
2.4.1.2 Energy correction factor (1) ......................................................... 30
2.4.1.3 Elastic material properties of soils ................................................. 31
2.5 CLASSIFICATION OF ROCK MASS .................................................................... 33
2.5.1 Engineering Rock Mass Classification .................................................. 33
2.5.1.1 Terzaghi's rock mass classification ................................................ 33

vii
2.5.1.2 Rock quality designation index (RQD) .......................................... 34
2.5.2 Geo-mechanics Classification ................................................................ 35
2.6 COMPRESSIVE STRENGTH PROPERTIES OF ROCK USING RMR .......................... 37
2.7 SHEAR STRENGTH PROPERTIES OF ROCK MASS .............................................. 40
2.8 DILATANCY ANGLE ......................................................................................... 44
2.8.1 Dilatancy angle for soils......................................................................... 44
2.8.2 Dilatancy angle of rocks......................................................................... 45
2.9 FINITE ELEMENT METHODS IN PILE DESIGNING ............................................... 45
2.9.1 PLAXIS 2D in designing of pile foundations ........................................ 46
3 METHODOLOGY ........................................................................................... 49
3.1 DATA COLLECTION .......................................................................................... 50
3.2 PROPERTIES OF SOIL TO USE IN PLAXIS 2D.................................................... 52
3.3 PROPERTIES OF ROCK MASS TO USE IN PLAXIS 2D ........................................ 53
3.3.1 RMR value calculation ........................................................................... 54
3.4 PROPERTIES OF REINFORCED CONCRETE TO USE IN PLAXIS 2D ..................... 56
3.5 FEM ANALYSIS METHODOLOGY ...................................................................... 57
3.5.1 Simulation method ................................................................................. 57
3.5.2 Boundary conditions .............................................................................. 58
3.6 MODEL STUDIES TO IDENTIFY THE LOAD SETTLEMENT AND CARRYING
CAPACITY OF THE PILES ........................................................................................... 58
3.7 OUTLINE OF THE RESEARCH ............................................................................ 59
4 RESULTS AND DISCUSSIONS .................................................................... 60
4.1 LOAD SETTLEMENT BEHAVIOUR ...................................................................... 61
4.2 SKIN FRICTION DISTRIBUTION ALONG THE PILE SHAFT .................................... 67
4.2.1 Skin friction distribution of Test pile 1 .................................................. 67
4.2.2 Skin friction distribution of Test pile 2 .................................................. 70
4.3 END BEARING OF THE TEST PILE 1 ................................................................... 73
4.4 END BEARING CAPACITY OF TEST PILE 2 ......................................................... 75
4.5 COMPARISON OF THE RESULTS OBTAINED FROM FEM .................................... 76
5 CONCLUSIONS .............................................................................................. 80
6 RECOMENDATIOS ....................................................................................... 81
7 REFERENCE ................................................................................................... 82

viii
A1. APPENDIX I: BORE HOLE LOG RECORDS I
A1.1 Bore hole log records for Test Pile 1 I
A1.2 Bore hole log records for Test Pile 2 III
A2. APPENDIX II : Uni Axial Compressive Strength Results V
A3. APPENDIX III: Instrumented Pile Load Test Results VI
A4. APPENDIX IV: Input Data for Finite Element model Analysis VIII
A4.1 Input Data for Test Pile 01 VIII
A4.2 Input Data for Test Pile 02 XIII
A5. APPENDIXV: Finite Element Model Results for Settlement of the PileXVII
A5.1 Settlement of the Test Pile 01 XVII
A5.2 Settlement of Test pile 2 XVIII
A6. APPENDIX VI: Finite Element Model Results for Skin Friction of the Pile
XIX
A6.1 Skin Friction Distribution of the Test Pile 01 XIX
A6.2Skin Friction Distribution of the Test Pile 02 XXXI
A7. APPENDIX VII: Finite Element model Results for End Bearing XLIII
A7.1 Skin Friction Distribution of the Test Pile 01 XLIII
A7.2Skin Friction Distribution of the Test Pile 02 XLIV

ix
LIST OF FIGURES
Figure 2-1 Sketch map of Sri Lanka showing the nomenclature and extent of the
main Precambrian lithotectonic units of the island (Cooray, 1994)............................. 8
Figure 2-2 Classification of foundation based on the load transfer mechanism ........ 10
Figure 2-3 Suggested procedures for the choice of foundation type for a site (Source
- Geotechnical Engineering Office, 2006) ................................................................. 13
Figure 2-4 Bored pile construction (a) Place steel casing (b) pump slurry (c) finish
excavation, cleaning hole and placing reinforcement cage (d) placing concrete (e)
remove tremie pipe (Source: Federal Highway Administration (2010)) ................... 14
Figure 2-5 Pushing a temporary casing ...................................................................... 15
Figure 2-6 Checking the center of the casing............................................................. 16
Figure 2-7 (a) 3D model of the rock profile using 6 boreholes (b) 9 boreholes (c) 16
boreholes and additional data at pile locations, (Thilakasiri, 2007) .......................... 19
Figure 2-8 Distribution of side -wall shear stress in relation to socket length and
modulus ratio. (After Osterberg and Gill, 1973) ........................................................ 20
Figure 2-9 SPT Correction factors (Bowles, L.E. 1996)............................................ 30
Figure 2-10 Strength parameters from the N70/ from the SPT (Bowles, L.E. 1996) 31
Figure 2-11 Equations for stress-strain modulus (Es) ................................................ 32
Figure 2-12 Procedure for measurement and calculation of RQD (After Deere, 1989)
.................................................................................................................................... 34
Figure 2-13 Rock Mass Rating System (After Bieniawski, 1989)............................. 36
Figure 2-14 Rating Assigned to Individual Parameters using RMR Classification
System (Based on Bieniawsky, 1989) ........................................................................ 37
Figure 2-15 Relationship between Deformation Modulus and RMR for a Jointed
Rock Mass (Based on Bieniawsky, 1989).................................................................. 39
Figure 2-16 Approximate values of mi for different rock types (Hoek, E. 1983) ..... 43
Figure 3-1- 3D view of typical bedrock profile based on ground investigation
boreholes (Thilakasiri et. al. 2019) ............................................................................ 51
Figure 3-2 Contour plan of the same site (Thilakasiri et. al. 2019) ........................... 51
Figure 3-3 Contour plan RQD of the rock head ......................................................... 52
Figure 3-4 (a) Shows the modelled geometry of the FEM for test pile1. (b) enlarged
view of the highlighted region in (a) .......................................................................... 58

x
Figure 4-1 Load settlement curve from field test for Test Pile 1 ............................... 61
Figure 4-2 Load settlement curve for Test pile 1 ....................................................... 62
Figure 4-3 Generated mesh for a FEM of test pile 1.................................................. 63
Figure 4-4 settlement contours for test pile 1............................................................. 64
Figure 4-5 Load settlement curve for field test for test pile 2 .................................... 65
Figure 4-6 Load settlement curve for test pile 2 ........................................................ 66
Figure 4-7 Skin friction distribution along the pile between two strain gauges ........ 67
Figure 4-8 Comparison of the skin frictional distribution along the pile shaft for pile
top load 2680 kN of Test pile 1 .................................................................................. 68
Figure 4-9 Comparison of the skin frictional resistance along the pile shaft for the
applied pile top load 5320kN for Test pile 1.............................................................. 69
Figure 4-10 Comparison of the skin frictional resistance along the pile shaft for the
applied pile top load 7960 kN for Test pile 1............................................................. 69
Figure 4-11 Comparison of the skin frictional resistance along the pile shaft for the
applied pile top load 29920kN for Test pile 1............................................................ 70
Figure 4-12 Comparison of the skin frictional distribution along the pile shaft for pile
top load 2680 kN of Test pile 2 .................................................................................. 71
Figure 4-13 Comparison of the skin frictional distribution along the pile shaft for pile
top load 5320kN of Test pile 2 ................................................................................... 72
Figure 4-14 Comparison of the skin frictional distribution along the pile shaft for pile
top load 7960kN of Test pile 2 ................................................................................... 73
Figure 4-15 Total normal stress at the toe level from FEM ....................................... 74
Figure 4-16 End bearing capacity vs pile top load for test pile 1 .............................. 75
Figure 4-17 End bearing value Vs Pile top load for Test pile 2 ................................. 76
Figure 4-18 Settlement comparison for twice RMR E with disturbed and undisturbed
shear strength parameters ........................................................................................... 77
Figure 4-19Skin friction distribution for Twice RMR E with disturbed and
undisturbed shear strength parameters ....................................................................... 78
Figure 4-20End bearing for twice RMR E with disturbed and undisturbed shear
strength parameters .................................................................................................... 79
Figure A - 1 Summary of UCS Test results in Stage I- Boreholes V
Figure A- 2 Comparison of Settlement Vs Applied pile top load for test pile1XVII
Figure A- 3 Comparison of Settlement Vs Applied pile top load for test pile 2XVIII
xi
Figure A- 4 Skin friction distribution at different strain gauge locations for pile top
load 2369 kN/m2 XIX
Figure A- 5 Skin friction distribution at different strain gauge locations for pile top
load 4702kN/m2
XX
Figure A-6 Skin friction distribution at different strain gauge locations for pile top
load 7035kN/m2 XXI
Figure A-7 Skin friction distribution at different strain gauge locations for pile top
load 9369kN/m2 XXII
Figure A-8 Skin friction distribution at different strain gauge locations for pile top
load 11702kN/m2
XXIII
Figure A-9 Skin friction distribution at different strain gauge locations for pile top
load 14035kN/m2 XXIV
Figure A-10 Skin friction distribution at different strain gauge locations for pile top
load 16369kN/m2 XXV
Figure A-11 Skin friction distribution at different strain gauge locations for pile top
load 18702kN/m2 XXVI
Figure A- 12 Skin friction distribution at different strain gauge locations for pile top
load 21035kN/m2 XXVII
Figure A- 13 Skin friction distribution at different strain gauge locations for pile top
load 23369kN/m2 XXVIII
Figure A- 14 Skin friction distribution at different strain gauge locations for pile top
load 25702kN/m2 XXIX
Figure A- 15 Skin friction distribution at different strain gauge locations for pile top
load 26444kN/m2 XXX
Figure A- 16 Skin friction distribution at different strain gauge locations for pile top
load 2369 kN/m2 XXXI
Figure A- 17 Skin friction distribution at different strain gauge locations for pile top
load 4702 kN/m2 XXXII
Figure A- 18 Skin friction distribution at different strain gauge locations for pile top
load 7035 kN/m2 XXXIII
Figure A- 19 Skin friction distribution at different strain gauge locations for pile top
load 9369 kN/m2 XXXIV
Figure A- 20 Skin friction distribution at different strain gauge locations for pile top
load 11702 kN/m2 XXXV

xii
Figure A- 21 Skin friction distribution at different strain gauge locations for pile top
load 14035 kN/m2 XXXVI
Figure A- 22 Skin friction distribution at different strain gauge locations for pile top
load 16369 kN/m2 XXXVII
Figure A- 23 Skin friction distribution at different strain gauge locations for pile top
load 18702 kN/m2 XXXVIII
Figure A- 24 Skin friction distribution at different strain gauge locations for pile top
load 21035 kN/m2 XXXIX
Figure A- 25 Skin friction distribution at different strain gauge locations for pile top
load 23369 kN/m2 XL
Figure A- 26 Skin friction distribution at different strain gauge locations for pile top
load 25702 kN/m2 XLI
Figure A- 27 Skin friction distribution at different strain gauge locations for pile top
load 26444 kN/m2 XLII
Figure A - 28 End bearing Vs Applied load for Test Pile 01 XLIII
Figure A - 29 End Bearing Vs Applied load for Test Pile 02 XLV
xiii
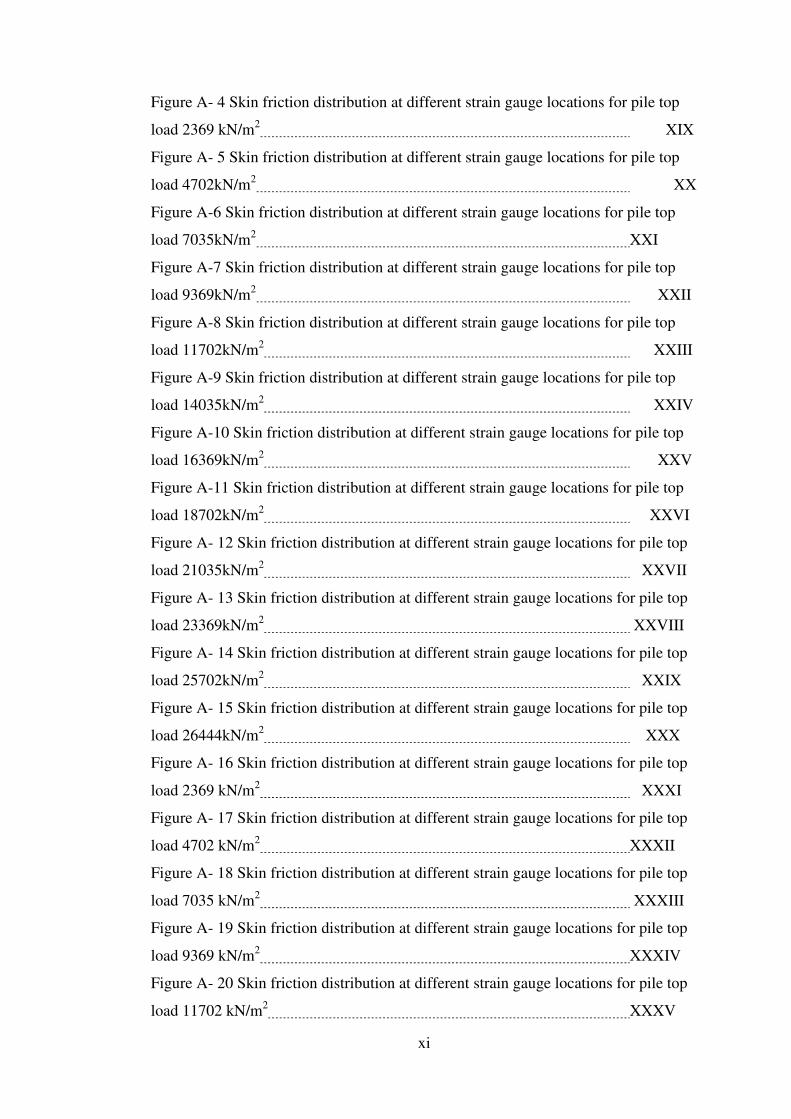
LIST OF TABLES
Table 2-1Results obtained from contour maps for pile depths. ................................. 18
Table 3-3-1Soil and rock layers of Bore hole 19 ....................................................... 53
Table 3-3-2Soil and rock layers of BH-07 ................................................................. 53
Table 3-3-3 RMR value calculation for Rock Mass A .............................................. 54
Table 3-3-4 RMR value calculation for Rock Mass B ............................................... 54
Table 3-3-5 RMR value calculation for Rock Mass C ............................................... 55
Table 3-3-6 RMR value calculation for Rock Mass D .............................................. 55
Table 3-3-7 Elastic modulus of rock layers ............................................................... 56
Table 4-1 compressibility and shear strength properties used in PLAXIS 2D for Bore
hole 19 (Test Pile 01) ................................................................................................. 60
Table 4-2 Compressibility and shear strength properties used in PLAXIS 2D for Bore
hole 07 (Test Pile 02) ................................................................................................. 60
Table 4-3 Comparison of load Vs settlement curve by different methods for Test pile
01 ................................................................................................................................ 62
Table 4-4Comparison of load Vs settlement curve by different methods for Test pile
02 ................................................................................................................................ 65
Table 4-5 End bearing capacity of Test pile 1 from FEM ......................................... 74
Table 4-6 End bearing capacity of Test pile 2 from FEM ......................................... 75
Table 4-7 Settlement comparison for twice RMR E with disturbed and undisturbed
shear strength parameters ........................................................................................... 77
Table 4-8 Skin friction distribution for Twice RMR E with disturbed and undisturbed
shear strength parameters ........................................................................................... 78
Table 4-9 End bearing for twice RMR E with disturbed and undisturbed shear
strength parameters .................................................................................................... 79
Table A- 1Mobilized Unit Shaft Friction and End Bearing for Test Pile 1 ............... IV
Table A- 2 Mobilized Unit shaft friction along the pile shaft at strain gauge locations
for Test pile 1 ............................................................................................................. VI
Table A- 3Mobilized Unit Shaft Friction and End Bearing for Test Pile 2 .............. VII
Table A- 4Mobilized Unit shaft friction along the pile shaft at strain gauge locations
for Test pile 2 ............................................................................................................ VII

xiv
Table A- 5 Input data for soil layers of test pile 1 in PLAXIS 2D ......................... VIII
Table A- 6 Input data for Rock layers and for concrete pile of test pile 1, model A-1
in PLAXIS 2D ............................................................................................................ IX
Table A- 7 Input data for Rock layers and for concrete pile of test pile 1, model A-2
in PLAXIS 2D ............................................................................................................. X
Table A- 8 Input data for Rock layers and for concrete pile of test pile 1, model A-3
in PLAXIS 2D ............................................................................................................ XI
Table A- 9 Input data for Rock layers and for concrete pile of test pile 1, model A-4
in PLAXIS 2D ........................................................................................................... XII
Table A- 10 Input data for soil layers of test pile 2 in PLAXIS 2D ....................... XIII
Table A- 11 Input data for Rock layer and for concrete pile of test pile 2, model B-1
in PLAXIS 2D ......................................................................................................... XIV
Table A- 12 Input data for Rock layer and for concrete pile of test pile 2, model B-2
in PLAXIS 2D ......................................................................................................... XIV
Table A- 13 Input data for Rock layer and for concrete pile of test pile 2, model B-3
in PLAXIS 2D .......................................................................................................... XV
Table A- 14 Input data for Rock layer and for concrete pile of test pile 2, model B-4
in PLAXIS 2D .......................................................................................................... XV
Table A- 15 Input data for Rock layer and for concrete pile of test pile 2, model B-5
in PLAXIS 2D ......................................................................................................... XVI
Table A- 16 Input data for Rock layer and for concrete pile of test pile 2, model B-6
in PLAXIS 2D ......................................................................................................... XVI
Table A- 17 Comparison of settlement obtained from Instrumented pile load test
results and PLAXIS 2D for test pile 1 ................................................................... XVII
Table A- 18 Comparison of settlement obtained from Instrumented pile load test
results and PLAXIS 2D for test pile 2 ................................................................. XVIII
Table A- 19 Comparison of skin frictional distribution along the pile shaft form
Instrumented pile load test and PLAXIS 2D for Pile top load 2369 kN/m2 ........... XIX
Table A- 20 Comparison of skin frictional distribution along the pile shaft form
Instrumented pile load test and PLAXIS 2D for Pile top load 4702kN/m2 ............. XX
Table A- 21 Comparison of skin frictional distribution along the pile shaft form
Instrumented pile load test and PLAXIS 2D for Pile top load 7035kN/m2 ............ XXI
Table A- 22 Comparison of skin frictional distribution along the pile shaft form
Instrumented pile load test and PLAXIS 2D for Pile top load 9369kN/m2 ........... XXII

xv
Table A- 23 Comparison of skin frictional distribution along the pile shaft form
Instrumented pile load test and PLAXIS 2D for Pile top load 11702kN/m2 ....... XXIII
Table A- 24 Comparison of skin frictional distribution along the pile shaft form
Instrumented pile load test and PLAXIS 2D for Pile top load 14035kN/m2 ....... XXIV
Table A- 25 Comparison of skin frictional distribution along the pile shaft form
Instrumented pile load test and PLAXIS 2D for Pile top load 16369kN/m2 ........ XXV
Table A- 26 Comparison of skin frictional distribution along the pile shaft form
Instrumented pile load test and PLAXIS 2D for Pile top load 18702kN/m2 ....... XXVI
Table A- 27 Comparison of skin frictional distribution along the pile shaft form
Instrumented pile load test and PLAXIS 2D for Pile top load 21035kN/m2 ...... XXVII
Table A- 28 Comparison of skin frictional distribution along the pile shaft form
Instrumented pile load test and PLAXIS 2D for Pile top load 23369kN/m2XXVIII
Table A- 29 Comparison of skin frictional distribution along the pile shaft form
Instrumented pile load test and PLAXIS 2D for Pile top load 25702kN/m2XXIX
Table A- 30 Comparison of skin frictional distribution along the pile shaft form
Instrumented pile load test and PLAXIS 2D for Pile top load 26444kN/m2 ........ XXX
Table A- 31 Comparison of skin frictional distribution along the pile shaft form
Instrumented pile load test and PLAXIS 2D for Pile top load 2369 kN/m2 ........ XXXI
Table A- 32 Comparison of skin frictional distribution along the pile shaft form
Instrumented pile load test and PLAXIS 2D for Pile top load 4702 kN/m2 ....... XXXII
Table A- 33 Comparison of skin frictional distribution along the pile shaft form
Instrumented pile load test and PLAXIS 2D for Pile top load 7035 kN/m2 ..... XXXIII
Table A- 34 Comparison of skin frictional distribution along the pile shaft form
Instrumented pile load test and PLAXIS 2D for Pile top load 9369 kN/m2 XXXIV
Table A- 35 Comparison of skin frictional distribution along the pile shaft form
Instrumented pile load test and PLAXIS 2D for Pile top load 11702 kN/m2 ..... XXXV
Table A- 36 Comparison of skin frictional distribution along the pile shaft form
Instrumented pile load test and PLAXIS 2D for Pile top load 14035 kN/m2 XXXVI
Table A- 37 Comparison of skin frictional distribution along the pile shaft form
Instrumented pile load test and PLAXIS 2D for Pile top load 16369 kN/m2 XXXVII
Table A- 38 Comparison of skin frictional distribution along the pile shaft form
Instrumented pile load test and PLAXIS 2D for Pile top load 18702 kN/m2 XXXVIII
Table A- 39 Comparison of skin frictional distribution along the pile shaft form
Instrumented pile load test and PLAXIS 2D for Pile top load 21035 kN/m2 XXXIX

xvi
Table A- 40 Comparison of skin frictional distribution along the pile shaft form
Instrumented pile load test and PLAXIS 2D for Pile top load 23369 kN/m2 ...... XL
Table A- 41 Comparison of skin frictional distribution along the pile shaft form
Instrumented pile load test and PLAXIS 2D for Pile top load 25702 kN/m2 ....... XLI
Table A- 42 Comparison of skin frictional distribution along the pile shaft form
Instrumented pile load test and PLAXIS 2D for Pile top load 26444 kN/m2 ........ XLII
Table A - 43 End bearing results comparison for Test Pile 01 ............................. XLIII
Table A - 44 End Bearing Vs Applied load for Test Pile 02 ................................ XLIV

xvii
LIST OF ABBRIVIATIONS
Abbreviation Description
2D Two Dimensional
3D Three Dimensional
AASHTO The American Association of State Highway
Transportation Officials
CPT Cone Penetration Test
ESL Elastic Shortening Line
FEM Finite Element Model
FoS Factor of Safety
GIS Geographical Information System
HC Highland Complex
ICTAD Institute for Construction Training and
Development
MC Mohr- Coulomb
PDA Pile Driving Analyzer
RMR Rock Mass Rating
RQD Rock Quality Designation
RSR Rock Structure Rating
SPT Standard Penetration Test