Embed Size (px)
Citation preview

J Geod (2009) 83:943–951DOI 10.1007/s00190-009-0311-8
ORIGINAL ARTICLE
Comparison of GMF/GPT with VMF1/ECMWF and implicationsfor atmospheric loading
Peter Steigenberger · Johannes Boehm ·Volker Tesmer
Received: 27 August 2008 / Accepted: 3 March 2009 / Published online: 26 March 2009© Springer-Verlag 2009
Abstract This paper compares estimates of station coordi-nates from global GPS solutions obtained by applying dif-ferent troposphere models: the Global Mapping Function(GMF) and the Vienna Mapping Function 1 (VMF1) aswell as a priori hydrostatic zenith delays derived from theGlobal Pressure and Temperature (GPT) model and from theEuropean Centre for Medium-Range Weather Forecasts(ECMWF) numerical weather model data. The station heightdifferences between terrestrial reference frames computedwith GMF/GPT and with VMF1/ECMWF are in generalbelow 1 mm, and the horizontal differences are even smaller.The differences of annual amplitudes in the station height canalso reach up to 1 mm. Modeling hydrostatic zenith delayswith mean (or slowly varying empirical) pressure valuesinstead of the true pressure values results in a partial com-pensation of atmospheric loading. Therefore, station heighttime series based on the simple GPT model have a betterrepeatability than those based on more realistic ECMWFtroposphere a priori delays if atmospheric loading correc-
P. Steigenberger (B)Institut für Astronomische und Physikalische Geodäsie,Technische Universität München, Arcisstraße 21,80333 Munich, Germanye-mail: [email protected]
J. BoehmInstitute of Geodesy and Geophysics,Vienna University of Technology, Gußhausstraße 27-29,1040 Vienna, Austria
V. TesmerDeutsches Geodätisches Forschungsinstitut,Alfons-Goppel-Straße 11, 80539 Munich, Germany
Present Address:V. TesmerOHB-System AG, Universitätsallee 27-29,28359 Bremen, Germany
tions are not included. On the other hand, a priori delaysfrom numerical weather models are essential to reveal thefull atmospheric loading signal.
Keywords Troposphere modeling · Mapping function ·Atmospheric loading · GPS
1 Introduction
Due to the correlations between the troposphere zenith delaysand the station heights (e.g., Rothacher 2002), a sophisti-cated modeling of the troposphere is a prerequisite for theestimation of precise coordinates from space geodeticmicrowave techniques, namely Global Navigation SatelliteSystems (GNSS) like the Global Positioning System (GPS),Very Long Baseline Interferometry (VLBI), and DopplerOrbitography and Radiopositioning Integrated by Satellite(DORIS). Troposphere parameters estimated by differenttechniques have been compared by, e.g., Snajdrova et al.(2005) and Steigenberger et al. (2007). The troposphericmodeling discussed in this paper consists of two parts: (1)the tropospheric mapping function to convert the tropospheredelay at a certain elevation angle to a zenith delay and (2)an a priori model for the zenith hydrostatic delay (ZHD).Mapping functions and a priori ZHDs derived from numer-ical weather models (NWMs) provide the best tropospheremodeling globally available nowadays. The Vienna MappingFunction 1 (VMF1, Boehm et al. 2006b) and ZHDs derivedfrom the European Centre for Medium-Range Weather Fore-casts (ECMWF) NWM are such a sophisticated modelingapproach. However, the dependence on external data, thehandling of these data, and the assumption that the differ-ences to the Global Mapping Function (GMF) and the GlobalPressure and Temperature (GPT) model are small might be
123

944 P. Steigenberger et al.
reasons why VMF1 and ECMWF ZHDs are not routinelyused in GPS data analysis.
On the other hand, the empirical GMF (Boehm et al.2006a) and the GPT model (Boehm et al. 2007a) for the com-putation of the ZHD are easier to use as they do not requireexternal input data. Therefore, this modeling approach is usedby most analysis centers of the International GNSS Service(IGS, Dow et al. 2005) nowadays. As GMF and GPT ZHDsor VMF1 and ECMWF ZHDs are usually used together, thispaper will focus on the comparison of these modeling optionsdenoted by GMF/GPT and VMF1/ECMWF. However, forsome comparisons other combinations of mapping functionsand ZHDs will also be used.
Comparisons of different troposphere mapping functionshave already been performed by Boehm et al. (2007b), Tes-mer et al. (2007) and Vey et al. (2006). Tregoning and Herring(2006) showed that systematic differences between constantZHDs and GPT-derived ZHDs introduce systematic stationheight biases of up to 10 mm, in particular in Antarctica.Tesmer et al. (2006) also found systematic height differenceswhen comparing coordinate time series of 49 VLBI tele-scopes computed with constant a priori delays and a pri-ori delays derived from pressure measurements at the sites.Kouba (2009) already compared the mapping function/a pri-ori ZHD combinations GMF/GPT and VMF1/ECMWF withthe precise point positioning (PPP) approach (e.g., Zumbergeet al. 1997) at 11 sites and for a time span of 1.5 years. How-ever, because of the larger number of stations and the longertime span used in this study, our results should be more mean-ingful statistically.
Section 2 describes the tropospheric modeling of geodeticmicrowave observations and provides more details on themapping functions and ZHDs mentioned above. The GPSprocessing resulting in four different global GPS solutionscovering all combinations of the two different mapping func-tions GMF and VMF1 and the two different a priori ZHDsGPT and ECMWF is explained in Sect. 3. The differencesof these solutions as regards station coordinates, terrestrialreference frames (TRFs) and station height repeatabilitiesare shown in Sect. 4. Section 5 discusses the effect of atropospheric mismodeling (GMF/GPT compared to VMF1/ECMWF) and the implications for atmospheric loading.Tregoning and Herring (2006) already pointed out thedestructive interference between ZHD errors and atmo-spheric loading and Kouba (2009) showed, that this mismod-eling partly compensates for atmospheric loading.
2 Troposphere modeling
The tropospheric delay is usually separated into a hydrostaticdelay that is modeled a priori and a wet delay that is esti-mated from the space geodetic microwave observations. As
the modeled hydrostatic delays and the estimated wet delaysare usually referred to the zenith direction, correspondingmapping functions are required to convert the slant delays inobservation direction to the zenith. In addition, tropospheregradients can be estimated to account for asymmetries of thetroposphere (e.g., MacMillan 1995; Rothacher et al. 1998).
Most of the recent mapping functions are based on thecontinued fraction form of Herring (1992). For the VMF1,the coefficients ah and aw were derived from a rigorous ray-tracing through pressure levels of the ECMWF operationalanalysis data. These coefficients are provided by TU Vienna1
as site-specific or global grid (2◦× 2.5◦) time series with6-hourly temporal spacing. The coefficients bh and ch werederived from 1 year of ECMWF data in a least squares fit.Whereas bh is constant, ch depends on the day of year andthe latitude. bw and cw were taken from the Niell mappingfunction (Niell 1996) at 45◦ latitude, since the coefficient aw
is sufficient to model the dependence of the wet mappingfunction on latitude (Boehm and Schuh 2004).
The GMF is an empirical mapping function (input argu-ments are only the day of year and the site location) thatis consistent with VMF1. Expressions for the coefficientsah and aw (mean values and annual signal) were derivedfrom 3 years of ECMWF data and are provided as a sphericalharmonic expansion of degree and order 9. The coefficientsb and c are taken from the VMF1.
Hydrostatic troposphere delays depend primarily on thepressure. GPT provides pressure and temperature based onthe location of a station and the day of the year. The hydro-static part of the Saastamoinen (1973) equation can be usedto compute the ZHD from the GPT-derived pressure. Likethe GMF, GPT is based on a spherical harmonic expansion(mean values and annual signal) of degree and order 9 derivedfrom 3 years of ECMWF data.
Hydrostatic zenith delays directly derived from numericalintegration through pressure level data of NWMs in additionaccount for short-term as well as inter-seasonal variations.Like the VMF1 coefficients, the ECMWF ZHDs are avail-able on a global 2◦× 2.5◦ grid with 6 h time resolution. As theECMWF ZHDs are provided for the heights hM of a digitalelevation model2 (DEM) at the grid points, these values haveto be extrapolated to the actual station height h. F. Brunner(2001, personal communication) proposed the extrapolation
ZHD(h)=ZHD(hM )−2.277 × 10⁻³ g
R
p(hM )
T (hM )(h − hM )
(1)
with g gravity, R gas constant, p(hM ) pressure at height hM ,T (hM ) temperature at height hM . p(hM ) and T (hM ) canbe computed with the GPT model or a standard atmosphere
1 http://mars.hg.tuwien.ac.at/~ecmwf1/.2 http://www.hg.tuwien.ac.at/~ecmwf1/GRID/orography_ell.
123

Comparison of GMF/GPT with VMF1/ECMWF 945
Table 1 Troposphere mappingfunctions and hydrostatic apriori delays of the four globalGPS solutions discussed in thispaper
Solution Mapping function Hydrostatic a priori delay
GMF/GPT GMF GPT/Saastamoinen
VMF1/GPT Gridded VMF1 GPT/Saastamoinen
GMF/ECMWF GMF Gridded ECMWF ZHDs + extrapolation
VMF1/ECMWF Gridded VMF1 Gridded ECMWF ZHDs + extrapolation
(e.g., Berg 1948). As will be shown in Sect. 4, this extrapo-lation is not sufficient for large height differences.
3 Global GPS solutions
The global GPS solutions are based on the GPS repro-cessing effort of Technische Universität München (TUM),Technische Universität Dresden (TUD) and GeoForschungs-Zentrum (GFZ) Potsdam (Steigenberger et al. 2006). Thesolutions discussed in this paper were computed with anupdated processing scheme, see Steigenberger et al. (2009a).A modified version of the Bernese GPS Software (Dach et al.2007) was used to process observations from a global net-work of 202 GPS tracking stations for the time period 1 Jan-uary 1994 till 31 October 2005. Four solutions covering allcombinations of the mapping functions GMF and VMF1 andthe hydrostatic a priori delays from GPT and ECMWF havebeen computed (see Table 1). The grid version of VMF1 wasused since for some of the stations of our tracking networkthe site-specific version of the VMF1 is not available. As theVMF1 coefficients as well the ECMWF ZHDs are providedon 2◦× 2.5◦ grids with 6-hourly temporal resolution, a spatialbi-linear interpolation and a temporal linear interpolationhave been used. For all solutions, an elevation cut-off angle of3◦ and an elevation-dependent weighting (weight w = cos2 zwith zenith angle z) was applied (for the impact of differ-ent cut-off angles and elevation-dependent weighting seeTregoning and Herring 2006).
The GPS data are processed in daily batches. The wettroposphere zenith delays are estimated as a continuouspiecewise linear function with 2 h parameter spacing. Thetroposphere gradients in east–west and north–south directionhave a parameter spacing of 24 h. The approach for comput-ing a GPS-derived TRF and time series solutions followsSteigenberger et al. (2009b): 1-day normal equations includ-ing station positions and pole coordinates have been accu-mulated. Station coordinates and velocities as well as polecoordinates with daily resolution represented by a continuouspiecewise linear function have been estimated in a single pro-gram run. The geodetic datum was defined by no-net-rotationconditions for coordinates and velocities of 62 stable IGb00(Ray et al. 2004) stations. These TRFs have been used for
datum definition in the time series solutions which yieldedthe final station coordinate time series.
4 Comparisons of GMF/GPT and VMF1/ECMWF
The transformation parameters of a 14-parameter similaritytransformation between the GMF/GPT TRF and the VMF1/ECMWF TRF are listed in Table 2. A slight shift of 0.7 mmoccurs in z-direction whereas the other translations, the rota-tion and scale offsets as well as all rates are not significant.The residuals of the 14-parameter similarity transformation(datum stations only) are shown in Fig. 1. The horizontalresiduals are all below 0.5 mm (vector length) with a meanvalue of 0.25 mm. They show a systematic pattern pointing toa virtual point located in the southern Indian ocean. Althoughthe reason for this effect is not clear, Tesmer et al. (2007)reported a similar behavior for VLBI solutions computedwith different mapping functions. However, one has to beaware of the small magnitude of the horizontal residuals.
As expected, the height residuals are larger and rangefrom −5.9 mm for Davis (Antarctica) to +6.4 mm for MaunaKea (Hawaii). However, the absolute value of the heightresiduals is below 1 mm for 81% of the stations and below0.5 mm for 58% of the stations. These results are in generalaccordance with the VLBI-based GMF/VMF1 comparisonsof Tesmer et al. (2007). In contrast to the horizontal resid-uals, the vertical residuals do not show a clear systematicpattern although some larger negative residuals are presentin Antarctica. Some of the larger height residuals are relatedto extrapolation errors of Eq. 1 as well as the height extrap-olation of GPT. For example, Mauna Kea has an ellipsoidalstation height of 3,755 m whereas the interpolated height ofthe ECMWF DEM is 322 m. This extrapolation for a heightdifference of more than 3 km is probably the main reasonfor the height residual of +6.4 mm. The horizontal velocityresiduals are negligible (a few hundredth of a millimeter peryear). The vertical velocity residuals are in general below0.2 mm/year with an absolute mean value of 0.08 mm/year.
Mean station height repeatabilities (average of allstations) of the four different troposphere modelingapproaches are listed in Table 3. The first column containsrepeatabilities computed as WRMS values of the differencesbetween the daily solutions and the TRF solution, i.e., all
123

946 P. Steigenberger et al.
Table 2 Transformationparameters of a 14-parametersimilarity transformationbetween GMF/GPT andVMF1/ECMWF terrestrialreference frames
Offset Rate
Translation X 0.18 ± 0.08 (mm) 0.02 ± 0.08 (mm/year)
Translation Y −0.07 ± 0.08 (mm) 0.02 ± 0.08 (mm/year)
Translation Z 0.71 ± 0.08 (mm) −0.02 ± 0.08 (mm/year)
Rotation X 0.01 ± 0.01 (mas) 0.00 ± 0.01 (mas/year)
Rotation Y 0.00 ± 0.01 (mas) 0.00 ± 0.01 (mas/year)
Rotation Z 0.00 ± 0.01 (mas) 0.00 ± 0.01 (mas/year)
Scale −0.03 ± 0.01 (ppb) 0.00 ± 0.01 (ppb/year)
Fig. 1 Residuals of a14-parameter similaritytransformation betweenGMF/GPT and VMF1/ECMWFterrestrial reference frames. Thearrows refer to the horizontal,the color scale to the heightresiduals
<−2.0 −1.5 −1.0 −0.5 0.0 0.5 1.0 1.5 >2.0
0.5 mm
Height residuals [mm]
Table 3 Mean station height repeatabilities: TRF stands the repeata-bilities from the reference frame solution; Weekly 2004 for the repea-tabilities of seven daily solutions w.r.t. a weekly solution, averaged forthe year 2004
Solution TRF (mm) Weekly 2004 (mm)
GMF/GPT 9.30 5.35
GMF/ECMWF 9.41 5.46
VMF1/GPT 9.12 5.15
VMF1/ECMWF 9.38 5.28
systematic and random signals differing from the linear TRFmodel contribute to these values. The second column rep-resents a mean value of repeatabilities from weekly solu-tions for the year 2004, i.e., the deviations of seven dailysolution w.r.t. the combined weekly solution. If one com-pares solutions with the same a priori ZHD (GMF/GPT vs.VMF1/GPT or GMF/ECMWF vs. VMF1/ECMWF) one cansee that VMF1 performs slightly better than GMF. This resultis consistent with the VLBI-derived repeatabilities of Tesmeret al. (2007). On the other hand, a comparison of solutions
with the same mapping function (GMF/GPT vs. GMF/EC-MWF or VMF1/GPT vs. VMF1/ECMWF) shows that GPTresults in better repeatabilities than ECMWF ZHDs for boththe TRF and the weekly repeatabilities. As will be shown inSect. 5, this effect is related to the partial compensation ofatmospheric loading by applying the GPT model.
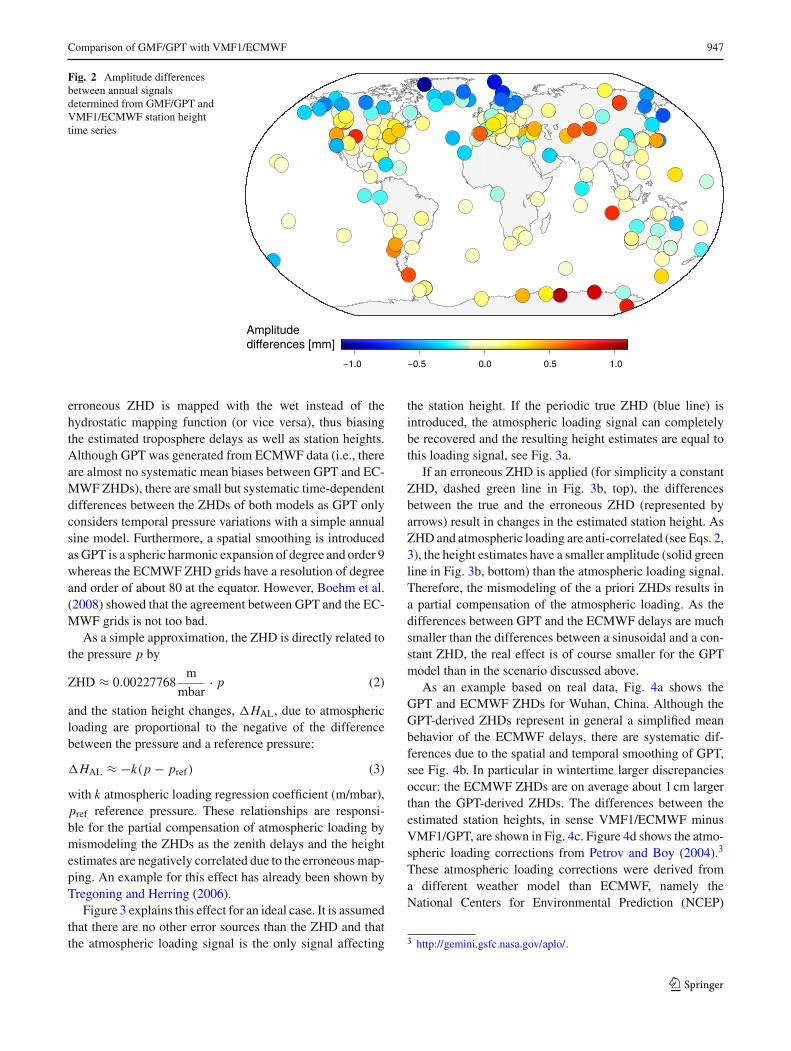
Another result from these comparisons is that the ampli-tudes of annual signals in the station height are affected bydifferent troposphere modeling. The amplitude differencesbetween the solutions, GMF/GPT minus VMF1/ECMWF,are shown in Fig. 2. They range from −1.1 to +1.0 mmwith an absolute mean value of 0.3 mm and a slight lati-tude dependence. In Antarctica, the VMF1/ECMWF stationheight amplitudes are in general smaller, whereas the situa-tion in the high northern latitude is the opposite.
5 Implications for atmospheric loading
The differences between the hydrostatic and the wet map-ping functions result in a height error if an erroneous apriori ZHD is applied: the difference between the true and the
123
Comparison of GMF/GPT with VMF1/ECMWF 947
Fig. 2 Amplitude differencesbetween annual signalsdetermined from GMF/GPT andVMF1/ECMWF station heighttime series
−1.0 −0.5 0.0 0.5 1.0
Amplitudedifferences [mm]
erroneous ZHD is mapped with the wet instead of thehydrostatic mapping function (or vice versa), thus biasingthe estimated troposphere delays as well as station heights.Although GPT was generated from ECMWF data (i.e., thereare almost no systematic mean biases between GPT and EC-MWF ZHDs), there are small but systematic time-dependentdifferences between the ZHDs of both models as GPT onlyconsiders temporal pressure variations with a simple annualsine model. Furthermore, a spatial smoothing is introducedas GPT is a spheric harmonic expansion of degree and order 9whereas the ECMWF ZHD grids have a resolution of degreeand order of about 80 at the equator. However, Boehm et al.(2008) showed that the agreement between GPT and the EC-MWF grids is not too bad.
As a simple approximation, the ZHD is directly related tothe pressure p by
ZHD ≈ 0.00227768m
mbar· p (2)
and the station height changes, �HAL, due to atmosphericloading are proportional to the negative of the differencebetween the pressure and a reference pressure:
�HAL ≈ −k(p − pref) (3)
with k atmospheric loading regression coefficient (m/mbar),pref reference pressure. These relationships are responsi-ble for the partial compensation of atmospheric loading bymismodeling the ZHDs as the zenith delays and the heightestimates are negatively correlated due to the erroneous map-ping. An example for this effect has already been shown byTregoning and Herring (2006).
Figure 3 explains this effect for an ideal case. It is assumedthat there are no other error sources than the ZHD and thatthe atmospheric loading signal is the only signal affecting
the station height. If the periodic true ZHD (blue line) isintroduced, the atmospheric loading signal can completelybe recovered and the resulting height estimates are equal tothis loading signal, see Fig. 3a.
If an erroneous ZHD is applied (for simplicity a constantZHD, dashed green line in Fig. 3b, top), the differencesbetween the true and the erroneous ZHD (represented byarrows) result in changes in the estimated station height. AsZHD and atmospheric loading are anti-correlated (see Eqs. 2,3), the height estimates have a smaller amplitude (solid greenline in Fig. 3b, bottom) than the atmospheric loading signal.Therefore, the mismodeling of the a priori ZHDs results ina partial compensation of the atmospheric loading. As thedifferences between GPT and the ECMWF delays are muchsmaller than the differences between a sinusoidal and a con-stant ZHD, the real effect is of course smaller for the GPTmodel than in the scenario discussed above.
As an example based on real data, Fig. 4a shows theGPT and ECMWF ZHDs for Wuhan, China. Although theGPT-derived ZHDs represent in general a simplified meanbehavior of the ECMWF delays, there are systematic dif-ferences due to the spatial and temporal smoothing of GPT,see Fig. 4b. In particular in wintertime larger discrepanciesoccur: the ECMWF ZHDs are on average about 1 cm largerthan the GPT-derived ZHDs. The differences between theestimated station heights, in sense VMF1/ECMWF minusVMF1/GPT, are shown in Fig. 4c. Figure 4d shows the atmo-spheric loading corrections from Petrov and Boy (2004).3
These atmospheric loading corrections were derived froma different weather model than ECMWF, namely theNational Centers for Environmental Prediction (NCEP)
3 http://gemini.gsfc.nasa.gov/aplo/.
123

948 P. Steigenberger et al.
Fig. 3 Impact of troposphericmismodeling on estimatedstation heights: a ideal case, thecomplete atmospheric loadingsignal is recovered by the heightestimates. b Erroneous(constant) ZHD (dashed greenline), a part of the atmosphericloading signal is compensatedby the mismodeling of thehydrostatic a priori delay
(a) (b)
DH
Z.daol.
mtA
thg ieH
thgi eH
DH
Z.dao l.
mtA
Fig. 4 Time series for Wuhan:a hydrostatic a priori delaysfrom GPT (red) and ECMWF(blue). b ZHD differencesECMWF − GPT. c Stationheight differences,VMF1/ECMWF − VMF1/GPT;the red line indicates a 50-daymedian. d Atmospheric loadingcorrections provided by Petrovand Boy (2004)
2.26
2.28
2.30
2.32
2.34
ZH
D [m
]
(a)
−20
0
20
40
∆ZH
D [m
m]
(b)
−2
−1
0
1
2
∆Up
[mm
]
(c)
1996 1997 1998 1999 2000 2001 2002 2003 2004 2005 2006
−10
0
10
∆ Up
[mm
]
(d)
model. However, the surface pressure differences betweenNCEP and ECMWF are rather small and are not expectedto influence the results significantly. A clear annual signalcan be seen in both time series, the station height differ-ences and the atmospheric loading corrections. Although theorder of magnitude of the station height differences is muchsmaller than those of the atmospheric loading corrections, itis evident that both signals show a good agreement in phase.Therefore, the GPT-derived ZHDs partly compensate for theatmospheric loading effect.
The homogeneously reprocessed GPS time series ofstation heights provides an ideal basis to study the impactof different troposphere modeling and atmospheric loadingcorrections in more detail. All stations with time series longerthan 2 years have been considered. After removing stations
with frequent or large data gaps or with known problems, 183out of 202 stations remain. To simplify matters, the atmo-spheric loading corrections have been applied a posteriori bytaking the correction at 12:00 UT. The mean station heightrepeatabilities with and without atmospheric loading correc-tions are shown in Fig. 5. The results without atmosphericloading corrections are consistent with the repeatabilities inTable 3 already discussed above: VMF1 performs better thanGMF and for both mapping functions, the ECMWF a prioriZHDs result in worse repeatabilities compared to GPT. How-ever, after correcting for atmospheric loading, the repeatabil-ities of the solutions with ECMWF ZHDs are slightly betterfor both GMF and VMF1. Although the differences are onthe level of a few tenths of a millimeter, Fig. 5 confirms thetheoretical considerations discussed above.
123

Comparison of GMF/GPT with VMF1/ECMWF 949
ECMWF GPT7.5
8
8.5
9GMF
Hei
ght R
epea
tabi
lity
[mm
]
raw atm. load. corrected
ECMWF GPT7.5
8
8.5
9VMF1
Fig. 5 Station height repeatabilities without (raw) and with atmo-spheric loading corrections
However, for stations near the coast the largest part ofthe atmospheric loading is absorbed by the inverted barom-eter effect of the ocean. This fact is confirmed by Fig. 6which shows the repeatability differences of solution VMF1/ECMWF with and without atmospheric loading corrections.Pronounced repeatability improvements occur only in thenorthern central part of North America, in Europe, and inthe central part of Asia. The coastal sites in general show arepeatability difference below 0.5 mm. Therefore, a separatestatistics for stations at least 200 km away from the coast isincluded in Table 4. For this subset of stations, the repeatabil-ity improvement when correcting for atmospheric loading isabout a factor of two larger compared to all stations.
The results discussed above are in general agreement withKouba (2009) who compared GMF/GPT and VMF1/EC-MWF by PPP solutions of 11 stations covering a timeperiod of 1.5 years. In addition to Table 6 of Kouba (2009),J. Kouba (2008, personal communication) provided anupdated solution including VMF1/GPT repeatabilities (seeTable 4). Some important differences between the analysis
of Kouba (2009) and those presented here should be empha-sized:
– PPP solutions versus global network solution– 1.5 versus 11.8 years– 11 versus 183 stations– atmospheric loading regression coefficients versus cor-
rections from Petrov and Boy (2004).
As the time period as well as the number of stations ismuch larger compared to J. Kouba (2008, personal commu-nication), the results presented in this paper are assumed tobe more reliable as the impact of outliers is smaller and moreareas of the world are covered. First of all, all of our networksolutions provide better height repeatabilities compared tothe corresponding PPP solutions of J. Kouba (2008, personalcommunication). The repeatability improvement when cor-recting for atmospheric loading is larger when using thecorrections from Petrov and Boy (2004) compared to the sim-ple regression coefficient approach. The largest repeatabilityimprovement [consistently for our solution and the J. Kouba(2008, personal communication) solution] can be achievedfor solution VMF1/ECMWF: VMF1 is the more precise map-ping function compared to GMF and only the ECMWF ZHDsare able to reveal the full loading signal. The partial com-pensation of atmospheric loading by the GPT-derived ZHDsresulting in better repeatabilities for the raw time series isvisible for our as well as for the J. Kouba (2008, personalcommunication) solutions.
Although GMF provides a worse height repeatabilitycompared to VMF1, the raw GMF/GPT repeatabilities ofJ. Kouba (2008, personal communication) are 0.2 mm smallerthan the corresponding VMF1/ECMWF repeatabilities,
Fig. 6 Repeatabilitydifferences for solutionVMF1/ECMWF with andwithout atmospheric loadingcorrections
−2.5 −2.0 −1.5 −1.0 −0.5 0.0 0.5
Repeatabilitydifference [mm]
123
950 P. Steigenberger et al.
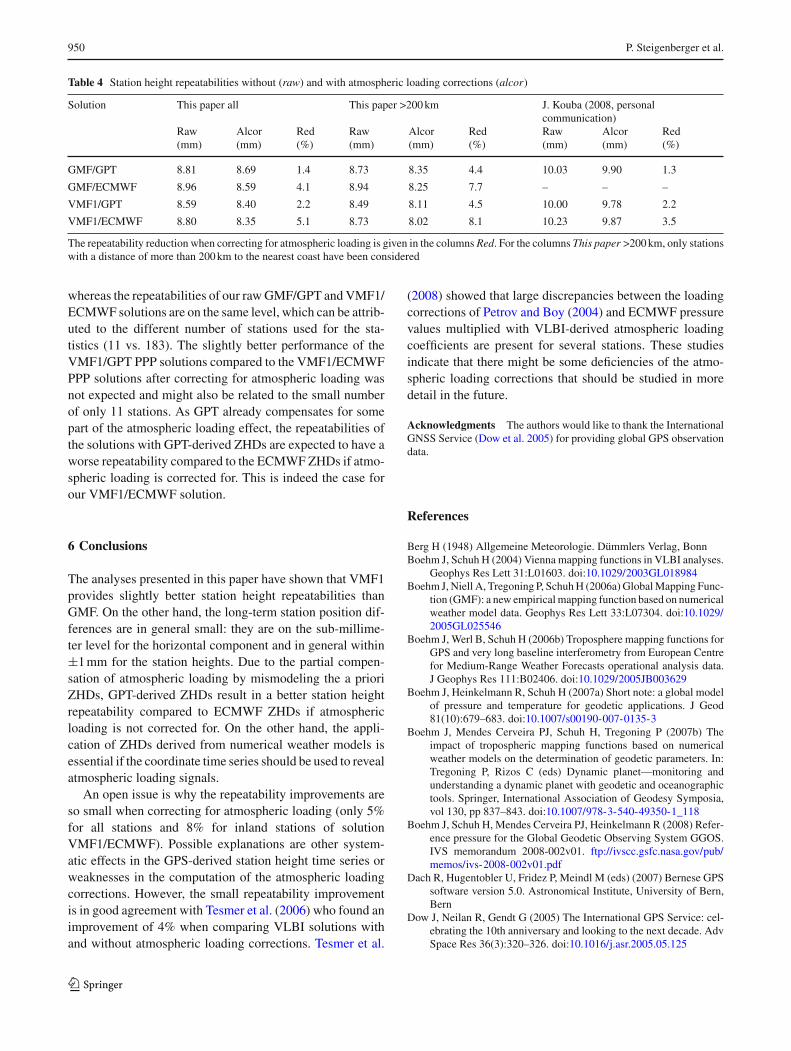
Table 4 Station height repeatabilities without (raw) and with atmospheric loading corrections (alcor)
Solution This paper all This paper >200 km J. Kouba (2008, personalcommunication)
Raw Alcor Red Raw Alcor Red Raw Alcor Red(mm) (mm) (%) (mm) (mm) (%) (mm) (mm) (%)
GMF/GPT 8.81 8.69 1.4 8.73 8.35 4.4 10.03 9.90 1.3
GMF/ECMWF 8.96 8.59 4.1 8.94 8.25 7.7 – – –
VMF1/GPT 8.59 8.40 2.2 8.49 8.11 4.5 10.00 9.78 2.2
VMF1/ECMWF 8.80 8.35 5.1 8.73 8.02 8.1 10.23 9.87 3.5
The repeatability reduction when correcting for atmospheric loading is given in the columns Red. For the columns This paper >200 km, only stationswith a distance of more than 200 km to the nearest coast have been considered
whereas the repeatabilities of our raw GMF/GPT and VMF1/ECMWF solutions are on the same level, which can be attrib-uted to the different number of stations used for the sta-tistics (11 vs. 183). The slightly better performance of theVMF1/GPT PPP solutions compared to the VMF1/ECMWFPPP solutions after correcting for atmospheric loading wasnot expected and might also be related to the small numberof only 11 stations. As GPT already compensates for somepart of the atmospheric loading effect, the repeatabilities ofthe solutions with GPT-derived ZHDs are expected to have aworse repeatability compared to the ECMWF ZHDs if atmo-spheric loading is corrected for. This is indeed the case forour VMF1/ECMWF solution.
6 Conclusions
The analyses presented in this paper have shown that VMF1provides slightly better station height repeatabilities thanGMF. On the other hand, the long-term station position dif-ferences are in general small: they are on the sub-millime-ter level for the horizontal component and in general within±1 mm for the station heights. Due to the partial compen-sation of atmospheric loading by mismodeling the a prioriZHDs, GPT-derived ZHDs result in a better station heightrepeatability compared to ECMWF ZHDs if atmosphericloading is not corrected for. On the other hand, the appli-cation of ZHDs derived from numerical weather models isessential if the coordinate time series should be used to revealatmospheric loading signals.
An open issue is why the repeatability improvements areso small when correcting for atmospheric loading (only 5%for all stations and 8% for inland stations of solutionVMF1/ECMWF). Possible explanations are other system-atic effects in the GPS-derived station height time series orweaknesses in the computation of the atmospheric loadingcorrections. However, the small repeatability improvementis in good agreement with Tesmer et al. (2006) who found animprovement of 4% when comparing VLBI solutions withand without atmospheric loading corrections. Tesmer et al.
(2008) showed that large discrepancies between the loadingcorrections of Petrov and Boy (2004) and ECMWF pressurevalues multiplied with VLBI-derived atmospheric loadingcoefficients are present for several stations. These studiesindicate that there might be some deficiencies of the atmo-spheric loading corrections that should be studied in moredetail in the future.
Acknowledgments The authors would like to thank the InternationalGNSS Service (Dow et al. 2005) for providing global GPS observationdata.
References
Berg H (1948) Allgemeine Meteorologie. Dümmlers Verlag, BonnBoehm J, Schuh H (2004) Vienna mapping functions in VLBI analyses.
Geophys Res Lett 31:L01603. doi:10.1029/2003GL018984Boehm J, Niell A, Tregoning P, Schuh H (2006a) Global Mapping Func-
tion (GMF): a new empirical mapping function based on numericalweather model data. Geophys Res Lett 33:L07304. doi:10.1029/2005GL025546
Boehm J, Werl B, Schuh H (2006b) Troposphere mapping functions forGPS and very long baseline interferometry from European Centrefor Medium-Range Weather Forecasts operational analysis data.J Geophys Res 111:B02406. doi:10.1029/2005JB003629
Boehm J, Heinkelmann R, Schuh H (2007a) Short note: a global modelof pressure and temperature for geodetic applications. J Geod81(10):679–683. doi:10.1007/s00190-007-0135-3
Boehm J, Mendes Cerveira PJ, Schuh H, Tregoning P (2007b) Theimpact of tropospheric mapping functions based on numericalweather models on the determination of geodetic parameters. In:Tregoning P, Rizos C (eds) Dynamic planet—monitoring andunderstanding a dynamic planet with geodetic and oceanographictools. Springer, International Association of Geodesy Symposia,vol 130, pp 837–843. doi:10.1007/978-3-540-49350-1_118
Boehm J, Schuh H, Mendes Cerveira PJ, Heinkelmann R (2008) Refer-ence pressure for the Global Geodetic Observing System GGOS.IVS memorandum 2008-002v01. ftp://ivscc.gsfc.nasa.gov/pub/memos/ivs-2008-002v01.pdf
Dach R, Hugentobler U, Fridez P, Meindl M (eds) (2007) Bernese GPSsoftware version 5.0. Astronomical Institute, University of Bern,Bern
Dow J, Neilan R, Gendt G (2005) The International GPS Service: cel-ebrating the 10th anniversary and looking to the next decade. AdvSpace Res 36(3):320–326. doi:10.1016/j.asr.2005.05.125
123

Comparison of GMF/GPT with VMF1/ECMWF 951
Herring T (1992) Modeling atmospheric delays in the analysis of spacegeodetic data. In: de Munck J, Spoelstra T (eds) Publications ongeodesy (New Series), Netherlands Geodetic Commision, Delft,vol 36, pp 157–164, ISBN: 90 6132 243 X
Kouba J (2009) Testing of Global Pressure/Temperature (GPT) Modeland Global Mapping Function (GMF) in GPS analyses. J Geod83(3–4):199–208. doi:10.1007/s00190-008-0229-6
MacMillan DS (1995) Atmospheric gradients from very long baselineinterferometry observations. Geophys Res Lett 22(9):1041–1044
Niell A (1996) Global mapping functions for the atmosphere delay atradio wavelengths. J Geophys Res 101(B2):3227–3246. doi:10.1029/95JB03048
Petrov L, Boy JP (2004) Study of the atmospheric pressure loading sig-nal in very long baseline interferometry observations. J GeophysRes 109:B03405. doi:10.1029/2003JB002500
Ray J, Dong D, Altamimi Z (2004) IGS reference frames: statusand future improvements. GPS Solut 8(4):251–266. doi:10.1007/s10291-004-0110-x
Rothacher M (2002) Estimation of station heights with GPS. In: Dre-wes H, Dodson A, Fortes L, Sanchez L, Sandoval P (eds) Verticalreference systems. Springer, International Association of GeodesySymposia, vol 124, pp 81–90, ISBN: 3-540-43011-3
Rothacher M, Springer T, Schaer S, Beutler G (1998) Processing strat-egies for regional GPS networks. In: Brunner F (ed) Advances inpositioning and reference frames. Springer, International Associ-ation of Geodesy Symposia, vol 118, pp 93–100, ISBN: 3-540-64604-3
Saastamoinen J (1973) Contributions to the theory of atmosphericrefraction. Bull Geod 107:13–34. doi:10.1007/BF02522083
Snajdrova K, Boehm J, Willis P, Haas R, Schuh H (2005) Multi-tech-nique comparison of tropospheric zenith delays derived duringthe CONT02 campaign. J Geod 79(10–11):613–623. doi:10.1007/s00190-005-0010-z
Steigenberger P, Rothacher M, Dietrich R, Fritsche M, Rülke A, VeyS (2006) Reprocessing of a global GPS network. J Geophys Res111:B05402. doi:10.1029/2005JB003747
Steigenberger P, Tesmer V, Krügel M, Thaller D, Schmid R, Vey S, Roth-acher M (2007) Comparisons of homogeneously reprocessed GPS
and VLBI long time-series of troposphere zenith delays and gradi-ents. J Geod 81(6–8):503–514. doi:10.1007/s00190-006-0124-y
Steigenberger P, Rothacher M, Fritsche M, Rülke A, Dietrich R (2009a)Quality of reprocessed GPS satellite orbits. J Geod 83(3–4):241–248. doi:10.1007/s00190-008-0228-7
Steigenberger P, Tesmer V, Schmid R, Rothacher M, Rülke A, Frit-sche M, Dietrich R (2009b) Effects of different antenna phasecenter models on GPS-derived reference frame. In: Drewes H (ed)GRF2006—geodetic reference frames. Springer (accepted)
Tesmer V, Boehm J, Heinkelmann R, Schuh H (2006) Impact of analysisoptions on the TRF, CRF and position time series estimated fromVLBI. In: Behrend D, Baver K (eds) International VLBI servicefor geodesy and astrometry 2006 general meeting proceedings,NASA/CP-2006-214140, NASA, Greenbelt, pp 243–251
Tesmer V, Boehm J, Heinkelmann R, Schuh H (2007) Effect of differ-ent tropospheric mapping functions on the TRF, CRF and posi-tion time-series estimated from VLBI. J Geod 81(6–8):409–421.doi:10.1007/s00190-006-0126-9
Tesmer V, Boehm J, Meisel B, Rothacher M, Steigenberger P(2008) Atmospheric loading coefficients determined from homo-geneously reprocessed GPS and VLBI height time series. In: Fin-kelstein A, Behrend D (eds) Measuring the future, proceedings ofthe fifth IVS general meeting, pp 307–313
Tregoning P, Herring TA (2006) Impact of a priori zenith hydro-static delay errors on GPS estimates of station heights andzenith total delays. Geophys Res Lett 33(L23303). doi:10.1029/2006GL027706
Vey S, Dietrich R, Fritsche M, Rülke A, Rothacher M, Steigenberger P(2006) Influence of mapping function parameters on global GPSnetwork analyses: comparisons between NMF and IMF. GeophysRes Lett 33:L01814. doi:10.1029/2005GL024361
Zumberge JF, Heflin MB, Jefferson DC, Watkins MM, Webb FH (1997)Precise point positioning for the efficient and robust analysis ofGPS data from large networks. J Geophys Res 102(B3):5005–5017. doi:10.1029/96JB03860
123